

Summary
Global DNA demethylation in humans is a fundamental process that occurs in pre-implantation embryos and reversion to naïve ground state pluripotent stem cells (PSCs). However the extent of DNA methylation reprogramming in human germline cells is unknown. Here we performed whole-genome bisulfite sequencing (WGBS) and RNA-sequencing (RNA-Seq) of human prenatal germline cells from 53–137 days of development. We discovered that the transcriptome and methylome of human germline is distinct from both human PSCs and the inner cell mass (ICM) of human blastocysts. Using this resource to monitor the outcome of global DNA demethylation with reversion of primed PSCs to the naïve ground state, we uncovered hotspots of ultralow methylation at transposons that are protected from demethylation in the germline and ICM. Taken together the human germline serves as a valuable in vivo tool for monitoring the epigenome of cells that have emerged from a global DNA demethylation event.
Introduction
Genome-wide DNA demethylation is essential in the pre-implantation embryo and in the prenatal germline to prevent the heritable transmission of abnormal cytosine methylation (epialleles) from parent to child (Heard and Martiensenn, 2014). In the pre-implantation embryo, this involves removal of the cytosine methylation acquired in the parental gametes prior to fertilization. In the prenatal germline this involves removing cytosine methylation in primitive germline cells called primordial germ cells (PGCs), the precursors of eggs and sperm. The dynamics of DNA demethylation during these two periods has been extensively studied in the mouse, with DNA demethylation reaching the lowest point during PGC development at embryonic day 13.5 (E13.5) of mouse gestation. At this time point, less than 10% of cytosines in a CpG sequence context remain methylated in genomic DNA (Seisenberger et al., 2012; Kobayashi et al., 2013; Wang et al., 2014b). Therefore, E13.5 of mouse PGC development is often referred to as the germline epigenetic ground state (Hajkova, 2011).
In vitro, DNA demethylation occurs when primed human embryonic stem cells (hESCs) and serum grown mouse ESCs are reset to the naïve ground state (Habibi et al., 2013; Ficz et al., 2013; Takashima et al., 2014). In humans, converting primed hESCs to the naïve ground state causes more than a 50% reduction in CpG methylation, together with the removal of non-CpG methylation (Takashima et al., 2014). It is unknown whether loss of CpG methylation in naïve ground state of human pluripotent stem cells resembles the hypomethylated state of the human inner cell mass (ICM), or possibly the methylation of human germline cells.
In humans, cytosine demethylation in pre-implantation embryos shares tremendous similarity with mouse embryos of the equivalent stage (Smith et al., 2014; Guo et al., 2014). However, a distinction between the two species occurs at transposons, and in particular the Long Interspersed Nuclear Element (LINE) subfamilies where sequence differs substantially between the two species (Smith et al., 2014; Guo et al., 2014). Even though pre-implantation embryos are considerably hypomethylated relative to the gametes from which they originate, there remains significant CpG methylation in the ICM of both species, leading to the hypothesis that similar to the mouse, the bulk of DNA demethylation during development in vivo occurs in the germline.
In humans, there is limited information on the dynamics of DNA demethylation in the germline during prenatal life, except for immunofluorescence studies revealing that the germline is globally hypomethylated from at least 42 days post fertilization (Gkountela et al., 2013). To determine whether the human germline undergoes more extensive DNA demethylation than the ICM, and to evaluate whether naïve hESCs resemble the demethylation observed in human germline we performed whole genome bisulfite sequencing (WGBS) of the human prenatal germline genome to create a comprehensive single-base resolution map of DNA demethylation dynamics of human prenatal germline cells. This resource is critical not only for understanding the resetting of epialleles prior to birth in vivo, but also for measuring genome-wide DNA methylation reprogramming in in vitro systems such as the generation of hESCs in the naïve ground state.
Results
We began by establishing transcriptional landmarks of human prenatal germline development using RNA-Seq of purified germ cells from n=9 ovaries and n=6 testes from 53 to 137 days of life post fertilization. Human germline cells were isolated from individual ovaries and testes using Fluorescence Activated Cell Sorting (FACS) for the surface receptor cKIT (Figure S1A). No pooling of samples was performed for this study. We have previously shown that germline cells sorted using this strategy are 100% pure by single cell reverse transcriptase PCR (RT-PCR) (Gkountela et al., 2013). Here, we confirmed the purity of human germline samples using an expanded panel of germ cell-expressed genes on single cells, including SOX17 which was positive in every BLIMP1, NANOS3 double positive cell (Figure S1B).
RNA-Seq of fifteen human prenatal germline samples yielded 633 million trimmed 50bp reads, with almost 500 million reads uniquely mapped to the human genome (Table S1). RNA-Seq was also performed on equivalent numbers of TRA-1-81 sorted primed human embryonic stem cells (hESCs) called UCLA1 (n=2) and H1 (n=2). Using unsupervised hierarchical clustering as well as principle component analysis (PCA) we discovered that all human cKIT-positive germline cells clustered separately from TRA-1-81 positive hESCs (Figure 1A, Figure 1B and Chart S1). We note that one female sample (67 days) clustered with the male cKIT sorted germline cells in unsupervised hierarchical clustering (Figure 1A), yet clustered together with the younger germline group composed of male and female germline cells in PCA (Figure 1B). Similarly, we also found that the 74-day male germline cells clustered with the older male germline group in unsupervised hierarchical clustering, but with the younger group in PCA. Therefore we speculate that at around 67 days in females and 74 days males the germline cells are transitioning between the younger and older stages. Given the distinct clustering in PC2 (Figure 1B), we will refer to the germline cells in the top quadrant as primordial germ cells (PGCs), and the germline cells in the bottom quadrant as male or female advanced germline cells (AGCs).
Figure 1. Human germ cells are distinct from hESCs.

(A) Unsupervised hierarchical clustering of hESCs and cKIT expressing germline cells isolated from human prenatal testes (blue) or ovaries (pink). Day (d) of prenatal development post fertilization is shown. (B) Principal component analysis. Each dot represents a sample. Blue = male, pink = female germline cells, green = hESCs. Germline samples separate into three clusters in PC2 including primordial germ cells (PGCs) and Advanced Germline Cells (AGCs), which are either male or female. (C) Weighted gene co-expression network analysis of hESC, PGC and AGC samples showing a hierarchical cluster tree of co-expression modules. Each module corresponds to a branch labeled by a distinct color shown underneath. (D) Heatmap showing relative expression of 6,583 genes in 4 representative modules across all samples. For each developmental window only the most highly correlated modules are shown with assigned biological names: hESCs (module 1), PGCs (module 16), Male AGCs (module 24) and Female AGCs (module 2). Representative gene ontology terms enriched in the highest correlated module are shown below, as well as representative hESC and germ cell-related genes found in the statistically significant modules for that group. The specific module is shown in parenthesis. See also Figure S1.
In order to understand the relationships between PGCs and male and female AGCs we performed a Weighted Gene Co-Expression Network analysis (WGCNA) (Langfelder and Horvath, 2008). This is an unbiased, unsupervised analysis that identifies co-expression modules corresponding to clusters of co-expressed transcripts in each group. We identified thirty-nine modules of co-expressed transcripts with eleven modules significant to PGCs, five modules significant to male AGCs, and fourteen modules significant to female AGCs (Figure 1C–D, Figure S1C and Chart S1). In the PGC-specific modules we identified RNAs associated with embryonic lineage development including SOX17, the newest transcription factor implicated in human PGC specification (Irie et al., 2014), as well as other embryonic transcription factors such as SRY-box-12 (SOX12), Kruppel-like factor 6 (KLF6), and lymphoid enhancer binding factor 1 (LEF1). In the AGC-specific modules we identified meiotic genes such as synaptonemal protein complex 2 (SYCP2), SYCP3, Stimulated by retinoic acid 8 (STRA8) and DMC1 in female AGCs. In male AGCs, the significantly enriched modules included genes such as NANOS2, NANOG, CD38, NANOS3, PRDM1 and a variety of cancer/testis antigens (Figure 1D). We performed a pair-wise comparison of RNA expression between PGCs and AGCs and found a significant enrichment in genes associated with reproductive processes and genome defense in AGCs relative to PGCs (Figure S1D–E,G). We also discovered RNAs associated with meiosis and ovarian folliculogenesis that were specific to female AGCs (Figure S1F). A surprise was the expression of XIST in a module significant to PGCs and not female AGCs. The RNA-Seq analysis confirmed that XIST RNA was present in both male and female PGCs as well as male and female AGCs (Figure S1H). These results demonstrate that in the germline XIST expression is not restricted to females.
Given that the PGC-specific modules identified enrichment of genes involved in embryo development genes rather than a typical “reproductive genes”, we hypothesized that human PGCs may resemble an “indifferent” cell type, such as ICM cells or naïve ground state hESCs, with the reproductive program becoming dominant after the progression to AGCs. To investigate this, we performed PCA comparing TRA-1-81 sorted primed hESCs (H1 and UCLA1), H9 primed and H9 naïve ground state hESCs (Takashima et al., 2014), and ICM cells isolated from human blastocysts (Yan et al., 2013). We discovered that human germline cells clustered as a single group, distinct from ICM cells, as well as hESCs in either the primed or the naïve ground state (Figure S1I). Given the unique transcriptional identity of human germline cells, and the discovery that the human germline can be developmentally grouped into distinct clusters of either PGCs or AGCs, we next quantified DNA methylation in the human germline using these developmental landmarks as guides.
Next we quantified DNA methylation in the human germline using Whole Genome Bisulfite Sequencing (WGBS) from n=4 pairs of ovaries and n=2 pairs of testes. All analyses were performed on cytosines with ≥3 reads per cytosine (Table S2). Three libraries corresponded to the PGC stage, 57 days (female), 59 days (male) and 67 days (female), and three libraries corresponded to the AGC stage, 113 days (n=2 females) and 137 days (male). The bisulfite conversion efficiency estimated from Lambda DNA spike-in was: CG= 99.4%; CHG = 98.3%; CHH = 99.2%. We also compared our human prenatal germline data to previously published WGBS data sets of H1, H9 and HSF1 hESCs (Laurent et al., 2010; Lister et al., 2011; Chen et al., 2011), human ICM and human embryonic liver (Guo et al., 2014), as well naïve ground state hESCs (called H9 naïve) and the parental H9 hESC line used for reversion (called H9 primed) (Takashima et al., 2014).
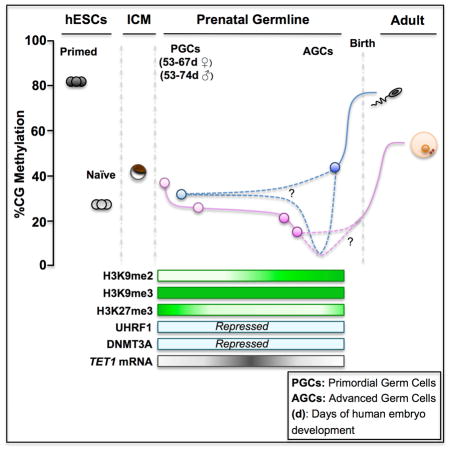
The average percent of CpG methylation estimated from our libraries revealed that the human prenatal germline contains the lowest genome-wide average for CpG methylation reported in a human genome to date, with the 113 day female AGCs containing an average of 16.7% CpG methylation. The naïve ground state hESCs were higher at 29.2% and the ICM was 40.03% (Figure 2A). In 137 day male AGCs, the average CpG methylation was quantified as being 41.5% where as the average CpG methylation in the 59 day male PGCs was 30.7% indicating that between 59 and 137 days of development in males the genome initiates de novo methylation. An overview of the bulk CpG methylation level for all samples is available in Figure S2A.
Figure 2. Female AGCs represent the most demethylated genomic state.

(A) Average CpG methylation in human inner cell mass (ICM), hESCs, PGCs, AGCs and embryonic liver (Em. Liver). Age of male (M) and female (F) germline samples in days (d) postfertilization is shown. (B) Distribution of cytosine methylation in ICM and AGCs, H9 primed and H9 naïve hESCs. The x axis represents methylation levels binned in ten increments of 10% (ie 0–10%, 10–20% etc). y axis is fraction of total CG/CHG/CHH. (C) Average genome wide levels of CpG methylation across all chromosomes in 1Mb windows. PGCs = merged reads from 57- and 67-day germline cells, and AGCs = merged reads from 113-day germline cells, H9 primed and H9 naive = merged reads from 3 biological replicates. (D) Metaplot of CpG methylation at reference genes. TSS, transcription start site; TES, transcription end site. (E) Metaplot of CpG methylation at CpG Islands (CGI). (F) Correlation between CpG density and methylation for H1 hESCs; PGCs (merged) AGCs (merged). PGCs (Primordial Germ Cells), AGCs (Advanced Germ Cells), Em. (Embryonic), ICM (Inner Cell Mass). See also Figure S2.
Next we evaluated the distribution of DNA methylation at individual cytosines by plotting cytosine methylation in 10% increments as a fraction of total methylation from 0–1 (0–100%) (Figures 2B and S2B–C). In the ICM (Figure 2B), PGCs, embryonic liver and male AGCs (Figure S2B–C), the distribution of CpG methylation is bimodal, whereas in the most demethylated 113-day female germline sample, the majority of CpGs (>0.6) are hypomethylated (0–20% methylation) (Figure 2B). Similarly with reversion of H9 primed hESCs to the naïve ground state, a large fraction of cytosines also become hypomethylated, however an equally large fraction of cytosines exhibit intermediate levels of DNA methylation (21–79%) (Figure 2B). Given that the female germline cells were progressively demethylating from 57 to 113 days of development whereas the male germline cells have initiated de novo methylation, we focused on the female germline cells for the reminder of the study.
By merging reads from the two female PGC libraries, and the two female AGC libraries to increase depth, we plotted CpG methylation across entire genome, and discovered that methylation is globally lost along entire chromosomes in PGCs, and this is further reduced in AGCs. In this analysis, we discovered that naïve hESCs resemble the genome-wide level of PGCs, but not the ICM (Figure 2C). The metagene plot of CpG methylation revealed a drop of CpG methylation around transcription start sites (TSSs) in all samples (Figure 2D). With AGCs averaging the lowest level of CpG methylation in the gene body and upstream and downstream regions, followed by PGCs and naïve hESCs (Figure 2D). In all three cases (AGCs, PGCs and naïve hESCs), CpG methylation at reference genes was lower than the ICM (Figure 2D). The metaplot of CpG islands (CGIs) revealed low levels of methylation in all cell types, however both PGCs and AGCs show extremely low methylation compared to ICM and naïve hESCs (Figure 2E). Given that CpG methylation is severely depleted at CGIs in the germline, we plotted percent CpG methylation relative to CpG density and discovered that cytosines with >80% CpG methylation in PGCs and AGCs are generally located in regions of low CpG density (Figure 2F).
In order to evaluate CpG methylation reprogramming in vivo we generated box plots of cytosine methylation in 5kb windows and evaluated the fate of hypermethylated (≥80%) and hypomethylated (≤20%) windows common to ICM and germline cells (Figures 3A and 3B). We also evaluated these same parameters in primed hESCs and embryonic liver where DNA methylation levels are consistently high (Figures S3A and S3B). The purpose of this analysis was to determine whether highly methylated cytosines in ICM are erased in the germline and vice versa. In general our results show that hypermethylated windows in the ICM (n= 8, 850) are hypomethylated in PGCs and AGCs. Conversely hypermethylated windows in PGCs and AGCs (n=21) generally retain some methylation in the ICM (Figure 3A). Analysis of hypomethylated windows in ICM and germline cells reveals similar low methylation levels in both cell types (Figure 3B). This is in contrast to hESCs and embryonic liver, which on average maintained highly methylated cytosines at these windows. Taken together, this data demonstrates that the most hypermethylated windows of the ICM exhibit demethylation in the germline, whereas hypermethylated germline windows are only partially demethylated in the ICM. Therefore methylation reprogramming in vivo involves greater reliance on the germline.
Figure 3. Methylation reprogramming in vivo is dynamic in human and mouse.

(A) Box plots showing fate of highly methylated CpGs (≥80% CpG methylation) in ICM (left panel) and germline cells (right panel). For ICM n = 8,850 hypermethylated windows of 5kb were identified. For PGC and AGC we identified n=21 hypermethylated 5kb windows. (B) Box plots showing hypomethylated windows (<20% CpG methylation) in ICM (left panel) and germline cells (right panel). For ICM n= 64,787 windows and for germline cells n=95,479 5kb-windows were identified. (C) Heatmaps showing methylation variable regions in 5kb windows with >80% methylation difference in ICM (n=9,072, FDR = 2.28%) relative to other samples. (D) Heat map of differentially methylated regions between PGCs and AGCs using 200bp windows (n= 1,049,420) with 3,456 regions (FDR <0.001%) identified (0.33% of the total number of windows). (E) Enrichment analysis of hypomethylated DMRs and (F) hypermethylated DMRs at indicated genomic features. Enrichment is accepted if fold enrichment is ≥1.0. DMRs and CGI-containing DMRs (DMR-CGI) are shown. * p <0.05, ** p<0.01. (G) Correlation of hypo- (left panel) and hyper-methylated (right panel) DMRs with differentially expressed (DE) genes reveals limited to no overlap. (H) Heatmaps showing methylation variable regions in 5kb windows with >80% methylation difference in E6.5 mouse epiblast (n = 499,541, FDR = 0.1 %). Female (F). (I) Identification of genomic features with persistent methylation (≥50% CpG methylation in 200 bp windows with >6 CpG sites per window). n= 67,817 windows meeting this criteria were in common between data sets resulting in the identification of n=1,471 persistently methylated windows (2.17%). For (C,D,H) Darker color indicates higher CpG methylation, white indicates absence of CpG methylation. FDR, false discovery rate estimated from simulated methylomes (see Methods). See also Figure S3.
In order to identify regions of variable methylation in ICM, PGCs and AGCs we evaluated methylation in 5kb windows common to the data sets shown (n= 565,299) (Figure 3C and Figure S3C). As expected, we discovered that most methylation variable regions in ICM, PGCs and AGCs were hypomethylated relative to embryonic liver and primed hESCs. However, we also identified variable regions that were more methylated in AGCs than in PGCs (Figure S3C). To probe this further, we calculated statistically significant (p<0.05) DMRs with a >80% methylation difference in 200 bp windows (n=1,049,420 windows analyzed total). This analysis yielded 3,445 DMRs between PGCs and AGCs, with a false discovery rate of <0.001% (Figure 3D). We discovered that 3,255 DMRs lose methylation (94.5%) and 190 DMRs (5.5%) gain methylation in AGCs relative to PGCs. The hypomethylated DMRs were associated with 1,899 genes, and the hypermethylated DMRs were associated with 118 genes (Chart S1). Analysis of intragenic genomic features containing hypo-and hypermethylated DMRs revealed particular enrichment at DMR-containing CGIs located within exons, splice sites, promoters and 3′UTRs (Figures 3E and 3F). We also evaluated cytosine methylation at imprinting control centers (ICCs) for two paternally methylated imprinted genes, H19 and MEG3, and two maternally methylated imprinted genes, PEG3 and KCNQ1 (Figure 3SD). Our results show that consistent with previous data (Gkountela et al., 2013), there is an almost complete loss of cytosine methylation at ICCs in AGCs relative to PGCs.
In order to determine whether DMRs between PGCs and AGCs correlated with changes in gene expression we compared the RNA-Seq of female germline cells at the equivalent ages to the germline cells used for WGBS (Figure 3G). This comparison revealed twelve DMR-associated genes that were also differentially expressed. All twelve genes were hypomethylated in AGCs relative to PGCs, and 2/12 were associated with meiosis (TEX14 and SYCE2). Taken together, our data reveals a remarkable and pervasive loss of DNA methylation in human PGCs and AGCs during prenatal life that has almost no relationship to changes in gene expression. Our results unexpectedly show that the female germline undergoes locus-specific changes in intragenic DNA methylation at exons, splice sites and promoters as well as small amounts of de novo methylation in the background of a demethylated genome.
Given these dynamic changes in the human germline, we also re-examined CpG methylation in the mouse germline (Seisenberger et al., 2012). We remapped the data set to the mm9 mouse genome, with all analyses performed on cytosines with ≥3 reads per cytosine (Table S3). Similar to the human study, we mapped methylation 5kb windows common to the data set shown (n= 499,541), and identified variably methylated regions (Figure 3H). We found that the female mouse germline also undergoes modest gains in cytosine methylation, particularly between E13.5 and E16.5 (Figure 3H), which can be quantified as an increase from 4.68% at E13.5 to 9.13% at E16.5 (Figure S3E). The hypo-and hyper-methylated DMRs between female germline cells at E13.5 and E16.5 revealed particular enrichment at CGI-containing DMRs in exons, splice sites, promoters and 3′UTRs (Figure S3G). These are the same intragenic regions exhibiting DMRs in the human germline between PGCs and AGCs.
Given that the human germline does not demethylate by 113 days of life to the epigenetic ground state levels quantified for the mouse genome at E13.5, we hypothesized that some regions of the genome are resistant to demethylation, therefore persisting in the globally demethylated genome. To identify these sites, we evaluated common 200bp windows in ICM, PGCs and AGCs containing at least 6 CpG sites (n=67,817 windows). Using a cutoff of ≥50% average CpG methylation in each 200bp window, we identified 1,471 persistently methylated regions in all three samples (Figure 3I). Analysis of genomic features containing persistent methylation identified enrichment particularly at exons. CGI-containing persistent regions exhibited a further enrichment at exons, as well as in 3′UTRs, promoters and splice sites (Figure 3I). To identify genes associated with persistently methylated regions we used the Genomic Regions Enrichment of Annotations Tool (GREAT) (McLean et al., 2010). We restricted our analysis to the identification of genes with persistent methylation within gene bodies or ±5kb of the TSS. This uncovered 585 genes (Chart S1). These genes are not necessarily repressed in PGCs and represent diverse mechanisms including chromatin remodeling (SETDB1, SETD1A, UHRF1, Chromodomain helicase 6 (CHD6)), cell adhesion (CDH4, CDH12) and map kinase signaling (MAPK8, MAPK10).
In the mouse germline, persistently methylated regions are associated with murine-specific endogenous retroviruses (ERV) known as Intracisternal particle A (IAP) (Rebollo et al., 2012). IAP sequences do not exist in the human genome, therefore we evaluated DNA demethylation at ERVs, as well as long interspersed nuclear elements (LINEs). For this analysis we evaluated methylation in the human germline cells as well as hESCs (naïve and primed), ICM and embryonic liver. Our results show that demethylation of all transposons as an aggregate follows the trend for the genome-average (Figure 4A). Some specific examples include HERVK, HERV1, HERVL, LINE 2 (L2), L3 and L4 (Figure S4A–C). However we were able to identify unique methylation differences between ICM, germline cells and naïve hESCs when the repetitive elements were classified into subfamilies. For example HERVK9-Int and HERVK11-Int subfamilies showed persistent methylation in ICM, PGCs and AGCs and pronounced demethylation in the H9 naïve cells (Figure 4B). Additional transposons that showed pronounced demethylation in the H9 naïve hESCs relative to ICM and germline cells are the L1 class of transposons (Figure 4C). For example, we found relatively high DNA methylation levels across the transposon body of young L1 Homo sapiens specific (LIHS), as well as the immediate descendants LIPA2 and L1PA3 in ICM and in germline cells. However, in the H9 naïve cells, CpG methylation was the lowest of all cell types with a pronounced hypomethylated valley at the 5′end of L1HS and L1PA2. The hypomethylated valley was almost completely resolved by the next descendant L1PA3, yet even by L1PA8, the H9 naïve hESCs still have the lowest levels of methylation at this transposon subclass relative to the other cell types. This suggests that reversion of H9 hESCs to the naïve state leads to efficient targeting (or failed protection) of this transposon family for demethylation (Figure 4C).
Figure 4. Demethylation of transposable elements in naïve hESCs in vitro is less retained than germline cells and ICM.

(A) Metaplot of all transposons irrespective of type exhibit DNA demethylation similar to the genome average. (B) Metaplots of CpG methylation across HERVK9-int and HERK11-int retrotransposons, showing that contrary to the average for the HERVK class, CpG methylation in PGCs and AGCs are comparable to ICM with H9 naïve cells exhibiting the lowest levels of CpG methylation. (C) Metaplots of CpG methylation for L1HS, L1PA2, L1P3 and L1PA8. Naïve hESCs exhibit the lowest levels of CpG methylation at this subfamily (area within the dashed grey line). This is particularly dramatic at the younger elements such as the Homo sapiens specific L1HS and the closely related L1PA2. (D) Box plots showing average RNA expression of transposons in PGCs, AGCs, ICM, H9 naïve and H9 primed hESCs as indicated. Average transposon expression is less than 1.0 FPKM. (E) Box plots showing CpG methylation of all transposons, HERVK, L1HS and L1PA elements in PGCs, AGCs, ICM, H9 naïve and H9 primed hESCs. See also Figure S4.
Despite these dynamic changes in DNA methylation at specific transposon subclasses, the median expression of all transposons is low (FPKM less than 1.0), and in most cases the highest expressing transposons of each subclass (the transposons in the upper quartiles of expression) are reduced between PGCs and AGCs (as shown for HERVK), and similarly are reduced between primed and naïve hESCs (as shown for HERVK, L1HS and L1PA) (Figure 4D). Previous studies revealed that increased HERVH expression is associated with the naïve state (Wang et al., 2014b), and consistent with this, we find that the upper quartiles of HERVH expression are greater in the naïve hESCs relative to the primed state (Figure S4D). A similar example in the germline is the expression of L1HS where both the median and upper quartiles of L1HS expression are higher in AGCs relative to PGCs (Figure 4D). Although L1HS tends to be hypermethylated in the germline relative to the genome average for PGCs and AGCs (Figure 4C), the median CpG methylation for L1HS is lower in AGCs relative to PGCs (Figure 4E). Similarly for HERVH, CpG methylation at this transposon subclass is reduced in naïve hESCs relative to primed consistent with the increase in expression (Figure S4D). However these examples, although important appear to be exceptions to the rule, as the majority of transposons exhibited no change or lower expression in the more demethylated cell types (Figure 4E).
Given the highly demethylated state in human germline cells from 57–113 days of development, we examined the RNA-Seq data set for clues to the mechanisms that may maintain DNA hypomethylation in the germline. We found that RNAs encoding DNA methyltransferase 1 (DNMT1), its co-factor UHRF1 and the de novo methyltransferases DNMT3A, DNMT3B and DNMT3L are all expressed in human germline cells (Figure 5A). This is different to the mouse germline where Uhrf1, Dnmt3a and Dnmt3b RNAs are repressed (Kurimoto et al., 2008). Using immunofluorescence, we discovered that despite detectable levels of RNAs, the UHRF1 and DNMT3A proteins are below the limit of detection in the majority of germline cells of both sexes, whereas hESCs express both proteins (Figures 5B–G and 5I). This indicates that the maintenance and de novo methylation machinery are largely disabled in the human germline. Furthermore, we discovered that TET CYTOSINE DIOXYGENASE 1 (TET1), TET2 and TET3 are all expressed by human germline cells, with TET1 RNA increasing as male and female PGCs progress to AGCs (Figure 5H).
Figure 5. Protein expression of UHRF1 and DNMT3A in human germline.

(A) Heatmap showing normalized expression of indicated genes in PGCs, AGCs and hESCs, H9 primed, H9 naïve and ICM. M=male, F=Female (B,C,F,G,I). Note that DNMT3L is enriched in the H9 naïve cells relative to the rest of the data sets where as SOX2 and UHRF1 are enriched in H9 primed cells. Representative immunofluorescence micrographs of UHRF1 (B,C,I), and DNMT3A (F,G,I) with germline markers cKIT or VASA in prenatal testes (B,F) and ovaries (C,G) at the developmental stage indicated in days and with pluripotency marker OCT4 in UCLA1 hESCs (I). Arrows indicate UHRF1 or DNMT3A signal. (D,E) Quantification of UHRF1 in cKIT+ or VASA+ germ cells in testes (D) and ovaries (E), at the developmental ages indicated days (d). (D) In testes for quantification in cKIT+, 14 optic fields were counted at the PGC stage from n=4 testes. For the AGC stage, 23 optic fields were counted from n=3 testes at 87–95 days and 28 optic fields from n=4 testes at 105–119 days of development. For quantification in VASA+, 12 optic fields were counted at the PGC stage from n=4 testes. For the AGC stage, 22 optic fields were counted from n=3 testes at 87–95 days and 25 optic fields from n=4 testes were counted at 105–119 days of development. e, In ovaries for quantification in cKIT+, 14 optic fields were counted at the PGC stage from n=3 ovaries. For the AGC stage, 13 optic fields were counted from n=3 ovaries at 70–95 days, 9 optic fields from n=3 ovaries at 105–116 days and 8 optic fields from n=2 ovaries at 126–130 days of development. For quantification in VASA+, 13 optic fields were counted at the PGC stage from n=3 ovaries. For the AGC stage, 15 optic fields were counted from n=3 ovaries at 70–95 days, 8 optic fields from n=3 ovaries at 105–116 days and 8 optic fields from n=2 ovaries at 126–130 days of development. For immunofluorescence microscopy, nuclei were counterstained with DAPI (blue). Scale bars, 10 um. Data are represented as mean±sem. Days (d), neg (negative). (H) Expression levels of TET1-3 in prenatal testes and ovaries from 53 days to 137 days (n= number of samples at each developmental stage). Also see Figure S5.
In mouse germline cells, loss of DNA methylation is accompanied by a global loss of Histone H3 lysine 9 dimethylation (H3K9me2) (Hajkova et al., 2008). The RNA-Seq analysis revealed that the enzymes responsible for H3K9me2 and H3K9me3 (EHMT2 and SETDB1, SUV39H1 and SUV39H2) are all expressed in PGCs and AGCs (Figure 5A). However, using immunofluorescence we discovered that H3K9me2 is depleted from PGCs, and is subsequently found in AGCs in a punctate pattern. In contrast, H3K9me3 is localized in a punctate pattern in the human germline at all stages of development (Figures S5B–5E). Global loss of DNA methylation and H3K9me2 in mouse PGCs occurs downstream of Prdm14 (Yamaji et al., 2008). Using Immunofluorescence we found that PRDM14 protein is localized to the nucleus of human PGCs (Figure S5A), although the RNA levels of PRDM14 are very low compared to undifferentiated hESCs (Figure 5A). Taken together, the human germline at 57 days of development is extremely demethylated, has disabled its DNA methylation machinery and has increased expression of TET1. Furthermore, we show that H3K9me3 is a stable silencing mark that can be identified in the germline at all stages of development.
Discussion
The human germline and pre-implantation embryos are excellent in vivo models for quantifying both global and local sites of DNA demethylation and identifying loci that escape demethylation during nuclear reprogramming (Guo et al., 2014; Smith et al., 2014). In the human germline, global demethylation leads to a dramatic loss of almost all CGI methylation, consistent with the finding that persistently methylated cytosines tend to occur in regions of low CpG density, making WGBS a critical approach for identifying these sites. Furthermore, loss of CpG methylation in general does not correlate with gene expression changes in the germline. Instead, the RNA-Seq reference map suggests that a common germline program distinguishes germline cells from other closely related demethylated cell types such as the ICM and naïve hESCs, which is independent of the methylated state.
Recently it was found that SOX17 is required for human PGC specification (Irie et al., 2015). We also show that human germline cells are enriched in SOX17 in the PGCs stage. However, based upon the expression of developmental transcription modules, we propose that PGC identity involves a relatively indifferent germline program that gives-way to the expression of the sex-specific germline program upon transition to the advanced germline state, between and 67–93 days in females and 74–98 days in males. Similar to the mouse, we show that activation of the mature germline program does not depend solely on DNA demethylation but rather relies on additional genome wide epigenetic reprogramming events. Recently we showed that loss of H3K27me3 (Gkountela et al., 2013) is one such major epigenetic event in the human germline that is temporally linked to the transcriptional transition of PGCs to AGCs reported in this study.
Based on our germline methylome analysis we propose that global hypomethylation as well as depletion of H3K9me2 during the PGC stage sets the epigenetic stage for germline sex-specific maturity, with loss of H3K27me3 allowing differentiation to the advanced stages. Notably XIST non coding RNA is expressed in both male and female germline at all stages, even before global loss of H3K27me3 from the nucleus, indicating that XIST may be non-silencing in the germline similar to what was reported for human blastomeres (Okamoto et al., 2011). Future work using Fluorescence in situ hybridization for X-linked genes together with single cell imaging will be required to confirm whether XIST is indeed expressed from both X chromosomes, and whether similar to mouse, human female PGCs begins with an inactive X that subsequently undergoes X reactivation.
In mice, PGCs are specified from brachyury positive cells emerging through the primitive streak (Aramaki et al., 2002). In contrast, sox17/SOX17 is considered a marker of definitive endoderm and hemogenic endothelium in the mouse and human (Choi et al., 2012; D’Amour et al., 2005; Nakajima-Takagi et al., 2013). This raises a critical question as to the germlayer origin of PGCs in humans. Our data supports the hypothesis that the human germline is not set-aside in the ICM of human blastocysts as the transcriptome and methylome of PGCs are distinct from ICM. Instead, our data shows that the transcriptome of germline cells (but not the methylome) is closer to primed hESCs relative to hESCs in the naïve state or ICM. Human ESCs do not exist in the embryo (they are in vitro cell types), therefore, the closer transcriptional relationship of germline cells to primed hESCs may be due to expression of RNAs involved in embryo development (Takashima et al., 2014). In future studies, our reference map of the human germline transcriptome can be used to uncover the transcriptional relationship between human PGCs and the earliest germ layers in order to address this question.
In the current study we used the RNA-Seq and WGBS data of naïve hESCs cultured in t2iL+Go (Takashima et al., 2014). However, there are multiple approaches for generating naïve hESCs beginning with the first report using naïve human stem cell media (NHSM) to the more recent media called 5i/L/FA (Gafni et al., 2013; Chan et al., 2013; Valamehr et al., 2014; Ware et al., 2014; Takashima et al., 2014; Theunissen et al., 2014). Principle component analysis of the published transcriptomes indicates that all approaches generate naïve cell types slightly different from each other, with 5iL/FA closest to t2iL+Go (Theunissen et al., 2014). We focused on the t2iL+Go naïve hESCs for our study because it was the only data set to include both WGBS and RNA-Seq on the same sequencing platform. Our results indicate that reversion to the naïve state in t2iL+Go creates an in vitro cell type that is more demethylated compared to the ICM it is hypothesized to represent. We found that a consistent occurrence in this media was the unbridled demethylaton at young L1 transposable elements LIHS and L1PA2. The more restrained demethylation at these features in ICM and germline suggests that the mechanisms either targeting or preventing demethylation at these discreet sites are different in vivo relative to reversion in vitro. Alternatively, the HERV expression pattern in the naïve hESCs and especially the elevated HERVH family levels could serve as a cellular identity marker in naïve hESCs, essential for safeguarding self-renewal (Wang et al., 2014a; Göke et al., 2015). In future studies it will be critical to determine whether the other naïve medias, or reversion of other cell types in the same media, acquire a similar demethylated state as H9 in t2iL+Go. We show that our reference map of human germline cells combined with the work in the human pre-implantation embryo will be critical for interpreting future reversion strategies to the naïve state.
Global demethylation at transposable elements in general does not lead to transcriptional activation raising an important question as to the mechanisms by which active transposons are silenced in the human germline during prenatal life, given the depletion of repressive chromatin marks such as H3K9me2 and H3K27me3 (Gkountela et al., 2013). The finding that L1HS transposons are highly methylated at all stages of germline development relative to the older and extinct L1PA ancestors could indicate that methylation is employed as a first line of defense by the germline for the transcriptional repression of L1HS. This is supported by the finding that a small decrease in methylation between PGCs and AGCs is associated with a median increase in L1HS expression in AGCs. One purpose for the maintained DNA methylation at young potentially active transposons could be to facilitate C-T mutations and transposon extinction. In support of this, extinct L1PA ancestors have progressively fewer CpG nucleotides as a result of C-T conversion than the younger active elements (Walser et al., 2008). Alternatively, active transposons that escape demethylation may impact silencing of surrounding genomic regions leading to positional effects in vivo. The primed to naïve reversion, and ultralow methylation at the 5′end of L1HS could be used as a tractable model to test this.
In the current study we did not distinguish between 5mC and 5hmC in the human germline genome. In the mouse germline, 5mC is rapidly oxidized to 5hmC in a very discreet window between E10.5 to E12.5 (Hackett et al., 2013), which is now referred to as phase II germline DNA demethylation (Reviewed by Lee et al., 2014; Vincent et al., 2012; Yamaguchi et., 2013). In contrast phase I DNA demethylation (which occurs from E7.5 to E9.5) removes around 50% of methylated CpGs from the genome using a Tet-independent mechanism (Vincent et al., 2012). Given that the human germline has already completed phase I DNA demethylation by 57 days of life (the equivalent of E9.5 in mice), we hypothesize that the removal of DNA methylation between 57 and 113 days also involves oxidation to 5hmC at discreet loci. Indeed in previous studies we could simultaneously identify both 5mC and 5hmC during DNA demethylation (Gkountela et al., 2013), indicating that conversion of 5mC to 5hmC is heterogeneous both at individual loci and also at individual cells within a gonad. Given that we continue to see DNA demethylation from 67 to 113 days our study suggests that phase II demethylation in human’s takes months (rather than days), and that re-methylation at discreet genomic features occurs before demethylation is complete. Notably, the small amount of re-methylation in female mouse germline cells between E13.5–E16.5 at intragenic CGI-containing DMRs is conserved in humans, but unlike mice, it temporally overlaps with the final stages of demethylation. Therefore given the protracted phase II demethylation in the human germline relative to the mouse, the analysis of 5hmC in future studies should involve analysis of 5hmC and 5mC in the same gonad or alternatively single cell 5hmC analysis within the one gonad when the technology becomes available.
Taken together the RNA-Seq and WGBS reference maps of the human germline described here provide a critical reference for in vivo DNA demethylation beyond the methylated state attained in the human blastocyst (Guo et al., 2014; Smith et al., 2014). Specifically we have identified methylated regions in the human germline that are targeted for deeper demethylation in H9 naïve hESCs, suggesting that these transposons should be carefully monitored in naïve hESC cultures with extended culture. We also discovered dynamic locus-specific maintenance and de novo DNA methylation in a background of extreme global genome demethylation, a phenomenon also reported in human embryos where a number of loci are seen to escape DNA demethylation (Smith et al., 2014). Thus global DNA demethylation is a complex process where global and local mechanisms work together to shape the epigenome.
Experimental Procedures
RNA-seq data analysis
Differential gene expression analysis was performed using the packages, DESeq (Anders and Huber, 2010) and edgeR (Robinson et al., 2010) in R (http://www.R-project.org). Raw read counts (GEO accession number GSE63392) were used and modeled based on a negative binomial distribution. We filtered out genes with RPKM <1 in both groups. The multiple testing errors were corrected by the false discovery rate (FDR). In addition to the FDR of < 0.05 we considered differentially expressed genes as having > 2-fold difference. Thus, in summary, we considered genes as differentially expressed if: 1) the FDR was less than 0.05; 2) the expression ratio between two time points was >2X; 3) the maximal RPKM value for at least one group in the comparison was >1; and 4) there was agreement between DESeq and edgeR. See also the Extended Experimental Procedures.
Weighted Gene Co-Expression Network analysis (WGCNA)
To understand which gene networks determine gene expression difference between cell populations at a systems level, we performed weighted gene co-expression network analysis (WGCNA) (Langfelder and Horvath, 2008). This unsupervised and unbiased analysis identified distinct co-expression modules by clustering transcripts with the similar expression pattern across samples. To further understand the cell population specificity of the modules, we correlated the identified module eigengenes with traits represented as the theoretical expression patterns for all cell populations in a binary fashion.
Genome wide DNA methylation profiles
The raw data have been deposited to GEO (accession number GSE63393). Bisulfite converted reads were aligned to the reference genome (hg19) using BS Seeker 2 (Guo et al., 2013). Genome-wide DNA methylation profiles were generated by determining methylation levels for each cytosine in the genome. Since bisulfite treatment converts unmethylated cytosines (Cs) to thymines (Ts) after PCR amplification, the methylation level at each cytosine was estimated as #C/(#C+#T), where #C is the number of methylated reads and #T is the number of unmethylated reads. The methylation level per cytosine serves as an estimate of the percentage of cells that have a methylated cytosine at a specific locus. We only included cytosines that are covered by at least three reads. The resulting methylation profiles from germ cells covered up to 77% of the cytosines genome wide (See Table S2).
Supplementary Material
Highlights.
Single base resolution methylome resource for human prenatal germline cells.
Comprehensive transcriptional resource for human prenatal germline cells.
Human germline is distinct from inner cell mass and naïve pluripotent stem cells.
Naïve human pluripotent stem cells have hotspots of unbridled DNA demethylation.
Acknowledgments
The authors would like to thank the UCLA BSCRC flow cytometry core for flow and FACS assistance and BSCRC High Throughput Sequencing core. This work was supported by grants from the NIH (NIH/NICHD HD058047 and NIH/NICHD HD079546) awarded to ATC. As well as the Eli and Edythe Broad Center of Regenerative Medicine and Stem Cell Research. We would also like to acknowledge the support of the California Institute for Regenerative Medicine (CIRM) Predoctoral training grant (TG2-01169) for funding JHC.
Footnotes
Author Contributions
SG performed experiments, data interpretation and wrote manuscript; KXZ performed RNA-Seq data analysis; TAS, performed immunofluorescence staining; WWL, performed WGBS data analysis; JHC, performed confocal microscopy; PYC, designed and performed the RNA-Seq, WGBS data analysis and interpretation and wrote manuscript; ATC, conceived experiments, performed data analysis and wrote the manuscript.
Publisher's Disclaimer: This is a PDF file of an unedited manuscript that has been accepted for publication. As a service to our customers we are providing this early version of the manuscript. The manuscript will undergo copyediting, typesetting, and review of the resulting proof before it is published in its final citable form. Please note that during the production process errors may be discovered which could affect the content, and all legal disclaimers that apply to the journal pertain.
References
- Anders S, Huber W. Differential expression analysis for sequence count data. Genome Biol. 2010;11:R106. doi: 10.1186/gb-2010-11-10-r106. [DOI] [PMC free article] [PubMed] [Google Scholar]
- Aramaki S, et al. A mesodermal factor, T, specifies mouse germ cell fate by directly activating germline determinants. Dev Cell. 2013;27:516–529. doi: 10.1016/j.devcel.2013.11.001. [DOI] [PubMed] [Google Scholar]
- Chan YS, Göke J, Ng JH, Lu X, Gonzales KA, Tan CP, Tng WQ, Hong ZZ, Lim YS, Ng HH. Induction of a human pluripotent state with distinct regulatory circuitry that resembles preimplantation epiblast. Cell Stem Cell. 2013;13:663–675. doi: 10.1016/j.stem.2013.11.015. [DOI] [PubMed] [Google Scholar]
- Chen PY, Feng S, Joo JW, Jacobsen SE, Pellegrini M. A comparative analysis of DNA methylation across human embryonic stem cell lines. Genome Biol. 2011;12:R62. doi: 10.1186/gb-2011-12-7-r62. [DOI] [PMC free article] [PubMed] [Google Scholar]
- Choi E, Kraus MR, Lemaire LA, Yoshimoto M, Vemula S, Potter LA, Manduchi E, Stoeckert CJ, Jr, Grapin-Botton A, Magnuson MA. Dual lineage-specific expression of Sox17 during mouse embryogenesis. Stem Cells. 2012;30:2297–2308. doi: 10.1002/stem.1192. [DOI] [PMC free article] [PubMed] [Google Scholar]
- D’Amour KA, Agulnick AD, Eliazer S, Kelly OG, Kroon E, Baetge EE. Efficient differentiation of human embryonic stem cells to definitive endoderm. Nat Biotechnol. 2005;23:1534–1541. doi: 10.1038/nbt1163. [DOI] [PubMed] [Google Scholar]
- Ficz G, et al. FGF signaling inhibition in ESCs drives rapid genome-wide demethylation to the epigenetic ground state of pluripotency. Cell Stem Cell. 2013;13:351–359. doi: 10.1016/j.stem.2013.06.004. [DOI] [PMC free article] [PubMed] [Google Scholar]
- Gafni O, et al. Derivation of novel human ground state naive pluripotent stem cells. Nature. 2013;504:282–286. doi: 10.1038/nature12745. [DOI] [PubMed] [Google Scholar]
- Gkountela S, Li Z, Vincent JJ, Zhang KX, Chen A, Pellegrini M, Clark AT. The ontogeny of cKIT+ human primordial germ cells proves to be a resource for human germ line reprogramming, imprint erasure and in vitro differentiation. Nat Cell Biol. 2013;15:113–122. doi: 10.1038/ncb2638. [DOI] [PMC free article] [PubMed] [Google Scholar]
- Göke J, Lu X, Chan YS, Ng HH, Ly LH, Sachs F, Szczerbinska I. Dynamic transcription of distinct classes of endogenous retroviral elements marks specific populations of early human embryonic cells. Cell Stem Cell. 2015;16:135–141. doi: 10.1016/j.stem.2015.01.005. [DOI] [PubMed] [Google Scholar]
- Guo H, et al. The DNA methylation landscape of human early embryos. Nature. 2014;511:606–610. doi: 10.1038/nature13544. [DOI] [PubMed] [Google Scholar]
- Guo W, Fiziev P, Yan W, Cokus S, Sun X, Zhang MQ, Chen PY, Pellegrini M. BS-Seeker2: a versatile aligning pipeline for bisulfite sequencing data. BMC Genomics. 2003;14:774. doi: 10.1186/1471-2164-14-774. [DOI] [PMC free article] [PubMed] [Google Scholar]
- Habibi E, Brinkman AB, Arand J, Kroeze LI, Kerstens HH, Matarese F, Lepikhov K, Gut M, Brun-Heath I, Hubner NC. Whole-genome bisulfite sequencing of two distinct interconvertible DNA methylomes of mouse embryonic stem cells. Cell Stem Cell. 2013;13:360–369. doi: 10.1016/j.stem.2013.06.002. [DOI] [PubMed] [Google Scholar]
- Hackett JA, Sengupta R, Zylicz JJ, Murakami K, Lee C, Down TA, Surani MA. Germline DNA demethylation dynamics and imprint erasure through 5-hydroxymethylcytosine. Science. 2013;339:448–452. doi: 10.1126/science.1229277. [DOI] [PMC free article] [PubMed] [Google Scholar]
- Hajkova P. Epigenetic reprogramming in the germline: towards the ground state of the epigenome. Philos Trans R Soc Lond B Biol Sci. 2011;366:2266–2273. doi: 10.1098/rstb.2011.0042. [DOI] [PMC free article] [PubMed] [Google Scholar]
- Hajkova P, et al. Chromatin dynamics during epigenetic reprogramming in the mouse germ line. Nature. 2008;452:877–881. doi: 10.1038/nature06714. [DOI] [PMC free article] [PubMed] [Google Scholar]
- Heard E, Martienssen RA. Transgenerational epigenetic inheritance: myths and mechanisms. Cell. 2014;157:95–109. doi: 10.1016/j.cell.2014.02.045. [DOI] [PMC free article] [PubMed] [Google Scholar]
- Irie N, Weinberger L, Tang WW, Kobayashi T, Viukov S, Manor YS, Dietmann S, Hanna JH, Surani MA. SOX17 Is a Critical Specifier of Human Primordial Germ Cell Fate. 2015;160:253–268. doi: 10.1016/j.cell.2014.12.013. [DOI] [PMC free article] [PubMed] [Google Scholar]
- Kobayashi H, et al. High-resolution DNA methylome analysis of primordial germ cells identifies gender-specific reprogramming in mice. Genome Res. 2013;23:616–627. doi: 10.1101/gr.148023.112. [DOI] [PMC free article] [PubMed] [Google Scholar]
- Kurimoto K, Yabuta Y, Ohinata Y, Shigeta M, Yamanaka K, Saitou M. Complex genome-wide transcription dynamics orchestrated by Blimp1 for the specification of the germ cell lineage in mice. Genes Dev. 2008;22:1617–1635. doi: 10.1101/gad.1649908. [DOI] [PMC free article] [PubMed] [Google Scholar]
- Langfelder P, Horvath S. WGCNA: an R package for weighted correlation network analysis. BMC Bioinformatics. 2008;9:559. doi: 10.1186/1471-2105-9-559. [DOI] [PMC free article] [PubMed] [Google Scholar]
- Laurent L, et al. Dynamic changes in the human methylome during differentiation. Genome Res. 2010;20:320–331. doi: 10.1101/gr.101907.109. [DOI] [PMC free article] [PubMed] [Google Scholar]
- Lee HJ, Hore TA, Reik W. Reprogramming the methylome: Erasing the Memory and Creating Diversity. Cell Stem Cell. 2014;14:710–719. doi: 10.1016/j.stem.2014.05.008. [DOI] [PMC free article] [PubMed] [Google Scholar]
- Lister R, et al. Hotspots of aberrant epigenomic reprogramming in human induced pluripotent stem cells. Nature. 2011;471:68–73. doi: 10.1038/nature09798. [DOI] [PMC free article] [PubMed] [Google Scholar]
- McLean CY, Bristor D, Hiller M, Clarke SL, Schaar BT, Lowe CB, Wenger AM, Bejerano G. GREAT improves functional interpretation of cis-regulatory regions. Nat Biotechnol. 2010;28:495–501. doi: 10.1038/nbt.1630. [DOI] [PMC free article] [PubMed] [Google Scholar]
- Nakajima-Takagi Y, et al. Role of SOX17 in hematopoietic development from human embryonic stem cells. Blood. 2013;121:447–458. doi: 10.1182/blood-2012-05-431403. [DOI] [PubMed] [Google Scholar]
- Okamoto I, et al. Eutherian mammals use diverse strategies to initiate X-chromosome inactivation during development. Nature. 2011;472:370–374. doi: 10.1038/nature09872. [DOI] [PubMed] [Google Scholar]
- Rebollo R, Miceli-Royer K, Zhang Y, Farivar S, Gagnier L, Mager DL. Epigenetic interplay between mouse endogenous retroviruses and host genes. Genome Biol . 2012;13:R89. doi: 10.1186/gb-2012-13-10-r89. [DOI] [PMC free article] [PubMed] [Google Scholar]
- Robinson MD, McCarthy DJ, Smyth GK. edgeR: a Bioconductor package for differential expression analysis of digital gene expression data. Bioinformatics. 2010;26:139–140. doi: 10.1093/bioinformatics/btp616. [DOI] [PMC free article] [PubMed] [Google Scholar]
- Seisenberger S, Andrews S, Krueger F, Arand J, Walter J, Santos F, Popp C, Thienpont B, Dean W, Reik W. The dynamics of genome-wide DNA methylation reprogramming in mouse primordial germ cells. Mol Cell. 2012;48:849–862. doi: 10.1016/j.molcel.2012.11.001. [DOI] [PMC free article] [PubMed] [Google Scholar]
- Seisenberger S, Andrews S, Krueger F, Arand J, Walter J, Santos F, Popp C, Smith ZD, Chan MM, Humm KC, Karnik R, Mekhoubad S, Regev A, Eggan K, Meissner A. DNA methylation dynamics of the human preimplantation embryo. Nature. 2014;511:611–615. doi: 10.1038/nature13581. [DOI] [PMC free article] [PubMed] [Google Scholar]
- Takashima Y, et al. Resetting transcription factor control circuitry toward ground-state pluripotency in human. Cell. 2014;158:1254–1269. doi: 10.1016/j.cell.2014.08.029. [DOI] [PMC free article] [PubMed] [Google Scholar]
- Theunissen TW, et al. Systematic identification of defined conditions for induction and maintenance of naive human pluripotency. Cell Stem Cell. 2014;15:524–526. doi: 10.1016/j.stem.2014.09.003. [DOI] [PMC free article] [PubMed] [Google Scholar]
- Thienpont B, Dean W, Reik W. The dynamics of genome-wide DNA methylation reprogramming in mouse primordial germ cells. Mol Cell. 2012;48:849–862. doi: 10.1016/j.molcel.2012.11.001. [DOI] [PMC free article] [PubMed] [Google Scholar]
- Valamehr B, et al. Platform for induction and maintenance of transgene-free hiPSCs resembling ground state pluripotent stem cells. Stem Cell Reports. 2014;2:366–381. doi: 10.1016/j.stemcr.2014.01.014. [DOI] [PMC free article] [PubMed] [Google Scholar]
- Vincent JJ. Stage-specific roles for tet1 and tet2 in DNA demethylation in primordial germ cells. Cell Stem Cell. 2013;12:470–478. doi: 10.1016/j.stem.2013.01.016. [DOI] [PMC free article] [PubMed] [Google Scholar]
- Walser JC, Ponger L, Furano AV. CpG dinucleotides and the mutation rate of non-CpG DNA. Genome Res. 2008;18:1403–1414. doi: 10.1101/gr.076455.108. [DOI] [PMC free article] [PubMed] [Google Scholar]
- Wang J, et al. Primate-specific endogenous retrovirus-driven transcription defines naive-like stem cells. Nature. 2014a;516:405–409. doi: 10.1038/nature13804. [DOI] [PubMed] [Google Scholar]
- Wang L, et al. Programming and inheritance of parental DNA methylomes in mammals. Cell. 2014b;157:979–991. doi: 10.1016/j.cell.2014.04.017. [DOI] [PMC free article] [PubMed] [Google Scholar]
- Ware CB, et al. Derivation of naive human embryonic stem cells. Proc Natl Acad Sci USA. 2014;111:4484–4489. doi: 10.1073/pnas.1319738111. [DOI] [PMC free article] [PubMed] [Google Scholar]
- Yamaguchi S, Hong K, Liu R, Inoue A, Shen L, Zhang K, Zhang Y. Dynamics of 5-methylcytosine and 5-hydroxymethylcytosine during germ cell reprogramming. Cell Res. 2013;23:329–339. doi: 10.1038/cr.2013.22. [DOI] [PMC free article] [PubMed] [Google Scholar]
- Yamaji M, Seki Y, Kurimoto K, Yabuta Y, Yuasa M, Shigeta M, Yamanaka K, Ohinata Y, Saitou M. Critical function of Prdm14 for the establishment of the germ cell lineage in mice. Nat Genet. 2008;40:1016–1022. doi: 10.1038/ng.186. [DOI] [PubMed] [Google Scholar]
- Yan L, Yang M, Guo H, Yang L, Wu J, Li R, Liu P, Lian Y, Zheng X, Yan J. Single-cell RNA-Seq profiling of human preimplantation embryos and embryonic stem cells. Nat Struct Mol Biol. 2013;20:1131–1139. doi: 10.1038/nsmb.2660. [DOI] [PubMed] [Google Scholar]
Associated Data
This section collects any data citations, data availability statements, or supplementary materials included in this article.