

Abstract
Background
Nearly half of individuals with substance use disorders relapse in the year after treatment. A diagnostic tool to help clinicians make decisions regarding treatment does not exist for psychiatric conditions. Identifying individuals with high risk for relapse to substance use following abstinence has profound clinical consequences. This study aimed to develop neuroimaging as a robust tool to predict relapse.
Methods
68 methamphetamine-dependent adults (15 female) were recruited from 28-day inpatient treatment. During treatment, participants completed a functional MRI scan that examined brain activation during reward processing. Patients were followed 1 year later to assess abstinence. We examined brain activation during reward processing between relapsing and abstaining individuals and employed three random forest prediction models (clinical and personality measures, neuroimaging measures, a combined model) to generate predictions for each participant regarding their relapse likelihood.
Results
18 individuals relapsed. There were significant group by reward-size interactions for neural activation in the left insula and right striatum for rewards. Abstaining individuals showed increased activation for large, risky relative to small, safe rewards, whereas relapsing individuals failed to show differential activation between reward types. All three random forest models yielded good test characteristics such that a positive test for relapse yielded a likelihood ratio 2.63, whereas a negative test had a likelihood ratio of 0.48.
Conclusions
These findings suggest that neuroimaging can be developed in combination with other measures as an instrument to predict relapse, advancing tools providers can use to make decisions about individualized treatment of substance use disorders.
1. Introduction
Relapse is a vexing problem in addictive disorders and, typically, only 40 to 60% of individuals with addictive disorders are able to maintain abstinence for more than a year after initiating treatment (Hunt et al., 1971; McLellan et al., 2000). Since numerous studies have suggested that treatment can lower relapse rates (Baker et al., 2001; Irvin et al., 1999; Kosten and O'Connor, 2003; Lancaster et al., 2006; Schmitz et al., 2001), identifying treatment-seeking patients at greatest risk of relapse could help clinicians to appropriate more resources to those individuals to more effectively reduce relapse rates. Previous studies have shown that demographic (e.g., lower socioeconomic status; Mclellan et al., 1994), social (e.g., lack of family support; National Institute of Drug Abuse, 1999), and neuroimaging measures (Janes et al., 2010; Paulus et al., 2005; e.g., failure to show differential activation during risky and safe decisions; Gowin et al., 2014a), can indicate relapse likelihood. More recent investigations have used machine learning techniques to predict individual outcomes (Connor et al., 2007; Weinstein et al., 2009). To date, few such studies have used brain imaging measures and have focused on making individually specific predictions. There is some indication that the combination of imaging and sophisticated analytic approaches may provide sufficient prediction accuracy that would allow one to develop prognostic tests of relapse. Such tests could aid a clinician in providing a patient-specific risk assessment that could be used to objectively communicate risk to the patient or change the course of treatment to reduce risk status.
One proposed marker of substance use disorders (SUDs), including methamphetamine dependence (MD; May et al., 2013; Schouw et al., 2013; Stewart et al., 2014), is altered neural response of the limbic reward system (Koob, 2013; Volkow and Fowler, 2000). There are two prominent hypotheses on how the response changes: individuals with SUDs may have hyper- or hypo-activation in response to rewarding stimuli, reflecting either enhanced incentive salience or reward deficiency, respectively. The incentive salience hypothesis derives from evidence that repeated pairing of a cue with a rewarding substance leads to enhanced dopaminergic responding, and drug-craving, when shown the cue (Berridge, 2012). The reward deficiency hypothesis derives from evidence that individuals with SUDs have impaired function of the dopamine reward system, and thus have lower response to rewards such as food, and may use substances to enhance dopamine signaling (Blum et al., 2012). A recent review suggests that the presence of drug cues may modulate reward circuitry activation, where drug cues enhance reward circuitry activation relative to controls, but natural rewards produce lower levels of activity (Leyton and Vezina, 2013; Limbrick-Oldfield et al., 2013). Corroborating this, several studies using monetary or food rewards have shown that individuals with SUDs relative to controls show decreased activation in the striatum, amygdala and insula when viewing or receiving rewards (Ihssen et al., 2011; Jia et al., 2011; Konova et al., 2012; Peters et al., 2011). The ability to stimulate reward circuitry through natural rewards may diminish the desire to stimulate it through substance use, potentially reducing the risk of relapse. It remains unclear whether processing of non-drug rewards during early abstinence can distinguish between individuals who will relapse or remain abstinent.
In a previous study, we examined early-abstinent MD during the decision phase of a risk-taking task and showed that a lack of differentiation between safe and risky options distinguished individuals who would relapse (Gowin et al., 2014a). That study attempted to identify processing differences between individuals who relapse versus abstain (i.e., disrupted risky decision-making). Here, we use data from the same sample to focus on a different question: can neuroimaging be developed as a practical prediction tool to identify individuals at risk of relapse? Improving diagnosis of SUDs is a critical issue to the field (Volkow and Baler, 2013). To address this question, we use a novel statistical model to determine how well neuroimaging can be used to predict clinical outcomes in combination with clinical, demographic and behavioral measures. We wanted to address a problem in neuroimaging prediction models identified by Whelan and Garavan (2013); they showed that the failure of neuroimaging studies to use out-of-sample data disposes them to inflate prediction estimates. We reduced the risk of inflated estimates by using random forest (Breiman, 2001), a robust model that employs a training and testing set. We hypothesized that those individuals who have the greatest difficulty in differentially processing levels of reward, i.e., the neural activation difference to small versus large rewards, might be at greatest risk for relapse. Moreover, we aimed to examine whether a machine learning approach, i.e., random forest, using neural activation during reward could be used to develop a robust test to assess relapse risk of individual participants. Support for the hypotheses and evidence for a robust test would integrate reward-processing dysfunctions with a practically useful tool that would make a significant contribution to addiction medicine.
2. Materials and Methods
2.1 Sample
Sixty-eight (fifteen female) MD individuals were recruited through 28-day inpatient drug treatment programs at the Veterans Affairs San Diego Healthcare System and Scripps Green Hospital (La Jolla, CA). Both treatment programs employ 12-step models, daily education and exercise, and require participants to attend Narcotics Anonymous meetings. All participants completed the 28-day program and consented to participate in a clinical interview, a brain scan, and a follow-up phone interview one year later. Participants had ceased using methamphetamine an average of 32.9 ± 2.4 (mean ± SEM) days prior to study procedures (range: 15 – 119), which occurred during the third or fourth week of treatment.
2.2 Clinical Assessments
Lifetime DSM-IV Axis I diagnoses, substance use and Axis II antisocial personality disorder were assessed during the second week of treatment using the Semi Structured Assessment for the Genetics of Alcoholism (SSAGA; Bucholz et al., 1994; Hesselbrock et al., 1999). All participants met criteria for primary dependence on methamphetamine. The following were exclusion criteria for all groups: (1) antisocial personality disorder; (2) current (past 6 months) Axis I panic disorder, social phobia, posttraumatic stress disorder, major depressive disorder; (3) lifetime bipolar disorder, schizophrenia, and obsessive compulsive disorder; (4) current severe medical disorders requiring inpatient treatment or frequent medical visits; (5) use of medications that affect the hemodynamic response within the past 30 days; (6) current positive urine toxicology test; and (7) history of head injuries with loss of consciousness for longer than 5 minutes. Participants completed the Beck Depression Inventory (BDI; Beck et al., 1961).
One-year follow-up consisted of an interview based on the substance use portion of the SSAGA, a well-validated measure for the assessment of substance use metrics (Bucholz et al., 1994; Hesselbrock et al., 1999). Participants were asked whether, and when, they had used any of the following substances in the past year: sedatives, hallucinogens, stimulants, marijuana, cocaine or opiates. Since treatment was abstinence-based, relapse was defined as any use of these substances. Based on interview responses, forty-five participants (11 female) reported abstinence from drugs (except nicotine). Eighteen participants (4 female) reported at least one substance use during the year (i.e. relapsed). Five participants (7.4%) could not be tracked; these participants were similar to the remaining sample in age, education and lifetime methamphetamine use. Characteristics are summarized in Table 1.
Table 1. Subject characteristics by group.
| Characteristic | Abstinent (n=43) | Relapsed (n=18) |
|---|---|---|
| Female (%) | 10 (23) | 4 (21) |
| Treated at VA (%) a | 28 (65) | 14 (78) |
| Lifetime alcohol dependence (%) | 18 (37) | 10 (53) |
| Lifetime marijuana dependence (%) | 8 (17) | 5 (26) |
| Lifetime cocaine dependence (%) | 13 (27) | 7 (37) |
| Current alcohol dependence (%) | 8 (17) | 6 (32) |
| Current marijuana dependence (%) b | 2 (4) | 4 (21) |
| Current cocaine dependence (%) | 5 (10) | 4 (21) |
| Age, years (mean, SD) | 38.8 (11.1) | 37.4 (9.2) |
| Education, years (mean, SD) | 12.8 (1.7) | 13.3 (1.5) |
| Verbal IQ (mean, SD) c | 108.0 (10.2) | 109.7 (7.3) |
| Alcohol, drinks/week (mean, SD) d | 11.0 (17.6) | 14.4 (33.0) |
| Nicotine, cigarettes/day (mean, SD) d | 11.8 (9.3) | 8.7 (9.2) |
| Methamphetamine age onset, (mean, SD) e | 24.1 (9.4) | 24.9 (9.1) |
| Time since last methamphetamine use before treatment, days (mean, SD) e | 32.4 (18.8) | 34.0 (19.7) |
| Methamphetamine estimated lifetime uses, (mean, SD)e | 14624.5 (32414.1) | 8841.6 (12353.1) |
| Cocaine estimated lifetime uses, (mean, SD)e | 2551.4 (6116.9) | 3942.9 (7250.8) |
| Marijuana estimated lifetime uses, (mean, SD)e | 10882.5 (30375.4) | 4743.5 (8851.2) |
The participants not recruited from the Veterans Affairs (VA) hospital were recruited from Scripps Green
p<.05 for group difference, based on chi-squared analysis
Assessed by the North American Adult Reading Test (Uttl, 2002)
Recent patterns of use.
Determined using the Semi Structured Assessment for the Genetics of Alcoholism (Hesselbrock, 1999)
2.3 Temperament and neurocognitive assessment
During the second week of treatment, participants completed the Barratt Impulsiveness Scale (BIS; Patton et al., 1995), NEO Five-Factor Inventory (McCrae and Costa, 2004), Temperament and Character Inventory (TCI; Cloninger, 1987), Sensation Seeking Scale (SSS-V; Zuckerman, 1996) and North American Adult Reading Test (Uttl, 2002) to measure verbal intelligence (VIQ).
2.4 Neuroimaging task
The Risky Gains Task (RGT) has been used in prior studies (Gowin et al., 2014b; Paulus et al., 2003) and is briefly described here. The goal of the RGT was to earn as much money as possible. Participants selected one of three options—20¢, 40¢ or 80¢—on each trial. The options appeared one at a time in ascending order for 1 second each. Participants were told 20¢ was the safe option (guaranteed gain of 20¢) and 40¢ and 80¢ were risky options (choosing 40¢ or 80¢ resulted in a chance of either gaining or losing 40¢or 80¢, respectively). The trial ended and feedback was given immediately after the participant won or lost, but all trials lasted 3.5 seconds. The task contained 96 trials. Unbeknownst to participants, the number of loss trials (-40¢ and -80¢) was set so that choosing the same option on each trial would earn the same final payment; choosing risky versus safe provided no advantage. Participants were excluded if they chose the same option on every trial because neuroimaging regressors could not be computed for the unchosen option (N=2).
2.5 Functional magnetic resonance imaging
Scans were conducted during the second or third week of treatment. Subjects completed a questionnaire based on the Semi-Structured Assessment for Drug Dependence and Alcoholism (Pierucci-Lagha et al., 2005) prior to scanning to confirm the absence of withdrawal symptoms; no subjects reported withdrawal symptoms. Smokers were allowed to smoke, but nicotine levels were not measured. A fMRI run sensitive to blood-oxygenation level dependent (BOLD) contrast was collected using a Signa EXCITE 3T scanner (GE Healthcare, Milwaukee, Wisconsin, T2*-weighted echo planar imaging; TR=2000ms, TE=32ms, FoV=230×230 mm2, 64×64 matrix, 30 2.6-mm axial slices with 1.4mm gap, flip angle=90°, total duration: 8min, 32sec, 3.59×3.59×2.6 mm3 voxels). Six resting trials (6-10 sec) were collected at preset points during the task and used as part of baseline, along with inter-trial intervals. A high-resolution, T-1 weighted image was collected during the same session for anatomical reference.
Data were preprocessed using Analysis of Functional Neurolmages (AFNI) software (Cox, 1996). Echo planar images were aligned to anatomical images. Images were spatially smoothed using a 4 mm Gaussian filter and normalized to Talairach space. Preprocessed data were analyzed with a multiple regression model using AFNI's 3dDeconvolve. Regressors for safe (+20) and risky (+40, +80) decisions were defined as starting at trial onset and ending when a) the subject made a response or b) a punishment (-40¢, -80¢) was delivered (no jitter occurred between phases to keep subjects engaged with the sequence of actions). Regressors for wins (+20¢, +40¢, +80¢) and losses (-40¢, -80¢) were defined as starting when the outcome appeared and ending at the onset of the next trial. Motion and drift across the run were included as regressors of non-interest. Following deconvolution, percent signal change (PSC) was calculated by dividing the regressors by baseline activation, which was calculated during six null trials interspersed in the task. Group analyses focused on reward-processing (the decision phase of this task was analyzed in a previous manuscript: Gowin et al., 2014a).
2.6 Linear mixed effects model of reward processing (standard analysis pathway)
To determine if MD who went on to relapse showed different neural activation patterns relative to MD with continued abstinence, a linear mixed-effects (LME) analysis was conducted with R software (http://www.r-project.org; nlme package). Group (relapse, abstinent) and reward type (+20¢, +40¢, and +80¢) were fixed effects in the model and individual participants were random effects. LME analysis examined the main effect of group and the group by reward interaction. Analyses were performed voxel-wise across the entire brain (total voxels = 72,960, final voxel size = 4×4×4mm). A volume threshold adjustment was performed based on AFNI's AlphaSim to prevent type-l errors. An a priori per-voxel threshold of p=0.05 in a cluster of 768μL (12 contiguous voxels) resulted in an a posteriori cluster-wise p=0.05.
To test whether any variables could predict time to relapse, a Cox proportional hazards model was used. The dependent variable was the number of days between assessment and relapse. The independent variables were the total number of methamphetamine uses (log-transformed due to positive skew) and the difference in activation between a large, risky (mean of +40¢ and +80¢) and small, safe win (+20¢) in the right putamen and the right caudate (chosen based on LME results).
2.7 Random forest prediction model (predictive test analysis pathway)
Random forest is a machine-learning tool that uses predictor variables to classify members of a sample into categories (e.g., relapse or abstinent). The forest is constructed from a multitude of decision-trees (Breiman, 2001). While a single decision tree is susceptible to noise, the average of many trees, obtained by a forest, is not, so long as the trees are uncorrelated. Random forest performs as well or better than alternative classification techniques in terms of accuracy and robustness (i.e., even in the presence of noise, the model does not overfit to a given sample; Breiman, 2001). In the present study, random forest models were computed using R (randomForest library) to determine if neuroimaging variables, clinical and personality variables, or a combination of the two could predict relapse at the individual level.
The random forest method used here involves four steps (Ball et al., 2013; Breiman, 2001; Genuer et al., 2010; Strobl et al., 2009). First, 2,000 decision trees were grown, each using a different, randomly-selected subsample of participants and independent variables. Each tree was grown using a different bootstrap sample of all participants (about two-thirds of the total sample), constituting the training set for that particular tree. At each node of a tree, the model randomly sampled a small number of the total available variables. Specifically, the square root of the total number of available variables was sampled. An optimal split point was determined for each node (e.g., a score greater than 5 on the BDI classifies as relapse) at each node. The tree was grown, without pruning, to the largest extent possible. The tree ends with each participant in the training set classified as relapse or abstinent.
Second, participants in the test set were run through the decision tree to evaluate how well it classified new subjects. The accuracy with which the tree classifies the test set provides a running estimate of classification error and helps determine the extent that each variable contributes to correct classification. Across the 2000 trees in the forest, each participant was part of the test set about a third of the time (i.e., ≈666 times). The average number of times that each participant was misclassified when they were a part of the test set provides the error estimate of the forest. Since the error estimate for random forest models has proven to be unbiased in many tests, there is no need for cross-validation on a separate test set (Breiman, 2001; Breiman and Cutler, 2001). Each tree casts a vote for the outcome of each participant, and the classification of a particular subject was determined by the vote endorsed by the majority of the trees. For example, if 51% of trees voted that Subject X would relapse, then Subject X was classified as someone who would relapse.
Third, the variables that contributed most to decision-tree accuracy were identified based on permutation importance scores (Ball et al., 2013; Genuer et al., 2010). Permutation importance is defined by the mean decrease in classification accuracy when values of a variable are randomly permuted across all trees (Breiman, 2001). For example, the values for variable X for each participant were randomly permuted. If the difference between the model's performance with the true values and the model's performance with the permuted values of variable X is large, variable X would have a high permutation importance score, signifying that it carried important information that helped accurately classify participants. Median permutation scores were based on 500 repetitions of the random forest analysis to provide stable estimates.
Fourth, the most important variables were identified and retained for a final, more parsimonious model, which is a common step when the number of variables is high (Breiman and Cutler, 2001). Since negative scores are due to random variation around zero (Strobl et al., 2009), only variables with a permutation score higher than the absolute value of the most negative score were included in the final model to guard against including variables that predicted no better than chance. Further, the number of variables in the final model was restricted to a maximum of 10, following the method of Nicodemus and colleagues (2010) and because visual inspection of the Scree plot showed variable importance diminished after the tenth variable. The classification of each participant based on the final model was used to determine diagnostic test characteristics, such as accuracy, sensitivity, specificity and likelihood ratios.
The neuroimaging only model examined the difference in percent signal change between large, risky (mean of +40¢ and +80¢) and small, safe rewards (+20¢) as well as losses (mean of -40¢ and -80¢). The entire brain (excluding cerebellum) was segmented based on anatomy into 72 distinct regions, and the average voxel-wise difference in signal change was calculated for each region, yielding 144 independent variables. The construction of the mask used for segmentation was described in a previous report (Ball et al., 2013; Fonzo et al., 2013) and is recapitulated here. Grey matter probability maps were generated based on high resolution Tl images of 43 healthy adults. Probability maps were transformed to Talairach (Talairach and Tournoux, 1988) coordinates and regions were defined using the Talairach atlas. The 144 neuroimaging variables then went through the four steps described above.
A second model used only clinical (lifetime methamphetamine use, lifetime cocaine use, lifetime cannabis use, time since last drug use before treatment, years of drug use, BDI, current number of cigarettes/day), demographic (age, gender, years of education), behavioral (total proportion of risky options, proportion of risky options following a previous loss) and psychometric measures (BIS, NEO, SSS, TCI, VIQ). Finally, a third, combined model used all of the variables from the previous two models.
Classification accuracy, sensitivity, specificity, and positive and negative likelihood ratios were determined for the output of all three models. The proportion of trees voting for relapse for each participant was used to generate receiver operating characteristic (ROC) curves for each model, and the area under the curve (AUC) was calculated. The AUC for an ROC curve is one of the best ways to estimate the predictive accuracy of a diagnostic test, where 1 indicates perfect discriminative ability and 0.5 (i.e., the reference line) indicates no discriminative ability. McNemar's test was used to statistically compare the three models to each other.
3. Results
3.1 Group characteristics
There were no significant differences between the group that relapsed and the group that remained abstinent in demographics or drug use history (p>.05; Table 1). Mean number of days to relapse among MD who relapsed was 175.1 (SEM=29.3). A chi-squared analysis showed that the relapse group (21%) had a higher prevalence of current marijuana dependence relative to the abstinent group (4%), but the small number of participants meeting this criteria (N=6) precludes a subgroup analysis. MD who relapsed chose the risky option a similar proportion of times (mean= 0.48, SD=.29) compared to those who remained abstinent (mean= 0.49, SD=.20; F1, 61 = .09, p=.76).
3.2 Linear mixed effects model of outcome
LME analysis indicated significant group (abstinent, relapse) by reward magnitude (+20¢, +40¢, and +80¢) effects in the right putamen, right caudate, left anterior insula and several other regions (Table 2). In the putamen, caudate, and anterior insula, MD who remained abstinent showed increasedactivation during 80¢ relative to 20¢ wins, whereas MD who relapsed showed reduced activity during 80¢ relative to 20¢ wins (see Figure 1).
Table 2.
Significant clusters identified using a linear mixed-effects model for the group-by-condition contrast.
| Volume (μL) | x | y | z | Left/Right | Brain Region | Brodmann Area |
|---|---|---|---|---|---|---|
| 11968 | -9 | 33 | 0 | L | Anterior Cingulate | 32 |
| 5568 | -1 | -30 | 31 | L | Cingulate Gyrus | 31 |
| 4288 | -30 | 9 | 11 | L | Insula | 13 |
| 3648 | 7 | -62 | 33 | R | Precuneus | 7 |
| 2496 | -14 | -12 | 14 | L | Thalamus | |
| 2048 | 25 | -1 | 4 | R | Lentiform Nucleus | |
| 1792 | 28 | -1 | -26 | R | Parahippocampal Gyrus | 28 |
| 1600 | 49 | -1 | 22 | R | Inferior Frontal Gyrus | 9 |
| 1280 | 26 | 48 | 17 | R | Superior Frontal Gyrus | 10 |
| 1280 | 37 | -59 | 37 | R | Angular Gyrus | 39 |
| 1216 | -35 | -56 | 41 | L | Inferior Parietal Lobule | 40 |
| 1152 | 39 | -7 | 40 | R | Precentral Gyrus | 6 |
| 1088 | 19 | -10 | 22 | R | Caudate | |
| 1088 | -11 | -74 | 35 | L | Precuneus | 7 |
| 1088 | -13 | -36 | 42 | L | Cingulate Gyrus | 31 |
| 960 | -38 | 17 | -31 | L | Superior Temporal Gyrus | 38 |
| 960 | 65 | -31 | -5 | R | Middle Temporal Gyrus | 21 |
| 960 | 8 | -78 | 3 | R | Lingual Gyrus | 18 |
| 960 | 1 | -88 | 16 | R | Cuneus | 18 |
| 896 | 9 | -52 | 5 | R | Posterior Cingulate | 30 |
| 768 | 12 | 15 | 2 | R | Caudate | |
| 768 | 11 | -69 | 21 | R | Cuneus | 18 |
Figure 1.
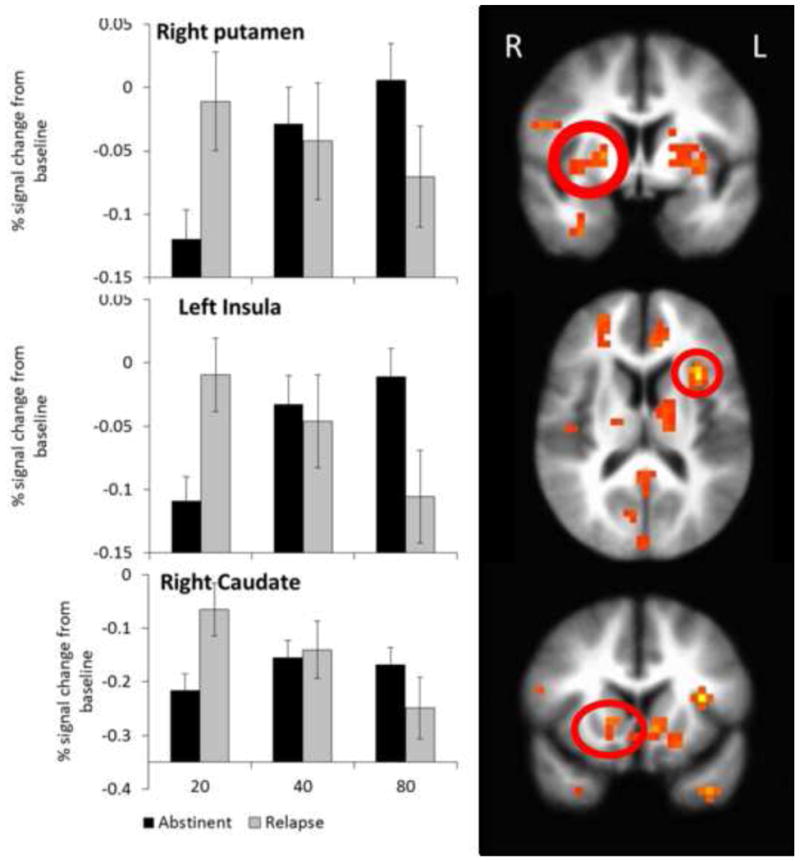
Group by reward interaction in the striatum and insula. The linear mixed effects model revealed a significant group by reward size effect in the right striatum and left anterior insula. The group that remained abstinent showed greater activation for a large, risky relative to a small, safe rewards, while the group that relapsed showed decreased activation during large, risky relative to small, safe rewards. The right putamen cluster overlaps substantially with the brain region identified in the random forest model as predicting relapse status. Bars represent mean and error bars represent SEM.
3.3 Time to relapse prediction
The Cox proportional hazards model significantly predicted time to relapse (-2 log likelihood=129.8, χ2 (3) =13.3, p=0.004). Individuals with less differentiation between large, risky and small, safe rewards in the putamen (b=-.66, p=.04), and individuals with higher lifetime methamphetamine usage (b=-.60, p=0.03), were likely to relapse sooner.
3.4 Individual outcome prediction models (Random Forest)
3.4.1 Clinical and Personality Variables Only
According to the random forest procedure outline above, nine variables met inclusion criteria for the final model: NEO Neuroticism, BDI total score, SSS boredom susceptibility, SSS thrill and adventure seeking, SSS total, BIS motor impulsivity, BIS perseverance, TCI harm avoidance and log-transformed lifetime cocaine uses. Student's t-tests showed that the groups did not differ significantly on any of these variables (see Figure 2; all p> 0.05), suggesting that the random forest model detected relapse likelihood using higher-order interactions between the variables. The AUC for the ROC curve was 0.74. A positive test for relapse indicated a 2.87 increase in risk (+LR= 2.87, 95% confidence interval: 1.52, 5.40), whereas a negative test indicated decreased risk by 2.32 (-LR = 0.43, 95% CI: 0.22, 0.85). Since the confidence intervals did not overlap with 1 or each other, the model predicts outcomes better than chance (p<0.05).
Figure 2.
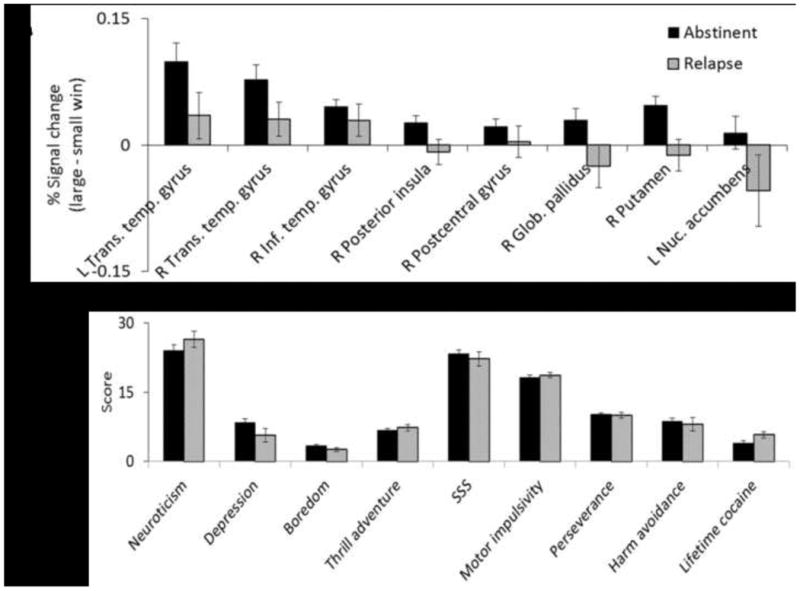
Random Forest measures. These graphs show the central tendency and variance of the variables in the random forest models. Panel A shows that MD who remained abstinent showed greater activation during large, risky versus small, safe wins. MD who relapsed, in contrast, showed less differential activation when receiving large, risky versus small, safe wins. Panel B shows the values for the personality measures. Relapse and abstinent MD showed similar levels on these variables, but in combination the variables were useful in random forest modeling of relapse. This suggests that the random forest model may be able to detect higher order interactions not evident from the individual variables. Bars represent mean and error bars represent SEM.
3.4.2 Neuroimaging Variables Only
Eight regions met criteria for inclusion in the final model, and all of them were related to brain processing differences between small, safe and large, risky rewards. These regions included left and right transverse temporal gyrus, right inferior temporal gyrus, right posterior insula, right postcentral gyrus, right medial globus pallidus, right putamen, and left nucleus accumbens. Specifically, in all eight regions MD who relapsed had lower differential activation between large, risky and small, safe rewards relative to MD who remained abstinent (Figure 2). The AUC for the ROC plot was 0.73. A positive test for relapse indicated a 2.63 increase in risk (+LR=2.63, 95% CI: 1.36, 5.07), whereas a negative test indicated decreased risk by 1.98 (-LR= 0.51, 95% CI: 0.28, 0.93). Since the confidence intervals did not overlap with 1 or each other, the model predicts outcomes better than chance (p<0.05).
3.4.3 Combined Model
Ten variables met criteria for inclusion in the final combined model: SSS thrill and adventure seeking, the eight brain regions listed in the brain-only model, and the cingulate gyrus. The AUC for the ROC plot was 0.71. A positive test for relapse indicated a 3.28 increase in risk (+LR=3.28, 95% CI: 1.59, 6.79), whereas a negative test indicated decreased risk by 2.08 (-LR=0.48, 95% CI: 0.26, 0.87). Since the confidence intervals did not overlap with 1 or each other, the model predicts outcomes better than chance (p<0.05).
3.4.4 Model comparisons
Figure 3 and Table 3 show model performance and test characteristics. Each model produced sensitivity greater than 0.6 and specificity approaching 0.8, such that nearly four of five individuals with a negative test remained abstinent, while three of five individuals with a positive test relapsed. McNemar's test showed that none of the three models differed significantly from each other (p>.22). Please see Supplementary Material for more information1.
Figure 3.
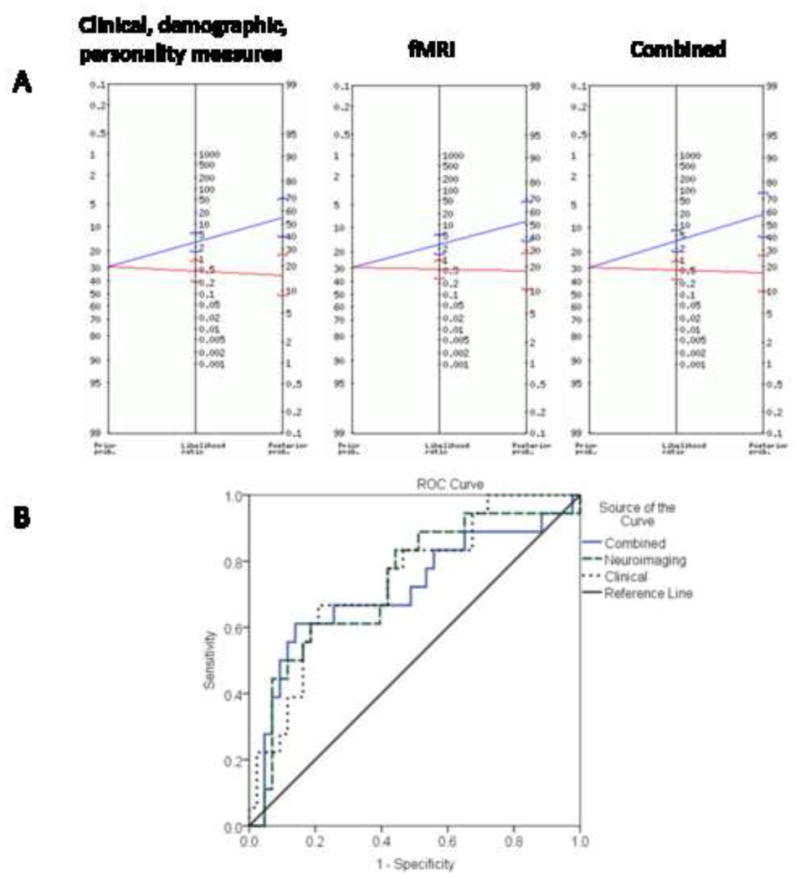
Predictive value of models. In panel A, a Bayes nomogram is depicted for each random forest model. The left side of the nomogram shows the prior probability of relapse, or the proportion of the total sample that relapsed. The right side shows the posterior probability of relapse given a positive or a negative test result in the random forest model. The brackets around the central estimate represent the 95% confidence interval of the probability. When the 95% confidence intervals do not intersect, positive and negative tests are statistically significantly different. The middle line represents the likelihood ratio of a positive or negative test. All three models produced similar nomograms. In panel B, the receiver operating characteristic curves are depicted for each random forest model. All three models show significant improvement relative to the no-discrimination line.
Table 3. Test characteristics of each model.
Table 3 provides characteristics for each model. The clinical and personality model contains only variables describing temperament, drug use history and demographics (e.g. age). The fMRI model contains average activation from 72 discrete anatomical brain regions encompassing the entire brain (except cerebellum). The combined model includes all the predictors from the clinical and personality and fMRI models. Area under the curve (AUC) for the receiver operating characteristic plot is one of the best metrics of how good a predictive model is; .5 suggests the test offers no discriminative ability and closer to 1 suggests perfect discrimination. The positive likelihood ratio (LR) describes how likely a positive test for relapse indicates an actual relapse. The negative LR describes how likely a negative test for relapse indicates that a person will remain abstinent.
| Model | Accuracy | Sensitivity | Specificity | AUC | Positive LR (95% CI) | Negative LR (95% CI) |
|---|---|---|---|---|---|---|
| Clinical and personality | 74% | .67 | .77 | .74 | 2.87 (1.52, 5.40) | .43 (.22, .85) |
| fMRI | 72% | .61 | .77 | .73 | 2.63 (1.36, 5.07) | .51 (0.28, 0.93) |
| Combined | 75% | .61 | .81 | .71 | 3.28 (1.59, 6.79) | .48 (0.26, 0.87) |
4. Discussion
We examined whether brain activation during reward-processing can accurately predict which methamphetamine-dependent individuals will relapse in the year following treatment. Our results suggest that the degree to which the striatum differentially processes large, risky versus small, safe rewards is a robust predictor of relapse. In particular, those individuals who show brain activation that fails to differentiate reward magnitudes relapsed sooner. The present results complement our previous study, which showed that altered risk-processing may be a mechanism driving relapse (Gowin et al., 2014a), by demonstrating that in addition to elucidating processing differences, neuroimaging may also be developed as a practical test to distinguish individuals at risk of relapse from those likely to remain abstinent. Therefore, the current results may have more clinical utility in evaluating treatment-seeking MD. The random forest models had AUCs over 0.7, which is good for discriminating between individuals who will relapse or remain abstinent, considering they did not differ on any demographic or personality measures. This specificity and sensitivity improves greatly over chance. The high AUCs, robustness of the model, and use of separate training and test sets (to reduce over-fitting; Breiman, 2001) provide evidence that this could be developed as a test to predict relapse status.
Both the linear-mixed effects and random forest models identified the striatum and insula as regions which differentiated individuals who relapsed from those who remained abstinent, supporting the hypothesis that reward processing may indicate substance dependence status (Gowin et al., 2013; Volkow and Fowler, 2000). Indeed, three of the eight brain regions identified by the random forest model are part of the striatum, indicating that the function of this region plays an important role in sustained abstinence. In the putamen clusters identified by both models, individuals who showed an increase in activation during large, risky relative to small, safe wins were more likely to maintain abstinence, and maintain it longer. This is consistent with our previous study, which showed that greater differentiation between safe and risky options in the insula was associated with greater likelihood to maintain abstinence; individuals who relapse may generally fail to appreciate differences in value and probability (Gowin et al., 2014a). The identification by our study that appropriate reward-processing in the striatum as a function that contributes to recovery from substance use disorders corroborates previous work that reward processing plays a role in mental health and addition (Balodis and Potenza, 2015; Knutson and Heinz, 2015). Another study suggests that posterior insula, putamen and caudate may jointly contribute to decisions to wait for larger rewards rather than take smaller gains sooner (Wittmann et al., 2007). Given the insula's role in decision-making (Bechara, 2004; Craig, 2009; Ernst et al., 2002; Wittmann et al., 2007), it would be plausible that the striatum assesses value and interacts with the insula to contribute to decisions about reward, including the immediate pleasure of substance use versus the gradual enjoyment of sustained abstinence.
The random forest neuroimaging model and linear mixed-effects analysis of brain activation revealed some similar and some discrepant findings. The similar findings were discussed in the previous paragraph. Discrepantly, the random forest model identified a few different brain regions (e.g., globus pallidus) and was able to construct a predictive model using clinical and personality variables, whereas linear tests did not find any significant differences between the two groups on the same measures. This is likely due to the random forest models ability to detect higher-order interactions among variables. For example, even though standard linear t-tests failed to identify any differences on clinical and personality variables between the group that relapsed the one that remained abstinent, the random forest model used a combination of the same variables to predict relapse significantly better than chance. Further, since most analyses in neuroimaging use a variant of a linear model, it is worth noting linear models of brain activation make many comparisons and report all areas that survive a threshold. Analyses by Whelan and Garavan (2013) have shown that this approach leads to a high likelihood of overfitting. Random forest reduces the risk of overfitting by using a training and test set. Thus, regions which by chance have high significance in the training set will fail to replicate in the test set, giving a more accurate estimate of their importance. The robustness of the random forest model suggests that these findings are more likely to replicate in new samples.
The clinical and personality model performed similarly to the neuroimaging model. The combined model used mostly neuroimaging variables and showed improved specificity and accuracy relative to both models, possibly supporting our hypothesis that neuroimaging variables explain additional variance relative to clinical and personality variables. Despite the similar performance of the models, there may be advantages for developing diagnostic tests that include neuroimaging. First, neuroimaging does not rely on self-report, which can be unreliable among individuals with substance use disorders (Brown et al., 1992). Second, fMRI measures may be orthogonal to behavioral and clinical data, possibly reducing collinearity and creating stronger models (Breiman, 2001). Whatever advantages neuroimaging may provide should be weighed against the additional costs and workload it requires. One way to improve neuroimaging models would be to include additional tasks that assess other cognitive systems (e.g., stress) aside from reward processing to get a more comprehensive view of brain function. Lastly, neuroimaging may better indicate the neurobiological status (e.g., reduced striatal D2 receptors; Volkow et al., 2002) of the underlying disease. As more refined models are developed, future studies should perform a cost-benefit analysis for neuroimaging as a predictive tool.
There are several limitations to the present study. A 29% relapse rate is lower than the normal range of 40-60% (McLellan et al., 2000), and drug use and relapse were assessed via self-report and not verified by urine toxicology. Nonetheless, since individuals with antisocial personality disorder were excluded and participants stood to gain nothing by lying, we believe the likelihood of intentional deception to be low. Further, since relapse was assessed using the same method (i.e., SSAGA) as the initial diagnosis of MD, we believe the diagnosis of relapse is roughly as reliable as the initial diagnosis. We also excluded individuals with co-morbid psychiatric conditions, which have been shown to contribute to relapse (McLellan et al., 2000; National Institute of Drug Abuse, 1999). There may also have been a selection bias since we only studied individuals who were willing to undergo an MRI scan and study procedures. Excluding co-morbid diagnoses and including individuals able to complete an MRI scan may have lowered relapse rates and reduced generalizability, a possibility that should be clarified in future studies. Future studies may improve upon these methods by validating relapse through urine-toxicology or, if using self-report, performing a calendar-supported timeline-follow back assessment of substance use. Although participants in this sample had a primary diagnosis of methamphetamine dependence, many met criteria for dependence on other substances as well, so our results may not be methamphetamine specific but reflect polysubstance use. Also, the majority of the participants were recruited through a Veterans Affairs hospital, so the findings may not generalize to other populations of methamphetamine-dependent individuals. Finally, although we used a robust technique that employed out-of-sample data, these findings need to be replicated to confirm their validity.
The random forest model built with neuroimaging data generated accurate predictions of which individuals would relapse. Since anatomical regions were used, it would be easy to collect the same variables in new samples to test the replicability of these findings. Further studies may validate that neuroimaging can be used as a tool to predict relapse, providing an essential advance in the way treatment providers make decisions about individualized treatment of substance use disorders.
Supplementary Material
Highlights.
We did fMRI on abstinent methamphetamine-dependent individuals and determined who relapsed.
We used a robust classification technique called random forest to generate individual-level predictions.
The random forest model was consistent with a standard linear model.
Our models performed well, with specificity, sensitivity and ROC AUC around 0.7.
Our results suggest that neuroimaging can be developed to predict individual clinical outcomes.
Acknowledgments
Martin Paulus had full access to all the data in the study and takes responsibility for the integrity of the data and the accuracy of the data analysis. We would like to thank Dr. F. Berger, T. Flagan, H. Donovan, D. Leland, M. Mortezaei and B. Friedrich for assistance and support during data acquisition. We would like to thank Drs. Jennifer Stewart and Anna Konova for critical reviews of the manuscript.
Role of funding sources: This work was supported by grants from the National Institute on Drug Abuse (R01-DA016663, P20-DA027834, R01-DA027797, and R01-DA018307 as well as a VA Merit Grant to Martin Paulus). Sponsors played no role in the design, conduct of the study, collection, management, analysis, and interpretation of the data; or with preparation, review, or approval of the manuscript.
Footnotes
Supplementary material can be found by accessing the online version of this paper at http://dx.doi.org and by entering doi:…
Supplementary material can be found by accessing the online version of this paper at http://dx.doi.org and by entering doi:…
Contributors: Authors MW, SFT and MPP designed and implemented the study. Author JLG, TMB and MPP analyzed the data. All authors contributed to and have approved the final manuscript.
Conflict of interest: All authors declare that they have no conflicts of interest.
Publisher's Disclaimer: This is a PDF file of an unedited manuscript that has been accepted for publication. As a service to our customers we are providing this early version of the manuscript. The manuscript will undergo copyediting, typesetting, and review of the resulting proof before it is published in its final citable form. Please note that during the production process errors may be discovered which could affect the content, and all legal disclaimers that apply to the journal pertain.
References
- Baker A, Boggs TG, Lewin TJ. Randomized controlled trial of brief cognitive-behavioural interventions among regular users of amphetamine. Addiction. 2001;96:1279–1287. doi: 10.1046/j.1360-0443.2001.96912797.x. [DOI] [PubMed] [Google Scholar]
- Ball TM, Stein MB, Ramsawh HJ, Campbell-Sills L, Paulus MP. Single-Subject Anxiety Treatment Outcome Prediction using Functional Neuroimaging. Neuropsychopharmacology. 2013;39:1254–1261. doi: 10.1038/npp.2013.328. [DOI] [PMC free article] [PubMed] [Google Scholar]
- Balodis IM, Potenza MN. Anticipatory reward processing in addicted populations: a focus on the Monetary Incentive Delay Task. Biol Psychiatry. 2015;77:434–444. doi: 10.1016/j.biopsych.2014.08.020. [DOI] [PMC free article] [PubMed] [Google Scholar]
- Bechara A. Disturbances of emotion regulation after focal brain lesions. Intl Rev Neurobiol. 2004;62:159–193. doi: 10.1016/S0074-7742(04)62006-X. [DOI] [PubMed] [Google Scholar]
- Beck AT, Ward CH, Mendelson M, Mock J, Erbaugh J. An inventory for measuring depression. Arch Gen Psychiatry. 1961;4:561–571. doi: 10.1001/archpsyc.1961.01710120031004. [DOI] [PubMed] [Google Scholar]
- Berridge KC. From prediction error to incentive salience: mesolimbic computation of reward motivation. Eur J Neurosci. 2012;35:1124–1143. doi: 10.1111/j.1460-9568.2012.07990.x. [DOI] [PMC free article] [PubMed] [Google Scholar]
- Blum K, Gardner E, Oscar-Berman M, Gold M. “Liking” and “wanting” linked to Reward Deficiency Syndrome (RDS): hypothesizing differential responsivity in brain reward circuitry. Curr Pharm Des. 2012;18:113–118. doi: 10.2174/138161212798919110. [DOI] [PMC free article] [PubMed] [Google Scholar]
- Breiman L. Random forests. Mach Learn. 2001;45:5–32. [Google Scholar]
- Breiman L, Cutler A. Random Forests. [accessed on 2/25/15];2001 https://www.stat.berkeley.edu/~breiman/RandomForests/cc_home.htm.
- Brown J, Kranzler HR, Del Boca FK. Self-reports by alcohol and drug abuse inpatients: factors affecting reliability and validity. Br J Addict. 1992;87:1013–1024. doi: 10.1111/j.1360-0443.1992.tb03118.x. [DOI] [PubMed] [Google Scholar]
- Bucholz KK, Cadoret R, Cloninger CR, Dinwiddie SH, Hesselbrock VM, Nurnberger JI, Jr, Reich T, Schmidt I, Schuckit MA. A new, semi-structured psychiatric interview for use in genetic linkage studies: a report on the reliability of the SSAGA. J Stud Alcohol. 1994;55:149–158. doi: 10.15288/jsa.1994.55.149. [DOI] [PubMed] [Google Scholar]
- Cloninger CR. A systematic method for clinical description and classification of personality variants. A proposal. Arch Gen Psychiatry. 1987;44:573–588. doi: 10.1001/archpsyc.1987.01800180093014. [DOI] [PubMed] [Google Scholar]
- Connor JP, Symons M, Feeney GF, Young RM, Wiles J. The application of machine learning techniques as an adjunct to clinical decision making in alcohol dependence treatment. Subst Use Misuse. 2007;42:2193–2206. doi: 10.1080/10826080701658125. [DOI] [PubMed] [Google Scholar]
- Cox RW. AFNI: software for analysis and visualization of functional magnetic resonance neuroimages. Comput Biomed Res. 1996;29:162–173. doi: 10.1006/cbmr.1996.0014. [DOI] [PubMed] [Google Scholar]
- Craig AD. How do you feel--now? The anterior insula and human awareness. Nat Rev Neurosci. 2009;10:59–70. doi: 10.1038/nrn2555. [DOI] [PubMed] [Google Scholar]
- Ernst M, Bolla K, Mouratidis M, Contoreggi C, Matochik JA, Kurian V, Cadet JL, Kimes AS, London ED. Decision-making in a risk-taking task: a PET study. Neuropsychopharmacology. 2002;26:682–691. doi: 10.1016/S0893-133X(01)00414-6. [DOI] [PubMed] [Google Scholar]
- Fonzo GA, Flagan TM, Sullivan S, Allard CB, Grimes EM, Simmons AN, Paulus MP, Stein MB. Neural functional and structural correlates of childhood maltreatment in women with intimate-partner violence-related posttraumatic stress disorder. Psychiatry Res. 2013;211:93–103. doi: 10.1016/j.pscychresns.2012.08.006. [DOI] [PMC free article] [PubMed] [Google Scholar]
- Genuer R, Poggi JM, Tuleau-Malot C. Variable selection using random forests. Pattern Recognit Lett. 2010;31:2225–2236. [Google Scholar]
- Gowin JL, Harle KM, Stewart JL, Wittmann M, Tapert SF, Paulus MP. Attenuated insular processing during risk predicts relapse in early abstinent methamphetamine-dependent individuals. Neuropsychopharmacology. 2014a;39:1379–1387. doi: 10.1038/npp.2013.333. [DOI] [PMC free article] [PubMed] [Google Scholar]
- Gowin JL, Mackey S, Paulus MP. Altered risk-related processing in substance users: imbalance of pain and gain. Drug Alcohol Depend. 2013;132:13–21. doi: 10.1016/j.drugalcdep.2013.03.019. [DOI] [PMC free article] [PubMed] [Google Scholar]
- Gowin JL, Stewart JL, May AC, Ball TM, Wittmann M, Tapert SF, Paulus MP. Altered cingulate and insular cortex activation during risk-taking in methamphetamine dependence: losses lose impact. Addiction. 2014b;109:237–247. doi: 10.1111/add.12354. [DOI] [PMC free article] [PubMed] [Google Scholar]
- Hesselbrock M, Easton C, Bucholz KK, Schuckit M, Hesselbrock V. A validity study of the SSAGA--a comparison with the SCAN. Addiction. 1999;94:1361–1370. doi: 10.1046/j.1360-0443.1999.94913618.x. [DOI] [PubMed] [Google Scholar]
- Hunt WA, Barnett LW, Branch LG. Relapse rates in addiction programs. J Clin Psychol. 1971;27:455–456. doi: 10.1002/1097-4679(197110)27:4<455::aid-jclp2270270412>3.0.co;2-r. [DOI] [PubMed] [Google Scholar]
- Ihssen N, Cox WM, Wiggett A, Fadardi JS, Linden DE. Differentiating heavy from light drinkers by neural responses to visual alcohol cues and other motivational stimuli. Cereb Cortex. 2011;21:1408–1415. doi: 10.1093/cercor/bhq220. [DOI] [PubMed] [Google Scholar]
- Irvin JE, Bowers CA, Dunn ME, Wang MC. Efficacy of relapse prevention: a meta-analytic review. J Consult Clin Psychol. 1999;67:563–570. doi: 10.1037//0022-006x.67.4.563. [DOI] [PubMed] [Google Scholar]
- Janes AC, Pizzagalli DA, Richardt S, Frederick Bde B, Holmes AJ, Sousa J, Fava M, Evins AE, Kaufman MJ. Neural substrates of attentional bias for smoking-related cues: an FMRI study. Neuropsychopharmacology. 2010;35:2339–2345. doi: 10.1038/npp.2010.103. [DOI] [PMC free article] [PubMed] [Google Scholar]
- Jia Z, Worhunsky PD, Carroll KM, Rounsaville BJ, Stevens MC, Pearlson GD, Potenza MN. An initial study of neural responses to monetary incentives as related to treatment outcome in cocaine dependence. Biol Psychiatry. 2011;70:553–560. doi: 10.1016/j.biopsych.2011.05.008. [DOI] [PMC free article] [PubMed] [Google Scholar]
- Knutson B, Heinz A. Probing psychiatric symptoms with the monetary incentive delay task. Biol Psychiatry. 2015;77:418–420. doi: 10.1016/j.biopsych.2014.12.022. [DOI] [PubMed] [Google Scholar]
- Konova AB, Moeller SJ, Tomasi D, Parvaz MA, Alia-Klein N, Volkow ND, Goldstein RZ. Structural and behavioral correlates of abnormal encoding of money value in the sensorimotor striatum in cocaine addiction. Eur J Neursci. 2012;36:2979–2988. doi: 10.1111/j.1460-9568.2012.08211.x. [DOI] [PMC free article] [PubMed] [Google Scholar]
- Koob GF. Theoretical frameworks and mechanistic aspects of alcohol addiction: alcohol addiction as a reward deficit disorder. Curr top Behav Neurosci. 2013;13:3–30. doi: 10.1007/7854_2011_129. [DOI] [PMC free article] [PubMed] [Google Scholar]
- Kosten TR, O'Connor PG. Management of drug and alcohol withdrawal. New Engl J Med. 2003;348:1786–1795. doi: 10.1056/NEJMra020617. [DOI] [PubMed] [Google Scholar]
- Lancaster T, Hajek P, Stead LF, West R, Jarvis MJ. Prevention of relapse after quitting smoking: A systematic review of trials. Arch Intern Med. 2006;166:828–835. doi: 10.1001/archinte.166.8.828. [DOI] [PubMed] [Google Scholar]
- Leyton M, Vezina P. Striatal ups and downs: their roles in vulnerability to addictions in humans. Neurosci Biobehav Rev. 2013;37:1999–2014. doi: 10.1016/j.neubiorev.2013.01.018. [DOI] [PMC free article] [PubMed] [Google Scholar]
- Limbrick-Oldfield EH, van Holst RJ, Clark L. Fronto-striatal dysregulation in drug addiction and pathological gambling: Consistent inconsistencies? Neurolmage Clin. 2013;2:385–393. doi: 10.1016/j.nicl.2013.02.005. [DOI] [PMC free article] [PubMed] [Google Scholar]
- May AC, Stewart JL, Migliorini R, Tapert SF, Paulus MP. Methamphetamine dependent individuals show attenuated brain response to pleasant interoceptive stimuli. Drug Alcohol Depend. 2013;131:238–246. doi: 10.1016/j.drugalcdep.2013.05.029. [DOI] [PMC free article] [PubMed] [Google Scholar]
- McCrae RR, Costa PT. A contemplated revision of the NEO Five-Factor Inventory. Pers Indiv Diff. 2004;36:587–596. [Google Scholar]
- Mclellan AT, Alterman AI, Metzger DS, Grissom GR, Woody GE, Luborsky L, Obrien CP. Similarity of outcome predictors across opiate, cocaine, and alcohol treatments - role of treatment services. J Consult Clin Psych. 1994;62:1141–1158. doi: 10.1037//0022-006x.62.6.1141. [DOI] [PubMed] [Google Scholar]
- McLellan AT, Lewis DC, O'Brien CP, Kleber HD. Drug dependence, a chronic medical illness: implications for treatment, insurance, and outcomes evaluation. JAMA. 2000;284:1689–1695. doi: 10.1001/jama.284.13.1689. [DOI] [PubMed] [Google Scholar]
- National Institute of Drug Abuse. Principles of Drug Addiction Treatment: A Research Based Guide. National Institutes of Health; Bethesda, MD: 1999. [Google Scholar]
- Nicodemus KK, Callicott JH, Higier RG, Luna A, Nixon DC, Lipska BK, Vakkalanka R, Giegling I, Rujescu D, St Clair D, Muglia P, Shugart YY, Weinberger DR. Evidence of statistical epistasis between DISC1, CIT and NDEL1 impacting risk for schizophrenia: biological validation with functional neuroimaging. Hum Genet. 2010;127:441–452. doi: 10.1007/s00439-009-0782-y. [DOI] [PubMed] [Google Scholar]
- Patton JH, Stanford MS, Barratt ES. Factor structure of the Barratt impulsiveness scale. J Clin Psychol. 1995;51:768–774. doi: 10.1002/1097-4679(199511)51:6<768::aid-jclp2270510607>3.0.co;2-1. [DOI] [PubMed] [Google Scholar]
- Paulus MP, Rogalsky C, Simmons A, Feinstein JS, Stein MB. Increased activation in the right insula during risk-taking decision making is related to harm avoidance and neuroticism. Neuroimage. 2003;19:1439–1448. doi: 10.1016/s1053-8119(03)00251-9. [DOI] [PubMed] [Google Scholar]
- Paulus MP, Tapert SF, Schuckit MA. Neural activation patterns of methamphetamine-dependent subjects during decision making predict relapse. Arch Gen Psychiatry. 2005;62:761–768. doi: 10.1001/archpsyc.62.7.761. [DOI] [PubMed] [Google Scholar]
- Peters J, Bromberg U, Schneider S, Brassen S, Menz M, Banaschewski T, Conrod PJ, Flor H, Gallinat J, Garavan H, Heinz A, Itterman B, Lathrop M, Martinot JL, Paus T, Poline JB, Robbins TW, Rietschel M, Smolka M, Strohle A, Struve M, Loth E, Schumann G, Buchel C. Lower ventral striatal activation during reward anticipation in adolescent smokers. Am J Psychiatry. 2011;168:540–549. doi: 10.1176/appi.ajp.2010.10071024. [DOI] [PubMed] [Google Scholar]
- Pierucci-Lagha A, Gelernter J, Feinn R, Cubells JF, Pearson D, Pollastri A, Farrer L, Kranzler HR. Diagnostic reliability of the Semi-structured Assessment for Drug Dependence and Alcoholism (SSADDA) Drug Alcohol Depend. 2005;80:303–312. doi: 10.1016/j.drugalcdep.2005.04.005. [DOI] [PubMed] [Google Scholar]
- Schmitz JM, Stotts AL, Rhoades HM, Grabowski J. Naltrexone and relapse prevention treatment for cocaine-dependent patients. Addict Behav. 2001;26:167–180. doi: 10.1016/s0306-4603(00)00098-8. [DOI] [PubMed] [Google Scholar]
- Schouw ML, De Ruiter MB, Kaag AM, van den Brink W, Lindauer RJ, Reneman L. Dopaminergic dysfunction in abstinent dexamphetamine users: results from a pharmacological fMRI study using a reward anticipation task and a methylphenidate challenge. Drug Alcohol Depend. 2013;130:52–60. doi: 10.1016/j.drugalcdep.2012.10.010. [DOI] [PubMed] [Google Scholar]
- Stewart JL, Connolly CG, May AC, Tapert SF, Wittmann M, Paulus MP. Striatum and insula dysfunction during reinforcement learning differentiates abstinent and relapsed methamphetamine-dependent individuals. Addiction. 2014;109:460–471. doi: 10.1111/add.12403. [DOI] [PMC free article] [PubMed] [Google Scholar]
- Strobl C, Malley J, Tutz G. An introduction to recursive partitioning: rationale, application, and characteristics of classification and regression trees, bagging, and random forests. Psychol Methods. 2009;14:323–348. doi: 10.1037/a0016973. [DOI] [PMC free article] [PubMed] [Google Scholar]
- Talairach J, Tournoux P. Co-Planar Stereotaxic Atlas Of The Human Brain : 3-Dimensional Proportional System : An Approach To Cerebral Imaging. Georg Thieme; Stuttgart ; New York: 1988. [Google Scholar]
- Uttl B. North American Adult Reading Test: age norms, reliability, and validity. J Clin Exp Neuropsychol. 2002;24:1123–1137. doi: 10.1076/jcen.24.8.1123.8375. [DOI] [PubMed] [Google Scholar]
- Volkow ND, Baler RD. Brain imaging biomarkers to predict relapse in alcohol addiction. JAMA Psychiatry. 2013;70:661–663. doi: 10.1001/jamapsychiatry.2013.1141. [DOI] [PMC free article] [PubMed] [Google Scholar]
- Volkow ND, Fowler JS. Addiction, a disease of compulsion and drive: involvement of the orbitofrontal cortex. Cereb Cortex. 2000;10:318–325. doi: 10.1093/cercor/10.3.318. [DOI] [PubMed] [Google Scholar]
- Volkow ND, Fowler JS, Wang GJ. Role of dopamine in drug reinforcement and addiction in humans: results from imaging studies. Behav Pharmacol. 2002;13:355–366. doi: 10.1097/00008877-200209000-00008. [DOI] [PubMed] [Google Scholar]
- Weinstein L, Radano TA, Jack T, Kalina P, Eberhardt JS., 3rd Application Of Multivariate Probabilistic (Bayesian) Networks To Substance Use Disorder Risk Stratification And Cost Estimation. Perspectives In Health Information Management / AHIMA, American Health Information Management Association. 2009;6:1b. [PMC free article] [PubMed] [Google Scholar]
- Whelan R, Garavan H. When optimism hurts: inflated predictions in psychiatric neuroimaging. Biol Psychiatry. 2013;75:746–748. doi: 10.1016/j.biopsych.2013.05.014. [DOI] [PubMed] [Google Scholar]
- Wittmann M, Leland DS, Paulus MP. Time and decision making: differential contribution of the posterior insular cortex and the striatum during a delay discounting task. Exp Brain Res. 2007;179:643–653. doi: 10.1007/s00221-006-0822-y. [DOI] [PubMed] [Google Scholar]
- Zuckerman M. Item revisions in the Sensation Seeking Scale form V (SSS-V) Pers Indiv Differ. 1996;20:515. [Google Scholar]
Associated Data
This section collects any data citations, data availability statements, or supplementary materials included in this article.