

Abstract
Temporal lobe epilepsy (TLE) often is associated with progressive changes to seizures, memory, and mood during its clinical course. However, the cerebral changes related to this progression are not well understood. Because the changes may be related to changes in brain networks, we used functional connectivity MRI (fcMRI) to determine whether brain network parameters relate to the duration of TLE. Graph theory based analysis of the sites of reported regions of TLE abnormality, was performed on resting state fMRI data in 48 subjects: 24 controls, 13 patients with left TLE, and 11 patients with right TLE. Various network parameters were analyzed including betweenness centrality (BC), clustering coefficient (CC), path length (PL), small-world index (SWI), global efficiency (GE), connectivity strength (CS), and connectivity diversity (CD). These were compared for TLE as a group, compared to controls, and for left and right TLE separately. Association of changes in network parameters with epilepsy duration was also evaluated. We found that CC, CS and CD were decreased in TLE, compared to control subjects. Analyzed according to epilepsy duration, TLE showed a progressive reduction in CD. In conclusion, we found that several network parameters were decreased in TLE compared to controls, which suggested reduced connectivity in TLE. Reduction in CD associated with epilepsy duration suggests a homogenization of connections over time in TLE, indicating a reduction of the normal repertoire of stronger and weaker connections to other brain regions.
Keywords: Temporal Lobe Epilepsy (TLE), Progressive changes, Hippocampal networks, fMRI, Functional Connectivity, Epileptic Networks
1. Introduction
Although temporal lobe epilepsy (TLE) may be effectively treated by a focal temporal lobe resection, it has been found to have widespread extratemporal involvement in both the ictal and interictal states [1]. This suggests a more widespread network abnormality present across brain regions, which has been identified as extra-temporal structural and functional abnormalities using MRI [2], EEG [3], neuropsychology testing [4], functional MRI (fMRI) [5], diffusion tensor imaging (DTI) [6], single photon emission computed tomography (SPECT) and positron emission tomography (PET) studies [7]. The extension of disease outside the epileptogenic zone may be contributory to the incomplete control of seizures in up to 30% of the patients who undergo surgical treatment of TLE [8] as well as the cognitive and neurobehavioral changes in TLE [9].
Functional connectivity MRI (fcMRI) has identified network level abnormalities in TLE in the interictal state through various techniques of studying brain networks collectively called “connectomics” [10-13]. Unlike techniques based on pair-wise comparisons such as seed-based methods and independent component analysis, graph theory takes into account the full brain network structure by providing a model represented by a collection of nodes and edges and deriving specific network topological properties. This enables the study of individual nodes as well as the network as a whole [14]. The different connectivity techniques examine different aspects of network structure and have their own particular strengths and limitations. Early encouraging findings suggest that topologic measures by graph theory analysis may improve clinical interpretability [15]. As would be expected, TLE has shown several network changes that help explain the underlying pathophysiology, and has been shown to have a clinical utility [16]. Progressive changes in the brain network of TLE have been previously shown using graph analysis of structural MRI, DTI, and EEG [17-19], but have not been explored using fMRI connectivity.
In this study we used graph theoretic analysis of fcMRI data in patients with TLE and healthy controls to (1) detect abnormal network parameters in TLE compared to healthy controls, (2) evaluate whether these changes are correlated with duration of TLE, and (3) evaluate whether such network changes differ with the lateralization of TLE.
2. Materials and Methods
2.1.Subjects
The study population of 48 subjects included 13 with left TLE, 11 with right TLE, and 24 controls (Table 1). Written informed consent was obtained prior to scanning from all subjects in accordance with guidelines of the University of California, Los Angeles (UCLA) Institutional Review Board. Control subjects had normal structural MRIs and none had a history of neurologic illness or were taking a neurologic medication. Epilepsy subjects were recruited from the UCLA Seizure Disorder Center following comprehensive diagnostic testing and subsequent anterior-mesial temporal lobe resective epilepsy surgery. The diagnostic evaluation for all subjects included video-EEG monitoring, high resolution MRI, FDG-PET scanning, neuropsychological testing, and post-operative examination of the resected tissue.
Table 1.
Demographic data for left and right TLE patients.
| Age | Sex | Handedness | Sz onset age (yr) | Sz duration (yr) | Sz freq (/m) | AEDs | MRI | Pathology | Sz free at last visit | Time since surgery (m) | Neuropsycholog y memory dysfunction |
|---|---|---|---|---|---|---|---|---|---|---|---|
| Left TLE | |||||||||||
| 40 | M | R | 20 | 20 | 1 | LTG, OXC | Normal | Normal | Yes | 48 | Normal |
| 40 | M | R | 4 | 36 | 3 | LEV, LTG | L MTS | MTS + CD | Yes | 48 | V > NV |
| 35 | F | R | 6 | 29 | 2 | CBZ, LEV, LTG | L MTS | Gliosis | Yes | 31 | B (L>R) TL dysfunction |
| 23 | F | R | 17 | 6 | 7 | PHT | L MTS | CD | Yes | 45 | V |
| 20 | F | R | 12 | 8 | 7 | VPA, PGB | Normal | CD | Yes | 25 | Normal |
| 27 | F | L | 9 | 18 | 1 | PHT, LTG, LEV | L MTS | CD | Yes | 48 | V |
| 46 | F | L | 1 | 45 | 5 | LTG, LCM | L MTS | CD | Yes | 36 | NV + V |
| 45 | M | L | 40 | 5 | 2 | LEV | L MTS | Normal | Yes | 27 | NV + V |
| 30 | M | R | 14 | 16 | 5 | LEV, CBZ, LCM | L anterior temporal signal abnormality | CD | Yes | 18 | V |
| 52 | M | R | 46 | 6 | 60 | PHT, LMG | L MTS + anterior temporal CD | HS | Yes | 25 | V |
| 21 | F | L | 15 | 6 | 2 | OXC, LCM | L ant temp encephalocele | Gliosis | Yes | 22 | Normal |
| 36 | F | R | 32 | 4 | 1 | LEV, LTG, TPM | L hipp CD | Insuff. sample | Yes | 12 | V |
| 63 | F | R | 31 | 32 | 3 | LCM, ZNS | L ant temp cav malf | Cavernous malformation | Yes | 18 | NV |
| Right TLE | |||||||||||
| 34 | M | R | 15 | 19 | 2 | LTG | R MTS | Gliosis | Yes | 20 | NV |
| 34 | F | R | 14 | 20 | 60 | LEV, LTG | R temp hyperintensity | Gliosis | No | 20 | NV |
| 52 | M | R | 47 | 5 | 1 | LEV | R temp CD | CD | No | 17 | NV > V |
| 53 | F | R | 45 | 8 | 6 | OXC | Normal | mild cortical disorganization | Yes | 18 | NV > V |
| 43 | M | R | 41 | 2 | 1 | LEV, LTG | N | - | no surg. | NA | |
| 45 | F | R | 36 | 9 | 2 | VPA, LCM | Hipp. malformation | Gliosis | Yes | 7 | NA (non-english speaking) |
| 40 | M | R | 20 | 20 | 3 | VPA, LCM | R amygdala hypertrophy | Insuff. sample | Yes | 32 | NV>V |
| 39 | M | R | 8 | 31 | 2 | LTG, LEV | R MTS | Gliosis | Yes | 25 | Normal |
| 20 47 | M M | R R | 1 10 | 19 37 | 2 2 | OXC, LCM VPA, LEV | Bilateral hipp. atrophy R MTS | Gliosis HS | No Yes | 3 23 | NV NV |
| 37 | M | R | 4 | 33 | 3 | TPM, LTG, LEV, CBZ | R MTS | HS, CD | Yes | 12 | NV |
CBZ- Carbamazepine, CD- Cortical Dysplasia, Hipp-hippocampal, L-left, LEV- Levetiracetam, LTG-Lamotrigine, MTS- Mesial Temporal Sclerosis, NV-non-verbal, OXC- Oxcarbazepine, PB-Phenobarbital, PGB- Pregabalin, PHT- Phenytoin, R- right, SF- Seizure free (without surgery), Sz-seizure, TBD- to be determined-(these are patients with surgery who have not returned for follow up visits), VPA- Valproate, V-verbal.
2.2.Imaging and Functional Connectivity
fMRI was performed after the comprehensive epilepsy surgery evaluation and prior to epilepsy surgery. Patients remained on their regular medications during the fMRI. None of the patients had a seizure in the 24 hours preceding the imaging. Participants were instructed to relax with eyes closed during imaging. No auditory stimulus was present except for the acoustic noise from imaging. None of the patients had seizures during the study as confirmed by the simultaneous EEG obtained during fMRI. The EEG results were not included in the data analysis other than to exclude seizures. Details of the simultaneous EEG methods have been described previously [20]. Neuroimaging and fMRI pre-preprocessing steps are similar to that described by us previously [5]. Imaging was performed with a 3T MRI system (Siemens Trio, Erlangen, Germany). Functional imaging was performed with the following parameters: TR=2000 ms, TE=30 ms, FOV=210 mm, matrix= 64 × 64, slice thickness 4 mm, 34 slices. High-resolution structural images were obtained during the same imaging study with the parameters: TR=20 ms, TE=3 ms, FOV = 256 mm, matrix = 256 × 256, slice thickness 1 mm, 160 slices. The images were acquired in the axial plane using a spoiled gradient recalled (SPGR) sequence for the anatomical images and an echo planar imaging (EPI) sequence for the functional images. The imaging sessions included multiple simultaneous EEG and fMRI recordings, each lasting 5 to 15 minutes. For resting state fMRI analysis, 20 minutes of BOLD fMRI data was used for each subject. Average head movement for the subject groups were as follows: healthy controls 0.24 mm, left TLE 0.25 mm, and right TLE 0.34 mm. Excessive head movement was corrected using “motion scrubbing” [21]. Tissue-type segmentation was performed on each participant's structural image using FAST (FMRIB's Automated Segmentation Tool) [22], before being aligned to their respective BOLD images. White matter signal and cerebrospinal fluid signals were obtained using the segmented masks. The following were included as temporal covariates and regressed out using linear regression: 6 motion parameters, white matter signal, cerebrospinal fluid signal, and their associated derivatives. The residuals were then filtered through a low pass filter (<0.1 Hz).
The subsequent analysis pipeline is graphically summarized in Figure 1 and is detailed below. After registration to the MNI template image, functional connectivity was estimated between ten pairs of bilateral regions of interest of reported abnormality in TLE. These regions were chosen based on a priori knowledge, as these regions have consistently demonstrated both structural and functional changes in TLE, and included the anterior cingulate gyrus, caudate, fusiform gyrus, hippocampus, inferior orbitofrontal gyrus, insula, parahippocampus, posterior cingulate gyrus, superior temporal gyrus, and thalamus [23, 24]. The regions analyzed include regions identified consistently as having atrophy in patients with TLE [23] across different studies, and those that could be analyzed using the automated anatomic labeling (AAL) atlas. In choosing these regions, we also follow the example of prior graph theoretic literature in TLE [25]. Regions of interest were first mapped to BOLD space using the AAL atlas. For each region, the residual time series over all voxels were averaged to obtain a representative residual time series. Functional connectivity was estimated through the Pearson correlation coefficient between residual time series for all node pairs.
Figure 1. Schematic showing typical steps involved in graph theory analysis to quantitate connectivity parameters in functional MRI data.
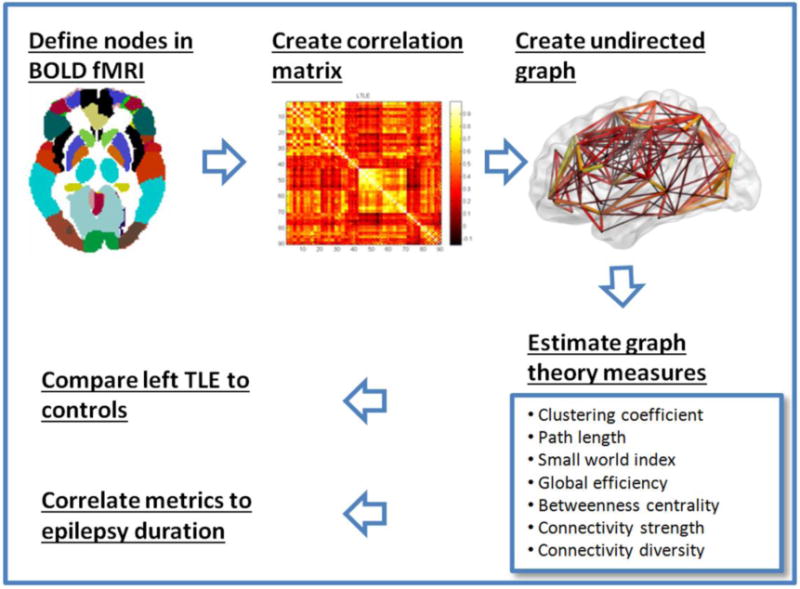
[24, 34, 48]. (A) Nodes and edges are delineated. Nodes are defined using existing brain parcellation schema. Here, we use the automated anatomic labeling (AAL) atlas, which has 90 brain regions (nodes). Edges are defined by the strength of functional connectivity between the nodes. (B) An adjacency matrix composed of correlations between all 90 nodes to each other is constructed. A 90×90 matrix is generated where the color intensity correlates with the strength of the connection between the nodes. Lighter colors indicate greater connectivity in this example. (C) The values of the adjacency matrix are thresholded to create a 3-D graph of the brain network. (D) Using this set of edges, estimates of different brain topology characteristics can be calculated. (E) Correlations were calculated between the altered metrics from D between healthy controls and TLE, left TLE and right TLE. (F) Correlations of the altered metrics to epilepsy duration was also performed.
2.3.Graph Theory Analyse
Figure 1 outlines the details of graph theory analysis, and our approach in this study. Including only non-negative correlations, correlation matrices were thresholded across a series of biologically plausible connection densities to create a range of potential binary undirected graphs of the brain's functional network [15]. Negative correlations comprised 36.0% (LTLE), 40.6% (RTLE), and 37.6% (HC) of the correlation matrices (χ2=1.80, df=2, p=0.41). Because brain topology is clearest in low-cost networks with connection densities less than about 0.5 [15], the network was binarized across a range of thresholds from 0 to 0.5, in increments of 0.01. Next, graph theory metrics were calculated for each binarized graph using the brain connectivity toolbox [26] and averaged across the nonrandom connection density range calculated as the subset of biologically plausible connection densities yielded fully connected, small-world graphs. We estimated this range as the range of connection densities such that (1) ≥95% of nodes were connected (i.e. degree>1 for ≥95% of nodes) and (2) small-world index (SWI) > 1 [15, 27, 28]. These criteria ensured the exclusion of fragmented graphs, in order for information to percolate freely through networks, as well as the exclusion of graphs which did not possess small-world topology, based on small-worldness as a property of human brain networks [15]. This resulted in a non-random connection density range of 0.39- 0.50. Comparison of groups across this range allowed the comparison of network properties between patient subgroups and controls to reflect differences in connectome organization, rather than differences in absolute connectivity.
2.4.Graph Theory Metric
Using the above, the following graph theory metrics were calculated:
2.4.1. Normalized clustering coefficient (CC)
the ratio between the number of existing connections for a node to the number of possible connections between its immediately adjacent nodes. The CC of a network is the average of the CC of all nodes.
2.4.2. Normalized characteristic path length (PL)
the mean of the shortest path lengths between all pairs of nodes. Lower values indicate a higher level of network communication efficiency.
2.4.3. Small-world index (SWI)
the ratio of CC/PL. Small-world networks typically have SWI >1 [29].
2.4.4. Global efficiency (GE)
the average nodal efficiency across all nodes within the whole network that we tested. Nodal efficiency is the mean of the inverse shortest path length from a given node to all other nodes. Higher GE indicates higher efficiency in inter-regional communication.
2.4.5. Betweenness centrality (BC)
the fraction of all shortest paths in the network that contain the given node, as determined for each region. The average BC of the network was calculated as the average BC over all nodes in the network.
Further details on calculation of 2.4.1-2.4.5 are provided in Supplementary Methods.
2.5.Functional Connectivity Metrics
Weighted measures of the raw functional connectivity values included connectivity strength (CS) and connectivity diversity (CD). Connectivity strength was calculated as the mean of all pairwise correlations and provides an estimate of how strongly a node is connected to the rest of the brain on average. Regional connectivity diversity is the variance of the correlations between one region and all other regions and represents a measure of variability in inter-regional connections. Global () connectivity diversity is the mean regional connectivity diversity across all regions in the analysis. Further details on calculation of CS and CD are provided in Supplementary Methods.
2.6.Differences between TLE and controls
Differences between TLE subgroups (combined, as well as individually for right and left TLE) and controls for the different measures were assessed using FDR-corrected permutation testing with 1000 resamples at the α=0.05 level of significance [30]. Observations were excluded as outliers if located outside 1.5 times the interquartile range above/below the upper/lower quartiles [31].
2.7.Correlation with duration
Epilepsy duration was determined from the year when the first habitual seizure occurred to the time of fMRI. Influential observations with a Cook's distance of >1 and outlying observations with values of graph theory metrics outside 1.5 times the interquartile range above/below the upper/lower quartiles were removed [31, 32]. In order to adjust the estimates of correlation between epilepsy duration and topology measures for the possible influence of age as a confounding variable, the change-in-estimate (CE) criterion was used, with covariates considered to be confounders if the Pearson correlation changed by more than 10% when the covariate was added to the model. The CE criterion is less influenced by sample size than use of significance testing criteria for confounder identification [33]. For correlation estimates that demonstrated significant association with age, the partial Pearson correlation coefficient was used to control for age while evaluating the relationship between graph theory measures and epilepsy duration. For all other measures, Pearson's correlation coefficient was used. All tests were performed at the FDR-corrected α=0.05 level of significance [30]. Epilepsy duration for control subjects was set to zero.
3. Results
Demographics of healthy controls and patients with left and right TLE are provided in Tables 1 and 2. The control group was entirely right-handed. Although the TLE patient group had four left-handed subjects, only one of them was found during an intra-carotid amobarbital procedure to have right hemisphere dominance for language. Therefore, the groups were similar with respect to hemispheric dominance. The TLE and control groups had similar ages.
Table 2.
Summary demographic details for the subject groups. (M- male, F- female, R- right, L-left, y- year, SD- standard deviation)
| Control (n=24) | Left TLE (n=13) | Right TLE (n=11) | p value | |
|---|---|---|---|---|
| Gender (M/F) † | 16/8 | 5/8 | 8/3 | 0.16 |
| Handedness (R/L) † | 24/0 | 9/4 | 11/0 | 0.003* |
| Age (y, mean±SD) | 32.5±9.3 | 36.8±12.8 | 40.4±9.4 | 0.26 |
| Epilepsy onset age (y, mean±SD) ∫ | - | 19.0±14.1 | 21.9±17.1 | 0.73 |
| Epilepsy duration (y, mean±SD) ∫ | - | 17.8±13.8 | 18.5±11.7 | 0.66 |
| Seizure frequency (per mo, mean±SD) ∫ | - | 7.6±15.9 | 7.6±17.4 | 0.57 |
Significant at α=0.05 level
Chi-squared exact test
Mann-Whitney U test
3.1.Group-wise comparison of TLE with controls (Figure 2A-C, Table 3, and supplementary Table 1)
Figure 2.
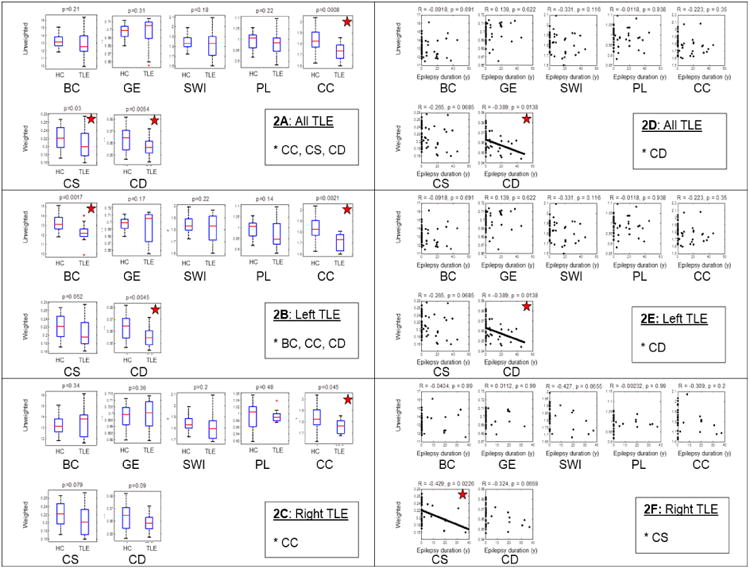
Comparison of network parameters in all patients with TLE, and separately in left and right TLE, compared to controls. 2A-2C: Groupwise comparison showing differences between healthy controls (HC) and TLE. 2D-2F: Association of network parameters (y-axis) with duration of epilepsy (x-axis). p values shown are after multiple testing (FDR) correction, and are starred where significant. (CC- clustering coefficient; PL- path length; SWI- small world index; GE- global efficiency; CS- connectivity strength; CD- connectivity diversity; BC- betweenness centrality; LTLE-left TLE; RTLE- right TLE).
Table 3.
Unweighted connectivity metrics for healthy controls and TLE subgroups. BC, GE, SWI, CC, and PL are averaged over the nonrandom connection density range.
| Network measure | Controls (mean + SE) | Combined TLE (mean + SE) | Left TLE (mean + SE) | Right TLE (mean + SE) |
|---|---|---|---|---|
| Betweenness centrality (BC) | 13.25+0.83 | 12.96+1.50 (p=0.21) | 12.22+1.02* (p=0.002) | 13.40+1.36 (p=0.34) |
| Global efficiency (GE) | 0.70+0.008 | 0.70+0.02 (p=0.31) | 0.69+0.02 (p=0.17) | 0.70+0.01 (p=0.36) |
| Small-world index (SWI) | 1.84+0.07 | 1.81+0.11 (p=0.18) | 1.82+0.11 (p=0.22) | 1.81+0.12 (p=0.20) |
| Characteristic path length (PL) | 0.99+0.04 | 0.98+0.05 (p=0.22) | 0.97+0.06 (p=0.14) | 0.99+0.02 (p=0.48) |
| Clustering coefficient (CC) | 1.83+0.11 | 1.73+0.07* (p<0.001) | 1.71+0.08* (p=0.002) | 1.76+0.06* (p=0.045) |
Significantly different from controls at 0.05 level of significance after FDR corrected permutation testing with 1000 resamples. p-values shown are after multiple testing correction.
Comparison of connectivity metrics showed decreased clustering coefficient, connectivity strength, and connectivity diversity in combined right and left TLE groups compared to the control group. The left TLE subgroup showed decreased clustering coefficient, connectivity diversity, and betweenness centrality compared to controls, while the right TLE patients showed a decrease in clustering coefficient alone.
3.2.Correlation of change in network parameters with epilepsy duration (Figure 2D-F)
Evaluation of global metrics correlated with disease duration showed a decrease in connectivity diversity with longer epilepsy duration in combined right and left TLE groups. This decrease in connectivity diversity also was present for the left TLE group, while a decrease in connectivity strength correlated with epilepsy duration for the right TLE group.
4. Discussion
Using fcMRI and graph theoretic methods, we identified several network parameter abnormalities within the sites of known TLE abnormality. We also identified a correlation between epilepsy duration and connectivity. Specifically, we found a decrease in clustering coefficient, connectivity strength, and connectivity diversity in TLE, compared to healthy controls. Left TLE showed similar changes, with additional decrease in whole-network betweenness centrality. Meanwhile, the only change in right TLE, compared to controls, was a marginally significant reduction in clustering coefficient.
Clustering coefficient is a measure of local connectivity and has been reported in TLE to be both increased as well as decreased [34]. We identified a decrease in clustering coefficient in TLE compared to healthy controls, suggesting a decrease in local connectivity for this study population within the network examined. Notably, studies in TLE have shown variability in clustering coefficient, which should therefore be interpreted with caution. Several factors may explain why clustering coefficient in TLE varies between different studies, including differences in age, pathology, diagnostic/evaluation criteria, medications, and analytic methods [34]; however, the potentially most important factor in such variability is the use of global (whole brain) functional connectivity analysis in many of the reported studies. Whole brain analyses have been found to produce more variable results than analyses of structurally connected regions [35]. For this reason, we have confined our analysis to the sites of known abnormality in TLE. Reduced clustering coefficient suggests reduced “cliquishness”, or interconnectivity between neighboring nodes, for the nodes of the network we examined in TLE [34]. This may be the result of pathology and/or abnormal signals altering the connectivity between the various limbic regions in TLE.
Connectivity strength provides an estimate of how strongly nodes are connected to others within the network being investigated. Our finding of reduced CS in TLE suggests reduced functional connectivity between nodes within the regions we examined. The hippocampus is a key component of the limbic network and was identified as dysfunctional in epilepsy, which may produce a loss of connections to other regions of the network. Previous fcMRI studies have shown a similar loss of CS in TLE and this was found to be primarily due to loss of ipsilateral hippocampal and parahippocampal connectivity [36]. The limbic system and default mode network (DMN) have anatomic overlap, and previous work by us and others have shown reduced DMN connectivity in TLE [10, 12]. Although a reduced CS was not seen in right TLE, there was evidence of a progressive reduction in CS over time. This suggests that similar changes occur in right TLE, but which was less marked than in left TLE. Reduced connectivity strength is also an indication of reduced overall connectivity in TLE.
Connectivity diversity is the variance of the correlations between the nodes of the network and represents variability in inter-regional connections. The finding of reduced CD suggests a homogenization of the normal diversity of connections between the nodes of the network we examined. This could presumably be from weakening of the stronger connections, or strengthening of weaker connections. Although our analysis was not able to make this distinction, our finding of reduced CS suggests that this is likely from a weakening of stronger connections. CD has previously not been investigated in TLE, but has been found to increase with aging [37] and in schizophrenia [27]. A different method of assessing homogeneity in functional connectivity, regional homogeneity analysis, has previously shown increased homogeneity in the posterior cingulate and medial temporal regions in patients with pediatric TLE [38]. Similarly, higher regional homogeneity within the thalamus has been shown in generalized epilepsy [39]. We were able to see a progressive decline in CD correlated to duration of disease in left TLE, and in all patients with TLE. TLE is a progressive disease and progression of mesial temporal structural changes is correlated with seizure burden [40]. The network structure in TLE appears to also undergo progression and reorganization over time [41]. Prior work using seed based functional connectivity analysis has revealed reduced functional independence of the presumed ipsilateral ictal network from midline networks in TLE [42], which may also indicate progressive homogenization (less independence) over time using a different analysis approach. This reduced independence may also be the reason for the observed progressive increase in cross-hippocampal connectivity with longer duration in TLE [43]. This neuroimaging measure of disease progression could potentially serve as an objective measure of left TLE disease burden.
We were not able to see a progression of CC or PL in TLE, which is consistent with previous studies that failed to show a progression of these parameters in epilepsy using DTI [19]. Our similar results using fcMRI indicates cross-modality agreement of results. However, one prior study examining serial changes of structural MRI in TLE determined progressive increase in path length [17]. Betweenness centrality, a measure of “hub-ness” of networks, was found to be reduced in left TLE. Hubs of network are regions of high information transfer within networks, and as such are critical in the efficient transformation of information between brain regions.
Redistribution of network hubs in TLE has been noted previously [17, 25, 44, 45]. It is likely that structural damage causes hub disruption, with the development of new hubs to restore the disturbed efficiency of brain communication.
We found lateralized differences in network changes between left and right TLE. Differences based on TLE lateralization has previously been noted by us and others [10, 24, 45], and could suggest a possible difference in the pathophysiology of these conditions. It has been previously noted that there may be more prominent connectivity changes in left TLE compared to right TLE [10, 11, 46]. However, given the small numbers and the diversity of TLE, larger studies on more homogeneous TLE subgroups are needed to verify these findings.
Limitations
The major limitation of this study is its cross-sectional design: progressive network changes were not analyzed by serial scans, but inferred based on a cross-sectional evaluation of a homogenous population with consideration of the epilepsy duration. Although other investigators have also used this approach [18], there is an assumption that the network changes are progressing uniformly across patients. However, the identification of a correlation with duration indicates that the progressive changes seen are a robust feature across subjects, and across differing seizure burdens. Follow-up studies with serial scans would be useful in confirming this result and determining whether the result differs according to clinical features within TLE. Generalizability of these results is limited by the sample sizes.
The effects of anti-epileptic drugs (AEDs) on graph metrics are unclear. Although prior work has suggested that AEDs may reduce clustering coefficient and increase path length [19, 47], the differences between the various AEDs on network graph parameters are unknown at this time. No systematic difference in AEDs was found in our subject group. Older age has been reported to be associated with a lower clustering coefficient and higher path length [19] although age was not identified as a confounder in the association between epilepsy duration and clustering coefficient or path length in this study.
Conclusions
Graph theory analysis of neuroimaging can be used to query brain networks in various neurological conditions. We found a decrease of connectivity diversity with longer duration of disease course in TLE, and this may have diagnostic, therapeutic and prognostic implications. Moreover, more rapid network changes may be an early marker of a more severe disease course and slower network changes may indicate a slowing of progression. Better correlation of network topology measures to various disease characteristics such as seizure frequency, epilepsy duration cognitive dysfunction, and neuro-behavioral abnormality may clarify the neurobiology of TLE and help in developing a non-invasive biomarker to benefit its medical and surgical treatment.
Supplementary Material
Highlights.
Graph theory based analysis of the limbic network resting state fMRI was performed.
Several network parameters were decreased in TLE suggesting reduced connectivity.
Connectivity diversity loss with longer duration suggests homogenization over time.
Acknowledgments
Funding/ support for this research was provided by (1) The Epilepsy Foundation of America (ZH); (2) Baylor College of Medicine Computational and Integrative Biomedical Research Center (CIBR) Seed Grant Awards (ZH); (3) Baylor College of Medicine Junior Faculty Seed Funding Program Grant (ZH); (4) the National Library of Medicine Training Fellowship in Biomedical Informatics, Gulf Coast Consortia for Quantitative Biomedical Sciences (Grant #2T15LM007093-21) (SC); (5) the National Institute of Health (Grant #5T32CA096520-07) (SC); (6) NIH Grants P01 NS02808, R01 NS33310, and U01 NS42372 (JE); (7) NIH-NINDS K23 Grant NS044936 (JMS); (8) The Leff Family Foundation (JMS). Data acquisition was assisted by Elizabeth Pierce (UCLA).
Abbreviations
- fcMRI
Functional connectivity MRI
- BC
Betweenness centrality
- CC
Clustering coefficient
- PL
Path length
- SWI
Small-world index
- GE
Global efficiency
- CS
Connectivity strength
- CD
Connectivity diversity
Footnotes
Disclosures and conflicts of interest: 1. Dr Engel has patents WO 2009/123734A1, and WO 2009/123735A1, receives royalties from MedLink, Wolters Kluwer, Blackwell, and Elsevier, and has received honoraria from Medtronics, Wolters Kluwer, and Best Doctors.
2. Dr. Stern has served as a paid consultant for UCB, Lundbeck and Sunovion. Dr. Stern is an editor of MedLink Neurology, and has received royalties from Wolters Kluwer and from McGraw-Hill
3. The remaining authors have no disclosures/ conflicts of interest
We confirm that we have read the Journal's position on issues involved in ethical publication and affirm that this report is consistent with those guidelines.
Publisher's Disclaimer: This is a PDF file of an unedited manuscript that has been accepted for publication. As a service to our customers we are providing this early version of the manuscript. The manuscript will undergo copyediting, typesetting, and review of the resulting proof before it is published in its final citable form. Please note that during the production process errors may be discovered which could affect the content, and all legal disclaimers that apply to the journal pertain.
References
- 1.Spencer SS. Neural networks in human epilepsy: evidence of and implications for treatment. Epilepsia. 2002;43:219–27. doi: 10.1046/j.1528-1157.2002.26901.x. [DOI] [PubMed] [Google Scholar]
- 2.Lin JJ, Salamon N, Lee AD, Dutton RA, Geaga JA, Hayashi KM, Luders E, Toga AW, Engel J, Jr, Thompson PM. Reduced neocortical thickness and complexity mapped in mesialtemporal lobe epilepsy with hippocampal sclerosis. Cereb Cortex. 2007;17:2007–18. doi: 10.1093/cercor/bhl109. [DOI] [PubMed] [Google Scholar]
- 3.Bartolomei F, Wendling F, Regis J, Gavaret M, Guye M, Chauvel P. Pre-ictal synchronicity in limbic networks of mesial temporal lobe epilepsy. Epilepsy Res. 2004;61:89–104. doi: 10.1016/j.eplepsyres.2004.06.006. [DOI] [PubMed] [Google Scholar]
- 4.Hermann BP, Seidenberg M, Haltiner A, Wyler AR. Mood state in unilateral temporal lobe epilepsy. Biol Psychiatry. 1991;30:1205–18. doi: 10.1016/0006-3223(91)90157-h. [DOI] [PubMed] [Google Scholar]
- 5.Haneef Z, Lenartowicz A, Yeh HJ, Levin HS, Engel J, Jr, Stern JM. Functional connectivity of hippocampal networks in temporal lobe epilepsy. Epilepsia. 2014;55:137–45. doi: 10.1111/epi.12476. [DOI] [PMC free article] [PubMed] [Google Scholar]
- 6.Bonilha L, Helpern JA, Sainju R, Nesland T, Edwards JC, Glazier SS, Tabesh A. Presurgical connectome and postsurgical seizure control in temporal lobe epilepsy. Neurology. 2013;81:1704–10. doi: 10.1212/01.wnl.0000435306.95271.5f. [DOI] [PMC free article] [PubMed] [Google Scholar]
- 7.Nelissen N, Van Paesschen W, Baete K, Van Laere K, Palmini A, Van Billoen H, Dupont P. Correlations of interictal FDG-PET metabolism and ictal SPECT perfusion changes in human temporal lobe epilepsy with hippocampal sclerosis. Neuroimage. 2006;32:684–695. doi: 10.1016/j.neuroimage.2006.04.185. [DOI] [PubMed] [Google Scholar]
- 8.Sisodiya SM, Moran N, Free SL, Kitchen ND, Stevens JM, Harkness WF, Fish DR, Shorvon SD. Correlation of widespread preoperative magnetic resonance imaging changes with unsuccessful surgery for hippocampal sclerosis. Ann Neurol. 1997;41:490–6. doi: 10.1002/ana.410410412. [DOI] [PubMed] [Google Scholar]
- 9.Hermann B, Seidenberg M, Jones J. The neurobehavioural comorbidities of pilepsy: can a natural history be developed? Lancet Neurol. 2008;7:151–60. doi: 10.1016/S1474-4422(08)70018-8. [DOI] [PubMed] [Google Scholar]
- 10.Haneef Z, Lenartowicz A, Yeh HJ, Engel J, Jr, Stern JM. Effect of lateralized temporal lobe epilepsy on the default mode network. Epilepsy Behav. 2012;25:350–7. doi: 10.1016/j.yebeh.2012.07.019. [DOI] [PMC free article] [PubMed] [Google Scholar]
- 11.Pereira FR, Alessio A, Sercheli MS, Pedro T, Bilevicius E, Rondina JM, Ozelo HF, Castellano G, Covolan RJ, Damasceno BP, Cendes F. Asymmetrical hippocampal connectivity in mesial temporal lobe epilepsy: evidence from resting state fMRI. BMC neuroscience. 2010;11:1–13. doi: 10.1186/1471-2202-11-66. [DOI] [PMC free article] [PubMed] [Google Scholar]
- 12.Pittau F, Grova C, Moeller F, Dubeau F, Gotman J. Patterns of altered functional connectivity in mesial temporal lobe epilepsy. Epilepsia. 2012;53:1013–23. doi: 10.1111/j.1528-1167.2012.03464.x. [DOI] [PMC free article] [PubMed] [Google Scholar]
- 13.Engel J, Jr, Thompson PM, Stern JM, Staba RJ, Bragin A, Mody I. Connectomics and epilepsy. Curr Opin Neurol. 2013;26:186–94. doi: 10.1097/WCO.0b013e32835ee5b8. [DOI] [PMC free article] [PubMed] [Google Scholar]
- 14.Sporns O, Tononi G, Kotter R. The human connectome: A structural description of the human brain. PLoS Comput Biol. 2005;1:e42. doi: 10.1371/journal.pcbi.0010042. [DOI] [PMC free article] [PubMed] [Google Scholar]
- 15.Bullmore ET, Bassett DS. Brain graphs: graphical models of the human brain connectome. Annu Rev Clin Psychol. 2011;7:113–40. doi: 10.1146/annurev-clinpsy-040510-143934. [DOI] [PubMed] [Google Scholar]
- 16.Haneef Z, Chiang S. Clinical correlates of graph theory findings in temporal lobe epilepsy. Seizure. 2014 doi: 10.1016/j.seizure.2014.07.004. [DOI] [PMC free article] [PubMed] [Google Scholar]
- 17.Bernhardt BC, Chen Z, He Y, Evans AC, Bernasconi N. Graph-theoretical analysis reveals disrupted small-world organization of cortical thickness correlation networks in temporal lobe epilepsy. Cereb Cortex. 2011;21:2147–57. doi: 10.1093/cercor/bhq291. [DOI] [PubMed] [Google Scholar]
- 18.van Dellen E, Douw L, Baayen JC, Heimans JJ, Ponten SC, Vandertop WP, Velis DN, Stam CJ, Reijneveld JC. Long-term effects of temporal lobe epilepsy on local neural networks: a graph theoretical analysis of corticography recordings. PLoS One. 2009;4:e8081. doi: 10.1371/journal.pone.0008081. [DOI] [PMC free article] [PubMed] [Google Scholar]
- 19.Vaessen MJ, Jansen JF, Vlooswijk MC, Hofman PA, Majoie HJ, Aldenkamp AP, Backes WH. White matter network abnormalities are associated with cognitive decline in chronic epilepsy. Cereb Cortex. 2012;22:2139–47. doi: 10.1093/cercor/bhr298. [DOI] [PubMed] [Google Scholar]
- 20.Stern JM, Caporro M, Haneef Z, Yeh HJ, Buttinelli C, Lenartowicz A, Mumford JA, Parvizi J, Poldrack RA. Functional imaging of sleep vertex sharp transients. Clin Neurophysiol. 2011;122:1382–1386. doi: 10.1016/j.clinph.2010.12.049. [DOI] [PMC free article] [PubMed] [Google Scholar]
- 21.Power JD, Barnes KA, Snyder AZ, Schlaggar BL, Petersen SE. Spurious but systematic correlations in functional connectivity MRI networks arise from subject motion. Neuroimage. 2012;59:2142–54. doi: 10.1016/j.neuroimage.2011.10.018. [DOI] [PMC free article] [PubMed] [Google Scholar]
- 22.Zhang Y, Brady M, Smith S. Segmentation of brain MR images through a hidden Markov random field model and the expectation-maximization algorithm. IEEE Trans Med Imaging. 2001;20:45–57. doi: 10.1109/42.906424. [DOI] [PubMed] [Google Scholar]
- 23.Keller SS, Roberts N. Voxel-based morphometry of temporal lobe epilepsy: an introduction and review of the literature. Epilepsia. 2008;49:741–57. doi: 10.1111/j.1528-1167.2007.01485.x. [DOI] [PubMed] [Google Scholar]
- 24.Chiang S, Stern JM, Engel J, Jr, Levin HS, Haneef Z. Differences in graph theory functional connectivity in left and right temporal lobe epilepsy. Epilepsy Res. 2014;108:1770–81. doi: 10.1016/j.eplepsyres.2014.09.023. [DOI] [PMC free article] [PubMed] [Google Scholar]
- 25.Bonilha L, Nesland T, Martz GU, Joseph JE, Spampinato MV, Edwards JC, Tabesh A. Medial temporal lobe epilepsy is associated with neuronal fibre loss and paradoxical increase instructural connectivity of limbic structures. J Neurol Neurosurg Psychiatry. 2012;83:903–9. doi: 10.1136/jnnp-2012-302476. [DOI] [PMC free article] [PubMed] [Google Scholar]
- 26.Rubinov M, Sporns O. Complex network measures of brain connectivity: uses and interpretations. Neuroimage. 2010;52:1059–69. doi: 10.1016/j.neuroimage.2009.10.003. [DOI] [PubMed] [Google Scholar]
- 27.Lynall ME, Bassett DS, Kerwin R, McKenna PJ, Kitzbichler M, Muller U, Bullmore E. Functional connectivity and brain networks in schizophrenia. J Neurosci. 2010;30:9477–87. doi: 10.1523/JNEUROSCI.0333-10.2010. [DOI] [PMC free article] [PubMed] [Google Scholar]
- 28.Bassett DS, Bullmore E, Verchinski BA, Mattay VS, Weinberger DR, Meyer-Lindenberg A. Hierarchical organization of human cortical networks in health and schizophrenia. J Neurosci. 2008;28:9239–48. doi: 10.1523/JNEUROSCI.1929-08.2008. [DOI] [PMC free article] [PubMed] [Google Scholar]
- 29.Watts DJ, Strogatz SH. Collective dynamics of ‘small-world’ networks. Nature. 1998;393:440–2. doi: 10.1038/30918. [DOI] [PubMed] [Google Scholar]
- 30.Benjamini Y, Hochberg Y. Controlling the false discovery rate: a practical and powerful approach to multiple testing. J R Stat Soc Series B Stat Methodol. 1995:289–300. [Google Scholar]
- 31.Tukey J. Exploratory data analysis. Reading, MA: Addison-Wesley; 1977. [Google Scholar]
- 32.Cook RD, Weisberg S. Residuals and influence in regression. New York, NY: Chapman & Hall; 1982. [Google Scholar]
- 33.Tong IS, Lu Y. Identification of confounders in the assessment of the relationship between lead exposure and child development. Ann Epidemiol. 2001;11:38–45. doi: 10.1016/s1047-2797(00)00176-9. [DOI] [PubMed] [Google Scholar]
- 34.Chiang S, Haneef Z. Graph theory findings in the pathophysiology of temporal lobe epilepsy. Clin Neurophysiol. 2014;125:1295–305. doi: 10.1016/j.clinph.2014.04.004. [DOI] [PMC free article] [PubMed] [Google Scholar]
- 35.Honey CJ, Sporns O, Cammoun L, Gigandet X, Thiran JP, Meuli R, Hagmann P. Predicting human resting-state functional connectivity from structural connectivity. Proc Natl Acad Sci U S A. 2009;106:2035–40. doi: 10.1073/pnas.0811168106. [DOI] [PMC free article] [PubMed] [Google Scholar]
- 36.James GA, Tripathi SP, Ojemann JG, Gross RE, Drane DL. Diminished default mode network recruitment of the hippocampus and parahippocampus in temporal lobe epilepsy. J Neurosurg. 2013;119:288–300. doi: 10.3171/2013.3.JNS121041. [DOI] [PMC free article] [PubMed] [Google Scholar]
- 37.Thomas JB, Brier MR, Ortega M, Benzinger TL, Ances BM. Weighted brain networks in disease: centrality and entropy in human immunodeficiency virus and aging. Neurobiol Aging. 2014 doi: 10.1016/j.neurobiolaging.2014.06.019. [DOI] [PMC free article] [PubMed] [Google Scholar]
- 38.Mankinen K, Long XY, Paakki JJ, Harila M, Rytky S, Tervonen O, Nikkinen J, Starck T, Remes J, Rantala H. Alterations in regional homogeneity of baseline brain activity in pediatric temporal lobe epilepsy. Brain Res. 2011;1373:221–229. doi: 10.1016/j.brainres.2010.12.004. [DOI] [PubMed] [Google Scholar]
- 39.Zhong Y, Lu G, Zhang Z, Jiao Q, Li K, Liu Y. Altered regional synchronization in epileptic patients with generalized tonic-clonic seizures. Epilepsy Res. 2011;97:83–91. doi: 10.1016/j.eplepsyres.2011.07.007. [DOI] [PubMed] [Google Scholar]
- 40.Salmenpera T, Kalviainen R, Partanen K, Pitkanen A. Hippocampal and amygdaloid damage in partial epilepsy: a cross-sectional MRI study of 241 patients. Epilepsy Res. 2001;46:69–82. doi: 10.1016/s0920-1211(01)00258-3. [DOI] [PubMed] [Google Scholar]
- 41.Pitkanen A, Sutula TP. Is epilepsy a progressive disorder? Prospects for new therapeutic approaches in temporal-lobe epilepsy. Lancet Neurol. 2002;1:173–81. doi: 10.1016/s1474-4422(02)00073-x. [DOI] [PubMed] [Google Scholar]
- 42.Morgan VL, Abou-Khalil B, Rogers BP. Evolution of Functional Connectivity of Brain Networks and Their Dynamic Interaction in Temporal Lobe Epilepsy. Brain connectivity. 2014 doi: 10.1089/brain.2014.0251. [DOI] [PMC free article] [PubMed] [Google Scholar]
- 43.Morgan VL, Rogers BP, Sonmezturk HH, Gore JC, Abou-Khalil B. Cross hippocampal influence in mesial temporal lobe epilepsy measured with high temporal resolution functional magnetic resonance imaging. Epilepsia. 2011;52:1741–9. doi: 10.1111/j.1528-1167.2011.03196.x. [DOI] [PMC free article] [PubMed] [Google Scholar]
- 44.Liao W, Zhang Z, Pan Z, Mantini D, Ding J, Duan X, Luo C, Lu G, Chen H. Altered functional connectivity and small-world in mesial temporal lobe epilepsy. PLoS One. 2010;5:e8525. doi: 10.1371/journal.pone.0008525. [DOI] [PMC free article] [PubMed] [Google Scholar]
- 45.Besson P, Dinkelacker V, Valabregue R, Thivard L, Leclerc X, Baulac M, Sammler D, Colliot O, Lehericy S, Samson S, Dupont S. Structural connectivity differences in left and right temporal lobe epilepsy. Neuroimage. 2014;100:135–44. doi: 10.1016/j.neuroimage.2014.04.071. [DOI] [PubMed] [Google Scholar]
- 46.Bettus G, Guedj E, Joyeux F, Confort-Gouny S, Soulier E, Laguitton V, Cozzone PJ, Chauvel P, Ranjeva JP, Bartolomei F, Guye M. Decreased basal fMRI functional connectivity in epileptogenic networks and contralateral compensatory mechanisms. Hum Brain Mapp. 2009;30:1580–91. doi: 10.1002/hbm.20625. [DOI] [PMC free article] [PubMed] [Google Scholar]
- 47.Vlooswijk MC, Vaessen MJ, Jansen JF, de Krom MC, Majoie HJ, Hofman PA, Aldenkamp AP, Backes WH. Loss of network efficiency associated with cognitive decline in chronic epilepsy. Neurology. 2011;77:938–44. doi: 10.1212/WNL.0b013e31822cfc2f. [DOI] [PubMed] [Google Scholar]
- 48.Chiang S, Levin HS, Haneef Z. Computer-automated focus lateralization of temporal lobe epilepsy using fMRI. J Magn Reson Imaging. 2014 doi: 10.1002/jmri.24696. [DOI] [PMC free article] [PubMed] [Google Scholar]
Associated Data
This section collects any data citations, data availability statements, or supplementary materials included in this article.