Abstract
The M1 and M2 polarized phenotypes dictate distinctive roles for macrophages as they participate in inflammatory disorders. There has been growing interest in the role of cellular metabolism in macrophage polarization. However, it is currently unclear if different aspects of a specific metabolic program coordinately regulate this cellular process. In this study, we found that pyruvate dehydrogenate kinase 1 (PDK1), a key regulatory enzyme in glucose metabolism, plays an important role in the differential activation of macrophages. Knockdown of PDK1 diminished M1, whereas it enhanced M2 activation of macrophages. Mechanistically, PDK1 knockdown led to diminished aerobic glycolysis in M1 macrophages, which likely accounts for the attenuated inflammatory response in these cells. Furthermore, we found that mitochondrial respiration is enhanced during and required by the early activation of M2 macrophages. Suppression of glucose oxidation, but not that of fatty acids, inhibits this process. Consistent with its inhibitory role in early M2 activation, knockdown of PDK1 enhanced mitochondrial respiration in macrophages. Our data suggest that two arms of the glucose metabolism synergistically regulate the differential activation of macrophages. Our findings also highlight the central role of PDK1 in this event via controlling glycolysis and glucose oxidation.
Keywords: PDK1, glycolysis, oxidative phosphorylation, fatty acid oxidation, macrophage polarization, innate immunity
Introduction
Macrophages are an essential component of innate immunity and well recognized to play a critical role in inflammation, systemic metabolism, tissue repair and tumor surveillance (1-3). Bearing such diverse functions necessitates macrophages to assume a wide spectrum of phenotypes that are currently divided into two subgroups, namely M1 and M2, a specification emulating the Th1/Th2 classification of T cells (1-6).
Macrophages activated by INF-γ and/or Toll like receptor (TLR) agonists are called M1 macrophages (3, 4, 7, 8), while macrophages differentiated with Th2 cytokines, immunocomplexes, TGF-β and IL-10 are named M2 macrophages (3, 4, 7, 8). M1 macrophages produce high levels of proinflammatory cytokines and reactive oxygen and nitrogen species, which are crucial to their microbicidal activities (1, 3, 4). M2 macrophages have high expression of markers of alternative activation, such as arginase-1 (Arg1), chitinase 3-like 3 (also called YM-1), and found in inflammatory zone 1 (FIZZ-1) and also demonstrate high levels of scavenger, mannose and galactose-type receptors (1, 2, 9). M2 macrophages have an important role in parasite infection, tissue remodeling, angiogenesis, and tumor progression (10, 11).
The regulation of macrophage polarization is under extensive study at both the transcriptional and the post-transcriptional levels. A number of transcriptional factors, such as IFN-regulatory factors (IRFs) and Kruppel-like factors (KLFs), have been found to participate in the differential activation of macrophages (4). Recently, a class of small non-coding RNAs, microRNAs (miRNAs) also began to emerge as major players in macrophage polarization (8).
There has been growing interest in understanding the role of cellular metabolism in macrophage activation. It has been demonstrated that aerobic glycolysis is essential to the activation of many types of immune cells, such as dendritic cells, T cells and macrophages (12-18). Additionally, M2 macrophage polarization requires fatty acid oxidation (19-21). These studies have provided compelling evidence that macrophage polarization can be regulated by the different aspects of cellular metabolism.
Pyruvate dehydrogenate kinase 1 (PDK1) is a key regulatory enzyme in glucose metabolism (22-24). PDK1 incites inhibitory phosphorylation on components of the pyruvate dehydrogenase (PDH) complex that converts pyruvate produced from glycolytic flux to acetyl-CoA (22-24). Pyruvate derived acetyl-CoA enters the TCA cycle that generates NADH that fuels the electron transport chain (ETC) for oxidative phosphorylation (25-27). The importance of the regulatory role of PDK1 in glucose metabolic homeostasis has been well studied in cancer cells (22). Amplified expression of PDK1 frequently found in many types of cancers is believed to be responsible for the aerobic glycolysis undertaken by these malignant cells (22). Despite the rapid progress made in other areas, the role of PDK1 as well as its regulated glucose metabolism in macrophage polarization has not been described.
In this study, we found that PDK1 promotes M1, whereas inhibits M2 macrophage polarization. Our data therefore suggest that two arms of the glucose metabolism synergistically regulate the differential activation of macrophages.
Material and methods
Reagents
Ultra-pure LPS from Salmonella minnesota R595, PAM3CSK4, heat killed Listeria monocytogenes (HKLM), and heat killed P. aeruginosa (HKPA) were purchased from Invivogen.
Establishment of mouse bone marrow derived macrophages (BMDMs) and mouse peritoneal macrophages
Mouse BMDMs were derived from bone marrow cells of C57BL/6 mice (NCI-Fredrick). Briefly, bone marrow cells were cultured for 5 days in DMEM media containing 10% FBS and 50 ng/ml murine M-CSF (R&D Systems). The established BMDM were then plated for following experiments. Peritoneal macrophages were elicited by 4% thioglycolate. 4 days after injection, cells were harvested by peritoneal lavage and plated. After 1 hour at 37°C, non-adherent cells were removed and adherent macrophages were used for following experiments. The animal protocol was approved by the UAB Institutional Animal Care and Use Committee (IACUC).
Enzyme-linked immunosorbent assay (ELISA) for cytokines
Levels of TNF-α and IL-6 in cell culture supernatants were determined using DuoSet ELISA Development kits (R&D Systems) according to the manufacturer’s instructions.
siRNA transfection
ON-TARGETplus negative control siRNA pool and specific PDK1 siRNA pool were purchased from Dharmacon. 20 nM control siRNA or PDK1 siRNA were mixed with Hiperfect (Qiagen) transfection reagents for 5 min. The complexes were incubated with macrophages at 37°C for 6h and then removed. The cells were cultured in fresh media and respective experiments performed 2 days after transfection.
Quantitative real-time PCR
Real-time PCR was performed using SYBR Green Master Mix kit (Roche). Primer sequences were: mouse GAPDH: sense, 5' CGACTTCAACAGCAACTCCCACTCTTCC 3'; antisense, 5' TGGGTGGTCCAGGGTTTCTTACTCCTT 3'; mouse β-Tubulin: sense, 5' GGATGCTGCCAATAACTATGCTCGT 3'; antisense, 5' GCCAAAGCTGTGGAAAACCAAGAAG 3'; mouse IL-6: sense, 5' CCCAATTTCCAATGCTCTCCTA 3'; antisense, 5' AGGAATGTCCACAAACTGATATGCT; mouse IL-12 p40: sense, 5' CCAAATTACTCCGGACGGTTCAC 3'; antisense, 5' CAGACAGAGACGCCATTCCACAT 3'; mouse IL-1β: sense, 5' AAGGAGAACCAAGCAACGACAAAATA 3'; antisense, 5' TTTCCATCTTCTTCTTTGGGTATTGC; mouse iNOS: sense, 5' ATCTTTGCCACCAAGATGGCCTGG 3'; antisense, 5' TTCCTGTGCTGTGCTACAGTTCCG 3'; mouse Arginase-1: sense, 5' TGACTGAAGTAGACAAGCTGGGGAT 3'; antisense, 5' CGACATCAAAGCTCAGGTGAATCGG; mouse YM-1: sense, 5' ATGAAGCATTGAATGGTCTGAAAG 3'; antisense, 5' TGAATATCTGACGGTTCTGAGGAG 3'; mouse FIZZ-1: sense, 5' AGGTCAAGGAACTTCTTGCCAATCC 3'; antisense, 5' AAGCACACCCAGTAGCAGTCATCCC 3'; mouse mannose receptor, C type 1 (MRC1): sense, 5' GGGCAGTCACCATATTTTATTGGC 3'; antisense, 5' GCAAAGTTGGGTTCTCCTGTAGCC 3'.
To calculate fold change in the expression of cytokines, ΔCt values were first obtained: ΔCt = Ct of GAPDH or Tubulin, - Ct of cytokines. ΔΔCt values were then obtained: ΔΔCt = ΔCt of treated groups - ΔCt of untreated control groups. Fold change was calculated as 2ΔΔCt, with control groups as 1 fold.
Western blotting
Western blotting was performed as previously described (28). Anti-Cox2, PDK1 and PDH-E1α antibodies were from Cell Signaling. Anti-p-PDH-E1α antibody was from EMD chemicals. Anti-Arg1 and iNOS antibodies were from Santa Cruz Biotechnology.
Nitric oxide (NO) measurement
NO release by macrophages was determined by measuring nitrite concentration in culture media with Nitric Oxide Fluorometric Assay Kit (Biovision) according to the manufacturer's manual.
Real-time cell metabolism assay
XF-24 Extracellular Flux Analyzer (Seahorse Bioscience) was used for real-time analysis of oxygen consumption rate (OCR). BMDMs were seeded in Seahorse XF-24 cell culture microplates (1.5×10⁵ cells/well). The cells were treated without or with 2 ng/ml IL-4 for 6h, followed by sequential treatment with 1.5 μg/ml oligomycin (Oligo), 4.5 μM carbonyl cyanide 4-(trifluoromethoxy) phenylhydrazone (FCCP), and 1 μM rotenone plus 4 μM antimycin (Rot + Ant). Real-time OCR was recorded according to the manufacturer's manual.
Intracellular and extracellular lactate assays
Intracellular and extracellular levels of lactate were determined using lactate assay kit (BioVision) according to the manufacturer's instructions.
Statistical analysis
One-way ANOVA followed by the Bonferroni test was used for multiple group comparisons. The Student t test was used for comparison between two groups. p < 0.05 was considered statistically significant.
Results
Knockdown of PDK1 diminishes LPS induced M1 macrophage activation
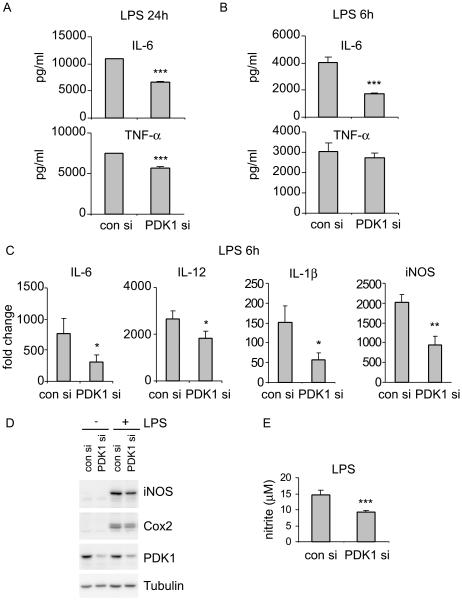
Although there has been growing evidence showing that glucose metabolism is involved in innate immune responses (12-16, 18), it is less clear if this metabolic event participates in the differential activation of macrophages. PDK1 is a key regulatory enzyme involved in glucose metabolism (22, 23). PDK1 limits the conversion of pyruvate to acetyl-CoA that enters the TCA cycle to produce NADH for the ensuing oxidative phosphorylation in the mitochondria (22, 23). Functionally, PDK1 sits at a pivotal point in glucose metabolism where it controls the bifurcation of the metabolic events leading to lactate production or oxidative phosphorylation (22, 23). To determine the role of PDK1 and glucose metabolism in macrophage activation, we first examined the effect of PDK1 knockdown in the inflammatory response of macrophages to LPS stimulation. As shown in Figures 1A and 1B, we found that PDK1 knockdown attenuates the expression of proinflammatory cytokines, such as TNF-α and IL-6, in LPS treated macrophages. The diminished expression of proinflammatory cytokines or mediators in LPS treated macrophages with PDK1 knockdown occurred at the transcriptional level because mRNA levels of IL-6, IL-12, IL-1β, and iNOS were all decreased in these cells (Figure 1C). Consistent with the reduced mRNA levels of iNOS, protein levels of iNOS, as well as Cox2, were markedly decreased in macrophages with PDK1 knockdown (Figure 1D). Furthermore, LPS induced NO production was also diminished by PDK1 knockdown (Figure 1E). Of note, although PDK1 was effectively knocked down by specific PDK1 siRNAs, the expression of other key rate-limiting glycolytic enzymes, i.e. HK2, PFK1 and PKM2, was not affected (Supplementary Figure 1A). These data suggest that the observed effects are more likely caused by PDK1 knockdown. To further confirm that PDK1 is required for LPS stimulated cytokine production in macrophages, we performed similar experiments in peritoneal macrophages and the macrophage cell line RAW264.7 cells and found that knockdown of PDK1 markedly decreases LPS induced expression of TNF-α and IL-6 (Supplementary Figures 2B-2C). Collectively, these data suggest that PDK1 is required for M1 macrophage activation.
Figure 1. Knockdown of PDK1 diminishes LPS induced M1 macrophage activation.
(A-B) Mouse BMDMs were transfected with 20 nM control siRNA or PDK1 siRNA. 48h after transfection, the cells were treated without or with 100 ng/ml LPS for 24 (A) or 6h (B). Levels of IL-6 and TNF-α in the cell culture supernatants were determined by ELISA assays. *** p<0.001 compared to "con si" group. (C) Mouse BMDMs were transfected with 20 nM control siRNA or PDK1 siRNA. 48h after transfection, the cells were treated without or with 100 ng/ml LPS for 6h. mRNA levels of IL-6, IL-12, IL-1β and iNOS were determined by realtime PCR. * p<0.05, ** p<0.01 compared to "con si" group. (D) The experiments were performed as in B and protein levels of iNOS, Cox2, PDK1 and Tubulin determined by Western blotting. (E) The experiments were performed as in B and NO production represented by nitrite concentrations in culture media was determined. *** p<0.001 compared to "con si". The experiments were performed three times with similar results obtained.
PDK1 is required for M1 macrophage activation by TLR2 activation
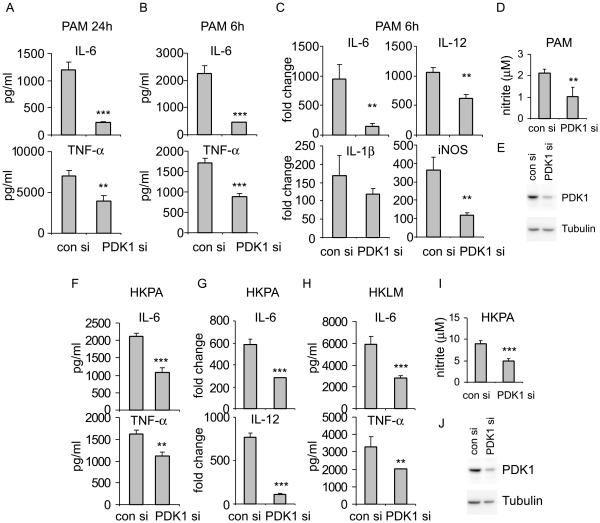
To determine if PDK1 participates only in the response to LPS or in general M1 macrophage activation, we next examined if PDK1 knockdown affects macrophage responses to TLR2 stimulation. As shown in Figures 2A-2B and similarly to results found with LPS treatment, PDK1 knockdown significantly attenuated PAM induced expression of TNF-α and IL-6. Furthermore, the attenuated expression of these proinflammatory mediators also took place at the transcriptional level (Figure 2C). Additionally, PAM induced NO production was also diminished by PDK1 knockdown (Figure 2D) Taken together, these data suggest that PDK1 is required for M1 macrophage activation by general stimuli.
Figure 2. PDK1 is required for M1 macrophage activation by TLR2 activation.
(A-B) Mouse BMDMs were transfected with 20 nM control siRNA or PDK1 siRNA. 48h after transfection, the cells were treated without or with 1 μg/ml PAM for 24 (A) or 6h (B). Levels of IL-6 and TNF-α in the cell culture supernatants were determined by ELISA assays. ** p<0.01, *** p<0.001 compared to "con si" group. (C) Mouse BMDMs were transfected with 20 nM control siRNA or PDK1 siRNA. 48h after transfection, the cells were treated without or with 1 μg/ml PAM for 6h. mRNA levels of IL-6, IL-12, IL-1β and iNOS were determined by realtime PCR. ** p<0.01 compared to "con si" group. The experiments were performed three times with similar results obtained. (D) Experiments were performed as in B. NO production was determined. ** p<0.01 compared to "con si". (E) Representative blot of PDK1 knockdown in A-D is shown. (F-H) Mouse BMDMs were transfected with 20 nM control siRNA or PDK1 siRNA. 48h after transfection, the cells were treated without or with 1 × 10⁷/ml HKPA (F, G) or HKLM (H) for 6h. Protein (F, H) and mRNA (G) levels of TNF-α, IL-6 and IL-12 were determined by ELISA assays or real-time PCR. ** p<0.01, *** p<0.001 compared to "con siRNA". (I) Experiments were performed as in F. NO production was determined. *** p<0.001 compared to "con si". (J) Representative blot of PDK1 knockdown in F-I is shown. The experiments were repeated twice.
Knockdown of PDK1 diminishes the response of macrophages to bacteria that signal through TLR2
The finding that PDK1 is required for M1 macrophage activation by TLR2 intrigued us to determine if PDK1 participates in the response of macrophages to bacteria that primarily activate TLR2. To do this, we treated macrophages with heat killed P. aeruginosa. P., a common bacteria that are frequently found to cause pneumonia and sepsis (29-31). We found that PDK1 knockdown considerably diminishes P. aeruginosa induced expression of IL-6, IL-12 and TNF-α (Figures 2F and 2G). Additionally, we examined the effect of PDK1 knockdown on the activation of macrophages by Listeria monocytogenes, another common virulent bacteria that induce inflammation mediated by interactions of MyD88 and TLR2 (32). As shown in Figure 2H, PDK1 knockdown significantly attenuated Listeria monocytogenes induced expression of TNF-α and IL-6. Additionally, HKPA induced NO production was also diminished by PDK1 knockdown (Figure 2I) Collectively, these data suggest that PDK1 is involved in the inflammatory response to infections by some common bacteria and may participate in the infection associated organ injury, such as acute respiratory distress syndrome (ARDS).
M-CSF differentiated macrophages are primed for IL-10 production upon TLR stimulation and the induced IL-10 suppresses the expression of other proinflammatory cytokines in both autocrine and paracrine manners (33, 34). To determine if IL-10 is involved in the attenuated response of macrophages with PDK1 knockdown to LPS, PAM or HKPA, we directly measured IL-10 levels from the same set of experiments. As shown in Supplementary Figure 1B, the induction of IL-10 by LPS, PAM or HKPA in macrophages with PDK1 knockdown was all diminished, similar to the decreased expression of other proinflammatoy cytokines. To further define if there is a potential role of IL-10 in PDK1 regulated M1 macrophage activation, we performed the same experiments in GM-CSF induced macrophages (GM-BMMs), which have low expression of IL-10 upon TLR stimulations. As shown in Supplementary Figure 2A, the expression of TNF-α was significantly diminished in PAM or HKPA treated GM-BMM with PDK1 knockdown. Taken together, these data suggest that the regulation of PDK1 on M1 macrophage activation is independent of IL-10. However, we found that PDK1 knockdown has little effect on LPS activated cytokine production in GM-BMMs (data not shown). The different regulation of the responses to TLR2 and TLR4 agonists by PDK1 in GM-BMMs suggest that LPS induced glycolytic augmentation in this type of cells involves more than PDK1 controlled pathways. Notably, GM-BMMs are often used as dendritic cells (35).
PDK1 knockdown inhibits glycolysis in macrophages
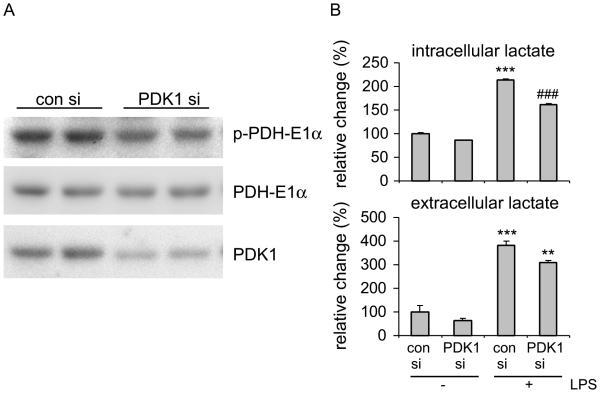
Glycolysis has been recently shown to be required for the optimal activation of many types of inflammatory cells, including monocytes, dendritic cells and macrophages (12-16, 18). To determine the mechanism by which PDK1 regulates M1 macrophage activation, we investigated the effect of PDK1 on glycolytic flux in macrophages. PDK1 phosphorylates components of the PDH complex in the mitochondria (22, 23). This inhibitory phosphorylation suppresses pyruvate conversion to acetyl-CoA and thereby augmenting lactate production (22-24). We first confirmed that PDK1 knockdown reduces the phosphorylation of PDH-E1α (Figure 3A). We then directly measured the intracellular and extracellular levels of lactate, the glycolytic end product. As shown in Figure 3B, LPS treatment enhanced lactate production. However, such an increase was significantly weakened by PDK1 knockdown (Figure 3B). Taken together, these data indicate that augmented glycolysis is critical to the inflammatory response. These data also suggest that PDK1 is required for the enhanced glycolysis in LPS treated macrophages and thereby promoting the full activation of M1 macrophages.
Figure 3. PDK1 knockdown inhibits glycolysis in macrophages.
(A) Mouse BMDMs were transfected with 20 nM control siRNA or PDK1 siRNA. 48h after transfection, cellular extracts were prepared and levels of p-PDH-E1α, PDH-E1α and PDK1 determined by Western blotting. (B) BMDMs were transfected with 20 nM control siRNA or PDK1 siRNA. 48h after transfection, the cells were treated without or with 100 ng/ml LPS for 6h. The cell supernatants were collected. Cells were lysed in lactate assay buffer. Levels of lactate in the supernatants and in the cellular extracts were determined by lactate assay kit. *** p<0.001 compared to "con si-"; ** p<0.01 compared to "con si+"; ### p<0.001 compared to "con si+". The experiments were performed three times with similar results obtained.
PDK1 knockdown enhances M2 macrophage activation
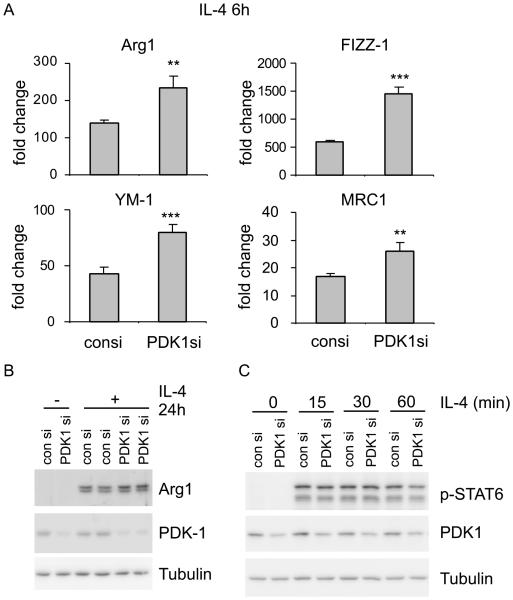
Although there is a well-recognized role of fatty acid oxidation in M2 macrophage establishment, i.e. macrophages treated with IL-4 for 24h or longer time (19, 20), it is unclear if glucose metabolism also participates in this cellular process. Since we have found that PDK1 is required for the enhanced glycolysis and M1 macrophage activation, we next asked if PDK1 regulates macrophage polarization to M2. To address this question, we examined the effect of PDK1 knockdown on IL-4 induced expression of M2 macrophage phonotypical markers, such as Arg1, YM-1, FIZZ-1 and MRC1. As shown in Figure 4A, PDK1 knockdown remarkably enhanced the expression of M2 markers at the early time point (6h) of IL-4 stimulation. Consistent with the increased mRNA levels of Arg1, the protein levels of this M2 marker were enhanced in IL-4 treated macrophages with PDK1 knockdown (Figure 4B). These data suggest that PDK1 is a negative regulator of M2 macrophage differentiation, in contrast to its promoting role in M1 macrophage activation. To delineate the mechanism by which PDK1 regulates M2 differentiation, we examined the levels of IL-4 induced STAT6 phosphorylation and found that it is not affected by PDK1 knockdown (Figure 4C). These data suggest that the augmented glucose oxidation does not affect the signaling events proximal to the activation of the IL-4 receptor. Therefore, the mechanism by which oxidative phosphorylation promotes M2 differentiation needs further delineation and remains a focus of future studies.
Figure 4. PDK1 knockdown enhances M2 macrophage activation.
Mouse BMDMs were transfected with 20 nM control siRNA or PDK1 siRNA. 48h after transfection, the cells were treated without or with 2 ng/ml IL-4 for 6h. Levels of Arg1, YM-1, FIZZ-1, and MRC1 were determined by realtime PCR. ** p<0.01, *** p<0.001 compared to "con si" group. (B) Mouse BMDMs were transfected with 20 nM control siRNA or PDK1 siRNA. 48h after transfection, the cells were treated without or with 2 ng/ml IL-4 for 24h. Protein levels of Arg1 and Tubulin were determined by Western blotting. (C) Mouse BMDMs were transfected with 20 nM control siRNA or PDK1 siRNA. 48h after transfection, the cells were treated with 2 ng/ml IL-4 for the indicated periods of time. Levels of p-STAT6, PDK1 and Tubulin were determined by Western blotting. Data are representative of three experiments.
Mitochondrial respiration is increased during and required for the early differentiation of M2 macrophages
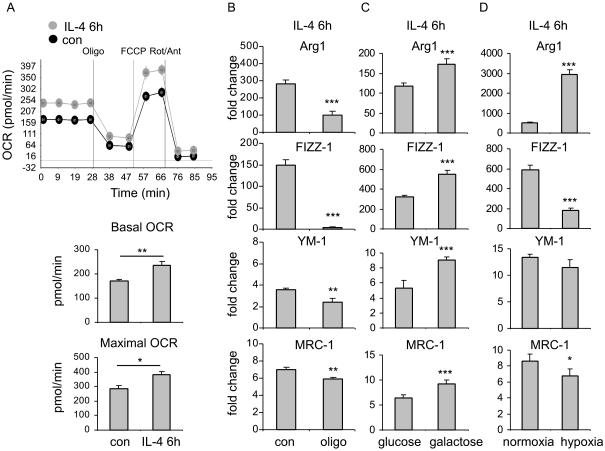
There is enhanced mitochondrial respiration in the established M2 macrophages, i.e. 24h after IL-4 treatment (19, 20). However, it is not clear if oxidative phosphorylation at the early time points of IL-4 treatment regulates M2 differentiation. To address this question, we measured mitochondrial oxygen consumption rate (OCR) in macrophages at 6h after IL-4 treatment. As shown in Figure 5A, there was a significant increase in basal and maximal OCR at this time point. These data suggest that mitochondrial respiration may also be involved in the early activation of M2 macrophages.
Figure 5. Mitochondrial respiration is increased during and required for the early differentiation of M2 macrophages.
(A) BMDMs were seeded in Seahorse XF-24 cell culture microplates (1.5×10⁵ cells/well). The cells were treated without or with 2 ng/ml IL-4 for 6h, followed by sequential treatment (separated by vertical lines) with oligomycin (Oligo), FCCP, and rotenone plus antimycin (Rot + Ant). OCR (basal, non-mitochondrial (after treatment with Oligo), and reserve (after treatment with FCCP)) were then determined. OCR at basal and maximal levels of the indicated conditions were plotted in bar graphs. * p<0.05, ** p<0.01. (B) Mouse BMDMs were pre-treated without or with 0.5 μg/ml oligomycin for 1h. The cells were then treated without or with 2 ng/ml IL-4 for 6h. Levels of Arg1, YM-1, FIZZ-1, and MRC1 were determined by realtime PCR. ** p<0.01, *** p<0.001 compared to "con" group. (C) Mouse BMDMs were cultured in DMEM media containing 25 mM glucose or 25 mM galactose for 24h. The cells were then treated without or with 2 ng/ml IL-4 for 6h. Levels of Arg1, YM-1, FIZZ-1, and MRC1 were determined by realtime PCR. *** p<0.001 compared to "con" group. (D) Mouse BMDMs were pre-exposed to normoxia or hypoxia (1% O2) for 90 min, followed by treatment with with 2 ng/ml IL-4 for 6h. Levels of Arg1, YM-1, FIZZ-1, and MRC1 were determined by realtime PCR. * p<0.05, *** p<0.001 compared to "con" group. Data are representative of three experiments.
To determine if mitochondrial respiration is required for the early differentiation of M2 macrophages, we pre-treated macrophages with the specific mitochondrial respiratory inhibitor, oligomycin. As shown in Figure 5B, oligomycin diminished the expression of M2 phenotypic markers at 6h after IL-4 treatment. These data suggest that mitochondrial respiration is required for the early differentiation of M2 macrophages.
To further define the role of mitochondrial respiration in the early differentiation of M2 macrophages, we replaced glucose with galactose in the culture media. Galactose enters glycolysis through the Leloir pathway that causes a negative net production of ATP at the end of glycolytic flux and thus forcing cells to respire (36, 37). As shown in Figure 5C, the expression of IL-4 induced M2 markers was significantly greater in macrophages cultured with galactose than that in cells cultured with glucose, consistent with the findings that augmented oxidative phosphorylation promotes M2 macrophage differentiation. We next blunted mitochondrial respiration by exposing to hypoxia and found that there is less expression of IL-4 induced M2 markers, except for Arg1, in macrophages under hypoxic conditions (Figure 5D). The exceptional increase in IL-4 induced Arg1 in macrophages exposed to hypoxia could be caused by HIF-2α stabilized under hypoxic conditions. HIF-2α has been previously shown to activate Arg1 expression (38). Nevertheless, these data suggest that enhanced glycolysis is in general pro-M1, but anti-M2 macrophage differentiation, consistent with the effects of PDK1 knockdown on the differential activation of macrophages.
Fatty acid oxidation is dispensable to the early differentiation of M2 macrophages
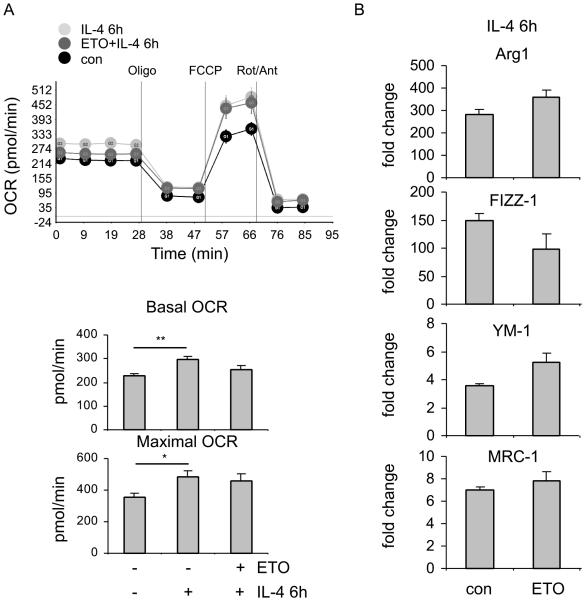
Increased fatty acid oxidation is present in established M2 macrophages and is required for optimal activation of M2 macrophages (19, 20). Since we found augmented mitochondrial respiration during the early stage of M2 activation, we asked if fatty acid oxidation is involved in this event. To test this hypothesis, we pre-treated macrophages with etomoxir (ETO), a specific inhibitor of carnitine palmitoyltransferase I (CPT1) that is an essential enzyme in fatty acid oxidation (39). We found that inhibition of fatty acid oxidation has only marginal effects on mitochondrial respiration (Figure 6A), suggesting that the elevated mitochondrial respiration during the early activation of M2 macrophages is not derived from fatty acid oxidation. Consistently, ETO treatment only slightly diminished the expression of one of the M2 markers during early M2 macrophage activation (Figure 6B), in contrast to what has been reported in established M2 macrophages (19, 20). These data suggest that, although fatty acid oxidation is necessary for M2 polarization, it does not impose its role until relatively late in the process. These data also allude to a critical role for glucose oxidation in the early activation of M2 macrophages.
Figure 6. Fatty acid oxidation is dispensable to the early differentiation of M2 macrophages.
(A) BMDMs were seeded in Seahorse XF-24 cell culture microplates (1.5×10⁵ cells/well). The cells were pre-treated without or with 100 μM etomoxir (ETO) for 1h and then treated without or with 2 ng/ml IL-4 for 6h, followed by sequential treatment with Oligo, FCCP, and Rot plus Ant. OCR at basal and maximal levels of the indicated conditions were plotted in bar graphs. * p<0.05, ** p<0.01. (B) Mouse BMDMs were pre-treated without or with 100 μM ETO for 1h. The cells were then treated without or with 2 ng/ml IL-4 for 6h. Levels of Arg1, YM-1, FIZZ-1, and MRC1 were determined by realtime PCR. The experiments were performed three times with similar results obtained.
Glucose oxidation is required for the early differentiation of M2 macrophages
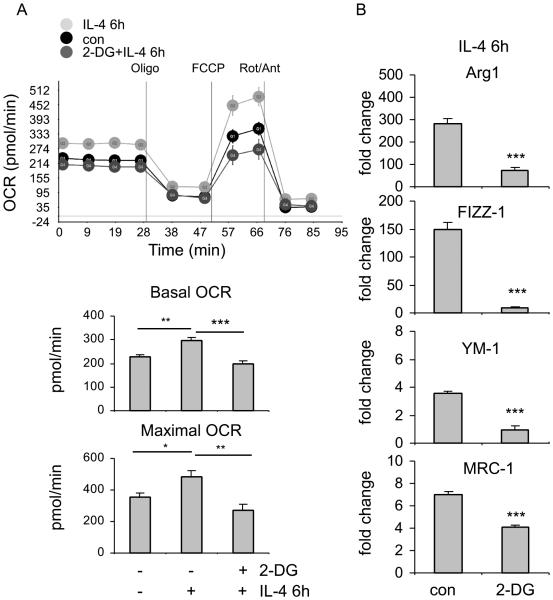
Since we have found that fatty acid oxidation is largely dispensable to the early activation of M2 macrophages, we asked if glucose oxidation is required for this early event. To test this hypothesis, we pre-treated macrophages with 2-Deoxy-D-glucose (2-DG) for 3h and included 2-DG in the media during the IL-4 stimulation. 2-DG is an inhibitor of a key glycolytic enzyme, hexokinase II (HK2), and suppresses glycolytic flux to fuel the TCA cycle and possibly the ensuing oxidative phosphorylation (40). As shown in Figure 7A, 2-DG did inhibited oxidative phosphorylation during the early differentiation of M2 macrophages. More importantly, we found that 2-DG diminishes the early expression of M2 markers (Figure 7B). Together with the findings with ETO, these data suggest that it is glucose oxidation, but not that of fatty acids, is necessary for the early differentiation of M2 macrophages.
Figure 7. Glucose oxidation is required for the early differentiation of M2 macrophages.
(A) BMDMs were seeded in Seahorse XF-24 cell culture microplates (1.5×10⁵ cells/well). The cells were pre-treated without or with 1 mM 2-DG for 3h and then treated without or with 2 ng/ml IL-4 for 6h, followed by sequential treatment with Oligo, FCCP, and Rot plus Ant. OCR at basal and maximal levels of the indicated conditions were plotted in bar graphs. * p<0.05, ** p<0.01, *** p<0.001. (B) Mouse BMDMs were pre-treated without or with 1 mM 2-DG for 3h. The cells were then treated without or with 2 ng/ml IL-4 for 6h. Levels of Arg1, FIZZ-1, YM-1 and MRC1 were determined by realtime PCR. *** p<0.001 compared to "con" group. The experiments were performed three times with similar results obtained.
PDK1 knockdown enhances mitochondrial respiration in macrophage
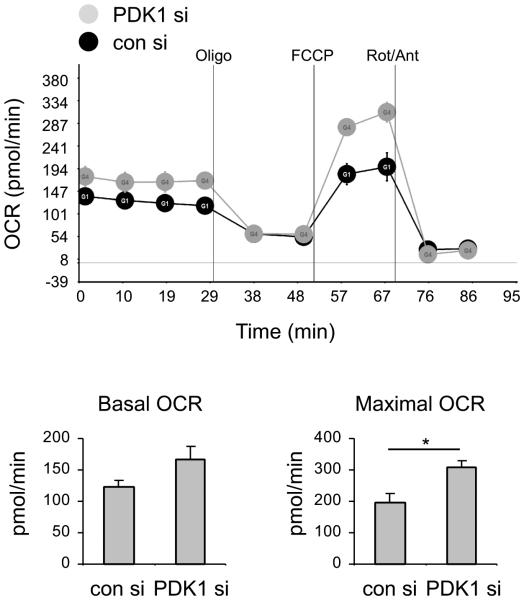
Now we have demonstrated that PDK1 knockdown enhances the early differentiation of M2 macrophages. We have also shown that glucose oxidation is likely required for the M2 activation at the early time points. To determine the mechanism by which PDK1 knockdown enhances M2 macrophage differentiation, we investigated if PDK1 knockdown affects glucose oxidation. As shown in Figure 8, PDK1 knockdown augmented mitochondrial oxidative phosphorylation in macrophages. These data suggest that PDK1 regulates M2 macrophage differentiation via controlling glucose oxidation during the early differentiation of M2 macrophages.
Figure 8. PDK1 knockdown enhances mitochondrial respiration in macrophages.
Mouse BMDMs were transfected with 20 nM control siRNA or PDK1 siRNA. 48h after transfection, the cells were seeded in Seahorse XF-24 cell culture microplates (1.5×10⁵ cells/well) for overnight. The cells were then treated sequentially with Oligo, FCCP, and Rot plus Ant. OCR at basal and maximal levels of the indicated conditions were plotted in bar graphs. * p<0.05. The experiments were performed three times with similar results obtained.
Discussion
Several recent studies showed that M1 macrophages as well as other inflammatory cells, such as dendritic cells, are dependent on glycolysis for their full activation (12-16, 18). In addition, it has been also established that M2 macrophage differentiation requires fatty acid oxidation (19-21). Such studies clearly suggest that metabolic reprogramming is an indispensable step during the activation of macrophages. However, these previous findings have also portrayed a picture that the differential states of macrophage activation seem to be controlled by relatively independent aspects of cellular metabolism, mostly glycolysis versus fatty acid oxidation. Evidence regarding if there is a unified and synergistic action during macrophage polarization is lacking. In this study, we showed that such a synergy does exist in these processes. We found that one of the key enzymes in glucose metabolism, PDK1, regulates both M1 and M2 macrophage activations.
Upregulation of PDK1, concurrent with increased phosphorylation of the PDH complex, is frequently found in cancer cells (22-24). Such dysregulation leads to a decline in the entry of glycolytic flux derived pyruvate into the TCA cycle, which is believed to contribute to the "Warburg" effect, a metabolic hallmark of cancers (25-27, 41-43). In our study, we found that M1 macrophages direct glucose metabolism to aerobic glycolysis. These data are consistent with previous studies and lend further support to the notion that glycolysis is essential to the inflammatory activation of these cells (12-16). More importantly, we found that knockdown of PDK1 substantially attenuates glycolytic flux in macrophages, which is likely responsible for the diminished M1 activation observed in PDK1 knockdown cells. Our data suggest that PDK1, as a critical component of glucose metabolism, participates in M1 macrophage activation. Our data also indicate a potential therapeutic target in treating inflammatory disorders that involve M1 macrophage activation.
Although it is unclear if glucose metabolism is involved in M2 macrophages, there has been ample evidence showing that fatty acid oxidation is essential to this process (19-21). This conclusion is supported by findings that M2 activation can be blocked by suppression of the activity of CPT1, an essential enzyme in fatty acid oxidation, and inhibition of mitochondrial oxidative respiration (19-21). Furthermore, a recent study demonstrated that fatty acids fueling M2 activation are mainly from extracellular source (19). Compared to the compelling evidence showing the crucial role of fatty acid metabolism in the established M2 macrophages, i.e. resting macrophages treated with IL-4 for 24 hours or longer periods, there is little knowledge regarding the metabolic demand in the early differentiation of M2 macrophages. We found that mitochondrial oxidative respiration is required early in the M2 activation as well. More importantly, these oxidative events involve no fatty acids, but rather are dependent on glucose. This conclusion was based on our findings that inhibition of mitochondrial oxidative respiration, but not suppression of fatty acid cross-mitochondrial transportation, diminishes the early activation of M2 macrophages. Collectively, these data suggest that the early activation of M2 macrophages is largely independent of fatty acid oxidation.
However, we found that mitochondrial respiratory activity is increased during the early activation of M2. We believe that it is possibly caused by a spurt in glucose oxidation during this process. Consistent with this inference, 2-DG, a glycolytic inhibitor that suppresses glucose metabolism, attenuated the augmented mitochondrial respiration during early M2 differentiation. Likely due to the affected oxidative phosphorylation, 2-DG treated macrophages demonstrated impaired early M2 activation. Being further in line with the important role of mitochondrial respiration and PDK1 during the early activation of M2, PDK1 knockdown macrophages demonstrated enhanced mitochondrial respiration. Taken together, these data suggest that PDK1 regulated glucose oxidation plays an important role in the early activation of M2 macrophages.
Our data suggest that there is a transition in the demand for mitochondrial respiration during M2 macrophage activation, with glucose oxidation of the early phase gradually being switched to fatty acid oxidation at later time points. These findings indicate the importance of the synergistic actions from the two key metabolic programs that fuel the mitochondrial respiration during M2 macrophage activation. Our data also highlight the central role of PDK1 in the differential activation of macrophages via controlling glycolysis and glucose oxidation.
Supplementary Material
Acknowledgments
This work was supported by NIH grants HL105473 and HL076206 (to G. L.) and HL114470 (to V. J. T.)
Footnotes
Author contributions: GL designed and supervised the study; ZT, NX, HC, DRM performed the experiments and analyzed the data; EA, VJT contributed intellectual inputs; ZT, EA, VJT, GL wrote the manuscript.
References
- 1.Sica A, Mantovani A. Macrophage plasticity and polarization: in vivo veritas. The Journal of clinical investigation. 2012;122:787–795. doi: 10.1172/JCI59643. [DOI] [PMC free article] [PubMed] [Google Scholar]
- 2.Gordon S, Martinez FO. Alternative activation of macrophages: mechanism and functions. Immunity. 2010;32:593–604. doi: 10.1016/j.immuni.2010.05.007. [DOI] [PubMed] [Google Scholar]
- 3.Mosser DM, Edwards JP. Exploring the full spectrum of macrophage activation. Nat Rev Immunol. 2008;8:958–969. doi: 10.1038/nri2448. [DOI] [PMC free article] [PubMed] [Google Scholar]
- 4.Lawrence T, Natoli G. Transcriptional regulation of macrophage polarization: enabling diversity with identity. Nat Rev Immunol. 2011;11:750–761. doi: 10.1038/nri3088. [DOI] [PubMed] [Google Scholar]
- 5.Mantovani A, Biswas SK, Galdiero MR, Sica A, Locati M. Macrophage plasticity and polarization in tissue repair and remodelling. J Pathol. 2013;229:176–185. doi: 10.1002/path.4133. [DOI] [PubMed] [Google Scholar]
- 6.Tugal D, Liao X, Jain MK. Transcriptional control of macrophage polarization. Arteriosclerosis, thrombosis, and vascular biology. 2013;33:1135–1144. doi: 10.1161/ATVBAHA.113.301453. [DOI] [PubMed] [Google Scholar]
- 7.Murray PJ, Wynn TA. Obstacles and opportunities for understanding macrophage polarization. J Leukoc Biol. 2011;89:557–563. doi: 10.1189/jlb.0710409. [DOI] [PMC free article] [PubMed] [Google Scholar]
- 8.Liu G, Abraham E. MicroRNAs in immune response and macrophage polarization. Arterioscler Thromb Vasc Biol. 2013;33:170–177. doi: 10.1161/ATVBAHA.112.300068. [DOI] [PMC free article] [PubMed] [Google Scholar]
- 9.Ferrante CJ, Leibovich SJ. Regulation of Macrophage Polarization and Wound Healing. Advances in wound care. 2012;1:10–16. doi: 10.1089/wound.2011.0307. [DOI] [PMC free article] [PubMed] [Google Scholar]
- 10.Martinez FO, Sica A, Mantovani A, Locati M. Macrophage activation and polarization. Frontiers in bioscience : a journal and virtual library. 2008;13:453–461. doi: 10.2741/2692. [DOI] [PubMed] [Google Scholar]
- 11.Wynn TA. Fibrotic disease and the T(H)1/T(H)2 paradigm. Nature reviews. Immunology. 2004;4:583–594. doi: 10.1038/nri1412. [DOI] [PMC free article] [PubMed] [Google Scholar]
- 12.Pearce EL, Poffenberger MC, Chang CH, Jones RG. Fueling immunity: insights into metabolism and lymphocyte function. Science. 2013;342:1242454. doi: 10.1126/science.1242454. [DOI] [PMC free article] [PubMed] [Google Scholar]
- 13.Everts B, Amiel E, Huang SC, Smith AM, Chang CH, Lam WY, Redmann V, Freitas TC, Blagih J, van der Windt GJ, Artyomov MN, Jones RG, Pearce EL, Pearce EJ. TLR-driven early glycolytic reprogramming via the kinases TBK1-IKKvarepsilon supports the anabolic demands of dendritic cell activation. Nat Immunol. 2014;15:323–332. doi: 10.1038/ni.2833. [DOI] [PMC free article] [PubMed] [Google Scholar]
- 14.Chang CH, Curtis JD, Maggi LB, Jr., Faubert B, Villarino AV, O'Sullivan D, Huang SC, van der Windt GJ, Blagih J, Qiu J, Weber JD, Pearce EJ, Jones RG, Pearce EL. Posttranscriptional control of T cell effector function by aerobic glycolysis. Cell. 2013;153:1239–1251. doi: 10.1016/j.cell.2013.05.016. [DOI] [PMC free article] [PubMed] [Google Scholar]
- 15.Pearce EL, Pearce EJ. Metabolic pathways in immune cell activation and quiescence. Immunity. 2013;38:633–643. doi: 10.1016/j.immuni.2013.04.005. [DOI] [PMC free article] [PubMed] [Google Scholar]
- 16.Tannahill GM, Curtis AM, Adamik J, Palsson-McDermott EM, McGettrick AF, Goel G, Frezza C, Bernard NJ, Kelly B, Foley NH, Zheng L, Gardet A, Tong Z, Jany SS, Corr SC, Haneklaus M, Caffrey BE, Pierce K, Walmsley S, Beasley FC, Cummins E, Nizet V, Whyte M, Taylor CT, Lin H, Masters SL, Gottlieb E, Kelly VP, Clish C, Auron PE, Xavier RJ, O'Neill LA. Succinate is an inflammatory signal that induces IL-1beta through HIF-1alpha. Nature. 2013;496:238–242. doi: 10.1038/nature11986. [DOI] [PMC free article] [PubMed] [Google Scholar]
- 17.McGettrick AF, O'Neill LA. How metabolism generates signals during innate immunity and inflammation. J Biol Chem. 2013;288:22893–22898. doi: 10.1074/jbc.R113.486464. [DOI] [PMC free article] [PubMed] [Google Scholar]
- 18.Krawczyk CM, Holowka T, Sun J, Blagih J, Amiel E, DeBerardinis RJ, Cross JR, Jung E, Thompson CB, Jones RG, Pearce EJ. Toll-like receptor-induced changes in glycolytic metabolism regulate dendritic cell activation. Blood. 2010;115:4742–4749. doi: 10.1182/blood-2009-10-249540. [DOI] [PMC free article] [PubMed] [Google Scholar]
- 19.Huang SC, Everts B, Ivanova Y, O'Sullivan D, Nascimento M, Smith AM, Beatty W, Love-Gregory L, Lam WY, O'Neill CM, Yan C, Du H, Abumrad NA, Urban JF, Jr., Artyomov MN, Pearce EL, Pearce EJ. Cell-intrinsic lysosomal lipolysis is essential for alternative activation of macrophages. Nat Immunol. 2014;15:846–855. doi: 10.1038/ni.2956. [DOI] [PMC free article] [PubMed] [Google Scholar]
- 20.Vats D, Mukundan L, Odegaard JI, Zhang L, Smith KL, Morel CR, Wagner RA, Greaves DR, Murray PJ, Chawla A. Oxidative metabolism and PGC-1beta attenuate macrophage-mediated inflammation. Cell Metab. 2006;4:13–24. doi: 10.1016/j.cmet.2006.05.011. [DOI] [PMC free article] [PubMed] [Google Scholar]
- 21.Odegaard JI, Chawla A. Alternative macrophage activation and metabolism. Annu Rev Pathol. 2011;6:275–297. doi: 10.1146/annurev-pathol-011110-130138. [DOI] [PMC free article] [PubMed] [Google Scholar]
- 22.Roche TE, Hiromasa Y. Pyruvate dehydrogenase kinase regulatory mechanisms and inhibition in treating diabetes, heart ischemia, and cancer. Cell Mol Life Sci. 2007;64:830–849. doi: 10.1007/s00018-007-6380-z. [DOI] [PMC free article] [PubMed] [Google Scholar]
- 23.Kaplon J, Zheng L, Meissl K, Chaneton B, Selivanov VA, Mackay G, van der Burg SH, Verdegaal EME, Cascante M, Shlomi T, Gottlieb E, Peeper DS. A key role for mitochondrial gatekeeper pyruvate dehydrogenase in oncogene-induced senescence. Nature. 2013;498:109–112. doi: 10.1038/nature12154. [DOI] [PubMed] [Google Scholar]
- 24.Newington JT, Rappon T, Albers S, Wong DY, Rylett RJ, Cumming RC. Overexpression of pyruvate dehydrogenase kinase 1 and lactate dehydrogenase A in nerve cells confers resistance to amyloid beta and other toxins by decreasing mitochondrial respiration and reactive oxygen species production. J Biol Chem. 2012;287:37245–37258. doi: 10.1074/jbc.M112.366195. [DOI] [PMC free article] [PubMed] [Google Scholar]
- 25.Koppenol WH, Bounds PL, Dang CV. Otto Warburg's contributions to current concepts of cancer metabolism. Nat Rev Cancer. 2011;11:325–337. doi: 10.1038/nrc3038. [DOI] [PubMed] [Google Scholar]
- 26.DeBerardinis RJ, Lum JJ, Hatzivassiliou G, Thompson CB. The biology of cancer: metabolic reprogramming fuels cell growth and proliferation. Cell Metab. 2008;7:11–20. doi: 10.1016/j.cmet.2007.10.002. [DOI] [PubMed] [Google Scholar]
- 27.DeBerardinis RJ, Thompson CB. Cellular metabolism and disease: what do metabolic outliers teach us? Cell. 2012;148:1132–1144. doi: 10.1016/j.cell.2012.02.032. [DOI] [PMC free article] [PubMed] [Google Scholar]
- 28.Banerjee S, Xie N, Cui H, Tan Z, Yang S, Icyuz M, Abraham E, Liu G. MicroRNA let-7c regulates macrophage polarization. J Immunol. 2013;190:6542–6549. doi: 10.4049/jimmunol.1202496. [DOI] [PMC free article] [PubMed] [Google Scholar]
- 29.Adamo R, Sokol S, Soong G, Gomez MI, Prince A. Pseudomonas aeruginosa flagella activate airway epithelial cells through asialoGM1 and toll-like receptor 2 as well as toll-like receptor 5. Am J Respir Cell Mol Biol. 2004;30:627–634. doi: 10.1165/rcmb.2003-0260OC. [DOI] [PubMed] [Google Scholar]
- 30.Soong G, Reddy B, Sokol S, Adamo R, Prince A. TLR2 is mobilized into an apical lipid raft receptor complex to signal infection in airway epithelial cells. J Clin Invest. 2004;113:1482–1489. doi: 10.1172/JCI20773. [DOI] [PMC free article] [PubMed] [Google Scholar]
- 31.Yoshimura A, Lien E, Ingalls RR, Tuomanen E, Dziarski R, Golenbock D. Cutting edge: recognition of Gram-positive bacterial cell wall components by the innate immune system occurs via Toll-like receptor 2. J Immunol. 1999;163:1–5. [PubMed] [Google Scholar]
- 32.Flo TH, Halaas O, Lien E, Ryan L, Teti G, Golenbock DT, Sundan A, Espevik T. Human toll-like receptor 2 mediates monocyte activation by Listeria monocytogenes, but not by group B streptococci or lipopolysaccharide. J Immunol. 2000;164:2064–2069. doi: 10.4049/jimmunol.164.4.2064. [DOI] [PubMed] [Google Scholar]
- 33.Fleetwood AJ, Lawrence T, Hamilton JA, Cook AD. Granulocyte-macrophage colony-stimulating factor (CSF) and macrophage CSF-dependent macrophage phenotypes display differences in cytokine profiles and transcription factor activities: implications for CSF blockade in inflammation. J Immunol. 2007;178:5245–5252. doi: 10.4049/jimmunol.178.8.5245. [DOI] [PubMed] [Google Scholar]
- 34.Couper KN, Blount DG, Riley EM. IL-10: the master regulator of immunity to infection. J Immunol. 2008;180:5771–5777. doi: 10.4049/jimmunol.180.9.5771. [DOI] [PubMed] [Google Scholar]
- 35.van de Laar L, Coffer PJ, Woltman AM. Regulation of dendritic cell development by GM-CSF: molecular control and implications for immune homeostasis and therapy. Blood. 2012;119:3383–3393. doi: 10.1182/blood-2011-11-370130. [DOI] [PubMed] [Google Scholar]
- 36.Everts B, Amiel E, van der Windt GJ, Freitas TC, Chott R, Yarasheski KE, Pearce EL, Pearce EJ. Commitment to glycolysis sustains survival of NO-producing inflammatory dendritic cells. Blood. 2012;120:1422–1431. doi: 10.1182/blood-2012-03-419747. [DOI] [PMC free article] [PubMed] [Google Scholar]
- 37.Holden HM, Rayment I, Thoden JB. Structure and function of enzymes of the Leloir pathway for galactose metabolism. J Biol Chem. 2003;278:43885–43888. doi: 10.1074/jbc.R300025200. [DOI] [PubMed] [Google Scholar]
- 38.Takeda N, O'Dea EL, Doedens A, Kim JW, Weidemann A, Stockmann C, Asagiri M, Simon MC, Hoffmann A, Johnson RS. Differential activation and antagonistic function of HIF-{alpha} isoforms in macrophages are essential for NO homeostasis. Genes Dev. 2010;24:491–501. doi: 10.1101/gad.1881410. [DOI] [PMC free article] [PubMed] [Google Scholar]
- 39.He L, Kim T, Long Q, Liu J, Wang P, Zhou Y, Ding Y, Prasain J, Wood PA, Yang Q. Carnitine palmitoyltransferase-1b deficiency aggravates pressure overload-induced cardiac hypertrophy caused by lipotoxicity. Circulation. 2012;126:1705–1716. doi: 10.1161/CIRCULATIONAHA.111.075978. [DOI] [PMC free article] [PubMed] [Google Scholar]
- 40.Walker-Samuel S, Ramasawmy R, Torrealdea F, Rega M, Rajkumar V, Johnson SP, Richardson S, Goncalves M, Parkes HG, Arstad E, Thomas DL, Pedley RB, Lythgoe MF, Golay X. In vivo imaging of glucose uptake and metabolism in tumors. Nat Med. 2013;19:1067–1072. doi: 10.1038/nm.3252. [DOI] [PMC free article] [PubMed] [Google Scholar]
- 41.Vander Heiden MG, Lunt SY, Dayton TL, Fiske BP, Israelsen WJ, Mattaini KR, Vokes NI, Stephanopoulos G, Cantley LC, Metallo CM, Locasale JW. Metabolic pathway alterations that support cell proliferation. Cold Spring Harb Symp Quant Biol. 2011;76:325–334. doi: 10.1101/sqb.2012.76.010900. [DOI] [PubMed] [Google Scholar]
- 42.Ward PS, Thompson CB. Metabolic reprogramming: a cancer hallmark even warburg did not anticipate. Cancer Cell. 2012;21:297–308. doi: 10.1016/j.ccr.2012.02.014. [DOI] [PMC free article] [PubMed] [Google Scholar]
- 43.Palsson-McDermott EM, O'Neill LA. The Warburg effect then and now: from cancer to inflammatory diseases. Bioessays. 2013;35:965–973. doi: 10.1002/bies.201300084. [DOI] [PubMed] [Google Scholar]
Associated Data
This section collects any data citations, data availability statements, or supplementary materials included in this article.


