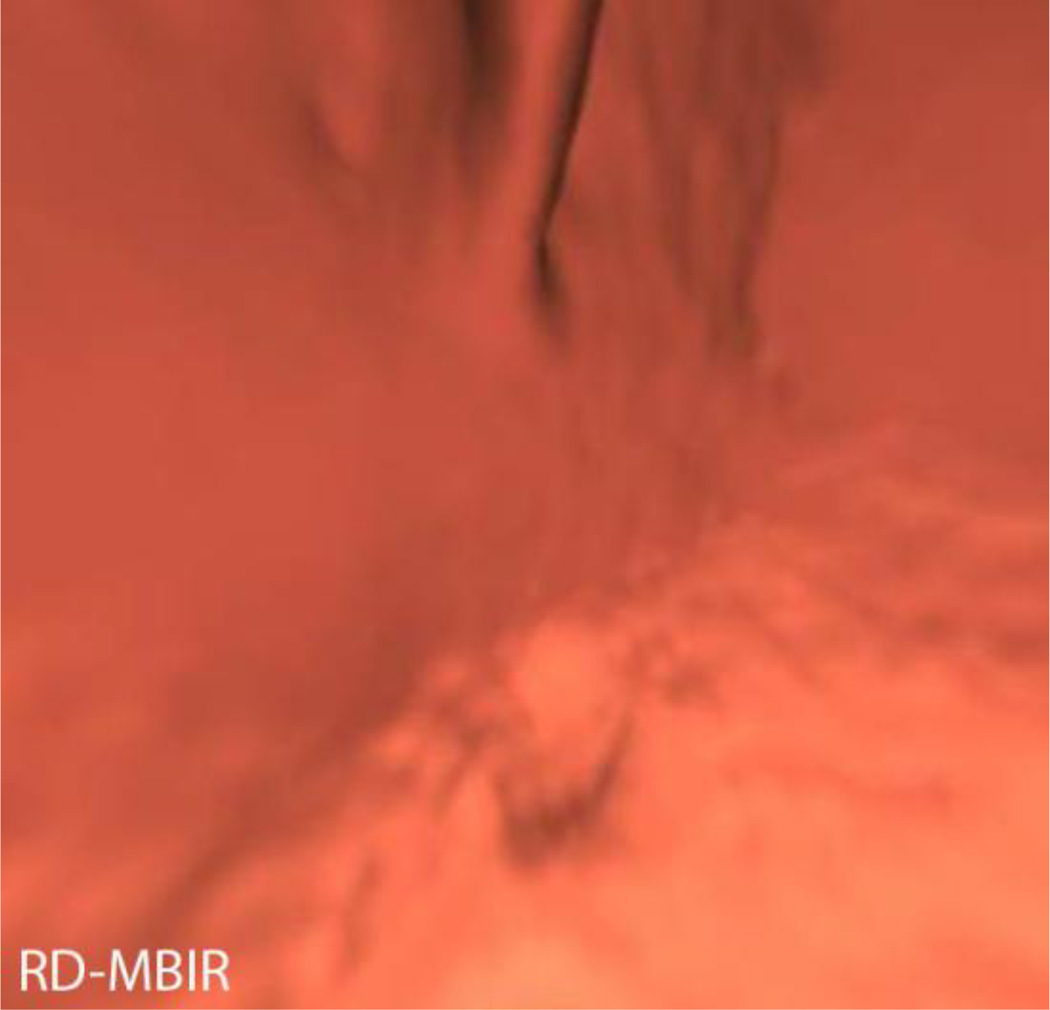
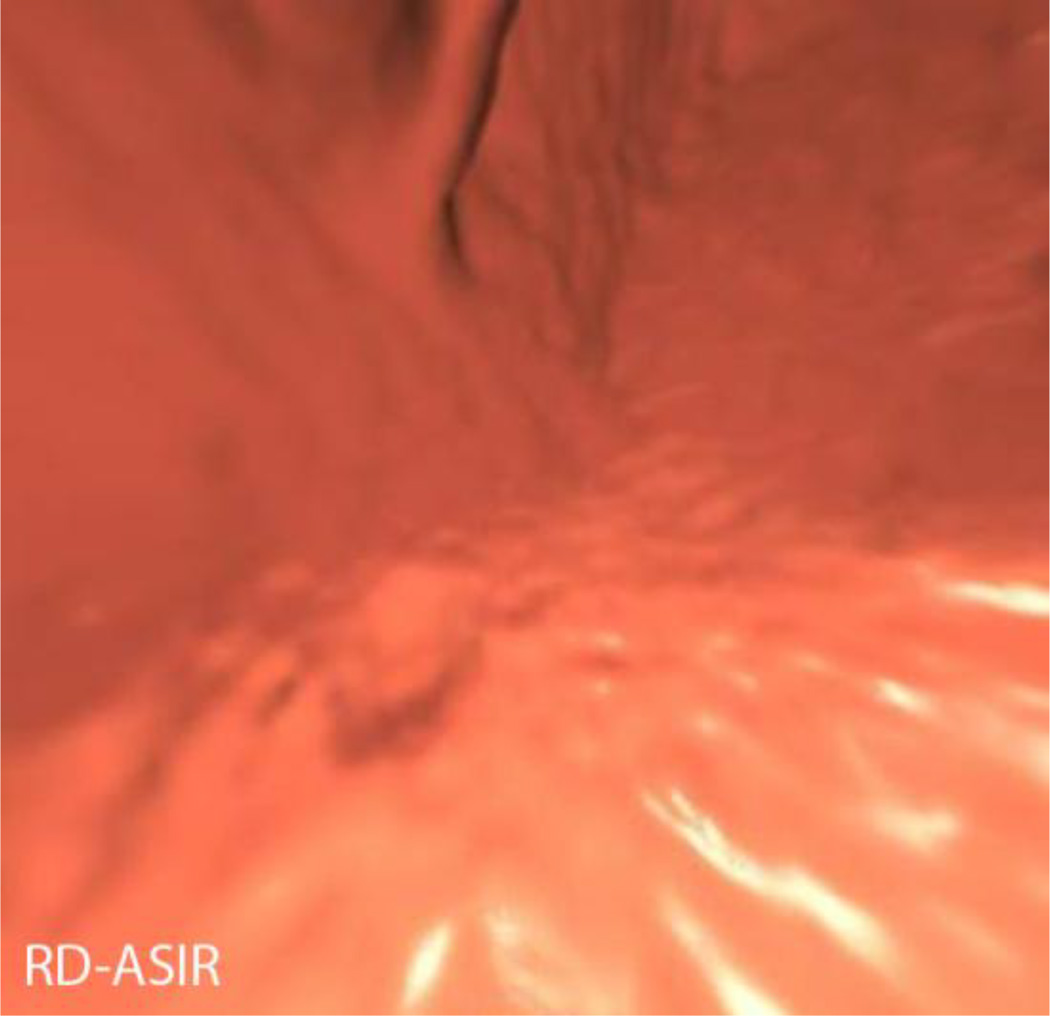
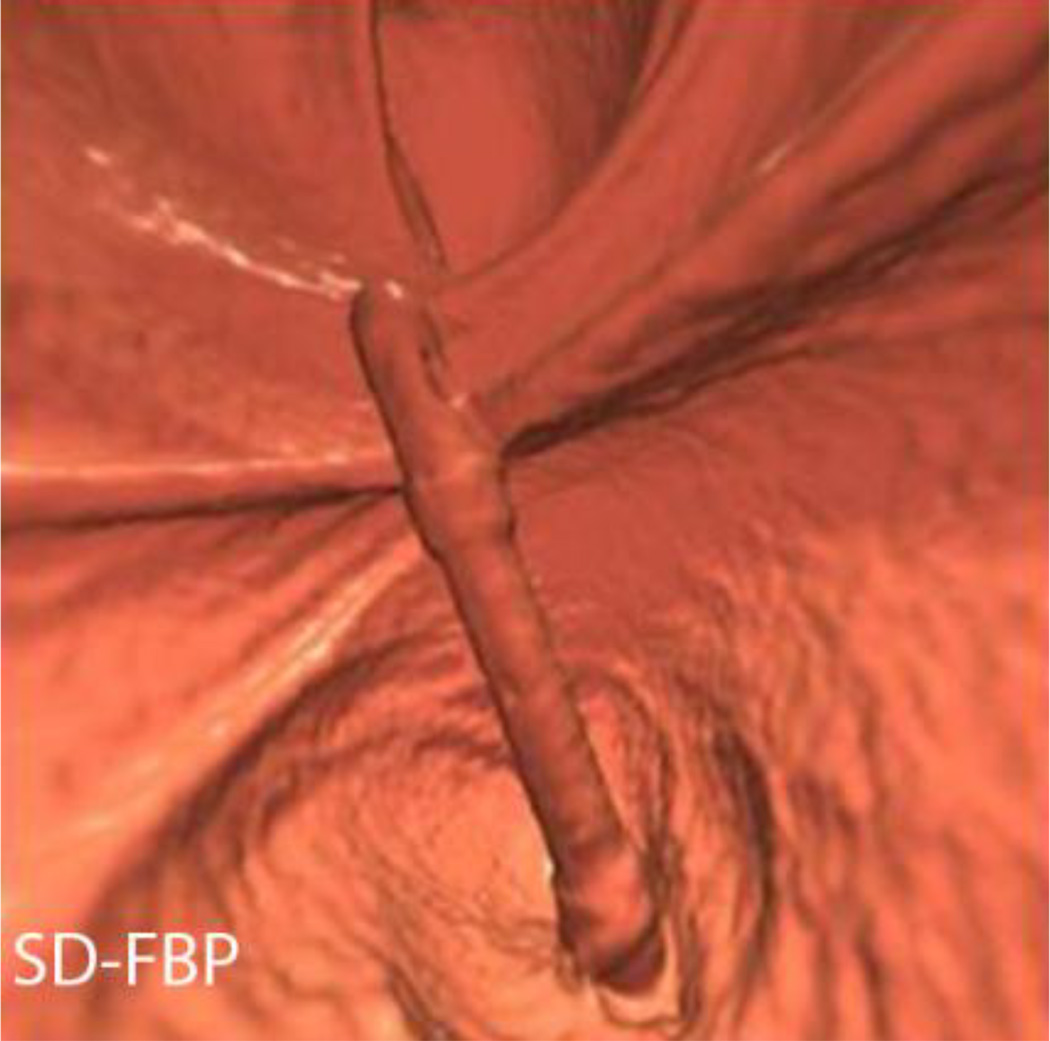
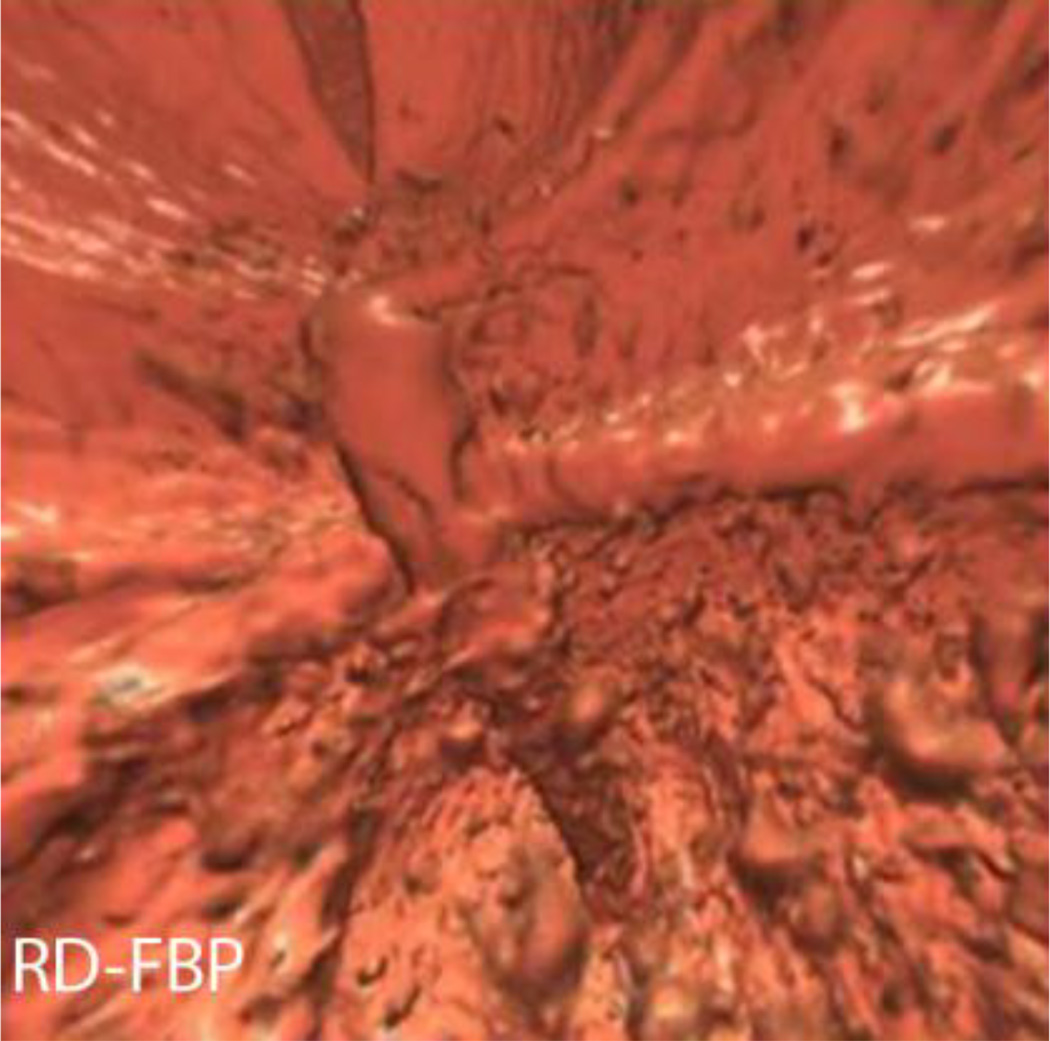
Abstract
Objective
To prospectively compare reduced-dose (RD) CT colonography (CTC) with standard-dose (SD) imaging using several reconstruction algorithms.
Methods
Following SD supine CTC, 40 patients (mean age, 57.3 years; 17 M/23 F, mean BMI, 27.2) underwent an additional RD supine examination (targeted dose reduction, 70–90%). DLP, CTDIvol, effective dose, and SSDE were compared. Several reconstruction algorithms were applied to RD series. SD-FBP served as reference standard. Objective image noise, subjective image quality and polyp conspicuity were assessed.
Results
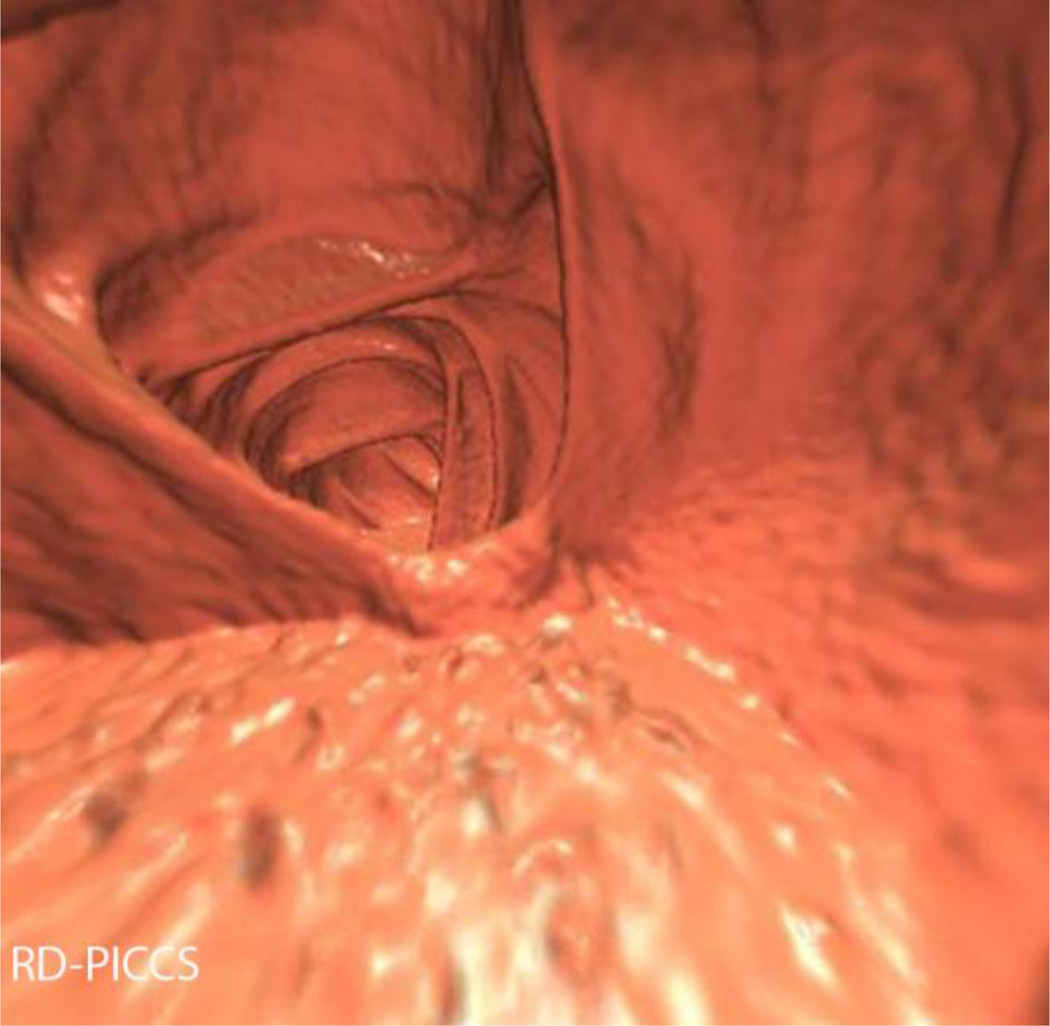
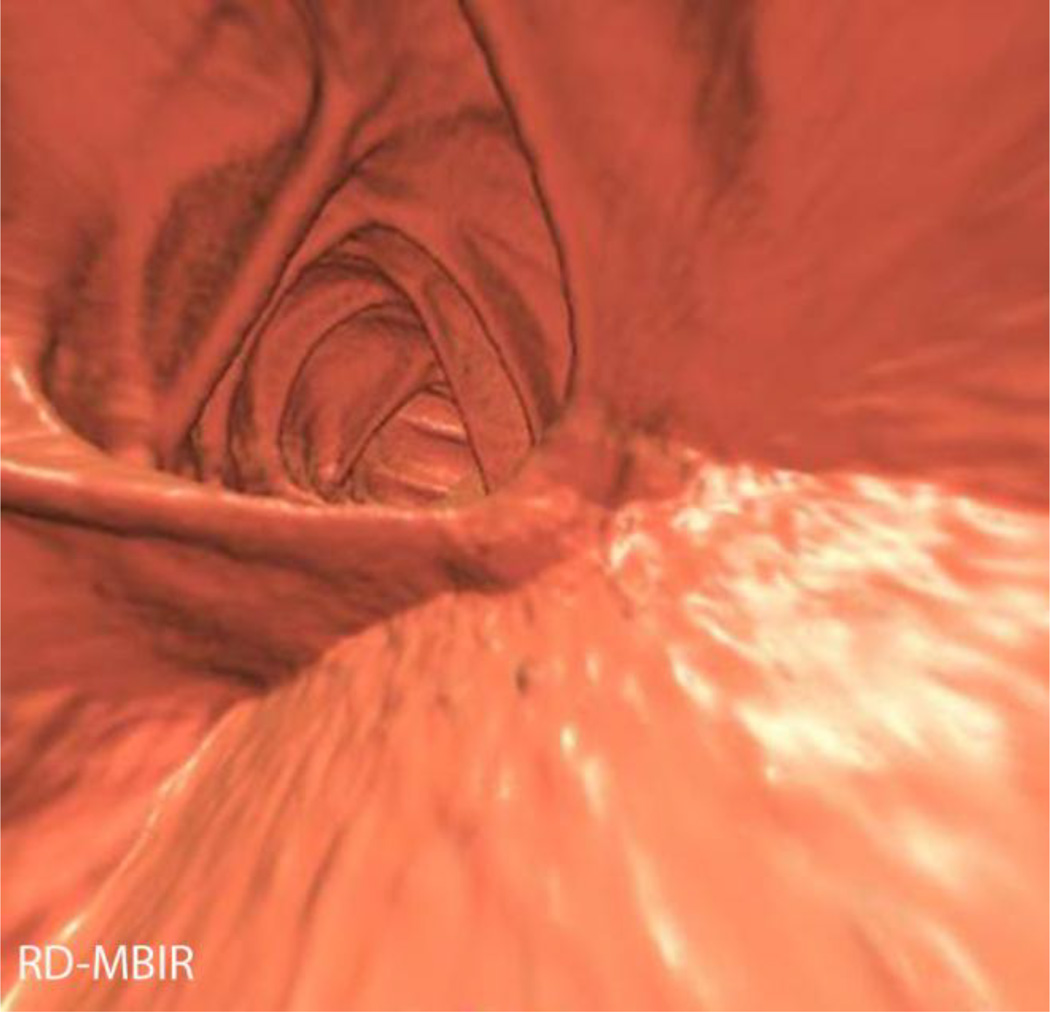
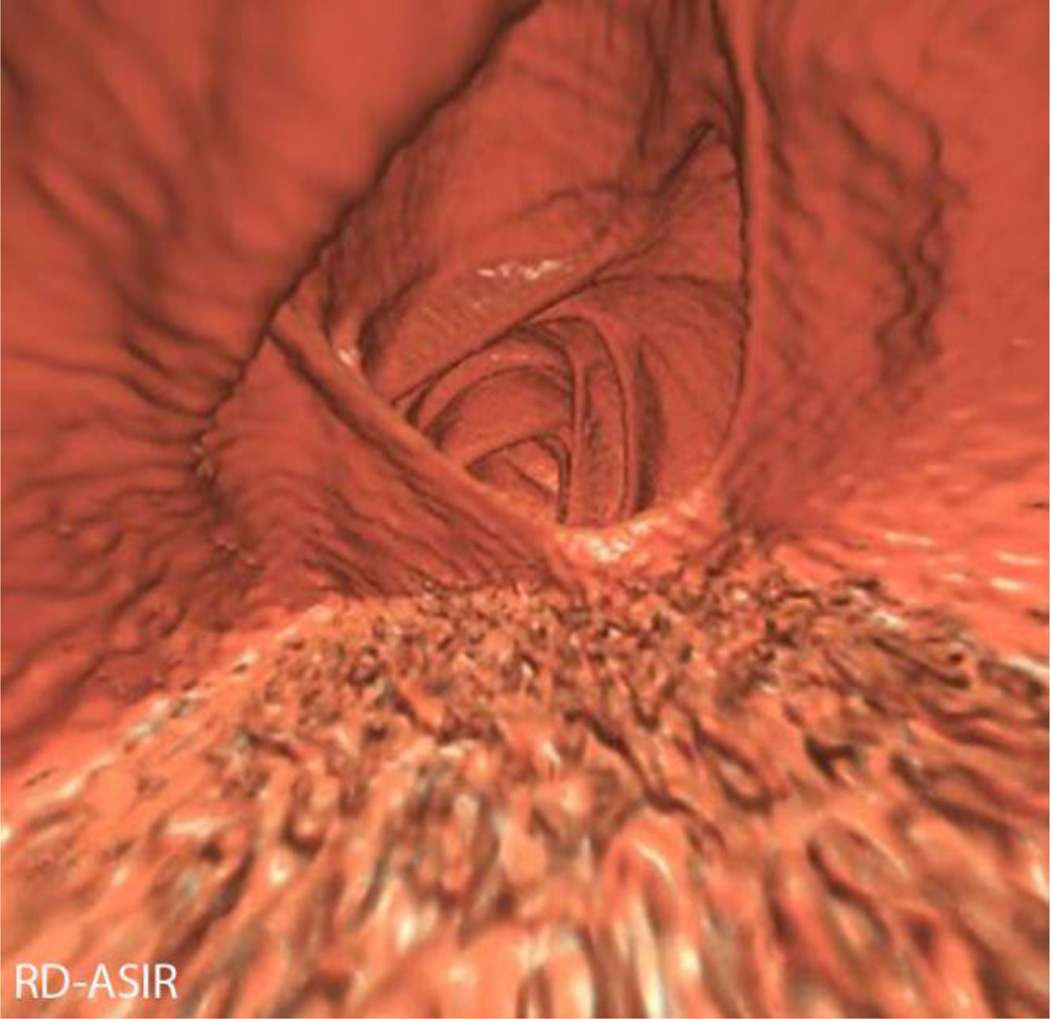
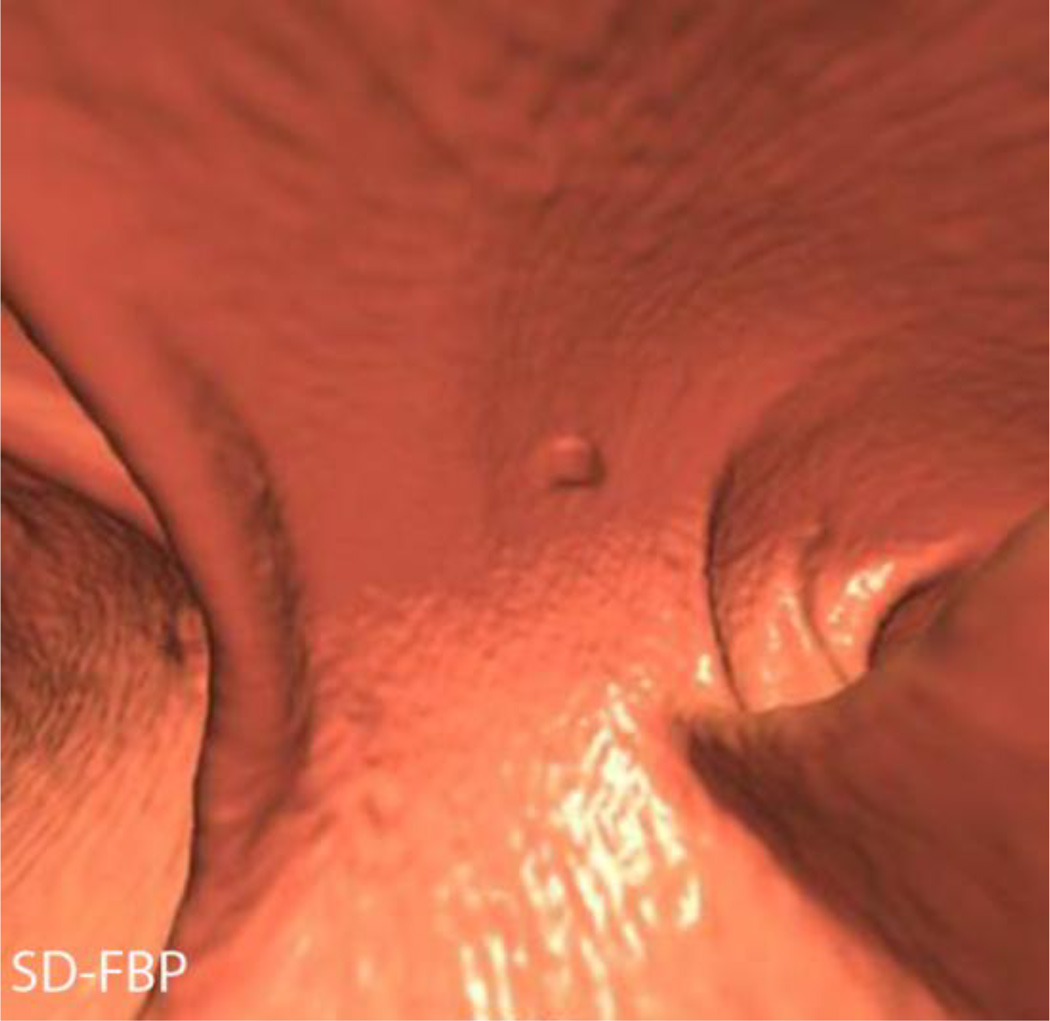
Mean CTDIvol and effective dose for RD series was 0.89 mGy (median 0.65) and 0.6 mSv (median 0.44), compared with 3.8 mGy (median 3.1) and 2.8 mSv (median 2.3) for SD series, respectively. Mean dose reduction was 78%. Mean image noise was significantly reduced on RD-PICCS (24.3±19HU) and RD-MBIR (19±18HU) compared with RD-FBP (90±33), RD-ASIR (72±27) and SD-FBP (47±14 HU). 2D image quality score was higher with RD-PICCS, RD-MBIR, and SD-FBP (2.7±0.4/2.8±0.4/2.9±0.6) compared with RD-FBP (1.5±0.4) and RD-ASIR (1.8±0.44). A similar trend was seen with 3D image quality scores. Polyp conspicuity scores were similar between SD-FBP/RD-PICCS/RD-MBIR (3.5±0.6/3.2±0.8/3.3±0.6).
Conclusion
Sub-milliSievert CTC performed with iterative reconstruction techniques demonstrate decreased image quality compared to SD, but improved image quality compared to RD images reconstructed with FBP.
Keywords: Computed Tomographic Colonography, Radiation Dosage, Multidetector Computed Tomography, Colonic Neoplasms, Computer-Assisted Image Processing
Introduction
Colorectal cancer (CRC) is the third most common cancer diagnosed in men and women in the United States and the third leading cause of cancer death, despite the fact it has a 90% cure rate when detected early [1]. Several reliable screening tests for CRC are available; however, only about half of adults over 50 are currently undergoing recommended screening in the US [2]. CT Colonography (CTC) is a valuable tool in screening for colorectal cancer that is as accurate as optical colonoscopy for polyps >10mm in average risk patients, but that is less invasive and does not require sedation [3–5]. However, there has been some concern over the ionizing radiation exposure associated with CTC [6]. Boellaard et al collected CT colonography protocols from 58 institutions and found the median effective dose for daily practice protocols was 7.6 mSv and screening protocols 4.4 mSv [7]. Several groups have done a risk-benefit analysis of the radiation risks associated with CTC compared to the potential benefits of screening, and have found that the benefits clearly outweigh the risks [8; 9]. However, given the theoretical risks associated with the ionizing radiation, a variety of methods have been employed to continue to decrease the radiation dose associated with CTC as low as possible [10–16].
With newer reconstruction methods including iterative reconstruction techniques, the CTC dose has been reduced considerably, into the milliSievert (mSv) range in some cases [17–20]. We previously retrospectively evaluated the use of Prior Image Constrained Compressed Sensing (PICCS) reconstruction algorithm in CT Colonography [21]. The purpose of this study was to prospectively evaluate low dose (generally sub-milliSievert) CTC in a series matched cohort using several reconstruction techniques, including PICCS, as well as Model-based iterative reconstruction, MBIR (Veo, GE Healthcare, Waukesha, WI) and Adaptive statistical iterative reconstruction, ASIR (GE Healthcare, Waukesha WI).
Materials and Methods
This prospective study was HIPAA-compliant and IRB approved. All subjects provided written informed consent.
Study Population, Preparation and scanning
Eligible patients included adult men and non-pregnant women scheduled to undergo CTC as part of their routine clinical care. Study dates ranged from 3/29/2011–8/13/2013. All patients underwent standard preparation prior to CTC. On the day prior to the CTC, patients were restricted to a clear liquid diet and received two 5-mg bisacodyl tablets taken before 11:00 AM. Patients then took 296 mL of magnesium citrate solution (Sun-Mark, San Francisco, CA) divided into two doses separated by 3 hours, 3–6 hours after the bisacodyl. Patients also received 250 mL of 2% wt/vol barium sulfate (Readi-Cat 2; E-Z-Em, Lake Success, NY) and one bottle (60 mL) of sodium diatrozoate/diatrozoate meglumine (MD-Gastroview; Mallinckrodt, Hazelwood, MO) taken 2–3 hours after the barium sulfate. At the time of the examination, a balloon-tipped rectal catheter was placed and automated CO2 delivery was used for colonic distention (PROTOCO2L, Bracco Diagnostics, NJ).
All patients were scanned on a 64-slice multidetector CT (MDCT) (Discovery CT 750 HD, GE Healthcare, Waukesha WI). Imaging parameters included a collimated slice thickness at the isocenter of 0.625 mm, 120 kV, automatic tube current modulation (30–330mA, SmartmA, GE Healthcare) and a study specific noise index (NI) of 50 for the standard dose (SD) series (Appendix 1). For the reduced dose series, based on prior retrospective data [21], we targeted a dose level of 10–30% of our clinical scans (ie, 70–90% dose reduction). We adjusted the NI of the clinical protocol to achieve this dose reduction goal, enabling us to perform one additional reduced dose scan at a net equal dose to our routine clinical examinations.
For each patient, the routine supine CTC with standard protocol was initially performed. Immediately following this series, a second dose-modified supine scan (targeted dose reduction in range of 70–90%) was added. The noise index and tube current range were adjusted to achieve the targeted dose reduction as above. This was followed by a standard dose prone and/or right lateral decubitus CTC series.
The prospective study cohort was comprised of 40 adult subjects (23 females, 17 males; mean age, 57.3 years) undergoing CT Colonography. The mean patient body mass index (BMI) was 27.2 (median 28.1, range 18.4–38.2). 15 subjects (38%) were obese (BMI>30). A total of 7 polyps were detected in this cohort (mean size 10 mm, range 6–19 mm).
Radiation Dose Metrics
The volume CTDI index (CTDIvol, mGy) and dose-length product (DLP, mGy*cm) were recorded for the matching standard dose and dose modified series. In addition, effective dose (mSv) was obtained from the dose-length product using the conversion factor 0.015 mSv/(mGy*cm) recommended by the American Association of Physicists in Medicine [22]and verified by Deak et al [23]. The recently recommended size specific dose estimate (SSDE) [24; 25] was also generated, using our previously described method [26].
CT Image Reconstruction
The standard dose supine and prone CTC series were reconstructed using filtered back projection (FBP). The reduced dose supine CTC series was reconstructed using multiple techniques including FBP, ASIR (GE Healthcare, Waukesha, WI), MBIR (Veo, GE Healthcare, Waukesha, WI) and PICCS, an additional iterative reconstruction technique. For the ASIR series, a 40% blend was applied, as has been reported in the literature [19; 27; 28]. The Veo reconstruction engine consists of 14 clustered computer nodes; each node is equipped with four 150 quad-core 2.53 GHz Xeon E5540 CPUs (Intel, Santa Clara, CA) and 12 GB memory. The reconstruction speed varies for different reconstruction volume sizes and scanning protocols. In this study, it took about 90 minutes to reconstruct the supine CTC volume with 600 slices with 0.625mm slice thickness. PICCS was applied to reconstruct images using a standard PC (Dual Intel Xeon 2.33 GHz CPUs, 8G RAM) with an Nvidia GeForce GTX TITAN graphic card (2688 CUDA cores) at 4 frames per second (fps), which results in a reconstruction time of 2.5 minutes for the same image volume with 0.625 mm slice thickness [29]. Using the PICCS reconstruction algorithm, the traditional tradeoff between noise level and spatial resolution is decoupled to achieve both low noise and high spatial resolution CT reconstruction as described previously [21; 30].
Images were then sent to a picture archiving and communication system (PACS) (McKesson, San Francisco, CA) reconstructed at 1.25 mm section thickness and 1-mm reconstruction interval. Images were also sent to a 3D stand-alone workstation (Viatronix, StonyBrook NY) for review.
CT Image Analysis
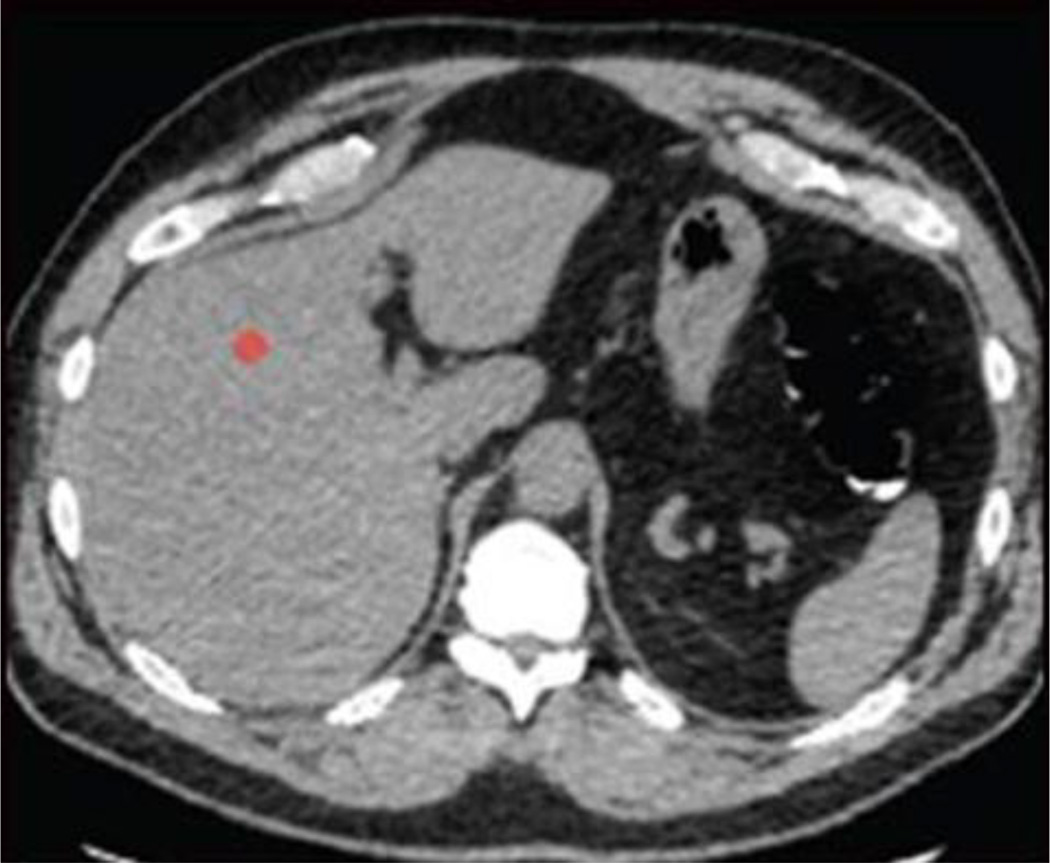
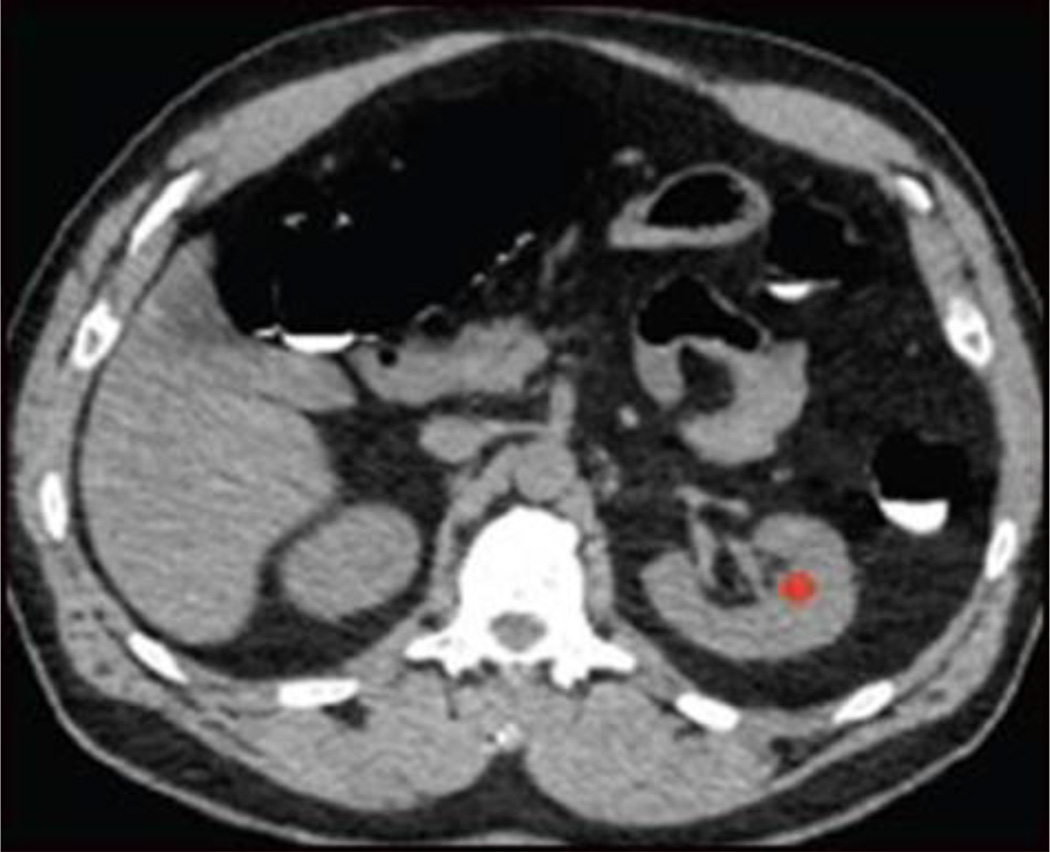
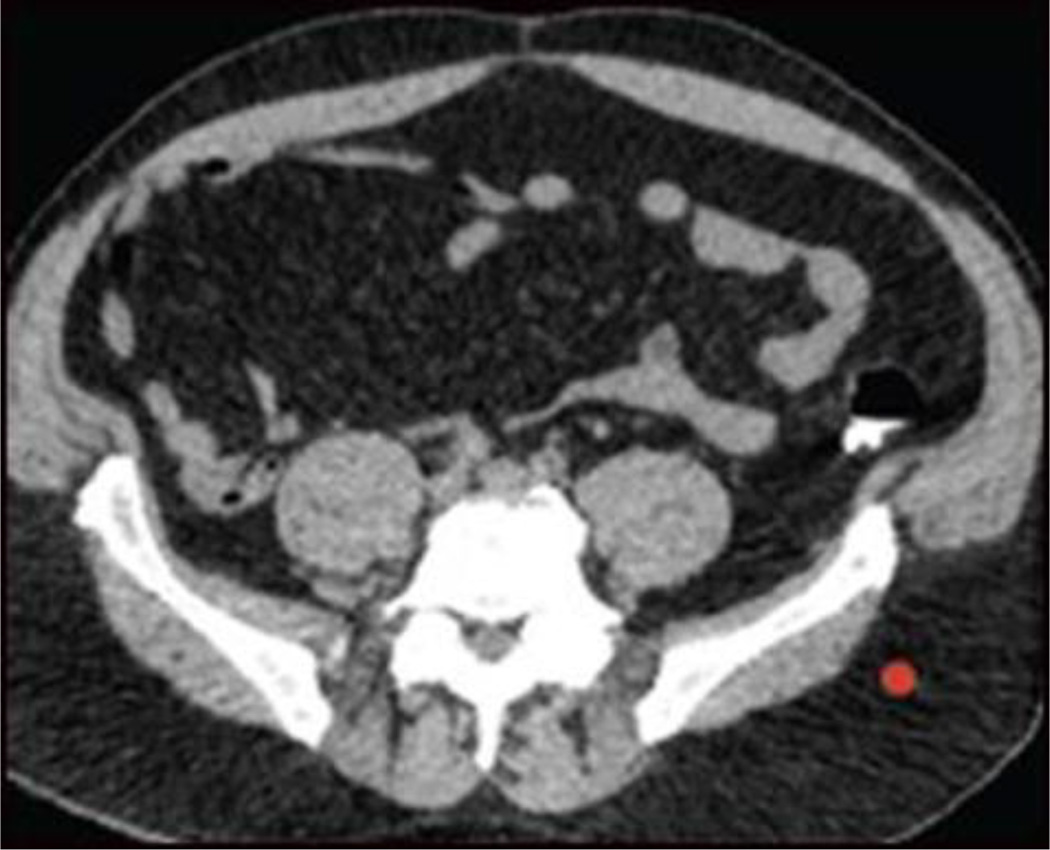
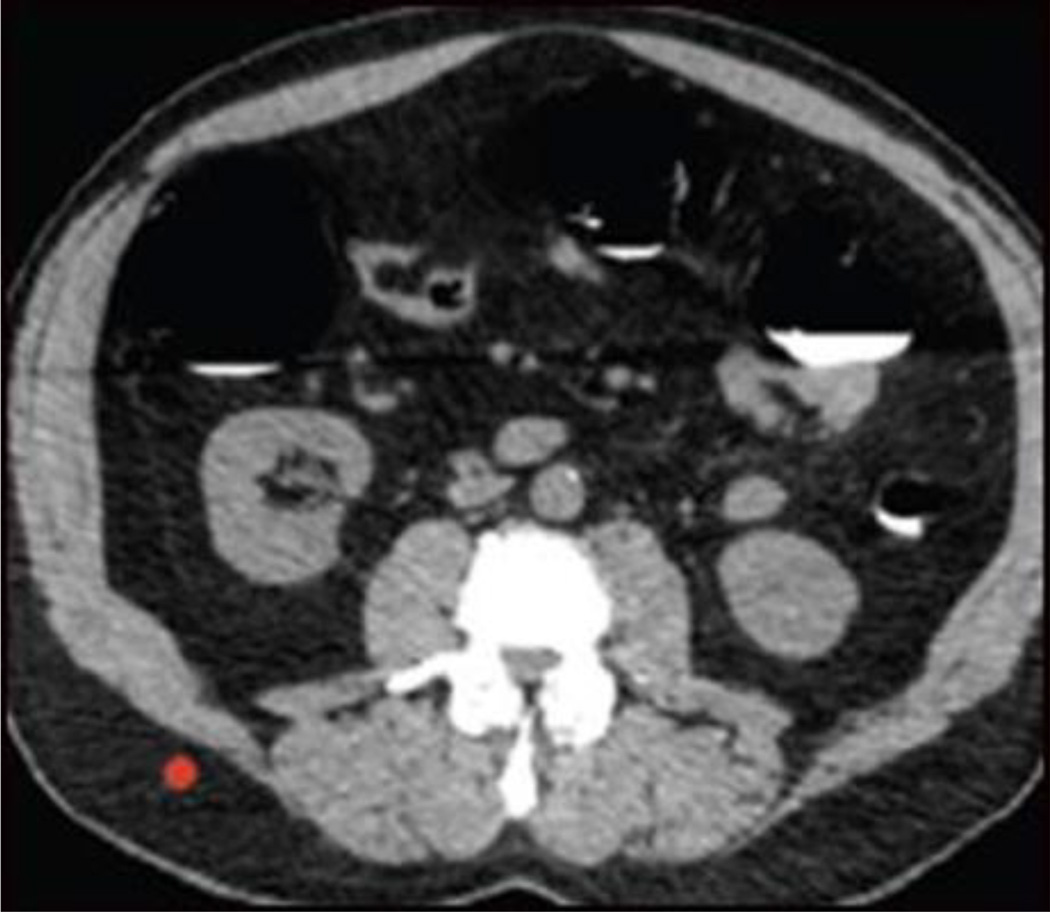
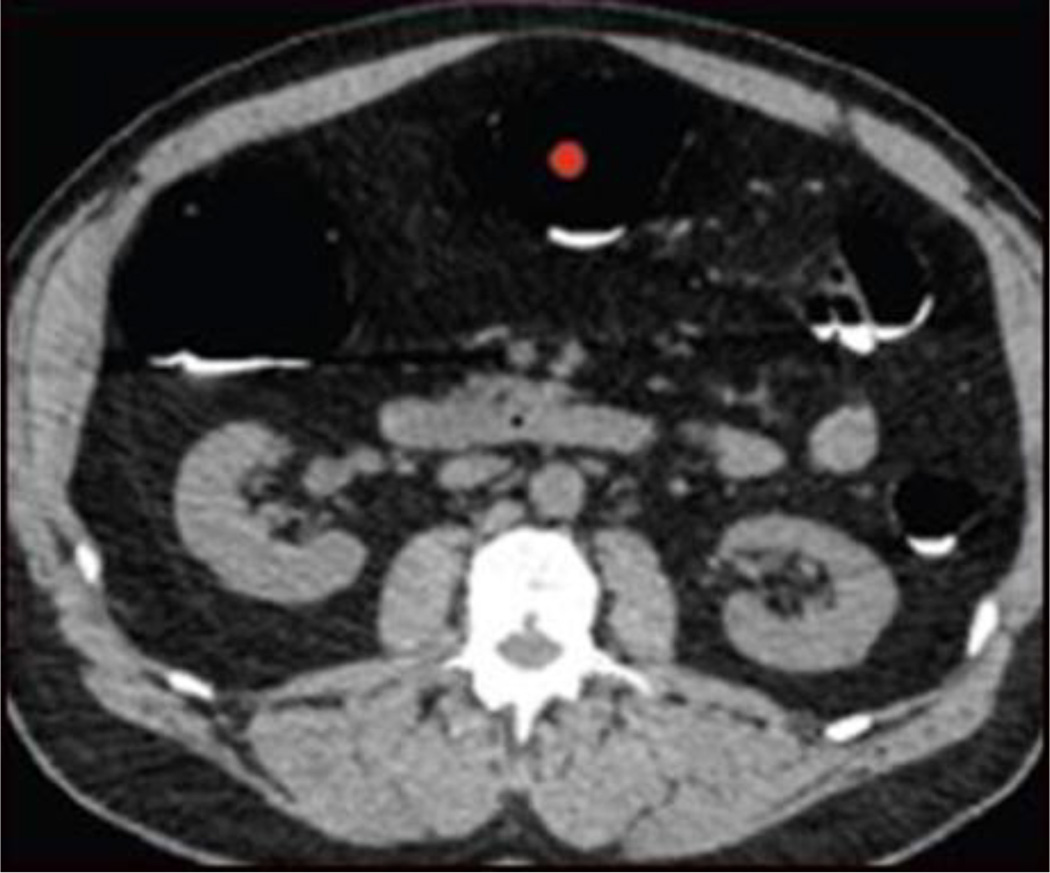
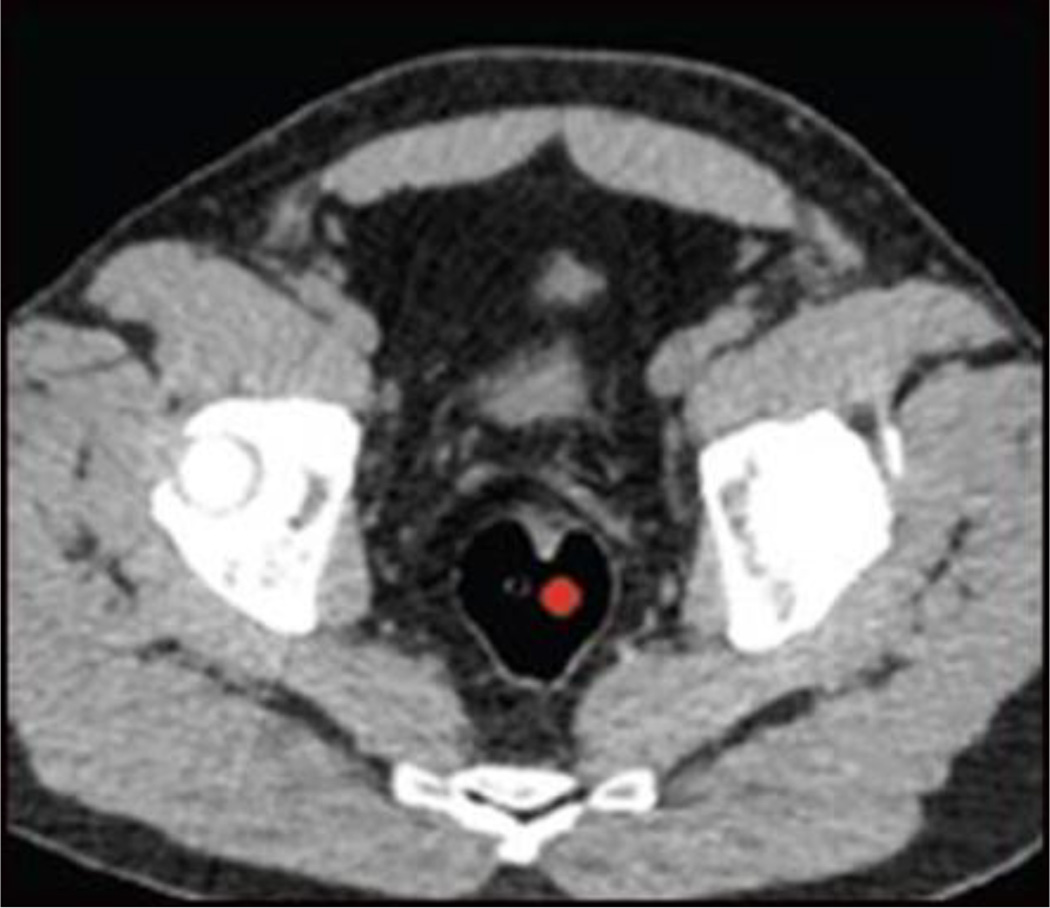
Objective image noise was measured at 6 sites on the 2D images, including 2 parenchymal sites (right hepatic lobe, left kidney), 2 subcutaneous fat sites (right and left flanks) and 2 colonic air column sites (transverse colon and rectum) (Figure 1). All ROIs were placed by a single observer using a 100mm2 round ROI. The ROI placement on each reduced dose series was matched exactly because the ROIs were derived from the same dataset. ROI placement on the standard dose images was matched as closely as possible to that on the reduced dose series.
Figure 1.
ROI placement for objective noise measurement. Small red circles indicate location of ROIs, with two parenchymal sites (liver, A; left kidney, B), two fat attenuation sites (subcutaneous fat of left flank, C; right flank, D), and two colonic air column sites (transverse colon, E; rectum, F). ROIs were placed in homogeneous areas without vessels, soft tissue stranding etc.
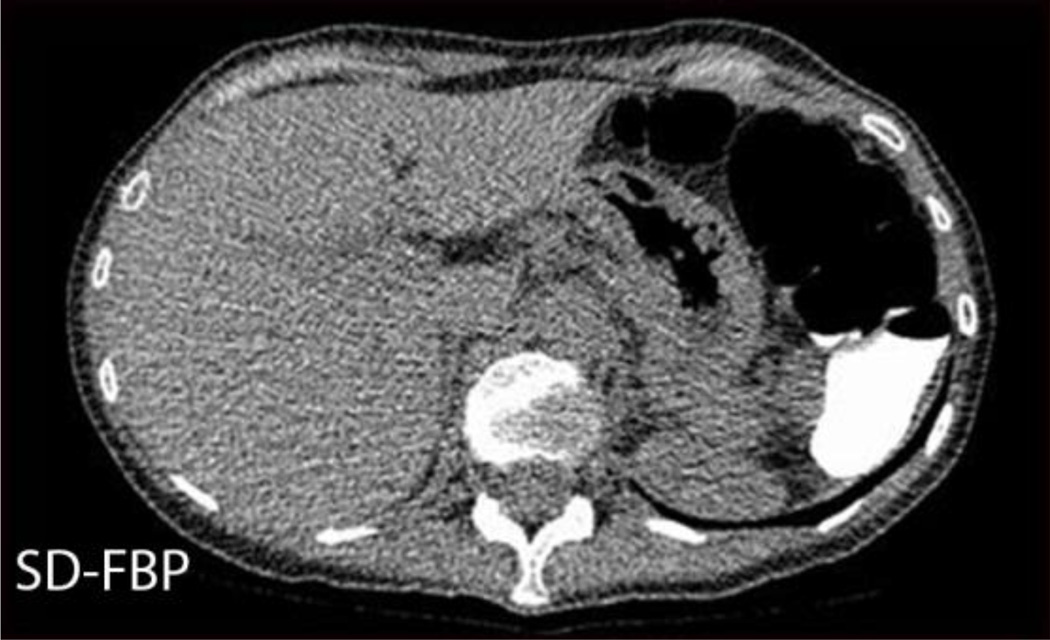
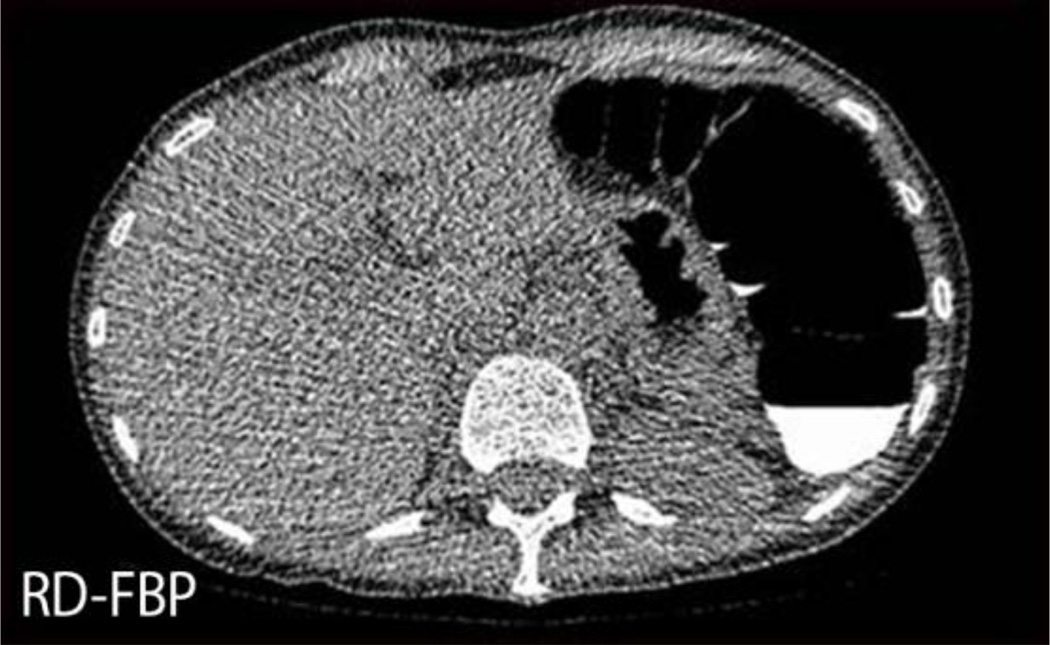
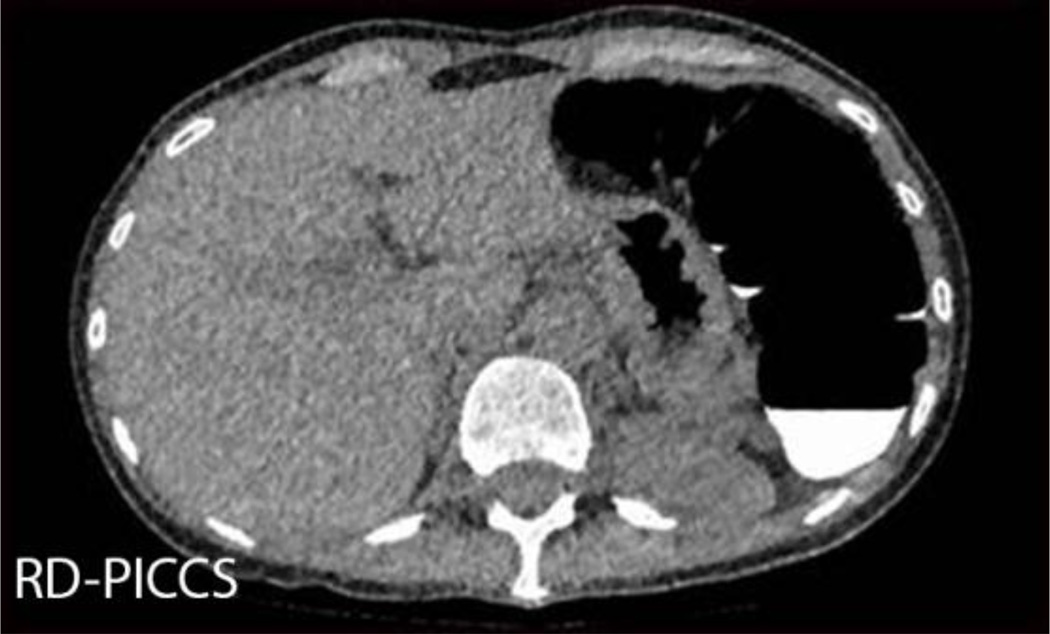
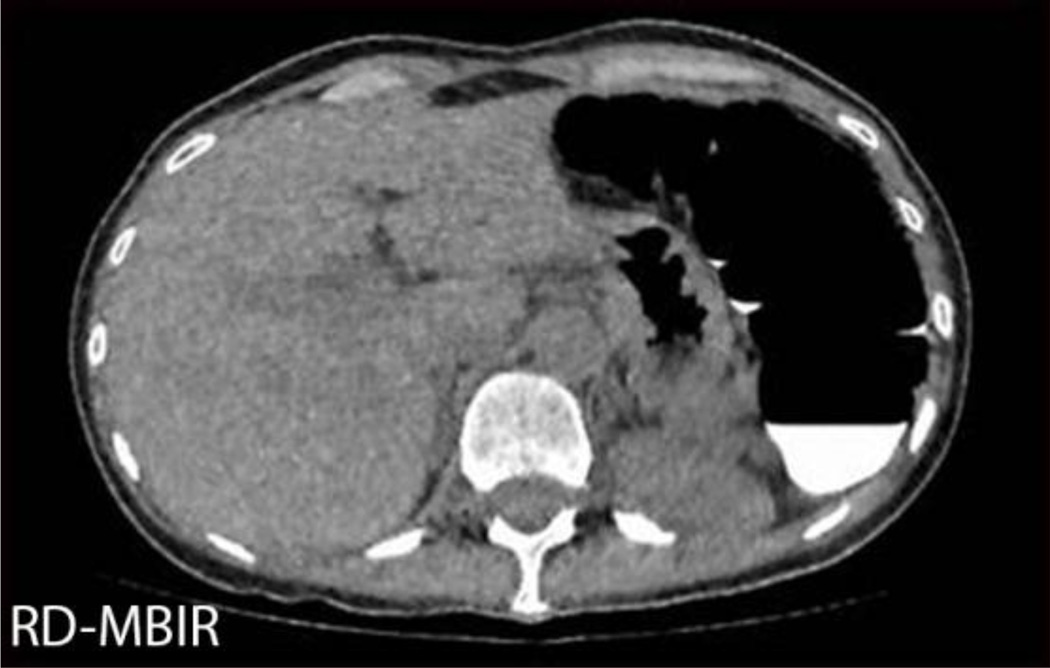
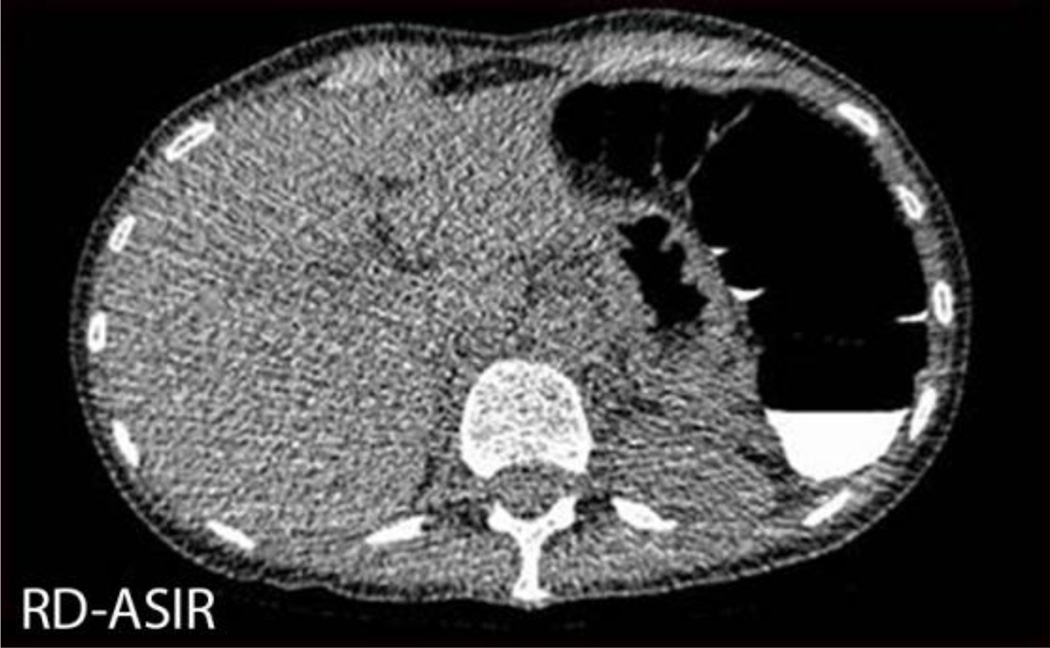
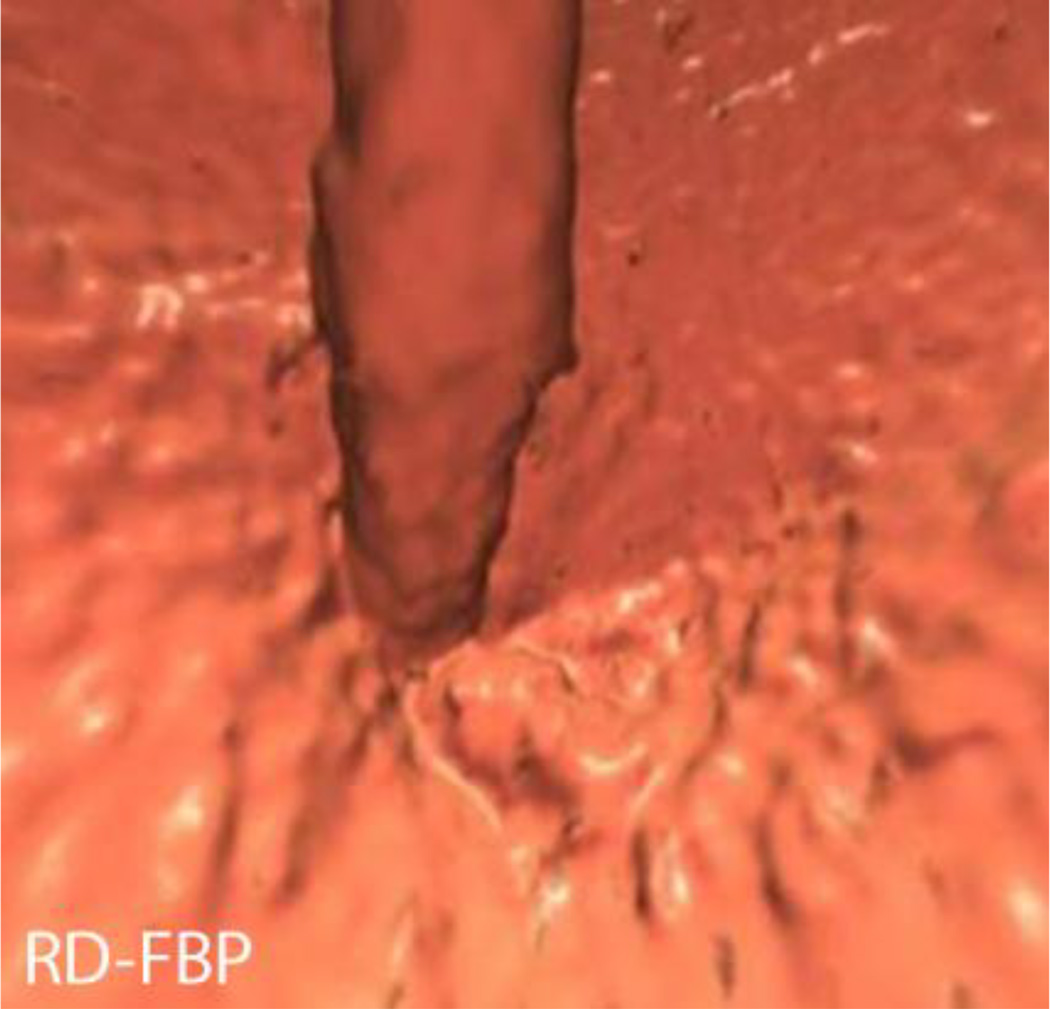
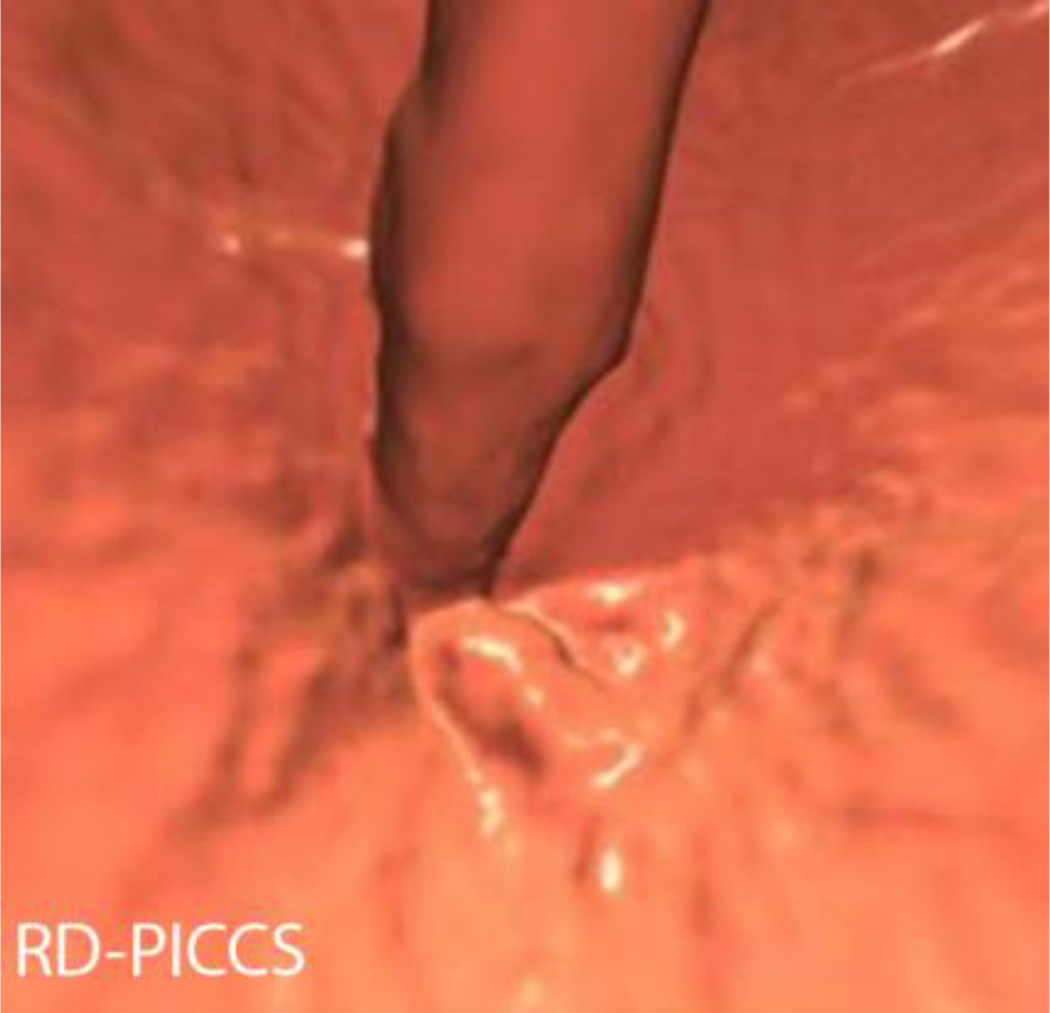
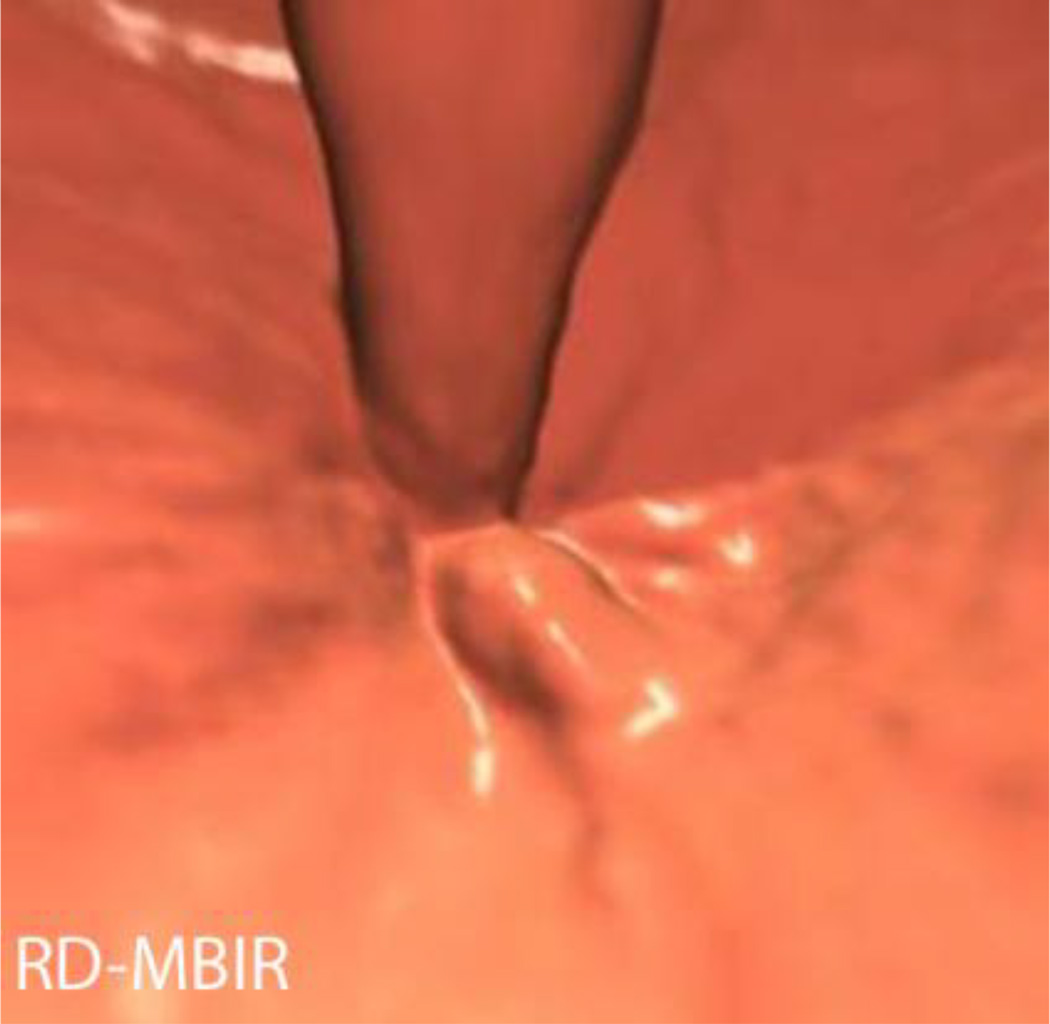
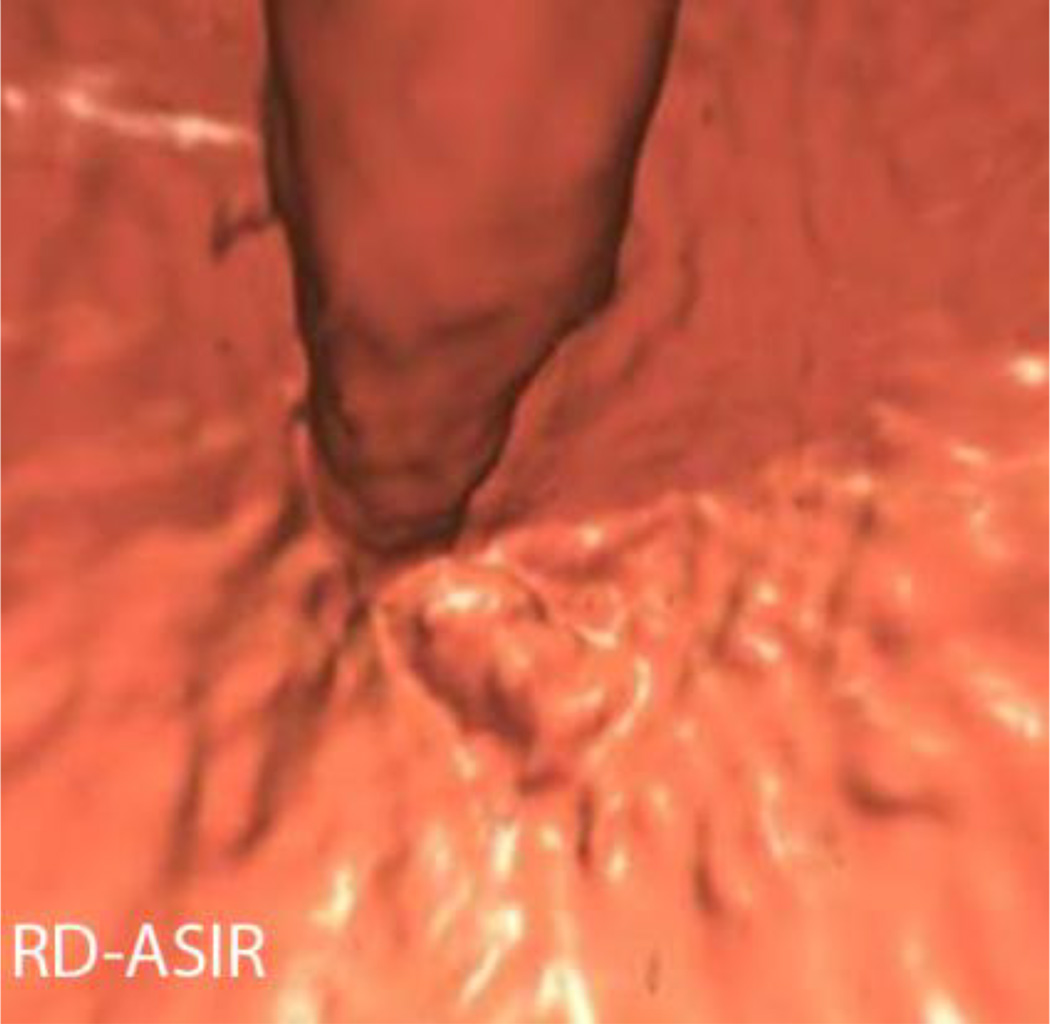
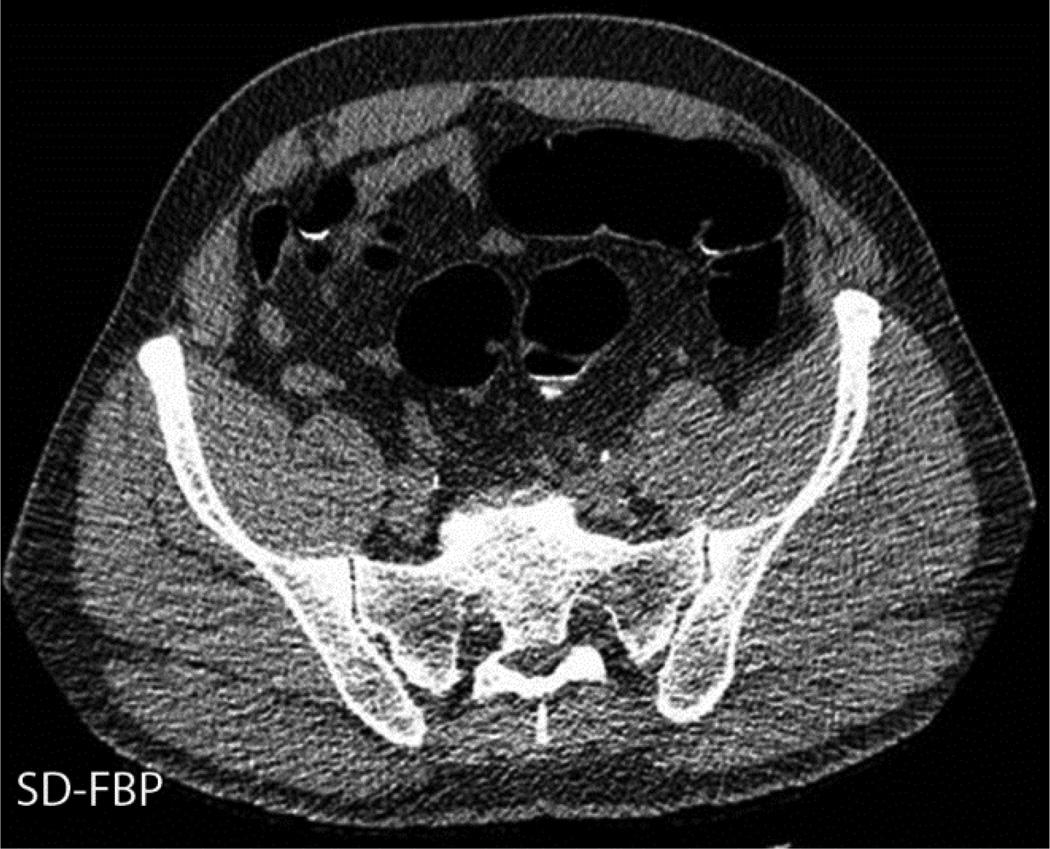
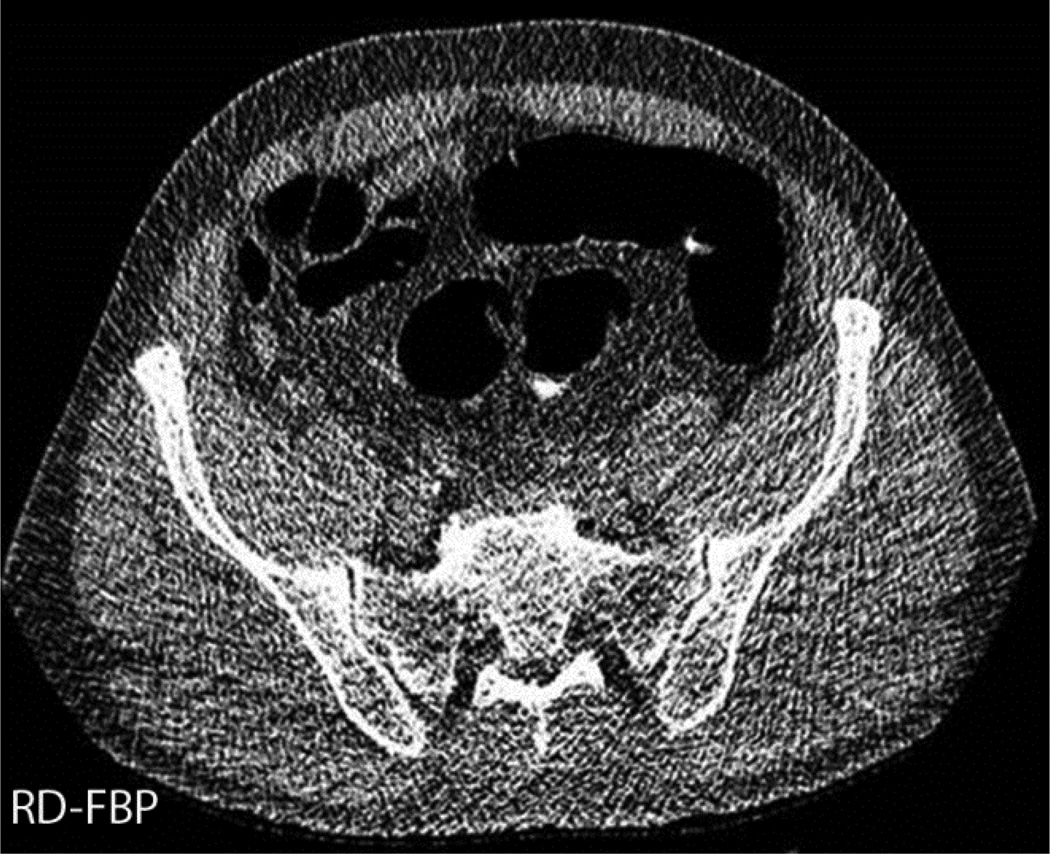
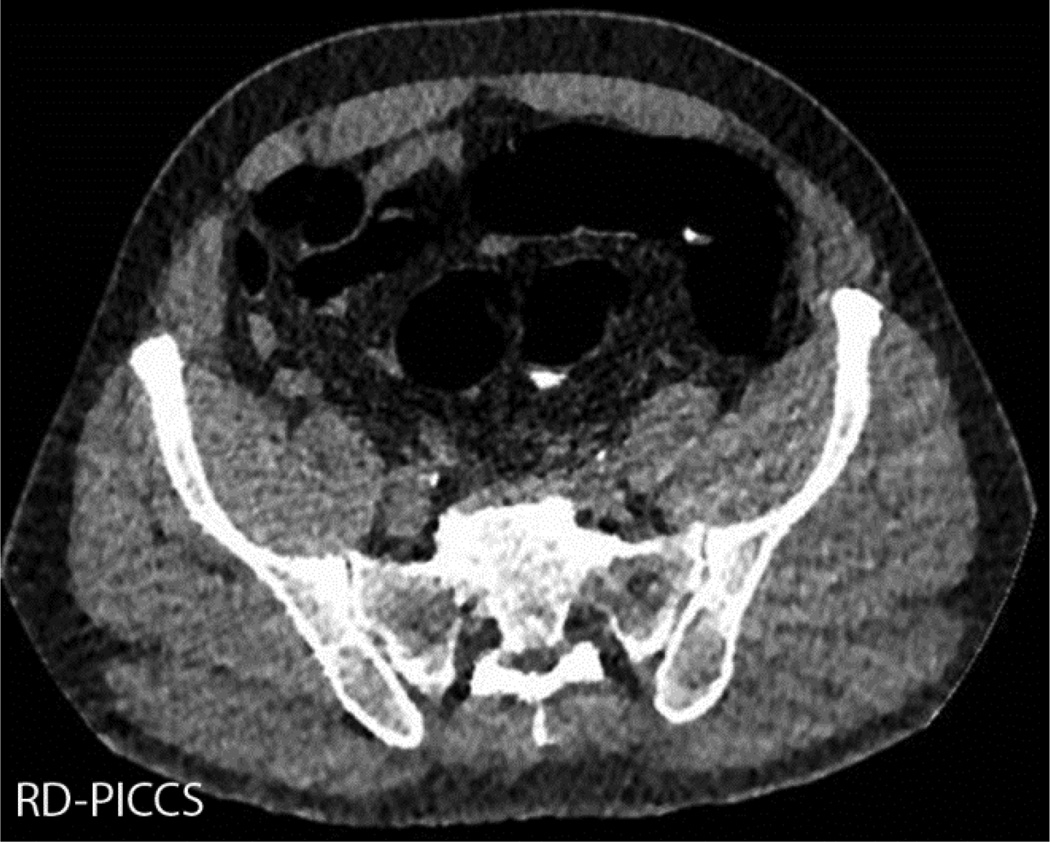
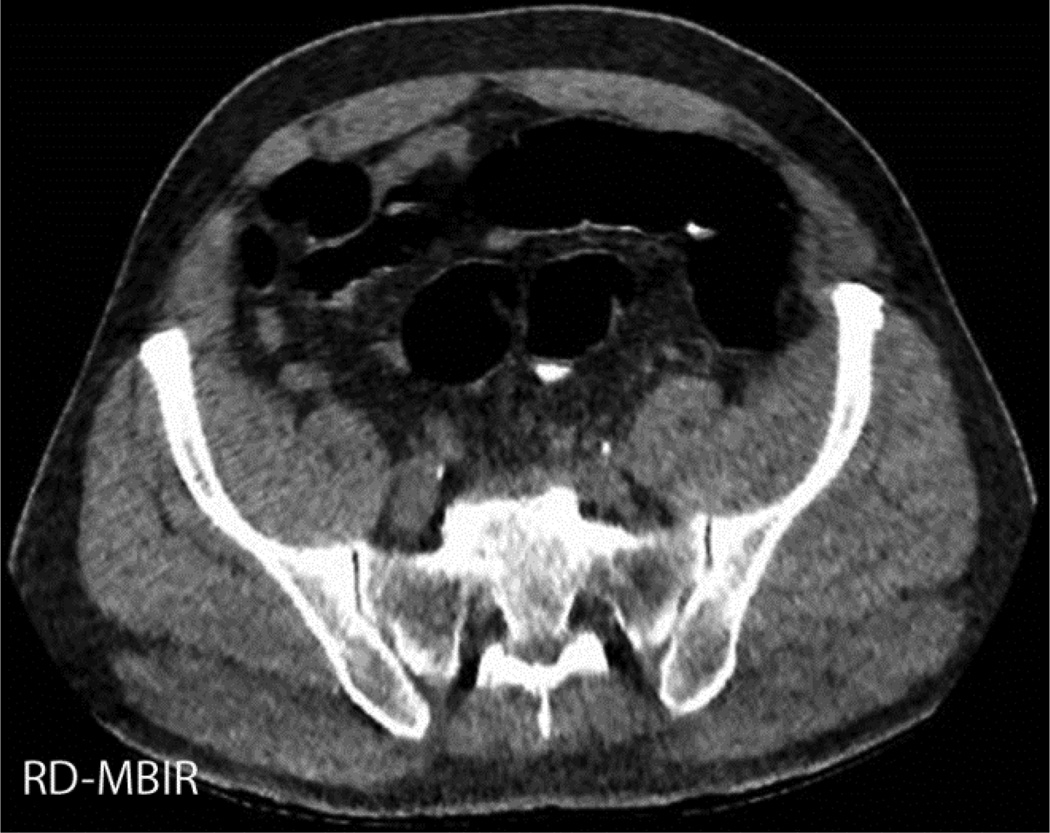
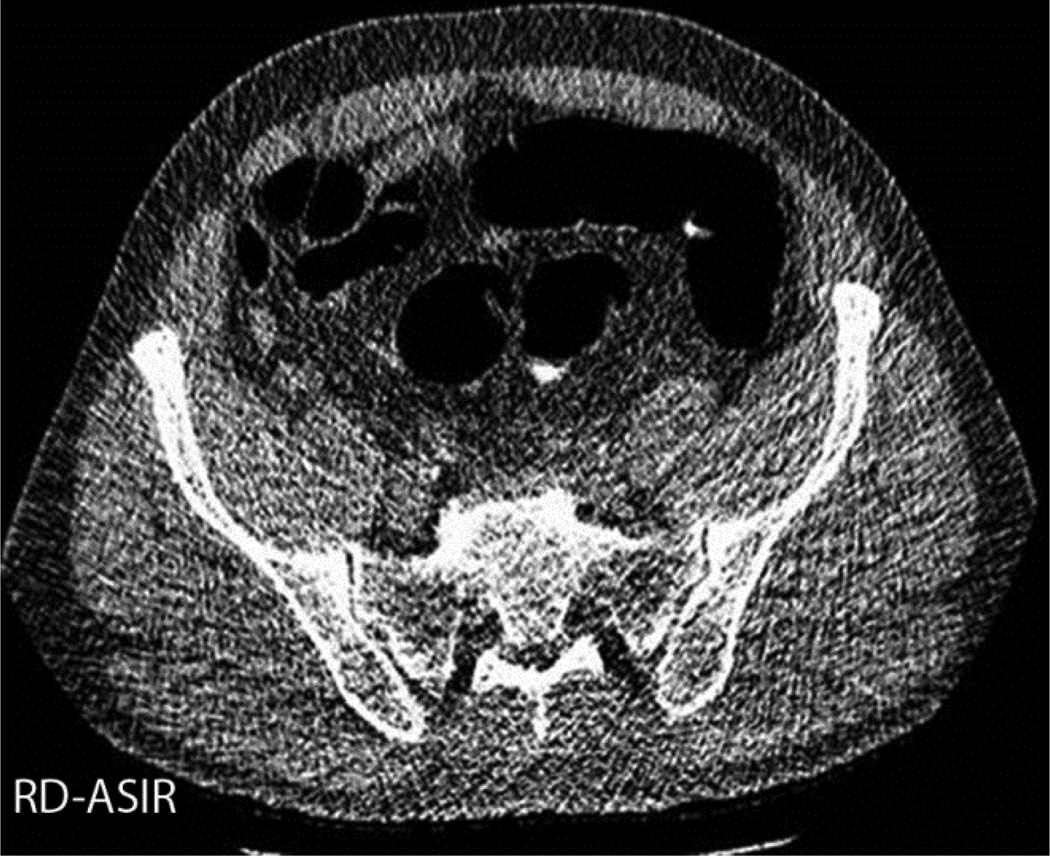
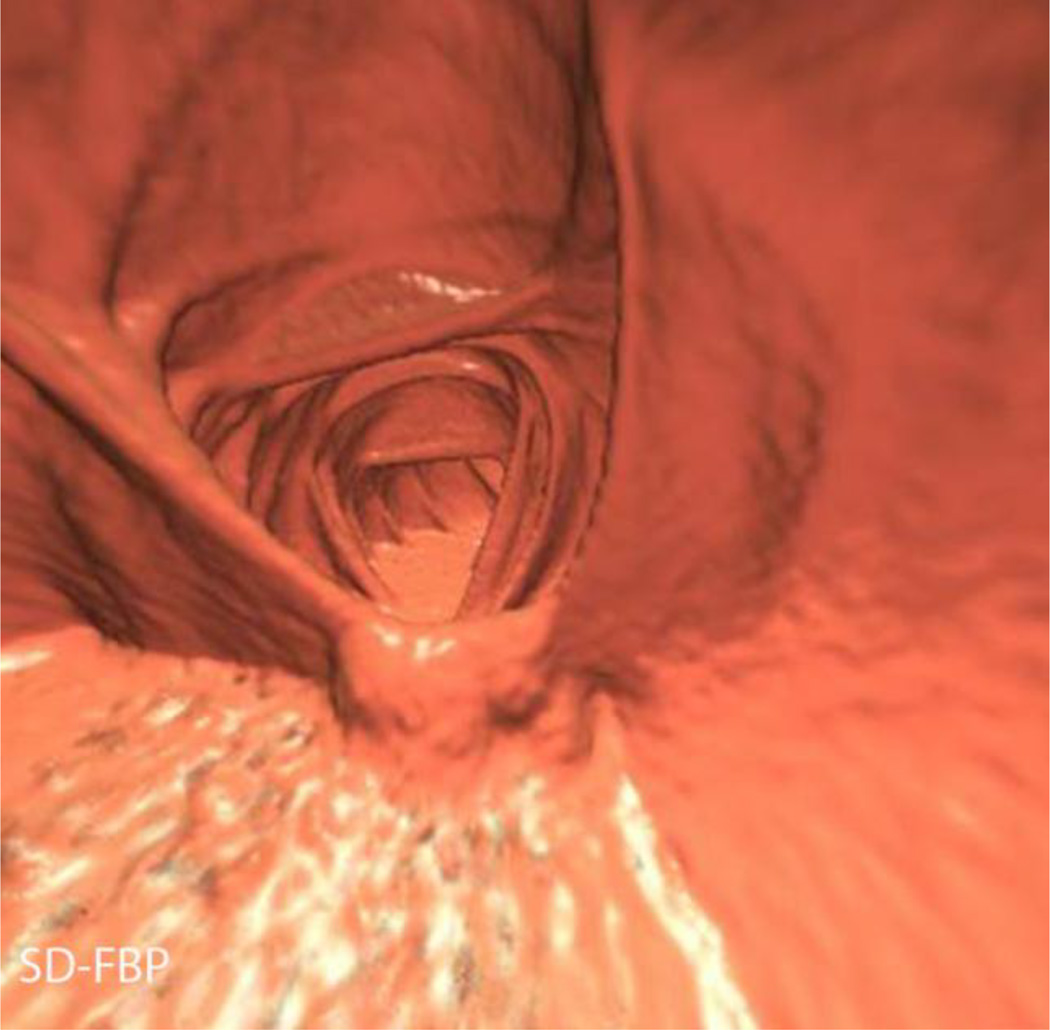
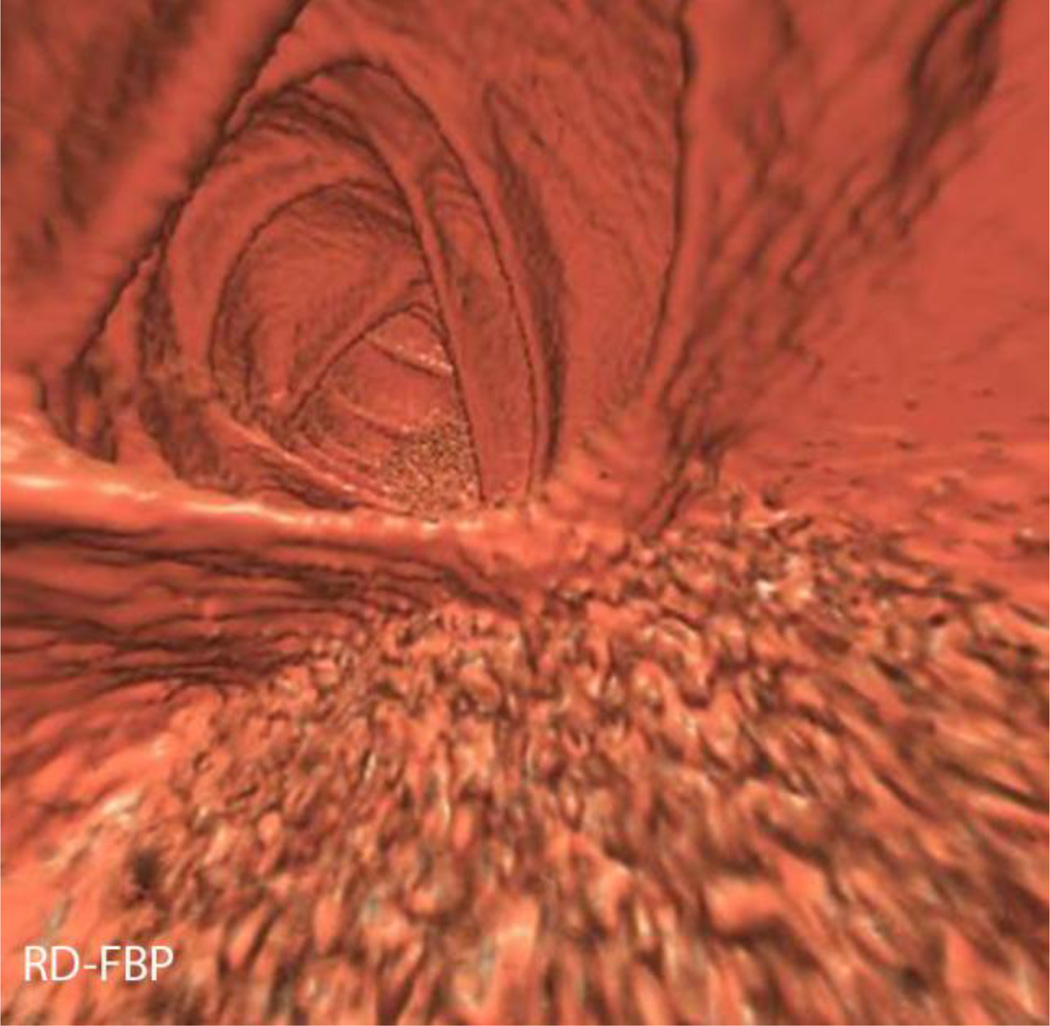
Evaluation of both 2D and 3D image quality was performed by three blinded readers of varying levels of experience (first year radiology resident, 2 fellowship trained abdominal radiologists with 6yrs, 10 yrs of experience respectively). All readers were blinded to the series being read (included SD and RD dose series of varying reconstructions, 5 series total per patient) and each series was presented in random order by patient. 2D image quality was evaluated at 2 sites, the level of the portal venous bifurcation and in the pelvis at the level of the sacroiliac joints. 3D image quality was assessed at the level of the rectal catheter and the ileocecal valve (Figure 23). Image quality was graded on a five-point Likert scale from 0 to 4 (0 for non-diagnostic, 1 for severe artefact with low confidence, 2 for moderate artefact or moderate diagnostic confidence, 3 for mild artefact or high confidence, and 4 for well seen without artefacts and high confidence of detecting a lesion > 5mm) as reported previously by Flicek et al [19]. To improve separation, 0.5 interval scores were allowed.
Figure 2.
2D image quality assessment. Five transverse images from a CTC in a 52 yr old female, BMI 18, with SD series effective dose of 1mSv, RD series effective dose 0.22 mSv. One of the sites of 2D image quality assessment was at the level of the portal venous bifurcation, as shown here on SD-FBP (A), RD-FBP (B), RD-PICCS (C), RD-MBIR (D), and RD-ASIR (E).
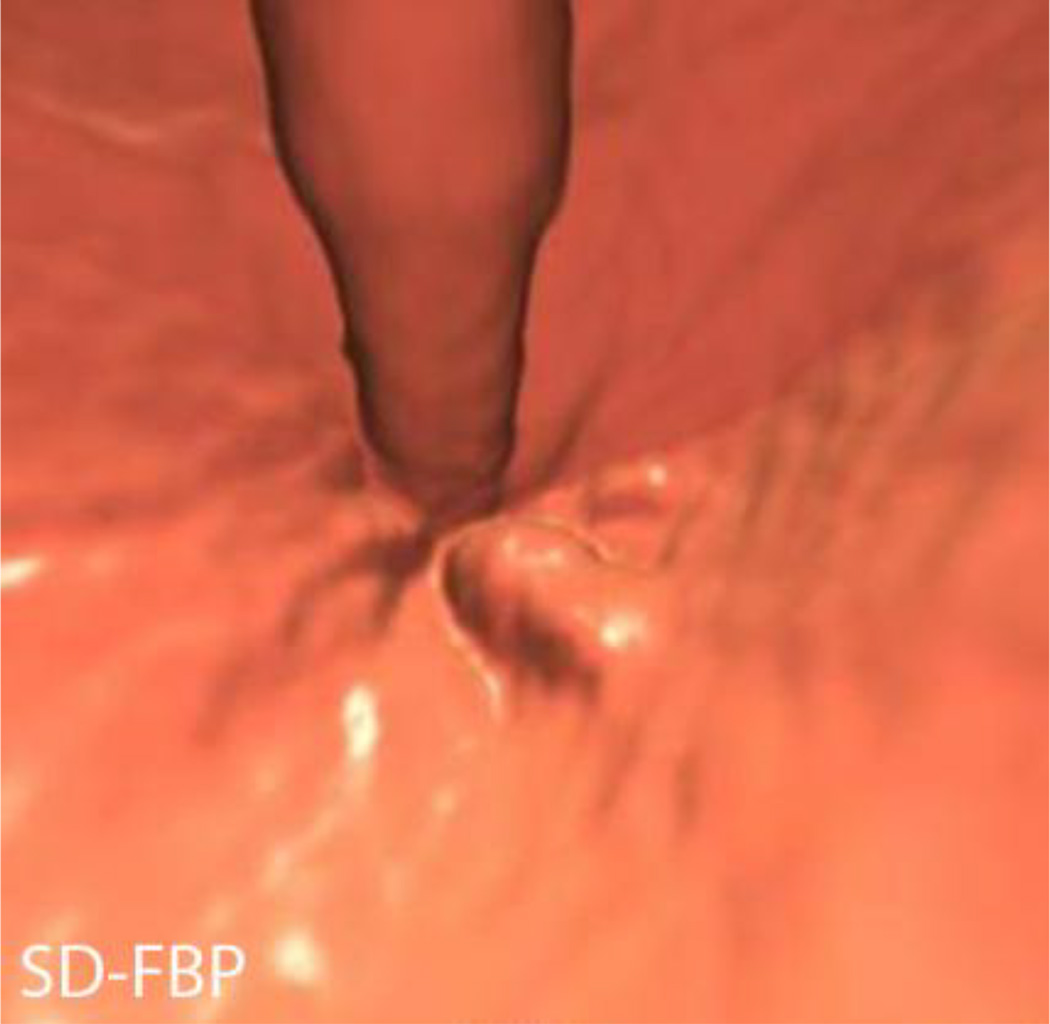
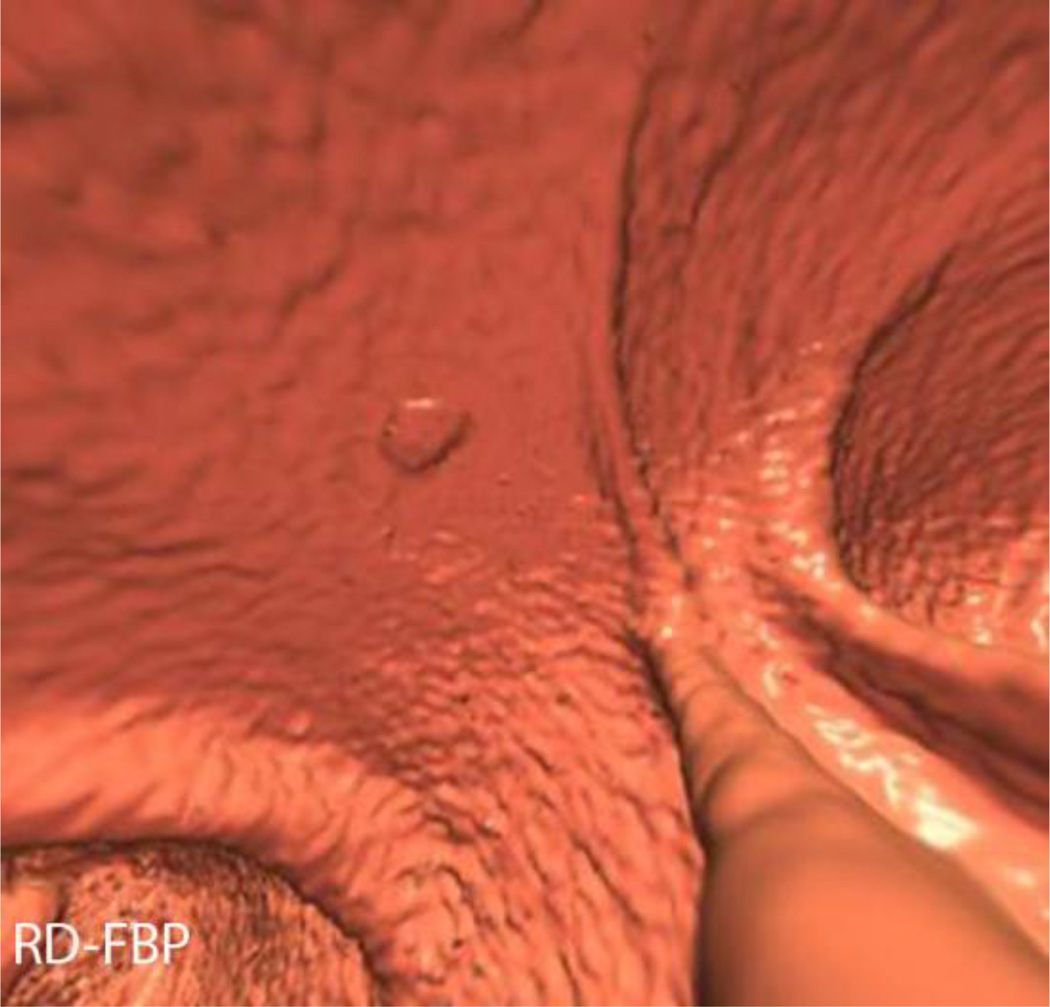
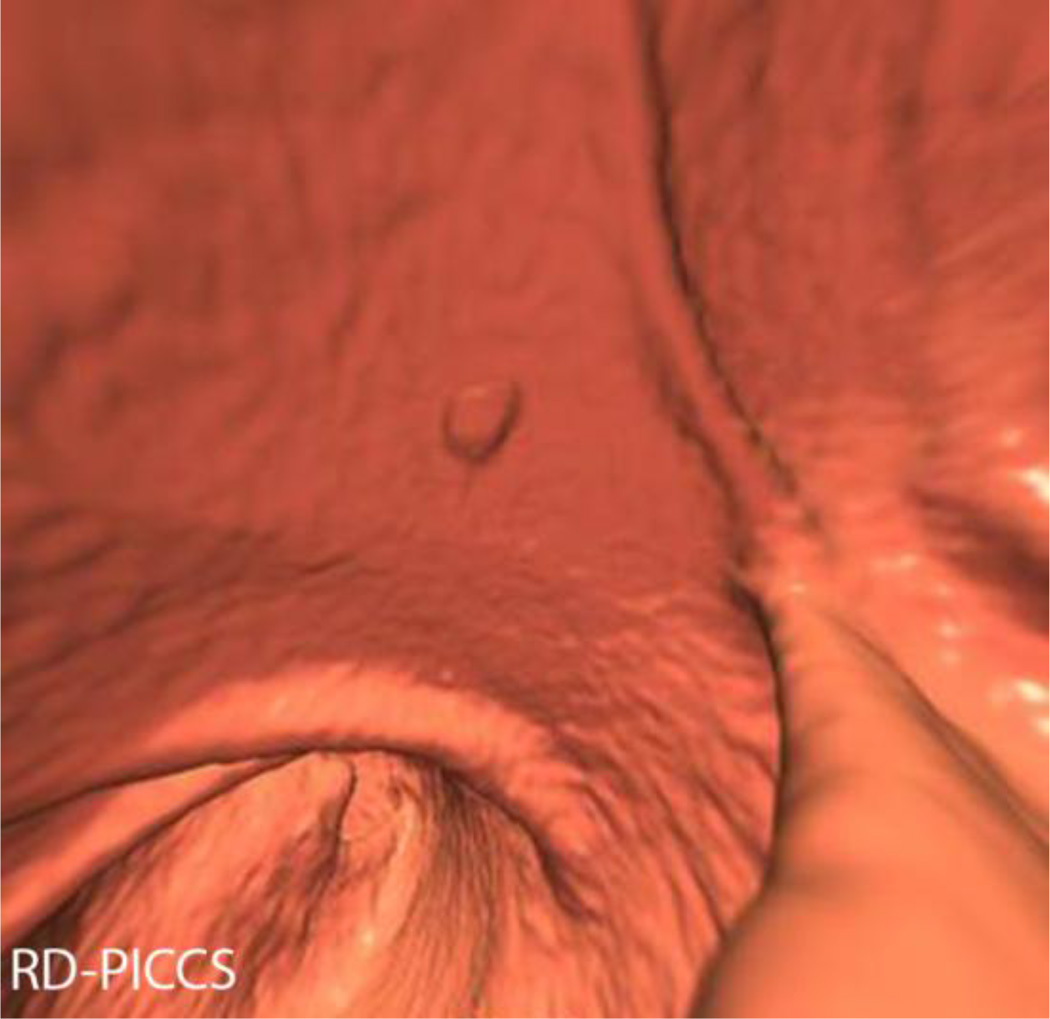
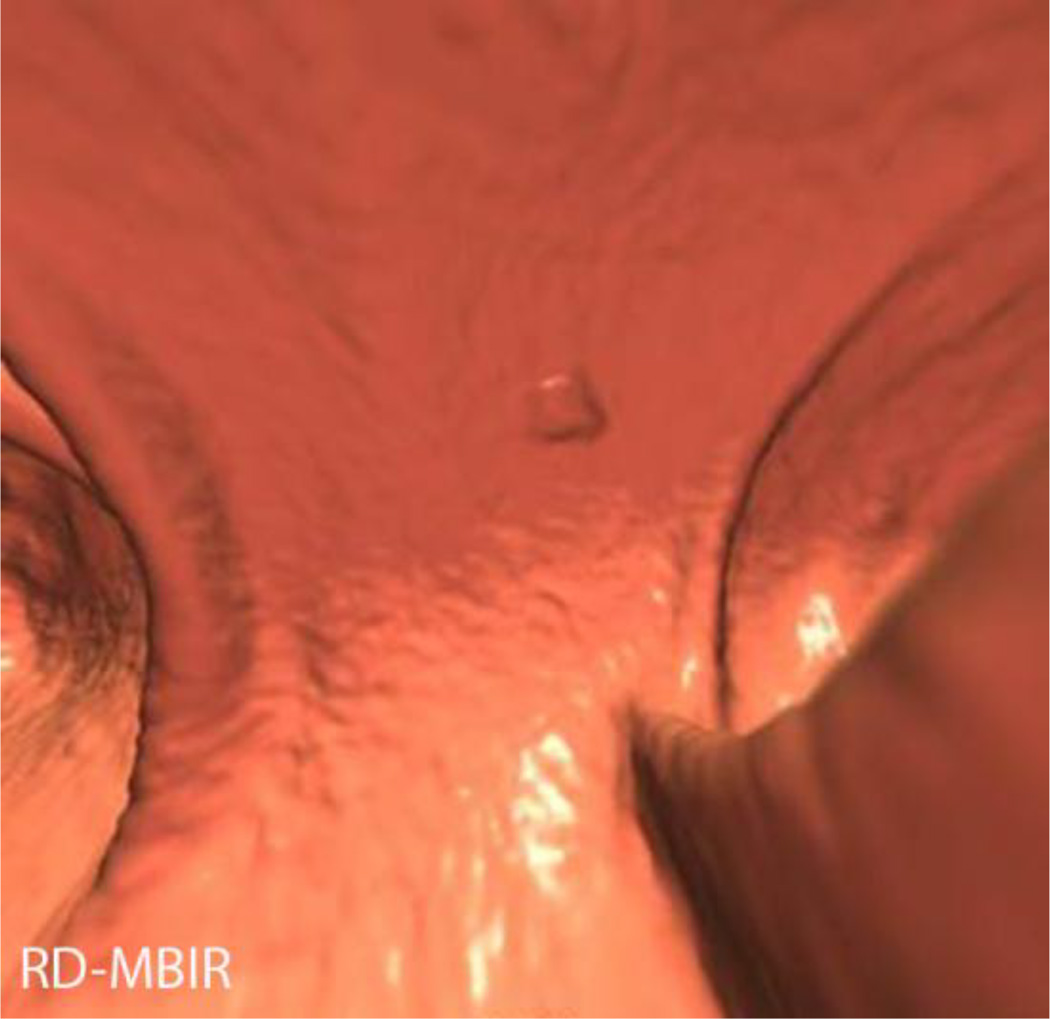
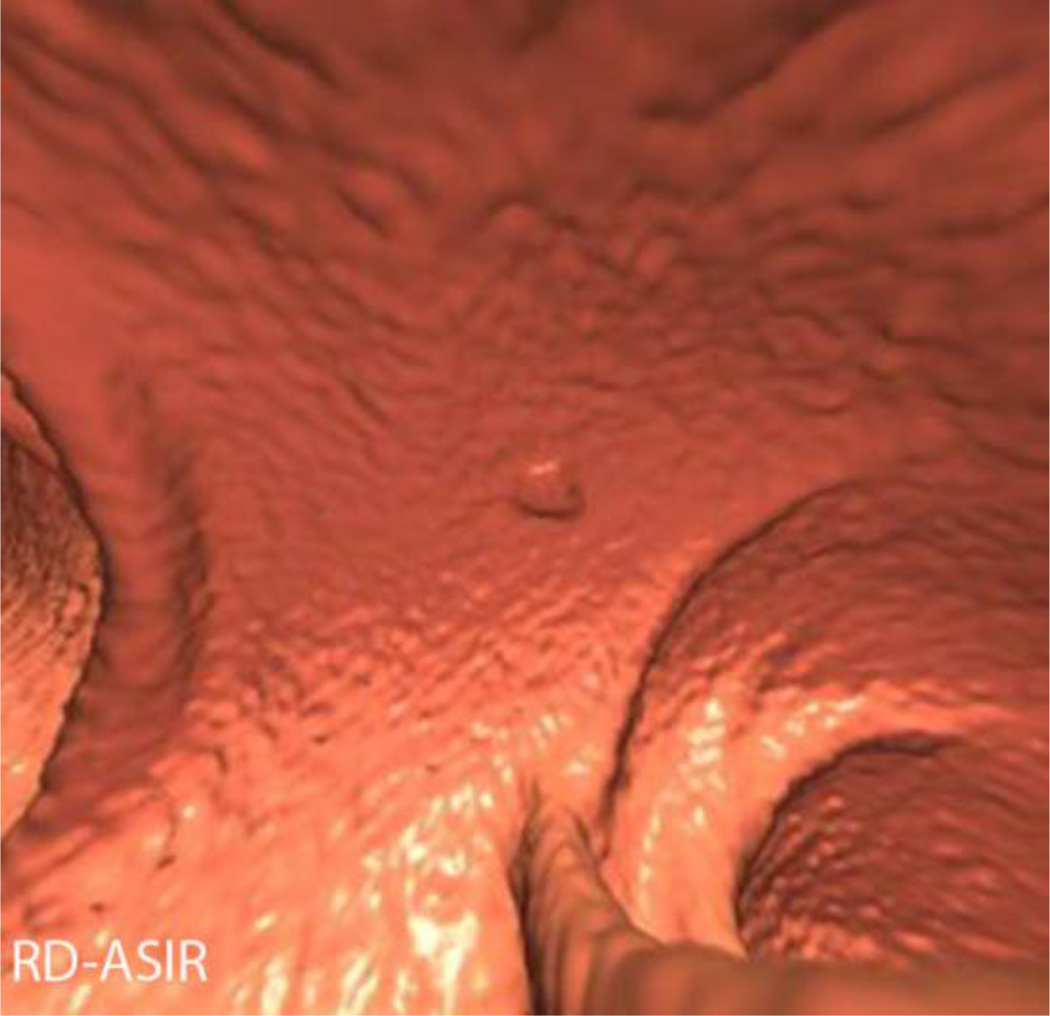
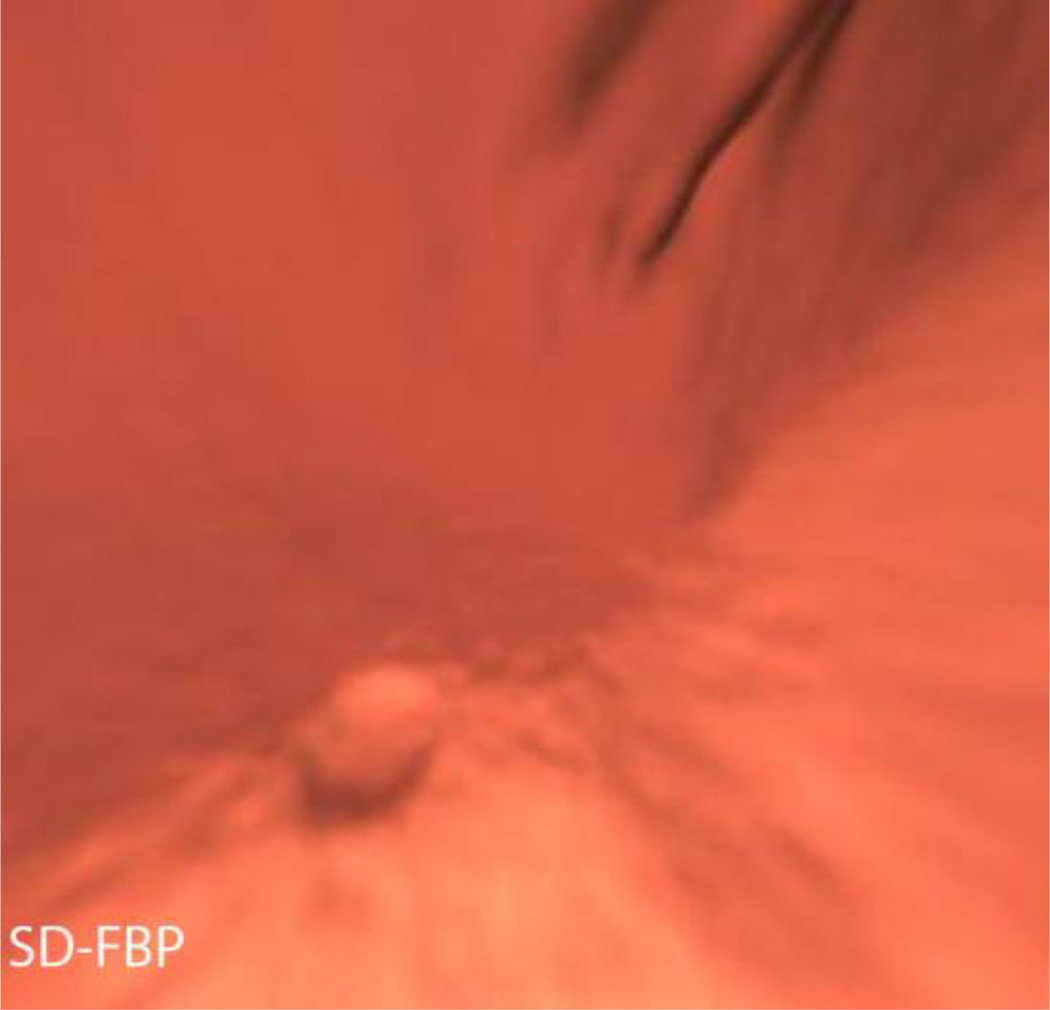
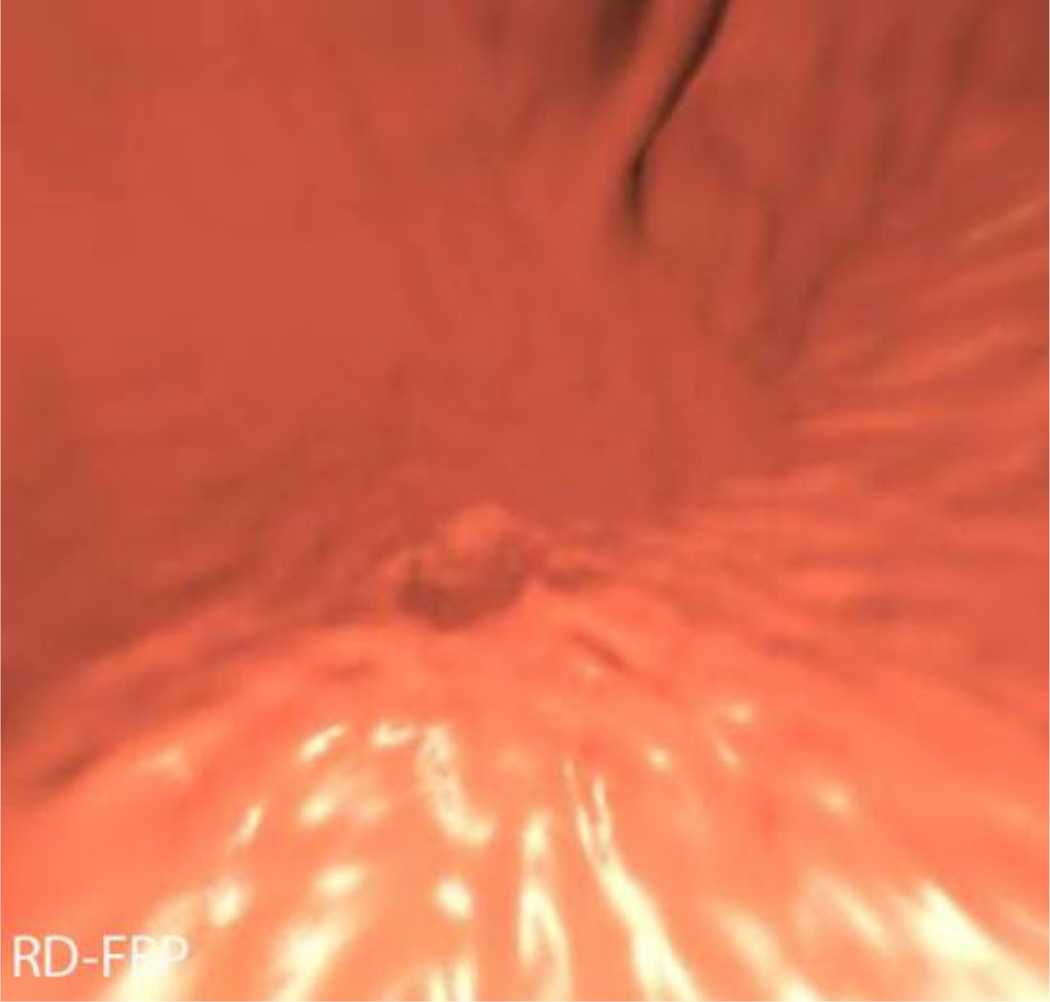
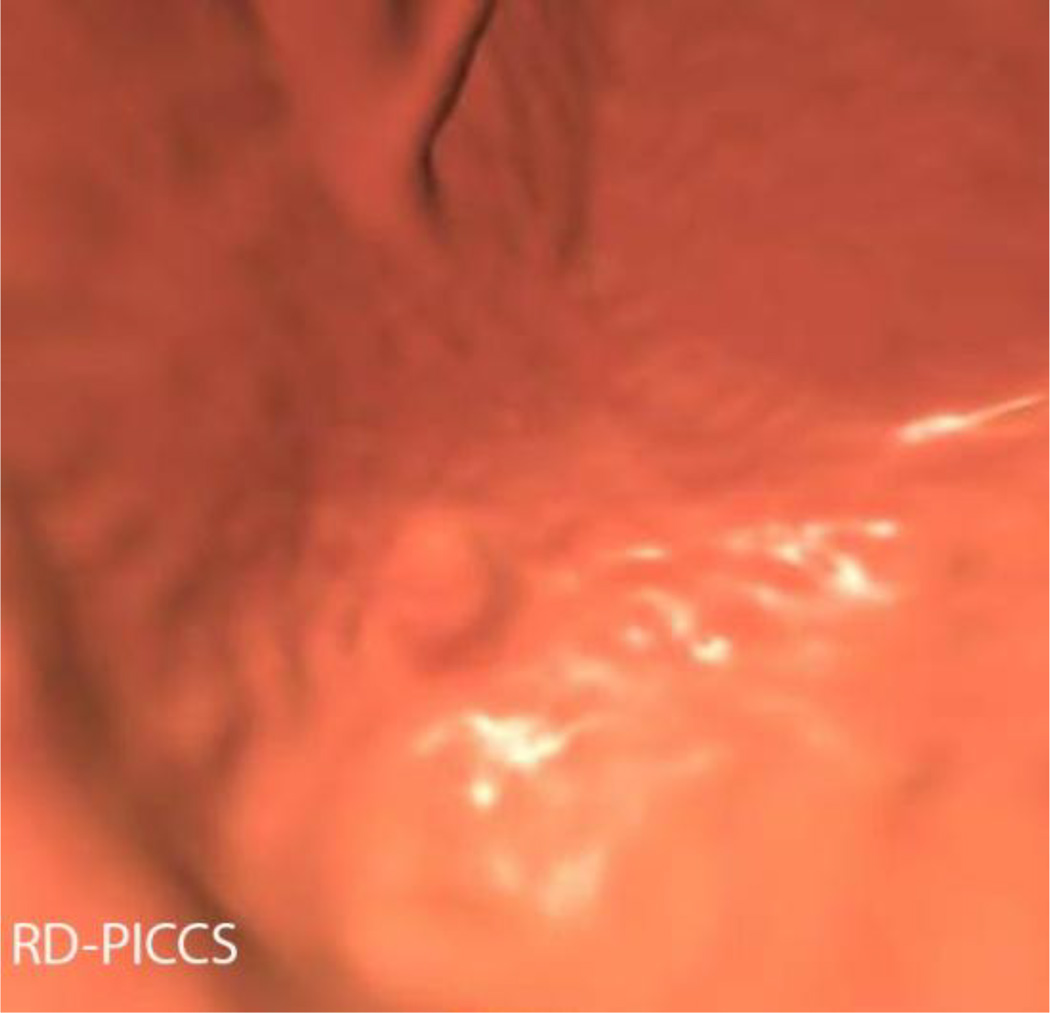
Given the small number of polyps in this cohort, a true assessment of diagnostic accuracy was not possible. However, a polyp conspicuity assessment was performed on the 3D images by all three readers for all series for the 7 polyps on this cohort using a 5-point polyp conspicuity scale (0 for not seen, 1 for poorly depicted or obscured, 2 for moderately well depicted or partially obscured, 3 for fairly well depicted or mildly obscured, and 4 for well-marginated/well-seen) (figure 4).
Figure 4.
Polyp conspicuity assessment. 3D images at the level of the rectal catheter demonstrate a 7 mm sessile hyperplastic polyp in a patient with a BMI of 22.9. SD series effective dose was 1.25 mSv, RD series effective dose was 0.32 mSv. Note the conspicuity of the polyp on SD-FBP (A), RD-PICCS (C), and RD-MBIR (D), compared to RD-FBP (B) and RD-ASIR (E).
Statistical Analysis
Continuous variables (age, noise, attenuation, image quality) were summarized with mean, standard deviation, quartiles, minimum, maximum; categorical variables (gender) were summarized with frequency counts and percentages. A one-sample Wilcoxon rank sum test was used to test the hypothesis that the RD/SD dose fraction is equal to one. Kruskal-Wallis tests were used to compare the distribution of continuous variables across groups. Linear mixed effects models were used to model noise and attenuation (SD and mean of HU over ROI, respectively) as a function of reconstruction and organ (fixed effects) with a random subject-dependent intercept [31]. Addition of interaction terms was assessed via a likelihood ratio F test; the models were fitted via Maximum Likelihood to make such a test valid. For image quality, linear models were considered as above, with the addition of reader as a fixed effect. Bland-Altman 95% limits of agreement were also obtained for every combination of reader and modality. The calculations took into account the multiple features being rated within each subject (2D PV, 2D SI, etc.) [32].
The criterion for statistical significance was P < 0.05 (two-sided). R 3.1.0 was used for all statistical analyses [33]. Exploratory and diagnostic plots were used to assess possible violations in model assumptions.
Results
The radiation dose metrics of the standard dose series are summarized in table 1. The mean effective dose for the standard dose series was 2.8 mSv, compared to 0.6 mSv for the reduced dose series, a mean dose reduction of 78%. 36/40 cases had a reduced dose series effective dose ≤1 mSv, and 38/40 ≤1.1 mSv. The two cases with dose greater than 1.1 mSv had BMIs of 36 and 38. The dose reduction was statistically significant (p<0.001).
Table 1.
Radiation Dose Metrics for Standard Dose compared to Reduced Dose Series
| Series | DLP (mGy*cm) | CTDIvol (mGy) |
Eff Dose (mSv) |
Eff diam | SSDE | ||||||||||
|---|---|---|---|---|---|---|---|---|---|---|---|---|---|---|---|
| Mean (SD) |
Median | Range | Mean (SD) |
Median | Range | Mean (SD) |
Median | Range | Mean (SD) |
Median | Range | Mean (SD) |
Median | Range | |
| Standard dose (SD) | 190.2 (±135.1) | 151.8 | 57–586 | 3.8 (±2.5) | 3.1 | 1.3–11.8 | 2.8 (±2.0) | 2.3 | 0.8–8.8 | 29.1 (±3.7) | 28.8 | 21.3-38-2 | 4.5 (±2.2) | 3.7 | 2.1–10.7 |
| Reduced dose (RD) | 40.1 (±31.5) | 29.3 | 15–177 | 0.9 (±0.7) | 0.6 | 0.4–3.9 | 0.6 (±0.5) | 0.4 | 0.2–2.6 | 1.0 (±0.6) | 0.9 | 0.6–3.5 | |||
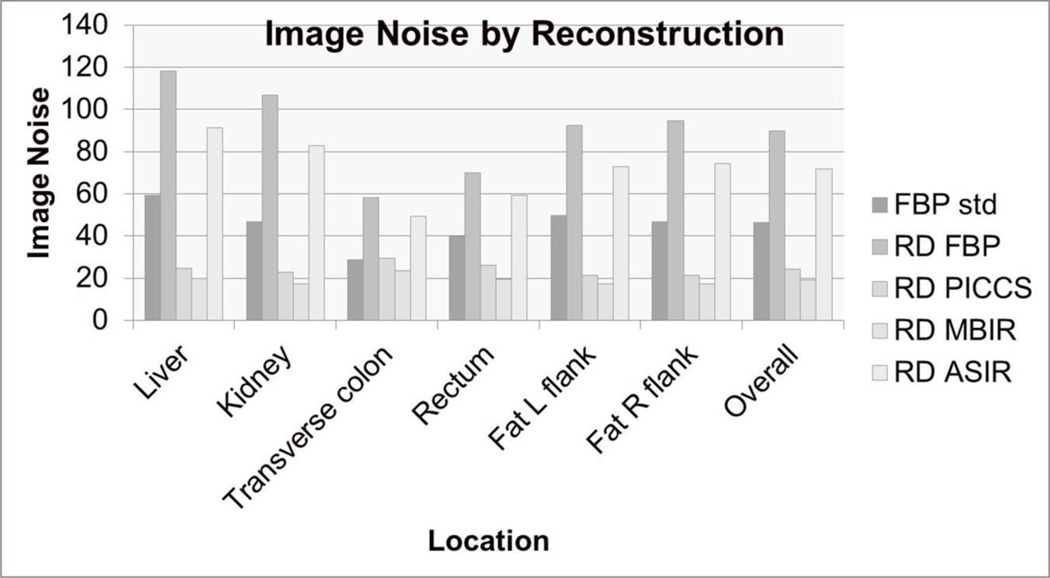
The RD-PICCS and RD-MBIR images had the lowest objective image noise at all 6 of the measured sites, including the standard dose series (Figure 5). The overall mean image noise was 46.5±14.3 for the SD images, 24.3±19 for RD-PICCS, 19.1±17.8 for RD-PICCS, 71.6±26.8 for RD-ASIR, 90.0±32.6 for RD-FBP. The RD series reconstructed with PICCS and MBIR showed statistically less noise than the other RD series (p<0.001), but also statistically less noise than the SD series (p<0.001).
Figure 5.
Image noise by reconstruction. Image noise was measured at two parenchymal sites, two colonic air column sites, and two fat attenuation sites and was averaged overall. Note that the RD-PICCS and RD-MBIR series had the lowest noise at every site, and overall. The noise was statistically lower on these series compared to the other low dose series (RD-FBP, RD-ASIR) but also compared to the standard dose series (FBP std).
The 2D and 3D image quality scores of the RD series were all significantly lower than the SD series (P<0.001 for all series except MBIR p=0.008 2D, p=0.01 3D) (table 2) (Figure 6). In addition, when comparing the reduced dose series, the RD-PICCS series had significantly higher 2D and 3D image quality scores than the RD-ASIR and RD-FBP (p<0.001), but slightly lower image quality scores than RD-MBIR (p=0.003 2D, p<0.001 3D) (Figure 7).
Table 2.
Mean Image quality scores (2D, 3D) by series
| Location | SD-FBP | RD-FBP | RD-ASIR | RD-PICCS | RD-MBIR |
|---|---|---|---|---|---|
| 2D Porta hepatis | 2.8±0.6 | 1.4±0.4 | 1.7±0.4 | 2.6±0.4 | 2.7±0.4 |
| 2D Pelvis, SI jt | 2.9±0.6 | 1.6±0.4 | 1.8±0.4 | 2.8±0.4 | 2.8±0.4 |
| 3D Rectal Cath | 3.2±0.5 | 2.0±0.5 | 2.2±0.5 | 2.9±0.5 | 3.1±0.6 |
| 3D ICV | 3.5±0.4 | 2.4±0.5 | 2.6±0.4 | 3.2±0.5 | 3.3±0.5 |
| Overall 2D | 2.9±0.6 | 1.5±0.4 | 1.8±0.4 | 2.7±0.4 | 2.8±0.4 |
| Overall 3D | 3.3±0.5 | 2.2±0.6 | 2.4±0.5 | 3.0±0.5 | 3.2±0.6 |
Figure 6.
2D image quality assessment at the sacroiliac joint. The SD-FBP images (A) had the highest image quality scores, closely followed by RD-MBIR (D) and PICCS (C). Both MBIR and PICCS reconstructed images had significantly higher image quality scores than RD-FBP (B) and RD-ASIR (E).
Figure 7.
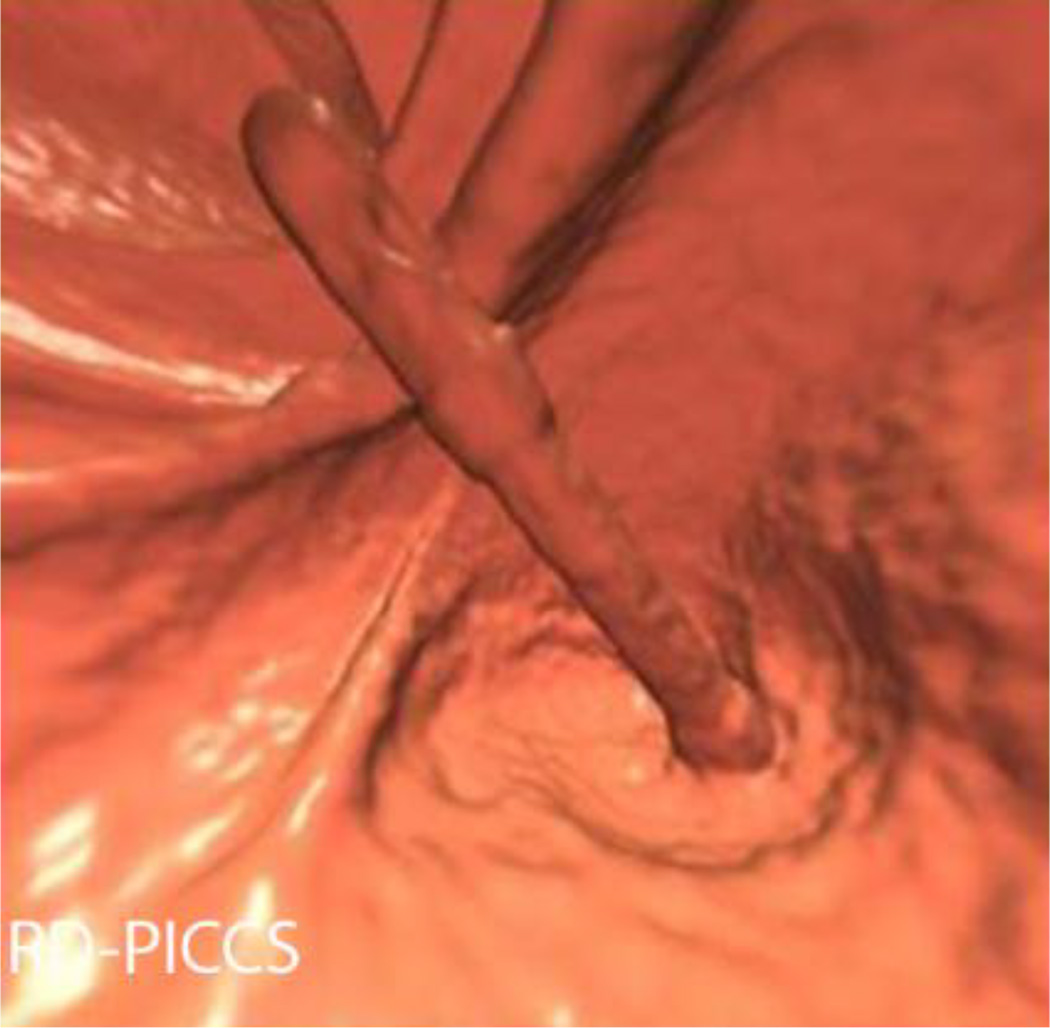
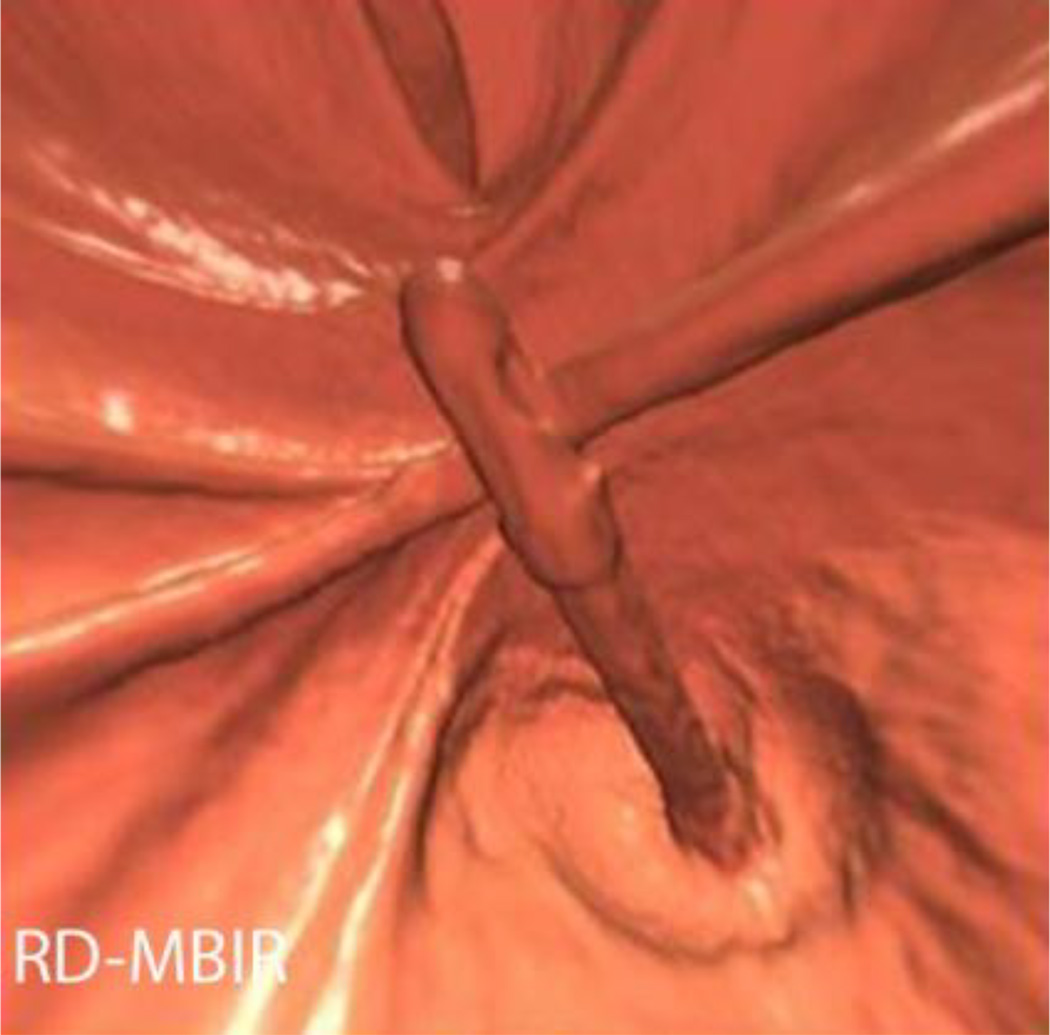
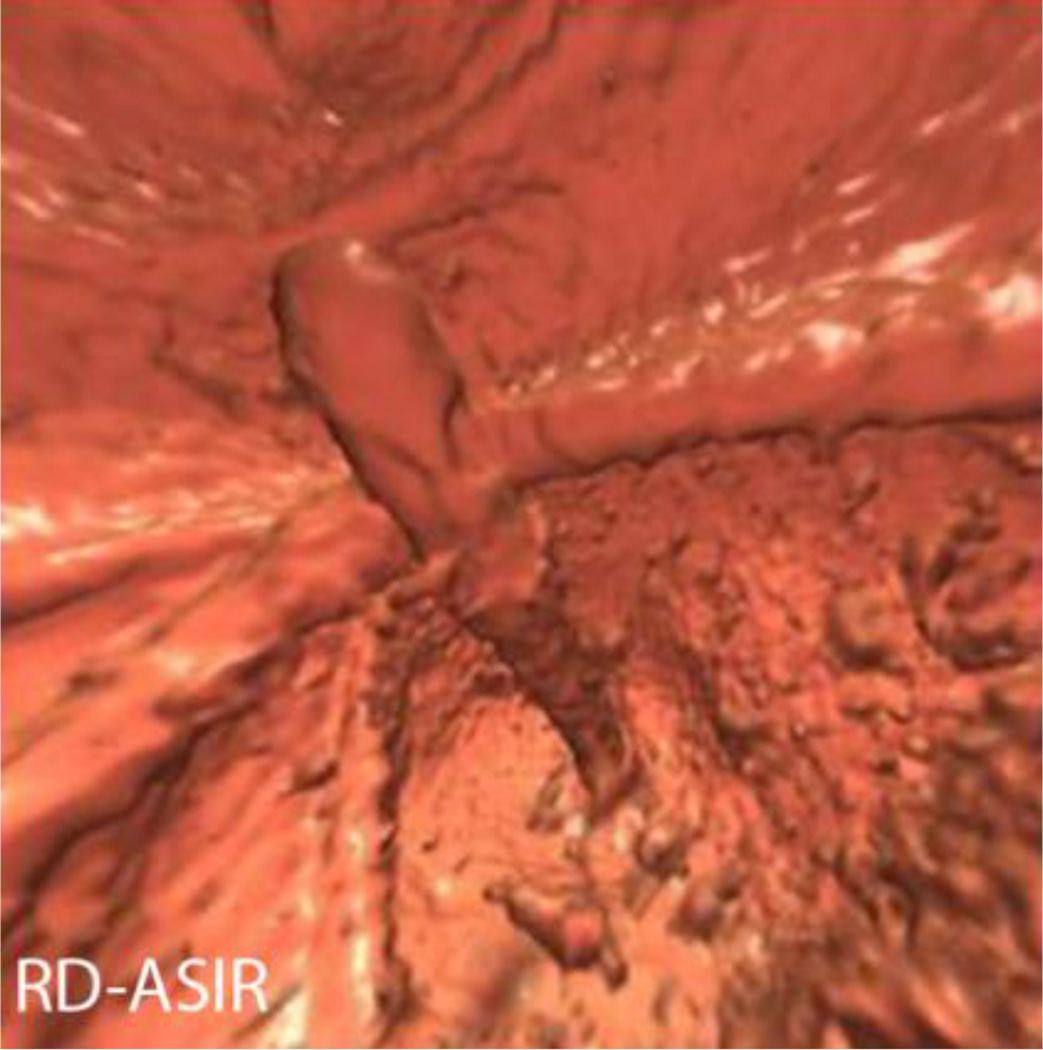
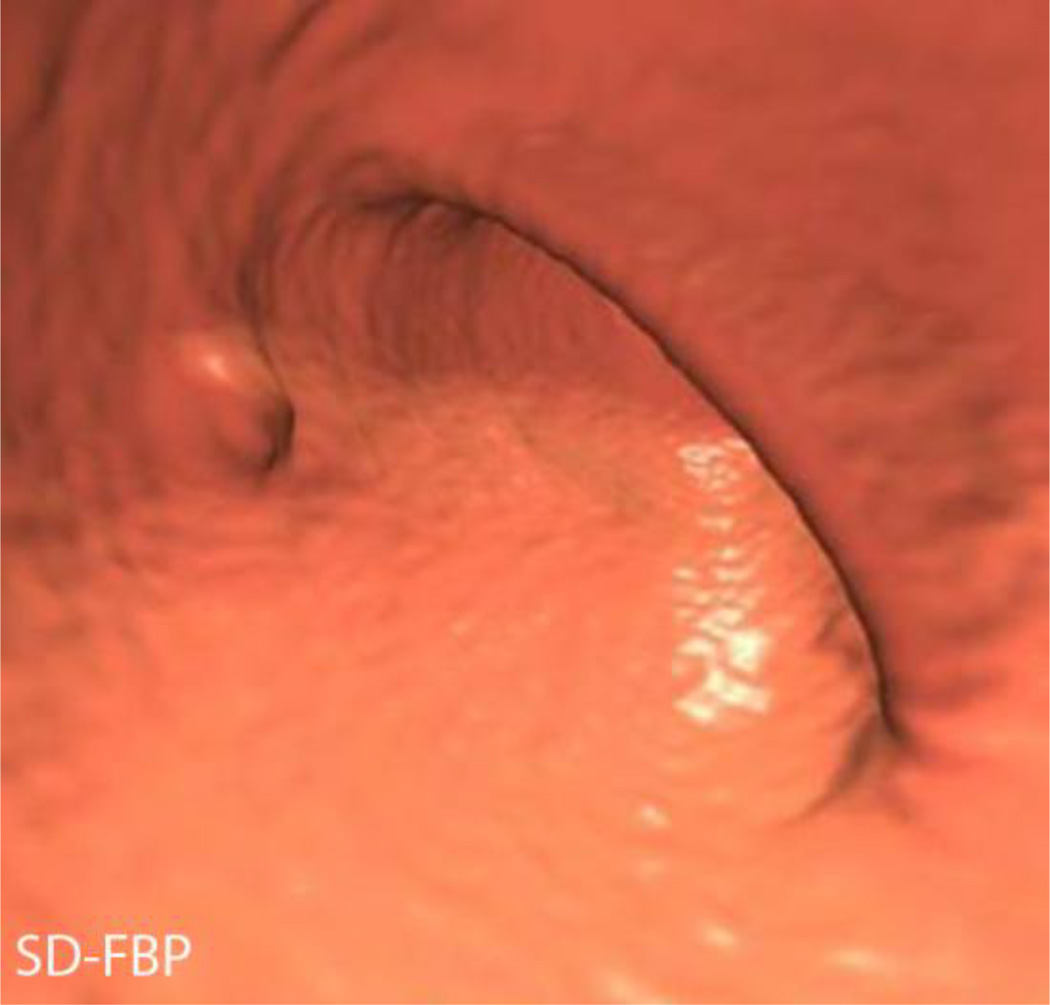
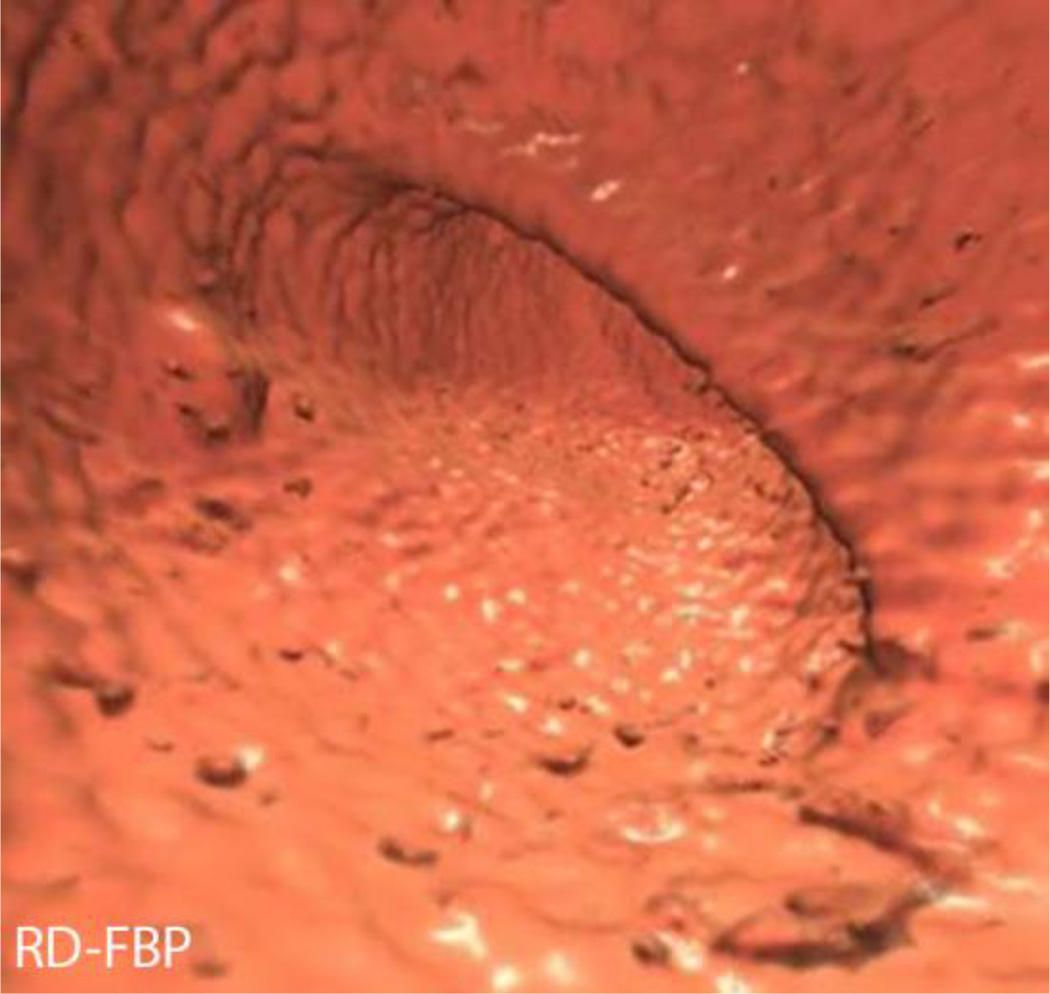
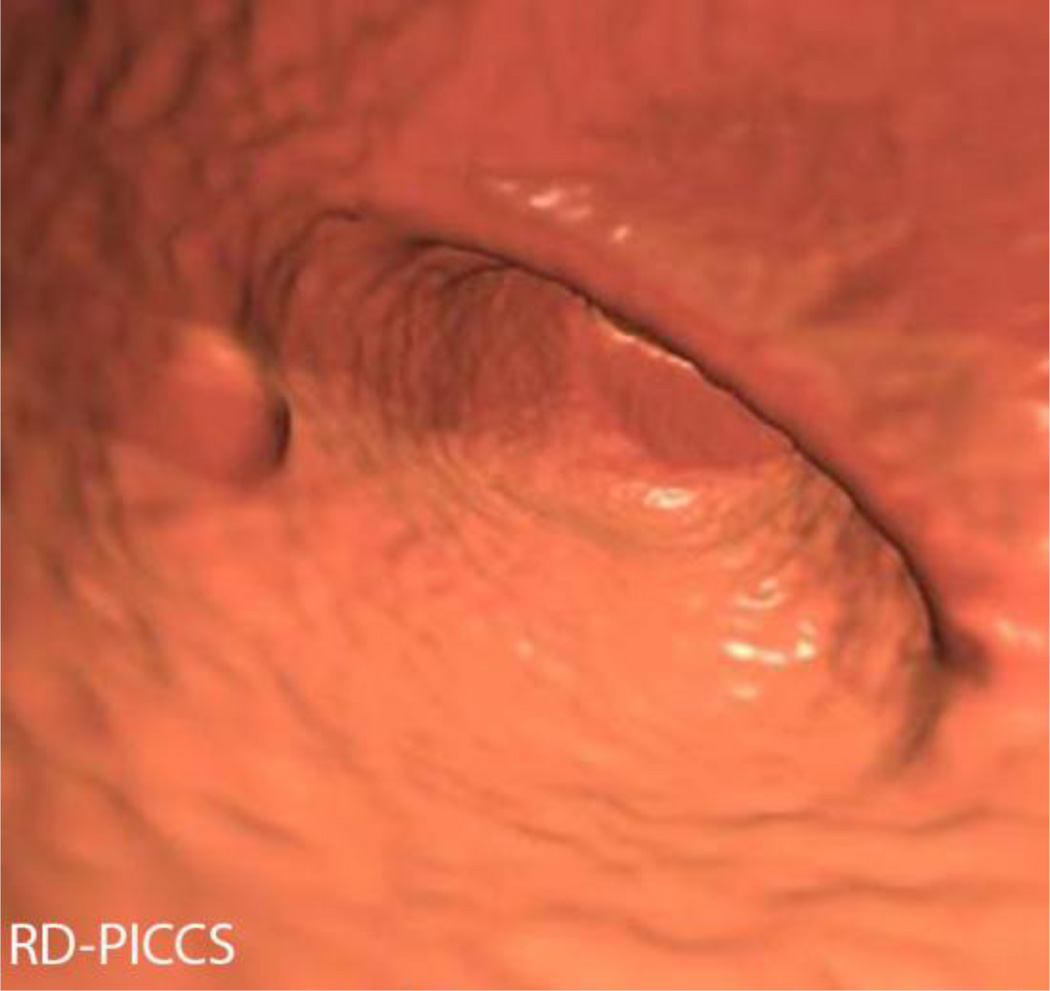
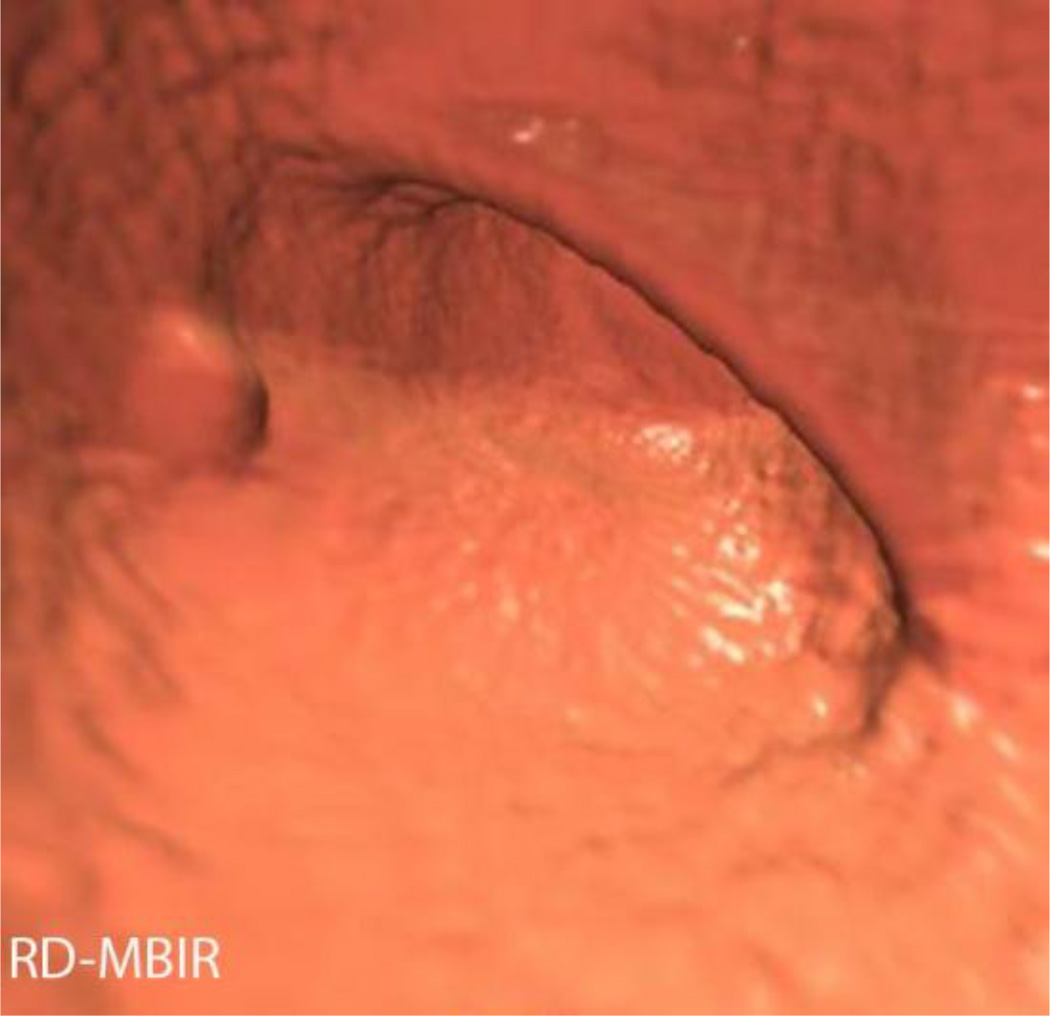
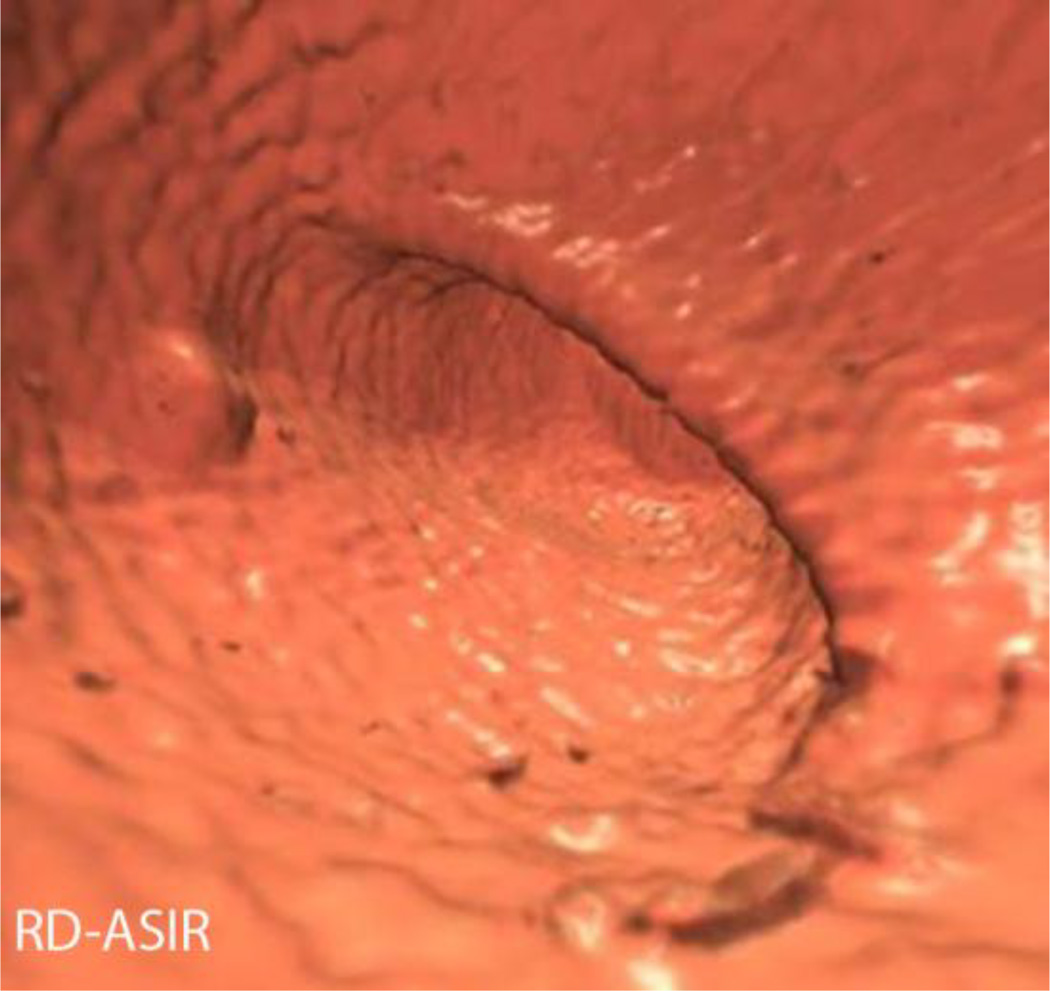
3D image quality assessment at the ileocecal valve. 3D images from CTC in a 53 year old male with BMI of 31.3, effective dose (SD) of 2.33 mSv, effective dose (RD) 0.48 mSv. Like with the 2D image quality scoring, the standard dose images (A) received the highest image quality scores, followed by RD-MBIR (D), RD-PICCS (C), which were scored significantly higher than the RD-ASIR (E) and RD-FBP (B). This same patient also had a 7 mm sigmoid tubular adenoma, shown here on SD-FBP (F), RD-FBP (G), RD-PICCS (H), RD-MBIR (I) and RD-ASIR (J). The SD-FBP (F), RD-PICCS (H) and RD-MBIR (I) received similar polyp conspicuity scores, higher than RD-FBP (G) and RD-ASIR (J).
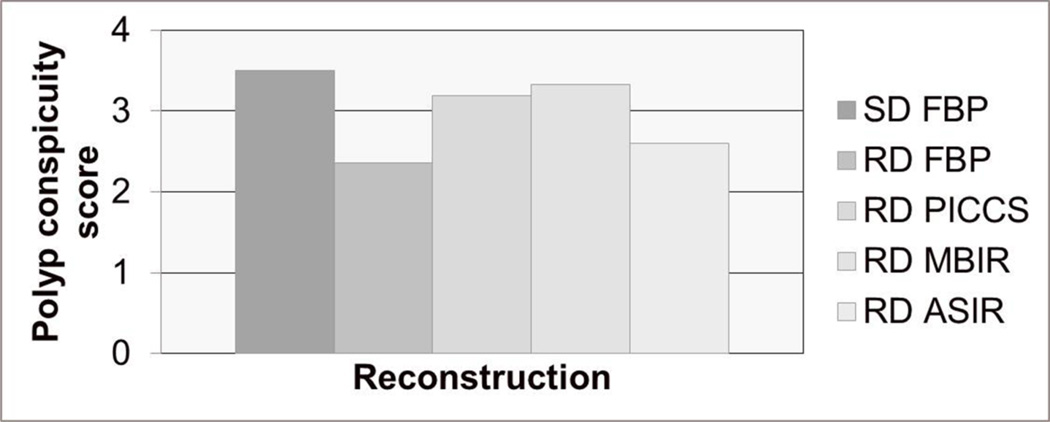
There was no statistically significant difference in polyp conspicuity scores between SD-FBP and RD-PICCS and RD-MBIR (SD-FBP 3.5±0.6, RD-PICCS 3.2±0.8, RD-MBIR 3.3±0.6, p=0.1, 0.4). Polyp conspicuity scores for the other low dose series were statistically significantly lower (RD-ASIR 2.6±0.7, RD-FBP 2.4±0.9, p<0.001) (Figures 8–10).
Figure 8.
Polyp conspicuity score by dose and reconstruction. Graph demonstrating the polyp conspicuity scores were very similar on standard dose images (SD-FBP), reduced dose images reconstructed with PICCS (RD-PICCS) and reduced dose images reconstructed with MBIR (RD-MBIR). These scores were significantly better that those seen on the reduced dose series reconstructed with FBP (RD-FBP) and ASIR (RD-ASIR).
Figure 10.
Polyp conspicuity. 3D images from a 66 year old male with BMI of 36 with a 7 mm sessile polyp in the ascending colon. This was one of the largest patients in our series, and even a small polyp remains conspicuous on SD-FBP (A), RD-FBP (B), RD-PICCS (C), RD-MBIR (D), RD-ASIR (E). The effective dose of the low dose series was 2.6 mSv, compared to 8.8 mSv for the standard dose.
Discussion
CT Colonography has been shown to be an excellent, non-invasive method of colon cancer screening in a time where there is an urgent and increasing need to improve screening rates of this common but preventable and treatable cancer. However, there have been some concerns about the ionizing radiation associated with the exam when applied to a large screening population. Survey data from over 50 institutions performing CT colonography demonstrates the median effective dose for daily practice protocols was 7.6 mSv and screening protocols 4.4 mSv [7]. Berrington de Gonzalez et al performed a risk benefit analysis for CTC using an effective dose between 7–8 mSv and found that up to 5190 colon cancers per 100,000 individuals screened could be prevented every 5 years, compared to the possibility of 150 radiation induced cancers per 100,000 individuals screened, yielding a risk benefit ration of up to 35:1 [8]. Although this is already very favourable for CTC, the more we can reasonably reduce the dose without sacrificing its diagnostic ability, the better. Given that CTC is a fairly high contrast task, detecting soft-tissue or contrast coated polyps largely against a background of colonic air, moderate to large dose reduction should be an achievable goal, particularly with technological advances like iterative reconstruction algorithms.
Fisichella et al found that dose reduction to the 1 mSv level at CTC led to significantly higher cobblestone artefacts and poorly delineated folds, but that perception of polyps ≥6 mm was not impaired [14]. Flicek et al found that the addition of ASIR reconstruction preserved image quality at dose reductions up to 50% [19]. However, both this group and Ginsburg et al found that increasing BMI impairs low dose CTC images, and Ginsburg et al proposed BMI-based dose tailoring[11]. Gryspeedt et al used a structure preserving diffusion de-noising method in 31 patients scanned with a sub-mSv technique and found this reduced noise and improved signal to noise ratios compared to sub-mSv images reconstructed without this technique [17]. Lambert et al also pushed the dose into the sub-mSv range in 16 patients using a hybrid iterative reconstruction technique and found that all segments were rated as evaluable on the low dose series reconstructed with iterative reconstruction [18]. However, no polyp assessment was performed in this study. Yoon et al looked at polyp detection in a porcine phantom using low dose images reconstructed with ASIR and MBIR (Veo, GE Healthcare) and found improved diagnostic performance in these images compared with images reconstructed with FBP at the same dose[20]. However, this study did not include any human subjects. Our prospective results are concordant with these findings and are a natural extension of these works, also suggesting that sub-mSv CT colonography may be feasible.
Using iterative reconstruction techniques including MBIR or PICCS, image noise was reduced below the level of the standard dose images, which prevents cobblestoning and distortion on 3D CTC images. In addition, although image quality was slightly lower on the reduced dose 2D images (and 3D images to a lesser extent) compared to the standard dose images, polyp conspicuity was preserved at the same level as the standard dose images on those reduced dose series reconstructed with PICCS and MBIR.
Part of the reason for this may be that the smoothing that occurs with the iterative reconstruction may be somewhat unappealing on 2D images to radiologists who are not used to it, and may reduce 2D image quality scores. However, on 3D images, this smoothing reduces artefacts seen at low doses and emphasizes polyps against this smoother background, making these reconstruction algorithms ideal for this type of application. At many institutions, a primary read using 3D images is performed, with 2D problem solving [34], making the image quality and polyp conspicuity on the 3D series particularly critical.
There are some limitations to this study. There were a small number of polyps in this prospective cohort. Therefore, although polyp conspicuity was assessed, true polyp detection and characterization (diagnostic accuracy) could not be performed. Although image quality and objective image noise assessments are important metrics in assessing dose reduction, these may not necessarily correlate with diagnostic accuracy and therefore independent assessment of diagnostic accuracy is also critical. Further assessment of these polyp identification and characterization tasks needs to be performed in a cohort with a larger number of polyps. Extracolonic findings were not assessed in this study, but focal lesion detection has been evaluated in a larger population which includes a portion of this cohort as part of this ongoing prospective trial [35]. Although the average effective dose was <1 mSv here, not every single patient in the cohort (4/38) was imaged with a sub-mSv dose. The two patients with doses > 1.1 mSv had BMIs of 36 and 38 respectively, and this is an ongoing challenge in reducing dose. However, this still compares very favourably to the current practice of many institutions, where median doses for screening are 4.4 mSv [7]. Only one of the two series (supine) was performed at reduced dose. A prone or right lateral decubitus reduced dose series was not also performed, although the supine results should be relatively generalizable to series obtained in other positions (prone, right lateral decubitus). It was difficult to totally blind readers to the reduced dose series, particularly with 2D images, as the reduced dose images were noisier than the standard dose in many cases. Our analysis of image quality and polyp conspicuity treated these ordinal ratings as continuous. The validity of assigning integer scores to the ratings relies on having the categories be equidistant. Although it is possible that this might not be the case, we opted for this analysis because the statistical methods for the analysis of ordinal responses are computationally unwieldy and hard to interpret.
In conclusion, our study showed that iterative reconstruction methods including PICCS and MBIR can reduce image noise and improve image quality compared to reduced dose images reconstructed with FBP alone or ASIR. PICCS and MBIR even reduce image noise below the level of the standard dose series. However, even with these reconstruction techniques, there is still a decrease in 2D and 3D image quality for reduced dose compared to standard dose images. While this study is not powered to thoroughly assess for differences in polyp conspicuity, the limited data here suggests that polyp conspicuity on RD-PICCS and RD-MBIR is closer to that of standard dose than RD-ASIR and RD-FBP. These findings suggest that sub-mSv CTC may be feasible; however, further studies with polyp detection and characterization at these doses are warranted.
Figure 3.
3D image quality assessment. Five 3D images from a single patient in a 56 year old male with a BMI of 24 and SD effective dose of 1.5 mSv and RD effective dose of 0.3mSv. One of the sites of 3D image quality assessment was the rectal catheter, as shown here on SD-FBP (A), RD-FBP (B), RD-PICCS (C), RD-MBIR (D), RD-ASIR (E).
Figure 9.
Sessile 7 mm sigmoid polyp in a 42 year old male with BMI 24.2, effective dose (SD) 2.7 mSv, effective dose (RD) 0.35 mSv (87% reduction). This is demonstrated on 3D images, SD-FBP (A), RD-FBP (B), RD-PICCS (C), RD-MBIR (D), RD-ASIR (E). The endoscopic correlate is seen in (F), and pathology demonstrated tubular adenoma.
Key points.
CT colonography dose can be substantially lowered using advanced iterative reconstruction techniques.
Iterative reconstruction techniques (MBIR/PICCS) reduce image noise and improve image quality.
PICCS/MBIR-reconstructed reduced dose series show decreased 2D/3D image quality compared to standard-dose.
Polyp-conspicuity was similar on standard-dose images compared to reduced-dose reconstructed with MBIR/PICCS.
Acknowledgements
This work was partially supported by SAR Howard S. Stern Research award and NIH grant funding R01CA169331.
The scientific guarantor of this publication is the first author, Dr. Meghan G. Lubner. The authors of this manuscript declare financial relationships as detailed below:
M. Lubner: Grant funding GE Medical (GE-AUR Radiology Research Academic Fellowship, GERRAF)
B. Dustin Pooler, Doug Kitchin, Ke Li: None
Jie Tang: Now an employee of GE Medical
David H. Kim: Consultant, Viatronix, Inc; Co-founder VirtuoCTC, LLC; Medical Advisory Board, Digital Artforms, Inc
Guanghong Chen: Research funding from GE, Siemens AG, Hologic
Perry J. Pickhardt: Consultant, Check-Cap Ltd; Consultant, Viatronix, Consultant Mindways, Consultant Braintree, Co-founder VirtuoCTC, LLC
This work was partially supported by the Society of Abdominal Radiology Howard S. Stern Research award and NIH grant funding R01CA169331.
One of the authors, Dr. Alejandro Munoz del Rio, has significant statistical expertise.
Institutional review board approval was obtained, and written informed consent was obtained from all subjects in this study.
This is an ongoing prospective trial, so a portion of this cohort was previously reported in a manuscript describing preliminary results of the entire cohort, published in AJR and a manuscript accepted for publication in Abdominal Imaging:
Lubner MG, Pickhardt PJ, Kim DH, Tang J, Del Rio AM, Chen GH. Prospective Evaluation of prior image constrained compressed sensing (PICCS) algorithm in abdominal CT: a comparison of reduced dose with standard dose imaging. Abdom Imaging 2014 Jun 19, epub ahead of print.
Pooler BD, Lubner MG, Kim DH, Ryckman EM, Sivalingam S, Tang J, Nakada SY, Chen GH, Pickhardt PJ. Prospective Trial for the Detection of Urolithiasis at Ultra-low-dose (Sub-mSV) Non-contrast CT: Direct Comparison against Routine Low-dose Reference Standard. J Urol 2014 May 21, epub ahead of print.
Pickhardt PJ, Lubner MG, Kim DH, Tang J, Ruma JA, del Rio AM, Chen GH. Abdominal CT with model-based interative Reconstruction (MBIR): initial results of a prospective trial comparing ultralow-dose with standard-dose imaging. AJR 2012; 199 (3): 1266-74.
This is a prospective case-control or case-matched study performed at one institution.
Appendix 1
Abdominal CTC “standard-dose” protocol utilized in the prospective trial*
| Protocol: | Supine CTC |
|---|---|
| Scanner | GE HD 750 |
| Scan Type | Helical |
| Rotation Time (sec) | 0.5 |
| Beam Collimation (mm) | 40 |
| Detector Rows | 64 |
| Pitch | 0.984 |
| Speed (mm/rot) | 39.36 |
| Detector Configuration | 64 × 0.625 |
| Slice Thickness for NI (mm) | 1.25 |
| Scan FOV | Large Body |
| kV | 120 |
| Smart mA Range | 30–300 |
| Noise Index | 50 |
| Reconstructions (FBP): | |
| DFOV (cm) | 36–50 |
| Recon Type | Standard |
| Window W/L | 400/50 |
| Helical Recon Option | Plus |
| Slice Thickness (mm) | 2.5 |
| Interval (mm) | 1.5 |
The specific protocol for the accompanying low-dose series was derived by adjusting the noise index (NI)/slice thickness pairing (and mA range) to allow for a targeted 70–90% dose reduction (by DLP) relative to the “standard-dose” series.
Footnotes
This work was presented at the Society of Abdominal Radiology (SAR), 2014.
References
- 1.Siegel R, Naishadham D, Jemal A. Cancer statistics, 2012. CA Cancer J Clin. 2012;62:10–29. doi: 10.3322/caac.20138. [DOI] [PubMed] [Google Scholar]
- 2.Society AC. Colorectal cancer facts and figures 2011–2013. 2011 [Google Scholar]
- 3.Pickhardt PJ, Choi JR, Hwang I, et al. Computed tomographic virtual colonoscopy to screen for colorectal neoplasia in asymptomatic adults. N Engl J Med. 2003;349:2191–2200. doi: 10.1056/NEJMoa031618. [DOI] [PubMed] [Google Scholar]
- 4.Johnson CD, Chen MH, Toledano AY, et al. Accuracy of CT colonography for detection of large adenomas and cancers. N Engl J Med. 2008;359:1207–1217. doi: 10.1056/NEJMoa0800996. [DOI] [PMC free article] [PubMed] [Google Scholar]
- 5.Graser A, Stieber P, Nagel D, et al. Comparison of CT colonography, colonoscopy, sigmoidoscopy and faecal occult blood tests for the detection of advanced adenoma in an average risk population. Gut. 2009;58:241–248. doi: 10.1136/gut.2008.156448. [DOI] [PubMed] [Google Scholar]
- 6.Brenner DJ, Hall EJ. Computed tomography--an increasing source of radiation exposure. N Engl J Med. 2007;357:2277–2284. doi: 10.1056/NEJMra072149. [DOI] [PubMed] [Google Scholar]
- 7.Boellaard TN, Venema HW, Streekstra GJ, Stoker J. Effective radiation dose in CT colonography: is there a downward trend? Acad Radiol. 2012;19:1127–1133. doi: 10.1016/j.acra.2012.04.013. [DOI] [PubMed] [Google Scholar]
- 8.Berrington de Gonzalez A, Kim KP, Knudsen AB, et al. Radiation-related cancer risks from CT colonography screening: a risk-benefit analysis. AJR Am J Roentgenol. 2011;196:816–823. doi: 10.2214/AJR.10.4907. [DOI] [PMC free article] [PubMed] [Google Scholar]
- 9.Brenner DJ, Georgsson MA. Mass screening with CT colonography: should the radiation exposure be of concern? Gastroenterology. 2005;129:328–337. doi: 10.1053/j.gastro.2005.05.021. [DOI] [PubMed] [Google Scholar]
- 10.Chang KJ, Yee J. Dose reduction methods for CT colonography. Abdom Imaging. 2013;38:224–232. doi: 10.1007/s00261-012-9968-1. [DOI] [PubMed] [Google Scholar]
- 11.Ginsburg M, Obara P, Wise L, Wroblewski K, Vannier MW, Dachman AH. BMI-based radiation dose reduction in CT colonography. Acad Radiol. 2013;20:486–492. doi: 10.1016/j.acra.2012.12.011. [DOI] [PubMed] [Google Scholar]
- 12.Graser A, Wintersperger BJ, Suess C, Reiser MF, Becker CR. Dose reduction and image quality in MDCT colonography using tube current modulation. AJR Am J Roentgenol. 2006;187:695–701. doi: 10.2214/AJR.05.0662. [DOI] [PubMed] [Google Scholar]
- 13.Iannaccone R, Laghi A, Catalano C, Mangiapane F, Piacentini F, Passariello R. Feasibility of ultra-low-dose multislice CT colonography for the detection of colorectal lesions: preliminary experience. Eur Radiol. 2003;13:1297–1302. doi: 10.1007/s00330-002-1704-8. [DOI] [PubMed] [Google Scholar]
- 14.Fisichella VA, Bath M, Allansdotter Johnsson A, et al. Evaluation of image quality and lesion perception by human readers on 3D CT colonography: comparison of standard and low radiation dose. Eur Radiol. 2010;20:630–639. doi: 10.1007/s00330-009-1601-5. [DOI] [PubMed] [Google Scholar]
- 15.van Gelder RE, Venema HW, Florie J, et al. CT colonography: feasibility of substantial dose reduction--comparison of medium to very low doses in identical patients. Radiology. 2004;232:611–620. doi: 10.1148/radiol.2322031069. [DOI] [PubMed] [Google Scholar]
- 16.Chang KJ, Caovan DB, Grand DJ, Huda W, Mayo-Smith WW. Reducing radiation dose at CT colonography: decreasing tube voltage to 100 kVp. Radiology. 2013;266:791–800. doi: 10.1148/radiol.12120134. [DOI] [PubMed] [Google Scholar]
- 17.Gryspeerdt SS, Salazar P, Lefere P. Image Quality Improvement in Submillisievert Computed Tomographic Colonography Using a Fast 3-dimensional Noise Reduction Method. J Comput Assist Tomogr. 2014 doi: 10.1097/RCT.0000000000000092. [DOI] [PubMed] [Google Scholar]
- 18.Lambert L, Danes J, Jahoda J, Masek M, Lisy J, Ourednicek P. Submilisievert ultralow-dose CT colonography using iterative reconstruction technique: a feasibility study. Acta Radiol. 2014 doi: 10.1177/0284185114533683. [DOI] [PubMed] [Google Scholar]
- 19.Flicek KT, Hara AK, Silva AC, Wu Q, Peter MB, Johnson CD. Reducing the radiation dose for CT colonography using adaptive statistical iterative reconstruction: A pilot study. AJR Am J Roentgenol. 2010;195:126–131. doi: 10.2214/AJR.09.3855. [DOI] [PubMed] [Google Scholar]
- 20.Yoon MA, Kim SH, Lee JM, et al. Adaptive statistical iterative reconstruction and Veo: assessment of image quality and diagnostic performance in CT colonography at various radiation doses. J Comput Assist Tomogr. 2012;36:596–601. doi: 10.1097/RCT.0b013e31826092be. [DOI] [PubMed] [Google Scholar]
- 21.Lubner MG, Pickhardt PJ, Tang J, Chen GH. Reduced image noise at low-dose multidetector CT of the abdomen with prior image constrained compressed sensing algorithm. Radiology. 2011;260:248–256. doi: 10.1148/radiol.11101380. [DOI] [PubMed] [Google Scholar]
- 22.McCollough C, Cody D, Edyvean S, et al. The measurement, reporting and mangement of radiation dose in CT. College Park, MD: American Association of Physicists in Medicine. AAPM; 2008. [Google Scholar]
- 23.Deak PD, Smal Y, Kalender WA. Multisection CT protocols: sex- and age-specific conversion factors used to determine effective dose from dose-length product. Radiology. 2010;257:158–166. doi: 10.1148/radiol.10100047. [DOI] [PubMed] [Google Scholar]
- 24.Boone JMSK, Cody DD, McCullough CH, McNitt-Gray MF, Toth TL. Size-Specific Dose Estimates (SSDE) in Pediatric and Adult Body CT Examinations American Association of Physicists in Medicine. College Park MD: American Association of Physicists in Medicine; 2011. [Google Scholar]
- 25.Bankier AA, Kressel HY. Through the Looking Glass revisited: the need for more meaning and less drama in the reporting of dose and dose reduction in CT. Radiology. 2012;265:4–8. doi: 10.1148/radiol.12121145. [DOI] [PubMed] [Google Scholar]
- 26.Lubner MGPP, Kim DH, Tang J, Munoz del Rio A, Chen GH. Prospective Evaluation of Prior Image Constrained Compressed Sensing (PICCS) Algorithm in Abdominal CT: A comparison of reduced dose with standard dose imaging. Abdom Imaging. 2014 doi: 10.1007/s00261-014-0178-x. In Press. [DOI] [PMC free article] [PubMed] [Google Scholar]
- 27.Sagara Y, Hara AK, Pavlicek W, Silva AC, Paden RG, Wu Q. Abdominal CT: comparison of low-dose CT with adaptive statistical iterative reconstruction and routine-dose CT with filtered back projection in 53 patients. AJR Am J Roentgenol. 2010;195:713–719. doi: 10.2214/AJR.09.2989. [DOI] [PubMed] [Google Scholar]
- 28.Prakash P, Kalra MK, Kambadakone AK, et al. Reducing abdominal CT radiation dose with adaptive statistical iterative reconstruction technique. Invest Radiol. 2010;45:202–210. doi: 10.1097/RLI.ob013e3181dzfeec. [DOI] [PubMed] [Google Scholar]
- 29.Tang JT-LP, Chen G-H. Proc. SPIE 7961, Medical Imaging. Physics of Medical Imaging. 2011 [Google Scholar]
- 30.Chen GH, Tang J, Leng S. Prior image constrained compressed sensing (PICCS): a method to accurately reconstruct dynamic CT images from highly undersampled projection data sets. Med Phys. 2008;35:660–663. doi: 10.1118/1.2836423. [DOI] [PMC free article] [PubMed] [Google Scholar]
- 31.Pinheiro JCBD. Mixed-Effects Models in S and S-PLUS. New York: Springer; 2000. [Google Scholar]
- 32.Bland JMAD. Agreement between methods of measurement with multiple observations per individual. Journal of Biopharmaceutical Statistics. 2007;17:571–582. doi: 10.1080/10543400701329422. [DOI] [PubMed] [Google Scholar]
- 33.Team RDC. R: A language and environment for statistical computing. Vienna, Austria: R Foundation for Statistical Computing; 2013. http://www.R-project.org. [Google Scholar]
- 34.Pickhardt PJ, Lee AD, Taylor AJ, et al. Primary 2D versus primary 3D polyp detection at screening CT colonography. AJR Am J Roentgenol. 2007;189:1451–1456. doi: 10.2214/AJR.07.2291. [DOI] [PubMed] [Google Scholar]
- 35.Pickhardt PJ, Lubner MG, Kim DH, et al. Abdominal CT with model-based iterative reconstruction (MBIR): initial results of a prospective trial comparing ultralow-dose with standard-dose imaging. AJR Am J Roentgenol. 2012;199:1266–1274. doi: 10.2214/AJR.12.9382. [DOI] [PMC free article] [PubMed] [Google Scholar]


