

Abstract
The catastrophic 2010 earthquake in Port-au-Prince, Haiti, led to the large-scale displacement of over 2.3 million people, resulting in rapid and unplanned urbanization in northern Haiti. This study evaluated the impact of this unplanned urbanization on mosquito ecology and vector-borne diseases by assessing land use and change patterns. Land-use classification and change detection were carried out on remotely sensed images of the area for 2010 and 2013. Change detection identified areas that went from agricultural, forest, or bare-land pre-earthquake to newly developed and urbanized areas post-earthquake. Areas to be sampled for mosquito larvae were subsequently identified. Mosquito collections comprised five genera and ten species, with the most abundant species being Culex quinquefasciatus 35% (304/876), Aedes albopictus 27% (238/876), and Aedes aegypti 20% (174/876). All three species were more prevalent in urbanized and newly urbanized areas. Anopheles albimanus, the predominate malaria vector, accounted for less than 1% (8/876) of the collection. A set of spectral indices derived from the recently launched Landsat 8 satellite was used as covariates in a species distribution model. The indices were used to produce probability surfaces maps depicting the likelihood of presence of the three most abundant species within 30 m pixels. Our findings suggest that the rapid urbanization following the 2010 earthquake has increased the amount of area with suitable habitats for urban mosquitoes, likely influencing mosquito ecology and posing a major risk of introducing and establishing emerging vector-borne diseases.
Keyword Index: Remote sensing, rapid urbanization, mosquitoes, Aedes albopictus, Haiti, earthquake
INTRODUCTION
Vector-borne diseases (VBD) constitute a neglected burden in Haiti (Caillouet et al. 2008). The country accounts for more than 90% of all lymphatic filariasis cases in the Americas (De Rochars et al. 2004, Neuberger et al. 2012) and Plasmodium falciparum malaria is endemic (Gharbi et al. 2012). In addition to an unstable infrastructure and continued degradation of the natural environment, which causes fragmentation of habitats and alteration of existing vector-host-parasite relationships, there is a high-risk of contracting VBD, especially those transmitted by mosquitoes. This is because both human-made and natural environmental modifications lead to changes which affect mosquito ecology and pose a public health concern for the emergence and re-emergence of VBD (Ellis et al. 2009).
On January 12th, 2010 Haiti experienced a 7.0 megawatt catastrophic earthquake (Brown et al. 2012) which resulted in massive destruction in Port-au-Prince and large-scale displacement of over 2.3 million people (Brown et al. 2012). It is also believed that the earthquake may have contributed to an increased number of unplanned and informal settlements throughout the country. Human alterations of the environment, regardless of intent, and social factors such as poverty, overcrowding, and deteriorating infrastructure, can exacerbate the damaging effects of natural events (Norris 2004, Vanwankebe et al. 2007). These can alter, and in some cases expand, mosquito-breeding habitats. The impacts of these changes on vector ecology and VBD, including effects on vector development sites, biodiversity, population density, and minimum infection rates, have not yet been fully explored in Haiti. Although there was an increase in malaria and dengue cases reported by travelers returning to the United States from Haiti following the 2010 earthquake (Agarwal et al. 2012, Sharp et al. 2012), only a few investigations have addressed potential causes. One study in particular presented data on post-earthquake malaria vector surveillance in two communities in southern Haiti, Leogane and Jacmel, both of which experienced extensive destruction during the earthquake (Townes et al. 2012). Out of 1,629 suspected malaria cases, about 20% were positive for falciparum malaria. A later study at a health center in Leogane also reported a rapid diagnostic test positivity rate of 47% among 130 patients with undifferentiated fever (Neuberger et al. 2011).
Rapid land cover change can, via spontaneous urbanization, significantly increase mosquito breeding sites through modifications of the local topography that increase ponding, peri-domestic water storage practices, and proliferation of waste containers that provide suitable habitats for vectors such as Cx. quinquefasciatus, Ae. aegypti, and Ae. albopictus. Combined with sudden and vast human displacements, the effects on mosquito ecology and VBD transmission can be significant (Norris 2004). Several mosquito species have been collected in aquatic habitats of the Artibonite Valley, Haiti (Caillouet et al. 2008), but how the massive displacement of individuals to northern Haiti and subsequent land use changes may have affected mosquito ecology in these newly urbanized areas has yet to be evaluated. To understand how changes in mosquito populations may have been influenced by recent urbanization, we conducted a field study focused on larval habitat distribution in northern Haiti. The aim of this study was to identify specific, recent land use land cover (LULC) changes in the urbanizing Cap-Haitian and Caracol corridors of northern Haiti and relate these to mosquito species diversity and distribution obtained from our field investigation.
MATERIALS AND METHODS
Study area
The study was conducted in northern Haiti, in and around the city of Cap-Haitian (19.7500° N, 72.2000° W) and the coastal village of Caracol (19.6833° N, 72.0167° W) (Figure 1). Cap-Haitian is the second largest city in Haiti and has a characteristic tropical climate. Mean temperature ranges from 21.1° C–26.7° C. The wettest months are April and May with about 5 cm of rain per month during the rainy season (Rebaudet et al. 2013). The city has a number of neighborhoods, many which were already densely settled but experienced a large influx of people from Port-au-Prince after the 2010 earthquake. Caracol has similar climatic conditions. Prior to the earthquake, the town had approximately 6,000 people but in 2012, a 600-acre industrial park was built which attracted an estimated 300,000 new residents to the town.
Figure 1.

The study area is constrained to five communes (third-level administrative divisions of Haiti): Cap-Haitien, Milot, Quartier Morin, Limonade, and Caracol, within the Nord & Nord-Est departments.
Land use land cover change analysis
RapidEye Level 1B satellite images, collected on 22–30 January, 2010 and 7 February, 2013 were used to detect and analyze changes in the study area, post-earthquake. The 5-band multispectral images had a spatial resolution of 6.5 m, which enabled detailed information extraction and land use classification. Standard pre-processing operations were carried out on the images before further analysis was conducted. All processing and analysis was carried out using Idrisi Selva v 17.02 and ArcGIS 10.2 software.
Training data containing the spectral signatures of ten predetermined land cover types present in the 2010 and 2013 Rapideye images were generated for the analysis (Table 1). A maximum likelihood supervised classification (MLC) was performed on each image to assign each pixel to a specific land use class. MLC categorizes pixels with the maximum likelihood of belonging to a class based on the probability of correctly classifying sample pixels in the training data, and then all pixels in the image (Murai 1999). The method was chosen for its relatively high accuracy compared to other supervised classification methods. In this analysis, the training sites were generated based on homogeneity in areas where land use types were known and could be identified. Subsequently, each pixel within a particular training site was assigned to one of ten predetermined classes (Jensen 1996). To simplify our analysis, we grouped the ten classes from the MLC into four major land use classes of interest: urban (built up areas), bare-land, agriculture, and forest. The classification accuracy was assessed using the confusion matrix and Kappa statistics. We incorporated ground truth data from Google Earth Pro v.7.0 for the accuracy assessment.
Table 1.
Defining the spectral signatures of ten predetermined land cover types present in the images.
| Land Type | Definition |
|---|---|
| Water | Colorless, transparent, odorless, tasteless liquid that forms the seas, |
| River | Large natural stream of water flowing in a channel to the sea, a lake, or another stream |
| Urban | All built-in areas including residential, commercial, and industrial |
| Agriculture | Cropland and pastures |
| Wetland | Land consisting of marshes or swamps; saturated land |
| Forest | A large tract of land covered with trees and underbrush; woodland |
| Salt flats | An extensive level tract coated with salt deposits left by evaporation of rising ground water or a temporary body of surface water |
| Bare land | Land in its unused natural state |
| Cloud | The projection of a cloud structure with respect to the direction of incoming solar radiation from the satellite |
| Shadow | Shadows cast by clouds and other features |
The Land Change Modeler within Idrisi Selva was used to detect changes between the 2010 and 2013 images, concentrating on changes from agriculture, forest, or bare-land to urbanized areas. Both images were evaluated for gains and losses (change) as well as persistence (no change) in urban areas as these determined the areas where sample sites for the entomological survey would be targeted.
Mosquito sampling
Thirty-five sites were identified and sampled for mosquito larvae in-and-around Cap-Haitian and Caracol based on a stratified random sampling method. This method has been found to give a good representation of the total study area and to limit bias when selecting sampling locations (Troyo et al. 2008). The specific sites, characterized as areas of change (gains) from agriculture, forest, or bare-land to urban areas were identified from the change detection maps. Control sites were also identified as areas that have not changed from the above-mentioned categories. Following Troyo et al. (2008), a sample grid cell size of 100 ×100 m was considered adequate for larval sample collection. Hawth’s Analysis Tools for ArcGIS were employed to select grid cells representing 10% of pixels that changed to urban, as well as 10% of pixels that remained unchanged in the forest, agriculture, bare-land, and urban classes.
Based on the selected sample sites, a larval survey was conducted in the study areas, over a two-week period in July, 2013. Within each of the sample sites, all possible larval habitats were assessed for larvae and their locations were recorded with a GPS. At each water body within the site, ten dips were carried out with a larval dipper. If the aquatic habitat was too shallow, then the water body was sampled using an aquatic pipet. A representative sample of ten dips per habitat was used based on feasibility and time management. The dips were done around floating debris, aquatic and emergent vegetation, and along the edges of the natural aquatic habitats where larvae were expected. All potential larval habitats were examined for the presence of water and larvae, including noting all containers found within the sample site. Additionally, at each collection site, the environmental characteristics of the habitats were recorded. Upon completion of the fieldwork, a container index, the number of water-holding habitats positive for larvae and or pupae per potential habitat, was calculated (Focks 2003, Troyo et al. 2008). Containers consisted of bottles, bowls, buckets, tires, and any other item left outside capable of holding water. The specimens were preserved in vials with 70% ethanol and transported to the University of Miami using a permit from the Center for Disease Control and Prevention. The specimens were mounted on slides and identified using the keys by the Walter Reed Biosytematics Unit, and by Cutwa-Francis and O’Meara (2008).
In addition to species distribution modeling using the MaxEnt software, the entomological data were analyzed using a Chi-square test of proportions. Statistical tests resulting in a probability value <0.05 were considered statistically significant. All statistical analyses were conducted using SAS 9.3 (SAS Institute Inc., Cary, NC).
Species distribution model prediction
Models of species distribution were developed for the three most abundant species collected: Ae. aegypti, Ae. albopictus, and Cx. quinquefasciatus, in a presence-only distribution modeling algorithm, the Maximum Entropy (MaxEnt) v. 3.3.3 model (Phillips et al. 2006). MaxEnt finds the largest spread (maximum entropy) in a geographic dataset of species presences in relation to a set of ‘background’ environmental variables (Halvorsen 2013). Previous studies determined that MaxEnt has often shown accurate predictions and good extrapolation across an entire predicted area, even for small sample sizes (Hernandez et al. 2006, Li et al. 2009). For this study, sample locations, indicating presence, were incorporated with environmental predictor variables derived from 2013 Landsat 8 satellite imagery.
While previous studies using MaxEnt have relied primarily on bioclimatic variables and topographic data as predictor variables (Elith et al. 2011, Kramer-Schadt et al. 2013, Li et al. 2009), we derived a set of spectral indices from a recent Landsat 8 image covering the study area. Four different indices were derived, including: urban index (UI), for urban or built up areas (As-Syakur et al. 2012); soil and vegetation index (SVI), showing the highest values for both vegetated and bare soil covered areas (Villa 2012); normalized difference impervious surface index (NDISI), to distinguish between impervious materials and other land covers (Liu et al. 2013, Xu 2010, Xu et al. 2013); and modified normalized difference water index (MNDWI), to highlight water features in builtup land dominated areas (Xu 2006, Xu 2008, Xu et al. 2013). These indices are based on simple transforms of image spectral bands that are calculated as follows:
Where SWIR, NIR, and TIR indicate shortwave infrared, near infrared, and thermal infrared, respectively, of the Landsat 8 sensor. SWIR2 refers to the second of two SWIR bands of Landsat 8.
A Landsat 8 scene acquired March 25, 2013 was used to calculate the four indices indicated above. Landsat 8 is the newest in a continuous series of Landsat satellite missions, and although Landsat 8 imagery has been used for water resource management and assessment of irrigated agriculture (Cuenca et al. 2013), we are unaware of its use for mosquito species distribution modeling. Although the resolution (30 m) of Landsat 8 imagery is coarser than the 5 band Rapideye imagery (6.5 m) used for the change detection, Landsat 8 includes two short wave infrared and two thermal infrared bands (Irons et al. 2012), which are particularly sensitive to water and urban features. Thus, the Rapideye images were less suitable for development of continuous environmental variables that are required as inputs to species distribution models such as MaxEnt.
The resulting MaxEnt models were interpreted using the area under the curve (AUC), the true skill statistic (TSS), and jackknife measures. The AUC is frequently used as a standard method to assess predictive power and qualitative characterization of distribution models (Halvorsen 2013) and it estimates how precisely the model differentiates species occurrences from a random sample obtained from background pixels. AUC is derived by using all possible thresholds to plot the probability that a model correctly classifies a presence (sensitivity), vs the probability that a model will correctly classify a random background point (specificity) (Khatchikian et al. 2011). AUC ranges from 0 to 1; a value of 1 indicates perfect model agreement, whereas a value of 0.5 indicates a performance no better than random, and 0 is of complete disagreement (Khatchikian et al. 2011). An AUC above 0.75, however, is considered potentially useful to justify analysis and application of the model results (Phillips and Dudik 2008).
As presence-only models lack ‘true absence’ data, specificity is modified to rely on background values as pseudo-absences (Phillips et al. 2006). While AUC is widely used in prediction assessment, it has been criticized for its weakness in assessing the accuracy of Species distribution model (SDM) predictions (Allouche et al. 2006, Lobo et al. 2008). Lobo et al. 2008 contend that the AUC provides a measure of the degree to which a species is restricted along the range of predictor conditions in the study area, but not about reliability of the model’s performance. Therefore, the threshold-dependent TSS was also employed to further assess the predictive power of the SDMs.
TSS is defined as the average of the net prediction success rate for presence and/or for absence (Lobo et al. 2008). TSS reflects the rate of false positive and false negative predictions, but it is not sensitive to the frequency of presence points and thus is not affected by prevalence or by the size of the validation set (Jones et al. 2010). While some studies have jointly used AUC as a threshold independent and Kappa as a threshold dependent measure of predictive accuracy, Allouche et al. 2006 recommends the use of TSS over Kappa to measure model performance in ecological studies. Similarly to Kappa ranges, TSS values > 0.6 are considered good (0.7–0.85 = very good), 0.2–0.6 fair to moderate, and < 0.2 poor (Jones et al. 2010, Landis 1977). MaxEnt also performs a jackknife analysis, as a built-in option, to determine which of the environmental variables has a significant influence on distribution patterns. The jackknife test measures variable importance and evaluates the relative strengths of each predictor variable (Yost et al. 2008). It tests the gain of a model based solely on each environmental variable as well as the loss or gain when the same variable is excluded from the model. The greater the loss of gain due to a variable being excluded from the full model, the more important that variable is in constructing the final model surface.
RESULTS
Classification and change detection
The classified LULC maps for northern Haiti for 2010 and 2013 are presented in Figure 2. Overall, the areal extent percentage in km2 of agriculture, forest, and urban land use classes increased from 2010 to 2013, while bare-lands decreased (Table 2). In total, we detected a 5.1% increase in areas classified as urban over the period, indicating fairly rapid urban expansion. Although the overall Kappa accuracy for the LULC classification was high: 94.1% for the 2010 map and 90.9% for the 2013 map, dry riverbeds, wetland boundary areas, and salt flats may have been indistinguishable from built-up/urban areas contributing to classification errors (Figure 2).
Figure 2.

Land-use land cover classification of northern Haiti in A) 2010 and B) 2013. Maximum likelihood classification of surface features identifying land cover classes for each time period.
Table 2.
Percentage of losses and gains in land use type from 2010 to 2013 in northern Haiti
| Square km | % Loss | % Gain | Overall change | |
|---|---|---|---|---|
| Agriculture | 544.9 | 73.2% | 106.4% | 33.3% |
| Bare-land | 675.3 | 311.2% | 65.2% | −246% |
| Forest | 732.2 | 85.5% | 143.2% | 57.7% |
| Urban | 850.8 | 94.8% | 516% | 421.2% |
Entomological survey results
In the 35 sites sampled for mosquito larvae (Figure 4), five genera and ten species were collected. The most abundant species in the collections were: Cx. quinquefasciatus 35% (304/876), Ae. albopictus 27% (238/876), and Ae. aegypti 20% (174/876). The main mosquitoes among the species collected included Ae. aegypti, Ae. albopictus, Anopheles albimanus, Cx. nigripalpus, and Cx. quinquefasciatus, while non-vector species found less often in the sample sites included Ae. triseriatus, Ae. taeniorhynchus, Cx. erraticus, Psorophora jamaicensis, and Mansonia spp (only 2nd instar larvae were collected but most likely Ma. dyari) (Pena and Chadee 2004).
Figure 4.

Sample locations of mosquito larvae occurrence in-and-around Cap Haitian and Caracol. Sampling sites were selected based on a stratified random sampling method generated from the LULC images.
An analysis of the species composition for the main disease vectors indicated a statistically significant difference in mosquito composition (x2=28.4, df= 12, P = 0.005) when comparing between the four land use types independently of the other. As shown in Figure 5, there was a higher mosquito species diversity and prevalence in the areas characterized as changed from agriculture, forest, or bare-land to urban. Statistical significance in mosquito species diversity was observed when comparing specifically agriculture sites that changed to newly urbanized (x2=18.2, df= 4, P = 0.001).
Figure 5.

Disease vectors collected by A) land cover type B) habitat. Occurrence of the main disease vectors within particular land cover categories as well collections within human-made or natural habitats.
Furthermore, a greater number of Ae. albopictus and Ae. aegypti were collected in urban areas compared to the other three classes and An. albimanus were collected in persistent agriculture sites. Culex nigripalpus was the only species collected in areas classified as bare-land, while all the other mosquito species were collected in sites where bare-land had changed to urban.
Nearly 77% (132/173) of the containers documented were wet and 876 larvae were collected in over 132 containers or water bodies (Table 3). When comparing the areas that did not change to the ones changed to urban, there was an increase in the number of containers and an increase in the number of containers positive for vector mosquitoes. Of the containers that were identified and found to be positive with larvae, tires comprised 23% (39/173) of the collection. Moreover, the most prevalent species in artificial containers in areas that were not changed was Ae. aegypti. In areas newly urbanized post-earthquake, the most prevalent species was Ae. albopictus.
Table 3.
The container index, number of water-holding habitats positive for larvae per land use type.
| No change in land use | Land use changed to urban | |
|---|---|---|
| Agriculture | 91% (10/11) | 73% (30/41) |
| Bare-land | 100% (2/2) | 79% (38/48) |
| Forest | 100% (3/3) | 83% (15/18) |
| Urban | 68% (34/50) | N/A |
Analysis of species composition between human-made and natural habitats was also carried out. Huan-made habitats consisted mainly of bottles, ditches, and temporary pools of water along unpaved roads and paths within and around the various land use types. Natural habitats are soil-based water bodies, which include permanent, semi-permanent, and temporary flood or brackish water pools. There was a significant difference in species composition between the two habitat types (χ2=48.6, df= 5, P = 0.0001); man-made habitats had a greater percentage of mosquitoes such as Ae. aegypti 96% (24/25), Ae. albopictus 89% (24/27), and Cx. quinquefasciatus 61% (22/36). Anopheles albimanus 100% (8/8) on the other hand was only collected in a highly brackish riverbed found in an agricultural grid that housed banana plants (Figure 5).
Species distribution models
Predictive surfaces maps indicating probability of presence were developed for the three most common container-breeders, Ae. aegypti, Ae. albopictus, and Cx. quinquefasciatus, by using MaxEnt. The number of occurrence points for the other mosquito species in our field study were insufficient to produce reliable model outputs. Figure 6 illustrates the resulting maps for the three species.
Figure 6.

Predictive maps of species occurrence: A) Ae. aegypti, B) Ae. albopictus, and C) Cx. quinquefasciatus. Each map shows the predicted suitability of geographic areas for species occurrence, where green is low probability of occurrence, and purple is high probability.
There was a high relative probability of Ae. aegypti (0.91) present in-and-around urbanized areas and along the dry riverbeds and shorelines. The relative probability for Cx. quinquefasciaus (0.99) was high around built-up/urban areas. The probabilities of presence were lower in vegetated areas and almost zero in the bare-land for both species. However, the model revealed that Ae. albopictus had a high probability (0.84) of presence in built-up areas, along roads as well as in agricultural and vegetated areas (Figure 6), which is consistent with the bionomics of this particular vector.
The predicted SDMs for each species were found to be significantly higher than a random prediction. The associated response curves and the calculated AUC of the test data confirmed the overall predictive performance of the models and indicated strong agreement with AUC values of 0.96, 0.87, and 0.95 (with corresponding standard deviations of 0.02, 0.04, and 0.02) for Ae. aegypti, Ae. albopictus, and Cx. quinquefasciatus, respectively (Table 4). The TSS value for Ae. aegypti was 0.66, indicating a good prediction, 0.54 (moderate) for Ae. albopictus, and 0.73 (very good) for Cx. quinquefasciatus (Table 4).
Table 4.
MaxEnt species distribution results for the three most sampled vector species in northern Haiti.
| Species | #Training samples | #Test samples | Test AUC | AUC standard deviation | TSS |
|---|---|---|---|---|---|
| Ae. aegypti | 22 | 7 | .96 | 0.01 | 0.66 |
| Ae. albopictus | 26 | 8 | .87 | 0.09 | 0.54 |
| Cx. quinquefasciatus | 27 | 8 | .95 | 0.02 | 0.73 |
The resulting distributions in Figure 6 also agreed with the ecological understanding of particular mosquito species. Because we used presence-only data, constraints were imposed so that the model solution reflected information from the presence-only records (Elith et al. 2011). Results from prediction models for each species as well as the associated AUC and TSS values are presented in Table 4. Overall, the model for Cx. quinquefasciatus performed better than those for Ae. aegypti and Ae. albopictus.
Jackknife measures were also used to determine the importance of each of the environmental variables for explaining the predicted species distribution (Figure 7). In addition, the percent contribution of each variable is summarized in Table 5. The percent predictive contribution of each variable measures the impact that particular variable has on predicting the occurrence of that species.
Figure 7.
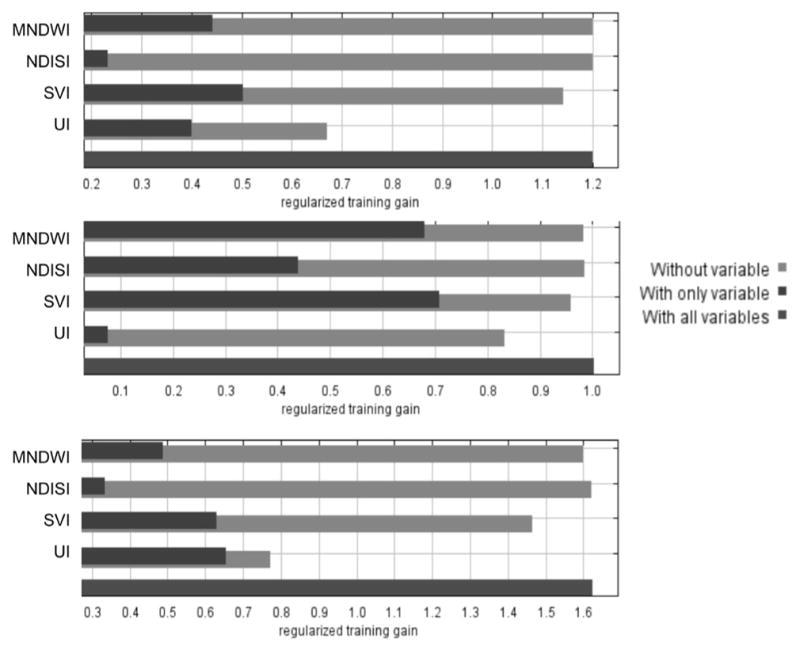
Jackknife analysis to determine the importance of each of the environmental variables in relation to the regularized training gain for: A) Ae. aegypti, B) Ae. albopictus, and C) Cx. quinquefasciatus. The plots show where environmental variables either increase or reduce the gain when used in isolation or when omitted from the model.
Table 5.
Percent contribution of each of the environmental variables.
| UI contribution | NDISI contribution | SVI contribution | MNDWI contribution | |
|---|---|---|---|---|
| Ae. aegypti | 49.4 | 11.3 | 14.7 | 24.6 |
| Ae. albopictus | 21.3 | 15.6 | 29.2 | 34 |
| Cx. quinquefasciatus | 51.6 | 9.8 | 36.2 | 2.4 |
For Ae. aegypti, the jackknife test of variable importance indicated that the SVI was the most important predictor variable when used in isolation, while the UI demonstrated the highest decrease when it was omitted from the model. UI also provided the highest percent contribution, 49.4%, to the overall model. Similarly, jackknife results for Ae. albopictus indicated that SVI had the highest gain when used in isolation, while UI demonstrated the highest loss of gain when excluded from the full model. UI had a percent contribution of 21.3%. For Cx. quinquefasciatus, UI contributed the most when used in isolation but also had the highest decrease when omitted from the model. Additionally, UI contributed over 51.6% to predicting the occurrence of Cx. quinquefasciatus.
DISCUSSION
This is the first published report of mosquito ecology in the Cap-Haitian and Caracol corridor of northern Haiti. During the field collection, the predominant species collected were Cx. quinquefasciatus, Ae. aegypti, and Ae. albopictus, regardless of the land use category sampled. Aedes albopictus and Ae. aegypti were collected more frequently from land use types categorized as urban and newly urbanized. However, Ae. aegypti was primarily in artificial containers found in areas that were urban prior to the 2010 earthquake. Aedes albopictus was more prevalent in artificial containers. Although it has been reported in central and southern Haiti (Fernandez et al. 2012), our study is the first confirmed report of Ae. albopictus in northern Haiti. Climatic factors, rapid migration following the earthquake, deterioration of water services, and sanitation issues have contributed to the colonization in Haiti (Gratz 2004, Paupy et al. 2009)
In addition to the large influx of people to northern Haiti following the earthquake, the development of the industrial park in Caracol is also expected to increase urbanization, as housing communities are being built for the industrial park workers. One of our sample sites was located within one of these newly developed housing communities, and though people were yet to move into the community, Ae. albopictus larvae were collected in 75% (3/4) of the water bodies sampled at this site. With the large-scale urbanization of Caracol in its infancy, there is major untapped potential to improve public health by limiting the proliferation of artificial containers that enhance risk associated with the development of formal and informal housing.
If source-reduction measures are not taken, larval habitats may increase rapidly within urban areas. Aedes aegypti and Ae. albopictus populations are influenced by human water storage practices, most notably the collection of rain water in large containers when piped water is not available or is rationed which, in turn, may increase the abundance of these vectors of dengue and chikungunya viruses (Barrera et al. 2006, Hammond et al. 2007, Padmanabha et al. 2010). Moreover, inadequate infrastructure, sub-standard housing, water storage practices, and poor sanitation proximate to newly built-up sites may change mosquito ecology increasing VBD risk in low-income communities (Haines et al. 2013).
Though dengue is not reported to be a major public health problem in Haiti, it is most likely because it is under-reported and under-diagnosed. Dengue was first reported in 1964 (Gentilini 1964, Lenhart et al. 2008). Dengue studies conducted in La Boule, Port-au-Prince, and various coastal towns in 1969 and 1971 confirmed transmission of DEN-2 and DEN-3 (Lenhart et al. 2008, Ventura and Ehrenkranz 1976). Very little is currently known of the transmission rates within the Haitian population. In neighboring Dominican Republic, at least seven provinces have dengue incidence of 32 cases/100,000 habitants (Cabrera-Batista et al. 2005). It is important to target environmental and ecosystem management to reduce dengue vector breeding habitats to reduce the potential burden of the disease, globally the fastest growing VBD (WHO 2014). Further, a recent outbreak of chikungunya fever in the Caribbean Basin drew attention to this prospect of this VBD emerging within Haiti (CDC 2014).
In regards to malaria vectors, only one species of anopheline was collected in our field investigation and was only found in eight of 180 samples. Several Anopheles spp. known to transmit malaria have been identified in Haiti, including An. albimanus, An. crucians, An. pseudopunctipennis, An. grabhamii, and An. vestitipennis (Raccurt 2004). However, An. albimanus is responsible for almost all of the transmission of P. falciparum in Haiti (Hobbs et al. 1986). Urbanization has been shown to significantly reduce malaria transmission by shifting entomological, parasitological, and behavioral dynamics (Qi et al. 2012, Tatem et al. 2013). In particular, Anopheles mosquitoes are negatively affected by water pollution as well as the reduction of vector habitats resulting from rapid urbanization, especially in developing countries such as Haiti (Keating et al. 2003).
During the field collection, An. albimanus was collected only in water bodies found in agriculture sites. Though we only sampled in the dry season, in Africa, anopheline abundance has been reported to be much higher in rural undeveloped areas when compared to urbanized areas (Jensen 1996, Murai 1999), which is consistent with our results. The increase in urban areas from 2010 to 2013 may therefore explain the few collections of anophelines in our area. Several studies have shown that an increase in urbanized areas contributes to a reduction in the number of places that could potentially serve as Anopheles breeding sites (Hay et al. 2005, Keating et al. 2003, Qui et al. 2012, Tatem et al. 2013, Tatem et al. 2008).
The important filariasis vector, Cx. quinquefasciatus, was collected in urbanized areas in both man-made habitats, such as ditches and latrines, and containers such as tires and buckets. Culex quinquefasciatus has been shown to be most abundant in urban habitats both indoors and outdoors and uses dirty and polluted aquatic sources as larval habitat (Chaves et al. 2009, Pires and Gleiser 2010, Thongsripong et al. 2013), sources usually associated with human dwellings (Burke et al. 2010). Northern Haiti already experiences the highest burden of filariasis in the Americas, but rapid urbanization has increased the risk of filariasis transmission as predicted by the species distribution model (Figure 6). Urban lymphatic filariasis is one of the key challenges in the ongoing global efforts to eliminate this disease as a public health problem (Addiss 2010, Mwakitalu et al. 2013). Parts of Haiti experience flooding during the rainy season and trash accumulates, clogging drains and ditches that results in stagnant water. These factors contribute to the prolific breeding of Cx. quinquefasciatus.
In conjunction with our field samples, we generated predictive surfaces that depict probable presence of our three most abundant mosquitoes, Ae. aegypti, Ae. albopictus, and Cx. quinquefasciatus, highly common container breeders (Figure 6), using novel environmental data from Landsat 8 satellite imagery. Urban areas identified by UI were found to be important in predicting distribution of both Ae. aegypti and Cx. quinquefasciatus, and consistently demonstrated the most decrease model in gain when omitted from all three models. Surface wetness (MNDWI) and vegetative coverage (SVI) were important contributors in the A. albopictus model. Evidently, the MaxEnt model results show a high probability for Ae. aegypti and Cx. quinquefasciatus in and around urban areas, while Ae. albopictus has a high probability of presence in all land use types, consistent with its broader niche relative to its congener Ae. aegypti. Thus, the results obtained from our novel application of MaxEnt are consistent with ecological understanding of Ae. aegypti, Ae. albopictus, and Cx. quinquefasciatus.
The findings suggest that the rapid urbanization in northern Haiti impacts mosquito ecology and the risk of VBD. Increased urbanization will likely increase suitable breeding habitats for Ae. aegypti, Ae. albopictus, and Cx. quinquefasciatus. Moreover, the results of investigation can assist in the development of improved public health guidelines for mosquito control by indicating the likely locations of these important vectors. Currently, there is limited vector control in this area of Haiti due to inadequate funding to allocate proper resources to control vector populations. The predictive maps we generated may be employed to minimize public health risk by guiding development of integrated vector management programs that prioritize control efforts (Beier et al. 2008) in specific high-risk areas of northern Haiti. Specific, additional intervention recommendations will likely include urban-environmental improvements to sanitation and sewerage, and source reduction, as well as community-based outreach to increase local knowledge and encourage behavioral changes that can lead to reduced VBD risk and burden. Lastly, a follow-up in five years is recommended to observe how the container-breeder mosquitoes have changed along with urban development.
Figure 3.

Land change modeler. The 2010 and 2013 classified images were compared and evaluated for gains and losses in land cover identified as urban. Gains represent land cover that has become urban between 2010 and 2013, and persistence includes urban areas that have not changed.
Acknowledgments
The authors thank CSTARS/University of Miami and Mr. Raymond Turner for helping us acquire the RapidEye imagery of northern Haiti. Additionally, we thank the following organizations for their support: Haitian Ministry of Public Health and Population, Directors of Hospital Justinien, the Directors of the North and Northeast Department, the Department of Sanitation, as well as the Caracol Industrial Park. Thank you to Stanley Rigaud for his assistance in the field.
REFERENCES CITED
- Addiss D. The 6th Meeting of the Global Alliance to Eliminate Lymphatic Filariasis: A half-time review of lymphatic filariasis elimination and its integration with the control of other neglected tropical diseases. Parasit Vectors. 2010;3:1–26. doi: 10.1186/1756-3305-3-100. [DOI] [PMC free article] [PubMed] [Google Scholar]
- Agarwal A, McMorrow M, Arguin PM. The increase of imported malaria acquired in Haiti among US travelers in 2010. Am J Trop Med Hyg. 2012;86:9–10. doi: 10.4269/ajtmh.2012.11-0394. [DOI] [PMC free article] [PubMed] [Google Scholar]
- Allouche O, Tsoar A, Kadmon R. Assessing the accuracy of species distribution models: prevalence, kappa and the true skill statistic (TSS) J Appl Ecol. 2006;43:1223–1232. [Google Scholar]
- As-Syakur AR, Adnyana IWS, Arthana IW, Nuarsa IW. Enhanced Built-Up and Bareness Index (EBBI) for mapping built-up and bare land in an urban area. Remote Sensing. 2012;4:2957–2970. [Google Scholar]
- Barrera R, Amador M, Clark GG. Use of the pupal survey technique for measuring Aedes aegypti (Diptera: Culicidae) productivity in Puerto Rico. Am J Trop Med Hyg. 2006;74:290–302. [PubMed] [Google Scholar]
- Beier JC, Keating J, Githure JI, Macdonald MB, Impoinvil DE, Novak RJ. Integrated vector management for malaria control. Malar J. 2008;7:S4. doi: 10.1186/1475-2875-7-S1-S4. [DOI] [PMC free article] [PubMed] [Google Scholar]
- Brown C, Ripp J, Kazura J. Perspectives on Haiti two years after the earthquake. Am J Trop Med Hyg. 2012;86:5–6. doi: 10.4269/ajtmh.2012.11-0684a. [DOI] [PMC free article] [PubMed] [Google Scholar]
- Burke R, Barrera R, Lewis M, Kluchinsky T, Claborn D. Septic tanks as larval habitats for the mosquitoes Aedes aegypti and Culex quinquefasciatus in Playa-Playita, Puerto Rico. Med Vet Entomol. 2010;24:117–123. doi: 10.1111/j.1365-2915.2010.00864.x. [DOI] [PubMed] [Google Scholar]
- Cabrera-Batista B, Skewes-Ramm R, Fermin CD, Garry RF. Dengue in the Dominican Republic: Epidemiology for 2004. Microscopy Research and Technique. 2005;68:250–254. doi: 10.1002/jemt.20225. [DOI] [PubMed] [Google Scholar]
- Caillouet KA, Keating J, Eisele TP. Characterization of aquatic mosquito habitat, natural enemies, and immature mosquitoes in the Artibonite Valley, Haiti. J Vector Ecol. 2008;33:191–197. doi: 10.3376/1081-1710(2008)33[191:coamhn]2.0.co;2. [DOI] [PubMed] [Google Scholar]
- CDC. Chikungunya in the Caribbean. Traveler’s Health. 2014 Retrieved March 20th 2014, from http://wwwnc.cdc.gov/travel/notices/watch/chikungunya-saint-martin.
- Chaves LF, Keogh CL, Vazquez-Prokopec GM, Kitron UD. Combined sewage overflow enhances oviposition of Culex quinquefasciatus (Diptera: Culicidae) in urban areas. J Med Entomol. 2009;46:220–226. doi: 10.1603/033.046.0206. [DOI] [PubMed] [Google Scholar]
- Cuenca RH, Ciotti SP, Hagimoto Y. Application of Landsat to evaluate effects of irrigation forbearance. Remote Sens 5. 2013;8:3776–3802. [Google Scholar]
- Cutwa-Francis MM, O’Meara GF. Identification Guide to Common Mosquitoes of Florida. 2008 http://fmel.ifas.ufl.edu/key/
- De Rochars MVB, Milord MD, Jean YS, Desormeaux AM, Dorvil JJ, Lafontant JG, Addiss DG, Streit TG. Geographic distribution of lymphatic filariasis in Haiti. Am J Trop Med Hyg. 2004;71:598–601. [PubMed] [Google Scholar]
- Elith J, Phillips SJ, Hastie T, Dudik M, Chee YE, Yates CJ. A statistical explanation of MaxEnt for ecologists. Diversit Distrib. 2011;17:43–57. [Google Scholar]
- Ellis BR, Wilcox BA. The ecological dimensions of vector-borne disease research and control. Cadern Saude Publi. 2009;25:S155–S167. doi: 10.1590/s0102-311x2009001300015. [DOI] [PubMed] [Google Scholar]
- Fernandez MDCM, Saint Jean YS, Callaba CAF, Lopez LS. The first report of Aedes (Stegomyia) albopictus in Haiti. Mem Inst Oswaldo Cruz. 2012;107:279–281. doi: 10.1590/s0074-02762012000200020. [DOI] [PubMed] [Google Scholar]
- Focks DA. A review of entomological sampling methods and indicators for dengue vectors. WHO; Geneva: 2003. (TDR/IDE/Den/03.1.) [Google Scholar]
- Gentilini M, Laroche V, Degremont A. Aspects de la pathologie tropicale parasitaire et infectieuse en Republique d’Haiti. Bull Soc Pathol Exotiq. 1964;57:565–570. [PubMed] [Google Scholar]
- Gharbi M, Pillai DR, Lau DR, Hubert V, Khairnar K, Existe A, Kendio E, Dahlström S, Guérin PJ, Le Bras J. Chloroquine-resistant malaria in travelers returning from Haiti after 2010 earthquake. Emerg Infect Dis. 2012;18:1346–1349. doi: 10.3201/eid1808.111779. [DOI] [PMC free article] [PubMed] [Google Scholar]
- Gratz N. Critical review of the vector status of Aedes albopictus. Med Vet Entomol. 2004;18:215–227. doi: 10.1111/j.0269-283X.2004.00513.x. [DOI] [PubMed] [Google Scholar]
- Haines A, Bruce N, Cairncross S, Davies M, Greenland K, Hiscox A, Lindsay S, Lindsay T, Satterwaite D, Wilkinson P. Promoting health and advancing development through improved housing in low-income settings. J Urban Hlth Bull NY Acad Med. 2013;90:810–831. doi: 10.1007/s11524-012-9773-8. [DOI] [PMC free article] [PubMed] [Google Scholar]
- Halvorsen R. A strict maximum likelihood explanation of MaxEnt, and some implications for distribution modelling. Sommerfeltia. 2013;36:1–13. [Google Scholar]
- Hammond SN, Gordon AL, Lugo EDC, Moreno G, Kuan GM, Lopez MM, Lopez JD, Harris E. Characterization of Aedes aegypti (Diptera: Culcidae) production sites in urban Nicaragua. J Med Entomol. 2007;44:851–860. doi: 10.1603/0022-2585(2007)44[851:coaadc]2.0.co;2. [DOI] [PubMed] [Google Scholar]
- Hay SI, Guerra CA, Tatem AJ, Atkinson PM, Snow RW. Urbanization, malaria transmission and disease burden in Africa. Natu Rev Microb. 2005;3:81–90. doi: 10.1038/nrmicro1069. [DOI] [PMC free article] [PubMed] [Google Scholar]
- Hernandez PA, Graham CH, Master LL, Albert DL. The effect of sample size and species characteristics on performance of different species distribution modeling methods. Ecography. 2006;29:773–785. [Google Scholar]
- Hobbs JH, Sexton JD, Stjean Y, Jacques JR. The biting and resting behavior of Anopheles-albimanus in Northern Haiti. J Am Mosq Contr Assoc. 1986;2:150–153. [PubMed] [Google Scholar]
- Irons JR, Dwyer JL, Barsi JA. The next Landsat satellite: The Landsat data continuity mission. Remote Sens Environ. 2012;122:11–21. [Google Scholar]
- Jensen JR. Introductory Digital Image Processing: A Remote Sensing Perspective. 2. Prentice Hall; New Jersey: 1996. Thematic information extraction: image classification; pp. 229–231. [Google Scholar]
- Jones CC, Acker SA, Halpern CB. Combining local and large-scale models to predict the distributions of invasive plant species. Ecol Appl. 2010;20:311–326. doi: 10.1890/08-2261.1. [DOI] [PubMed] [Google Scholar]
- Keating J, Macintyre K, Mbogo C, Githeko A, Regens JL, Swalm C, Ndenga B, Steinberg LJ, Kibe L, Githure JI, Beier JC. A geographic sampling strategy for studying relationships between human activity and malaria vectors in urban Africa. Am J Trop Med Hyg. 2003;68:357–365. [PubMed] [Google Scholar]
- Khatchikian C, Sangermano F, Kendell D, Livdahl T. Evaluation of species distribution model algorithms for fine-scale container-breeding mosquito risk prediction. Med Vet Ent. 2011;25:268–275. doi: 10.1111/j.1365-2915.2010.00935.x. [DOI] [PMC free article] [PubMed] [Google Scholar]
- Kramer-Schadt S, Niedballa J, Pilgrim JD, Schroeder B, Lindenborn J, Reinfelder V, Wilting A. The importance of correcting for sampling bias in MaxEnt species distribution models. Divers Distrib. 2013;19:1366–1379. [Google Scholar]
- Landis JKG. Measurement of observer agreement for categorical data. Biometrics. 1977;33:159–174. [PubMed] [Google Scholar]
- Lenhart A, Orelus N, Maskill R, Alexander N, Streit T, McCall PJ. Insecticide-treated bednets to control dengue vectors: preliminary evidence from a controlled trial in Haiti. Trop Med Int Hlth. 2008;13:56–67. doi: 10.1111/j.1365-3156.2007.01966.x. [DOI] [PubMed] [Google Scholar]
- Li BN, Wei W, Ma J, Zhang RJ. Maximum entropy niche-based modeling (Maxent) of potential geographical distributions of fruit flies Dacus bivittatus, D. ciliatus and D. vertebrates (Diptera: Tephritidae) J Acxta Entomol Sinica. 2009;52:1122–1131. [Google Scholar]
- Liu C, Shao Z, Chen M, Luo H. MNDISI: a multi-source composition index for impervious surface area estimation at the individual city scale. Remote Sens Lett. 2013;4:803–812. [Google Scholar]
- Lobo JM, Jimenez-Valverde A, Real R. AUC: a misleading measure of the performance of predictive distribution models. Global Ecol Biogeography. 2008;17:145–151. [Google Scholar]
- Murai S. Remote Sensing Note. Japan Assoc of Remote Sensing. 1999;11:1–9. http://wtlab.iis.u-tokyo.ac.jp/~wataru/lecture/rsgis/rsnote/contents.htm. [Google Scholar]
- Mwakitalu ME, Malecela MN, Pedersen EM, Mosha FW, Simonsen PE. Urban lymphatic filariasis in the metropolis of Dar es Salaam, Tanzania. Parasit Vectors. 2013;6:286. doi: 10.1186/1756-3305-6-286. [DOI] [PMC free article] [PubMed] [Google Scholar]
- Neuberger A, Zaulan O, Tenenboim S, Vernet S, Pex R, Held K, Urman M, Garpenfeldt K, Schwartz E. Malaria among patients and aid workers consulting a primary healthcare centre in Leogane, Haiti, November 2010 to February 2011-a prospective observational study. Eurosurveillance. 2011;16:9–10. [PubMed] [Google Scholar]
- Neuberger A, Zhong K, Kain KC, Schwartz E. Lack of evidence for chloroquine-resistant Plasmodium falciparum malaria, Leogane, Haiti. Emerg Infect Dis. 2012;18:1487–1489. doi: 10.3201/eid1809.120605. [DOI] [PMC free article] [PubMed] [Google Scholar]
- Norris DE. Mosquito-borne diseases as a consequence of land use change. EcoHealth. 2004;1:19–24. [Google Scholar]
- Padmanabha H, Soto E, Mosquera M, Lord CC, Lounibos LP. Ecological links between water storage behaviors and Aedes aegypti production: Implications for dengue vector control in variable climates. EcoHealth. 2010;7:78–90. doi: 10.1007/s10393-010-0301-6. [DOI] [PubMed] [Google Scholar]
- Paupy C, Delatte H, Bagny L, Corbel V, Fontenille D. Aedes albopictus, an arbovirus vector: From the darkness to the light. Microb Infect. 2009;11:1177–1185. doi: 10.1016/j.micinf.2009.05.005. [DOI] [PubMed] [Google Scholar]
- Pena CJ, Chadee DD. Mansonia dyari, Mansonia flaveola and Aedeomyia squamipennis in the Dominican Republic, three new country records. J Am Mosq Contr Assoc. 2004;20:449–450. [PubMed] [Google Scholar]
- Phillips SJ, Anderson RP, Schapire RE. Maximum entropy modeling of species geographic distributions. Ecological Modelling. 2006;190:231–259. [Google Scholar]
- Phillips SJ, Dudik M. Modeling of species distributions with Maxent: new extensions and a comprehensive evaluation. Ecography. 2008;31:161–175. [Google Scholar]
- Pires DA, Gleiser RM. Mosquito fauna inhabiting water bodies in the urban environment of Cordoba city, Argentina, following a St. Louis encephalitis outbreak. J Vector Ecol. 2010;35:401–409. doi: 10.1111/j.1948-7134.2010.00099.x. [DOI] [PubMed] [Google Scholar]
- Qi Q, Guerra CA, Moyes CL, Elyazar IR, Gething PW, Hay SI, Tatem AJ. The effects of urbanization on global Plasmodium vivax malaria transmission. Malar J. 2012;11 doi: 10.1186/1475-2875-11-403. [DOI] [PMC free article] [PubMed] [Google Scholar]
- Raccurt C. Le point sur le paludisme en Haiti. Cahiers d’Ètudes et de recherches francophones/SantÈ. 2004;14:201–204. [PubMed] [Google Scholar]
- Rebaudet S, Gazin P, Barrais R, Moore S, Rossignol E, Barthelemy N, Gaudart J, Boncy J, Magloire R, Piarroux R. The dry season in Haiti: a window of opportunity to eliminate cholera. PLOS Curr. 2013 doi: 10.1371/currents.outbreaks.2193a0ec4401d9526203af12e5024ddc. [DOI] [PMC free article] [PubMed] [Google Scholar]
- Sharp TM, Pillai P, Hunsperger E, Santiago GA, Anderson T, Vap T, Collinson J, Arguello DF. A cluster of dengue cases in American missionaries returning from Haiti, 2010. Am J Trop Med Hyg. 2012;86:16–22. doi: 10.4269/ajtmh.2012.11-0427. [DOI] [PMC free article] [PubMed] [Google Scholar]
- Tatem AJ, Gething PW, Smith DL, Hay SI. Urbanization and the global malaria recession. Malar J. 2013;12:133. doi: 10.1186/1475-2875-12-133. [DOI] [PMC free article] [PubMed] [Google Scholar]
- Tatem AJ, Guerra CA, Kabaria CW, Noor AM, Hay SI. Human population, urban settlement patterns and their impact on Plasmodium falciparum malaria endemicity. Malar J. 2008;7:218. doi: 10.1186/1475-2875-7-218. [DOI] [PMC free article] [PubMed] [Google Scholar]
- The Walter Reed Biosystematics Unit. Keys To The Medically Important Mosquito Species. 2013 http://www.wrbu.org/southcom_MQkeys.html.
- Thongsripong P, Green A, Kittayapong P, Kapan D, Wilcox B, Bennett S. Mosquito vector diversity across habitats in central Thailand endemic for dengue and other arthropod-borne diseases. PLOS Negl Trop Dis. 2013;7:e2507. doi: 10.1371/journal.pntd.0002507. [DOI] [PMC free article] [PubMed] [Google Scholar]
- Townes D, Existe A, Boncy J, Magloire R, Vely JF, Amsalu R, Tavernier M, Chang M. Malaria survey in post-earthquake Haiti-2010. Am J Trop Med Hyg. 2012;86:29–31. doi: 10.4269/ajtmh.2012.11-0431. [DOI] [PMC free article] [PubMed] [Google Scholar]
- Troyo A, Fuller DO, Calderon-Arguedas O, Beier JC. A geographical sampling method for surveys of mosquito larvae in an urban area using high-resolution satellite imagery. J Vector Ecol. 2008;33:1–7. doi: 10.3376/1081-1710(2008)33[1:agsmfs]2.0.co;2. [DOI] [PMC free article] [PubMed] [Google Scholar]
- Vanwambeke SO, Lambin EF, Eichhorn MP, Flasse SP, Harbach RE, Oskam L, Somboon P, van Beers S, van Benthem BHB, Walton C, Butlin RK. Impact of land-use change on dengue and malaria in northern Thailand. EcoHealth. 2007;4:37–51. [Google Scholar]
- Ventura AK, Ehrenkranz NJ. Endemic dengue virus infection in Hispaniola. I Haiti J Infect Dis. 1976;134:436–441. doi: 10.1093/infdis/134.5.436. [DOI] [PubMed] [Google Scholar]
- Villa P. Mapping urban growth using Soil and Vegetation Index and Landsat data: The Milan (Italy) city area case study. Landsc Urban Plan. 2012;107:245–254. [Google Scholar]
- Xu H. Modification of normalised difference water index (NDWI) to enhance open water features in remotely sensed imagery. Int J Remote Sens. 2006;27:3025–3033. [Google Scholar]
- Xu H. A new index for delineating built-up land features in satellite imagery. Int J Remote Sens 29. 2008;14:4269–4276. [Google Scholar]
- Xu H. Analysis of impervious surface and its impact on urban heat environment using the normalized difference impervious surface index (NDISI) Photogram Engin Remote Sens. 2010;76:557–565. [Google Scholar]
- Xu H, Lin D, Tang F. The impact of impervious surface development on land surface temperature in a subtropical city: Xiamen, China. Int J Climatol. 2013;33:1873–1883. [Google Scholar]
- Xu HQ. Extraction of urban built-up land features from landsat imagery using a thematic-oriented index combination technique. Photogram Engin Remote Sens. 2007;73:1381–1391. [Google Scholar]
- Yost AC, Petersen SL, Gregg M, Miller R. Predictive modeling and mapping sage grouse (Centrocercus urophasianus) nesting habitat using Maximum Entropy and a long-term dataset from Southern Oregon. Ecol Informat. 2008;3:375–386. [Google Scholar]