

Abstract
We demonstrate a new approach for the site-specific identification and characterization of protein N-glycosylation. It is based on a nano-liquid chromatography microarray-matrix assisted laser desorption/ionization-MS platform, which employs droplet microfluidics for on-plate nanoliter reactions. A chromatographic separation of a proteolytic digest is deposited at a high frequency on the microarray. In this way, a short separation run is archived into thousands of nanoliter reaction cavities, and chromatographic peaks are spread over multiple array spots. After fractionation, each other spot is treated with PNGaseF to generate two correlated traces within one run, one with treated spots where glycans are enzymatically released from the peptides, and one containing the intact glycopeptides. Mining for distinct glycosites is performed by searching for the predicted deglycosylated peptides in the treated trace. An identified peptide then leads directly to the position of the “intact” glycopeptide clusters, which are located in the adjacent spots. Furthermore, the deglycosylated peptide can be sequenced efficiently in a simple collision-induced dissociation-MS experiment. We applied the microarray approach to a detailed site-specific glycosylation analysis of human serum IgM. By scanning the treated spots with low-resolution matrix assisted laser desorption/ionization-time-of-flight-MS, we observed all five deglycosylated peptides, including the one originating from the secretory chain. A detailed glycopeptide characterization was then accomplished on the adjacent, untreated spots with high mass resolution and high mass accuracy using a matrix assisted laser desorption ionization-Fourier transform-MS. We present the first detailed and comprehensive mass spectrometric analysis on the glycopeptide level for human polyclonal IgM with high mass accuracy. Besides complex type glycans on Asn 395, 332, 171, and on the J chain, we observed oligomannosidic glycans on Asn 563, Asn 402 and minor amounts of oligomannosidic glycans on the glycosite Asn 171. Furthermore, hybrid type glycans were found on Asn 402, Asn 171 and in traces Asn 332.
Glycosylation is one of the most common post-translational modifications and it is known to play an important role in protein structure, protein function, cell signaling and recognition (1–4). Almost all proteins involved in the immune response are glycoproteins and their attached glycans are thought to be components of the immune system effector mechanism (5). Whereas the glycosylation of IgG, IgE and IgA is well studied, there are no detailed mass spectrometric data available describing the site-specific glycosylation profiles of human serum IgM (6–9). Human IgG has one conserved N-glycosylation site on each heavy chain CH2 domain at Asn 297, and ∼15–20% of normal polyclonal IgG bears additional Fab (fragment antigen binding) glycosylation (6, 10, 11). Other antibody classes such as IgM or IgA show a higher complexity with respect to the number of glycosylation sites and variety of glycoforms (6, 9). Only recently, also monoclonal IgM antibodies came into the focus of pharmaceutical industry, because they show great potential for the treatment of diseases (12–14).
Determination of the site-specific N-glycosylation pattern of complex proteins is a challenging task and therefore glycosylation is often solely analyzed on released glycan pools (15–17). Whereas the analysis of released pools is necessary when linkage and positional isomers have to be investigated (18, 19), the information obtained is here limited to the carbohydrate portion and does not allow any conclusion on a protein site specific heterogeneity. N-linked glycans in particular are attached by an amide bond to an asparagine residue of the protein, where this particular asparagine is necessarily part of a consensus sequence NX(S/T) or more rarely part of a NXC motif (where X can be any amino acid except proline) (20, 21). Enzymes like PNGaseF or PNGaseA can be used to specifically release the N-glycans form peptides. Thereby the asparagine residue undergoes a deamidation leading in an aspartic acid residue with a mass increase of 0.9848 Da (22–24).
Selective methods allowing a zoom onto a particular glycosite of the protein are highly desirable. Unfortunately, state-of-the-art methods are not straightforward and a great deal of effort is required to perform a detailed analysis of a complex protein sample.
Site-specific analysis of single proteins has already been carried out some decades ago, by fractionation of glycopeptides from proteolytic digested proteins and following analysis by 1D and 2D NMR spectroscopy as well as later by fast atom bombardment-MS (25–29). Nowadays, mass spectrometric analysis of glycopeptides is carried out in several ways, for example, by online electrospray ionization-MS (ESI)1 or offline matrix-assisted laser desorption/ionisation mass spectrometry-MS (MALDI) as well as by means of a combination of different techniques (30–36). “Bottom-up” approaches are the most promising strategies, where trypsin or a combination of proteases can be used to generate homogeneous medium-sized peptides/glycopeptides, which provide sufficient information to assign the glycan to a specific site in the protein (9, 37–43). In contrast, digestion using Pronase results in a “small peptide footprint,” which might not always be sufficient for an unambiguous identification (4, 44). Glycosylation is usually heterogeneous and a single peptide peak splits into multiple signals, accompanied by reduced signal intensity and altered retention on separation systems when compared with its unglycosylated counterpart (35). Furthermore, glycopeptide signals can be suppressed in the presence of peptides as a result of competitive ionization (45–47). Therefore, reduction of the sample complexity by a selective enrichment of glycopeptides is often beneficial. This can be realized by means of chemical capturing techniques (48) or by a solid phase extraction prior, or after a proteolytic digestion (34, 46, 49). In the case in which single proteins or less complex protein mixtures are investigated, an enrichment can be compensated by a chromatographic separation as it is usually the case in LC-ESI-MS (35). In MALDI-MS, suppression of glycopeptide signals is found to be a major issue and sample enrichment strategies are often required in order to obtain a reproducible and sensitive signal (34, 50, 51).
The identification of a potential glycopeptide cluster is further performed by tandem mass spectrometry, either by scanning for marker ions (52, 53) or with the assistance of peak (-pattern) interpretation tools searching for a characteristic glycoprofile mass pattern (7, 54). (Lower energy) collision-induced dissociation (CID) experiments in ESI-MS mostly deliver fragments of the glycan backbone. Thus, more sophisticated fragmentation techniques such as MSn, SORI-CID, IRMPD, ECD or ETD have been employed for a simultaneous sequencing of peptides and glycans (30, 55). Unfortunately, these techniques result in complex fragmentation spectra requiring specific tools and databases for interpretation. MALDI-TOF/TOF-MS because of its elevated collision energy, has also been reported to provide also significant fragmentation of the peptide backbone in parallel to the glycan (55–58). The glycopeptide is then usually identified by the appearance of three characteristic fragment ions: The first peak derives from a loss of the glycan (peptide fragment), the second peak derives from a cross-ring fragmentation of the inner core GlcNAc (peptide + 84Da), and the third peak results from the fragmentation of the two core GlcNAc residues (peptide + 204Da) (30, 36, 58). Identification of a glycopeptide can be performed in ESI-MS and MALDI-MS by various different diagnostic fragment ions, very much depending on the fragmentation technique and the mass analyzer employed (30). However, it has to be considered, that low parent ion intensity, large glycopeptides as well as multiple glycosylated/modified species might not always deliver sufficient fragment ions to clearly identify the glycosylation site and the peptide. Complex samples require in theory also the fragmentation of hundreds of peaks in order to confidently assign potential glycopeptide peaks. Furthermore there is always the risk that the rather large and less intense glycopeptide peaks are overlooked and not selected for automatic fragmentation. For this, LC connected offline to MS (e.g. LC-MALDI-MS) has some advantages: the MS analysis is time independent from the LC separation and individual fractions can be reanalyzed for a more specific investigation at any time (34, 36, 59).
On the other hand, an additional enzymatic de-glycosylation step is often included in the sample preparation. For this, the proteolytic digest is split into two parts, in whichby one part is deglycosylated using PNGaseF and the other one is analyzed untreated (32, 34, 35, 60). The appearance of new peaks in the deglycosylated sample indicates then for the presence of glycopeptides. The deglycosylated peptides are then also sequenced efficiently by a “standard CID” MS/MS experiment. However, this combined approach presents some challenges, because pairs of peaks from different chromatographic separation runs have to be correlated.
Here we demonstrate a systematic and straightforward approach for the site-specific identification and characterization of protein N-glycosylation using human serum IgM. The approach is based on a recently developed nano-LC-microarray-MALDI-MS platform that uses droplet microfluidics to store an analytical nano-LC run on a microarray chip (at 1 fraction per second) and which was recently also applied for the application of nanoliter phosphatase digests for the identification of protein phosphorylation (59, 61). Here, droplet microfluidics furthermore allows a PNGaseF on-chip reaction in nanoliter volumes to selectively remove the glycan portion from the peptide on each second spot. This generates two time-correlated traces: one PNGaseF-treated trace in which glycans and peptides are separated and a second untreated trace containing the intact glycopeptides exactly as they were fractionated (Fig. 1). To minimize competitive ionization and to allow digests within a chromatographic peak, one-second intervals are fractionated and stored in a micro-spot. Identifying or mining for distinct glycosites is then carried out by searching for the predicted deglycosylated peptides in the treated trace; the intact glycopeptides are necessarily present in the adjacent spots. Furthermore, the deglycosylated peptides can be sequenced in CID fragmentation experiments and analyzed by a common shot-gun proteomics pipeline (31). Although the pioneering work on the analysis of IgM glycosylation was already performed in 1979 (62, 63), there are yet no detailed data available presenting a complete picture of the IgM site-specific N-glycosylation profiles of all sites including the one from the J chain. Previous analysis are based on the released glycan pool, carried out by Arnold et al. in 2005 (64) and by Loos et al. on glycopeptides, (13) who demonstrated the recombinant production of a hetero-multimeric IgM with a human-like glycosylation in plants.
Fig. 1.
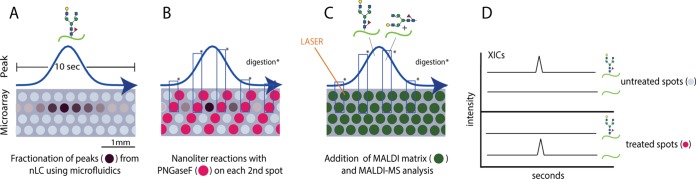
Panels A to D describe the on chip PNGaseF digest approach: A, On chip peak fractionation of a (glyco-)peptide eluting from the nano-LC column. B, The content of each other spot is digested with 3 nanoliter of PNGaseF solution. C, MALDI matrix addition. D, MALDI-MS analysis results in two traces: (1) trace of treated spots deglycosylated peptides present and (2) a trace of untreated spots still containing the intact glycopeptides. (Total ∼2800 microarray spots with a diameter of 300 μm).
Here, starting with a trypsin/GluC in-solution digestion of human polyclonal IgM, we performed an in-depth analysis of all predicted glycosylation sites with a single nano-LC run using MALDI-MS without prior glycopeptide enrichment. We observed oligomannosidic glycans (Asn 171, Asn 402 and Asn 563) on three sites, where the major glycoforms on site Asn 171 are complex type structures (>95%). Glycosite Asn 563 is the only site, which carries solely oligomannosidic structures. Glycosites Asn 402, Asn 332 and Asn 171 show small amounts of hybrid-type glycans. Asn 395 and the J chain only present complex-type glycans with one or two sialic acid residues and a bisecting GlcNAc. Unglycosylated portions were not noticed in the present study.
EXPERIMENTAL PROCEDURES
Production of Microarray Chips
Microarrays for Mass Spectrometry (MAMS) were fabricated as described in Urban et al., and Küster et al. (65, 66) In brief, a coated ITO-glass slide (12–18 Ohm/m2, Sigma Aldrich) was structured using a laser ablation system to generate a checkerboard-like array of 2800 hydrophilic sample deposition areas of 300 μm diameter and ∼35 μm depth each (720 μm center-to-center distance within one row).
Microarray plates were cleaned in acetone using ultrasonic agitation, then rinsed with ethanol, then with water and finally dried and stored under nitrogen until use.
Proteolytic Digest of IgM
Human serum IgM (Sigma, Buchs, Switzerland) was digested in solution as described in Grass et al. (67). 25 μg of IgM was dissolved in 100 mm ammonium bicarbonate, reduced using dithiotreitol, and subsequently carbamido-methylated using iodoacetamide. The protein was then purified by a precipitation step using 80% ice cold acetone and a subsequent five-minute centrifugation using a bench top centrifuge at maximum speed. The precipitated protein was then resuspended in 25 mm ammonium bicarbonate and digested overnight using trypsin (Sigma, Cat. No. T6567) and GluC (Sigma, Cat. No. P6181) at 37 °C. Sequence as well as potential N-glycosylation sites for human Ig mu chain and J-chain were obtained from Kehry et al. (68) as well as from the UniprotKB database (IGHM_HUMAN (P01871), IGJ_HUMAN (P01591)). Deglycosylated peptides were investigated manually, by considering up to two missed cleavages and methionine oxidation.
Nano-liquid Chromatography (nano-LC) and High Frequency Fractionation
For nano-liquid flow chromatography, we used an Eksigent/Ekspert (Dublin/AC, USA) nano-LC400 and a reversed-phase separation column (0,075 × 150 mm, Eksigent RPC18-CL-120). A flow rate of 300 nL/min was maintained throughout all experiments. Solvent A consisted of 0.1% unbuffered formic acid and solvent B of 95% acetonitrile in H2O. An aliquot of 5 μl sample (prepared as described above) containing 0.75 μg of IgM digest was directly injected and analyzed by the following gradient: 6–26% B from 0 to 15 min, 26–67% B from 15 to 20 min and a washing step at 67% B from 20 to 30 min. Fractions were collected at a rate of 1 Hz (circa 5 nL) using a droplet-based spotting device as described in Küster et al. (59). After fractionating the nano-LC outflow in a serpentine-like pattern on the microarray chip, the chip was placed in a vacuum to dry for 20 min. After this, the slide was put under oil (perfluorodecalin, Fluka, Buchs, Switzerland) and enzyme solution was spotted to distinct spots as described below. Human serum IgM, LC solvents and 2,5-dihydroxy benzoic acid (DHB) MALDI matrix were obtained from Sigma Aldrich (Buchs, Switzerland). The best signal for glycopeptides in positive mode was obtained by using a 10 mg/ml DHB matrix solution in 50:50 acetonitrile/water containing 0.75% phosphoric acid.
Reference Measurements Using nLC-ESI-MS
For LC-ESI-MS reference experiments, the same nano-LC from the droplet-spotting device was connected to a SYNAPT G2 mass spectrometer (Waters, Manchester, UK) using a nano-flow interface with TaperTip emitters (50 ± 5 μm, New Objective). The analysis was performed using the same gradient as for the nanoLC-MALDI-MS experiment. Acquisition was performed in “sensitivity mode” at a scan rate of 1 Hz over the mass range of m/z = 500 to 2000. Glycopeptides were enriched using a ZIC®-HILC solid phase extraction cartridge (SeQuant, Sweden), following the protocol from Parker et al. (49). Briefly, samples were diluted in 80% acetonitrile containing 0.1% trifluoroacetic acid, loaded to a ZIC-HILIC SPE column (SeQuant, Sweden, 1 ml bed size), washed with 500 μl 80% acetonitrile and eluted with 350 μl of H2O, and were finally speed vac dried. An aliquot was additionally deglycosylated using PNGaseF. In consecutive LC runs, the deglycosylated sample, the control sample and a mixture of both was analyzed. For each run, a glycopeptide extract starting from ∼2.5 μg IgM digestion was injected to the LC system. Identification of the glycopeptides was realized by searching for the expected glycopeptide pattern, eluting slightly before the deglycosylated peptide counterpart as described in Pabst et al. 2012. (35) Enrichment of the glycopeptide fractions was found to be beneficial for an unambiguous assignment of the peaks.
On-chip PNGaseF Digest
On-chip PNGaseF digest was carried out with the assistance of droplet microfluidics directly on the microarray chip as described in Küster et al. 2014 (59). The under-oil reaction employs a perfluorinated oil bath in which aqueous liquids can be spotted under oil on the chip predefined spots using a droplet spotting device as described in Küster et al. (59). In this work, PNGaseF (Roche Diagnostics, Mannheim, Germany) was dissolved in 100 μl H2O and 8 μl of it was further diluted in 200 μl of 10 mm ammonia bicarbonate solution containing 10% acetonitrile and 0.5 μM fluorescein. An aliquot of approx. 3 nanoliter was added to each micro-spot with the under-oil spotting technique. Carry-over of enzyme solution to adjacent spots was found to be minimal. The slide was incubated at room temperature for ∼60 min and the oil was finally decanted and residual liquid was evaporated under vacuum (p ≈ 1 mbar) for 15 min. In a final step, a 2,5-DHB matrix solution was applied to each spot using the same droplet spotter. Spotting for enzyme or for matrix application required 20–30 minutes. DHB with 0.75% phosphoric acid generated homogeneous fine crystals for a reproducible and sensitive detection of the glycopeptides. This was true for both employed MALDI-MS instruments using positive ion mode (AB5800, Bruker solariX).
MS Analysis Using MALDI-TOF/TOF, MALDI-FTMS, and ESI-Q/TOF-MS
MALDI-MS analysis was carried out by analyzing the treated spots first with an AB Sciex TOF/TOF 5800 mass spectrometer (AB Sciex, Darmstadt, Germany; analyzing the whole treated trace required ∼20 min.) and subsequently by using a MALDI-FTMS instrument (SolariX Bruker, Bremen, Germany) for a detailed glycopeptide characterization. Microarrays were mounted onto an AB Sciex sample target carrier using the mask delivered with the LaserBio Labs™ Mass Spectrometry Imaging Starter Kit. For the Bruker solariX FTMS instrument, we used the MTP slide adapter II. Spot set templates for the AB Sciex 5800 and geometry files for the SolariX were programmed in house. For the AB Sciex 5800 MALDI-TOF-MS instrument, the laser energy was set to 4950 (arbitrary units), and 23 sub-spectra on 25 different positions were acquired per spot. Spectra were acquired over a mass range from 500–3000 Da. MALDI-FTMS analysis was performed over the mass range of 1000–5000 Da and a defocused “smart beam” laser (100 μm diameter) was used at 60% laser energy (arbitrary units). The total ion chromatogram and extracted ion chromatograms obtained from the AB Sciex MALDI-MS measurements were analyzed using the DataAnalysis tool within the TOF/TOF series Explorer software and with Microsoft Excel. Mass spectra from the MALDI-FTMS instrument were analyzed and annotated with the Compass Data Analysis 4.0 software (Bruker).
Glycopeptide Mining and Analysis
The location of the deglycosylated peptides on the microarray slide was first identified by extracting the ion traces of the masses for the deglycosylated peptides from an initial MALDI-TOF-MS scan. The sequence as well as potential N-glycosylation sites for the human Ig mu chain were obtained from Kehry et al. (68) as well as from the UniprotKB database (IGHM_HUMAN (P01871) and IGJ_HUMAN (P01591)). Spectra from the adjacent untreated spots of the identified areas were then acquired as control, to proof absence of the deglycosylated peptides. Identified regions were then further analyzed using MALDI-FTMS. Mass lists were exported to Microsoft Excel and further evaluated using the glycoMod tool (http://web.expasy.org/glycomod/) (69) by allowing a maximum mass deviation of 0.025 Da for mainly present [M+H]+ ions. Larger deviations were just accepted after manual investigation for peaks of lower intensity, which is also indicated in Table II. (Glycomod structural parameters = Hexose range 0–9, HexNAc range 2–6, deoxyhexose range 0–2, NeuAc range 0–4, NeuGc no, Pentose no, Sulfate/Phosphate no, KDN no, HexA no, UniCarbKB entries were listed separately). Furthermore, results from the previous work of Arnold et al. were used if a decision between potentially possible isobaric compositions had to be made.
Table II. Identified glycopeptide peaks and corresponding glycan compositions obtained by analyzing the peak lists from the FTMS spectra with GlycoMod tool (mass deviations were averaged over acquired spectra). An absolute mass deviation below or equal 0.025 Da (in average if the structure was identified in more than one spectrum) was set as limit. (Greater deviations were accepted for some lower intense peaks whose corresponding spectra were further investigated manually).
| Nr. | Asn | Glycopep. [M+H]+ calculated | Deviation ppm (av) | Deviation Da (av) | Glycan (mi) calc. | Composition | Type | Peptide (mi) calc | Sequence |
|---|---|---|---|---|---|---|---|---|---|
| calc. | |||||||||
| 1 | 171 | 3838.5280 | −0.8 | −0.003 | 2553.91 | (Hex)2 (HexNAc)3 (Deoxyhexose)1 (NeuAc)2 + (Man)3(GlcNAc)2 | Complex | 1283.61 | YKNNSDISSTR (1 missed cleavage) |
| 2 | 171 | 3635.4480 | −2.2 | −0.008 | 2350.83 | (Hex)2 (HexNAc)2 (Deoxyhexose)1 (NeuAc)2 + (Man)3(GlcNAc)2 | Complex | 1283.61 | YKNNSDISSTR (1 missed cleavage) |
| 3 | 171 | 3547.4320 | 0.0 | 0.000 | 2262.81 | (Hex)2 (HexNAc)3 (Deoxyhexose)1 (NeuAc)1 + (Man)3(GlcNAc)2 | Complex | 1283.61 | YKNNSDISSTR (1 missed cleavage) |
| 4 | 171 | 3401.3740 | −6.8 | −0.023 | 2116.76 | (Hex)2 (HexNAc)3 (NeuAc)1 + (Man)3(GlcNAc)2 | Complex | 1283.61 | YKNNSDISSTR (1 missed cleavage) |
| 5 | 171 | 3344.3530 | 0.3 | 0.001 | 2059.74 | (Hex)2 (HexNAc)2 (Deoxyhexose)1 (NeuAc)1 + (Man)3(GlcNAc)2 | Complex | 1283.61 | YKNNSDISSTR (1 missed cleavage) |
| 6 | 171 | 3198.2950 | −1.3 | −0.004 | 1913.68 | (Hex)2 (HexNAc)2 (NeuAc)1 + (Man)3(GlcNAc)2 | Complex | 1283.61 | YKNNSDISSTR (1 missed cleavage) |
| 7 | 171 | 3256.3370 | −7.7 | −0.025 | 1971.72 | (Hex)2 (HexNAc)3 (Deoxyhexose)1 + (Man)3(GlcNAc)2 | Complex | 1283.61 | YKNNSDISSTR (1 missed cleavage) |
| 8 | 171 | 3053.2580 | −4.9 | −0.015 | 1768.64 | (Hex)2 (HexNAc)2 (Deoxyhexose)1 + (Man)3(GlcNAc)2 | Complex | 1283.61 | YKNNSDISSTR (1 missed cleavage) |
| 9 | 171 | 2907.137 | −20.0 | >0.025 | 1913.68 | (Hex)2 (HexNAc)2 + (Man)3(GlcNAc)2 | Complex | 1283.61 | YKNNSDISSTR (1 missed cleavage) |
| 10 | 171 | 3303.326 | 5.8 | 0.019 | 2018.71 | (Hex)3 (HexNAc)1 (Deoxyhexose)1 (NeuAc)1 + (Man)3(GlcNAc)2 | Hybrid | 1283.61 | YKNNSDISSTR (1 missed cleavage) |
| 11 | 171 | 3141.2740 | 2.2 | 0.007 | 1856.66 | (Hex)2 (HexNAc)1 (Deoxyhexose)1 (NeuAc)1 + (Man)3(GlcNAc)2 | Hybrid | 1283.61 | YKNNSDISSTR (1 missed cleavage) |
| 12 | 171 | 2979.2210 | −0.3 | −0.001 | 1694.60 | (Hex)1 (HexNAc)1 (Deoxyhexose)1 (NeuAc)1 + (Man)3(GlcNAc)2 | Hybrid/complex | 1283.61 | YKNNSDISSTR (1 missed cleavage) |
| 13 | 171 | 3012.2310 | −3.3 | −0.010 | 1727.61 | (Hex)3 (HexNAc)1 (Deoxyhexose)1 + (Man)3(GlcNAc)2 | Hybrid | 1283.61 | YKNNSDISSTR (1 missed cleavage) |
| 14 | 171 | 2850.1780 | 9.5 | >0.025 | 1565.56 | (Hex)2 (HexNAc)1 (Deoxyhexose)1 + (Man)3(GlcNAc)2 | Hybrid | 1283.61 | YKNNSDISSTR (1 missed cleavage) |
| 15 | 171 | 2688.1250 | −1.1 | −0.003 | 1403.51 | (Hex)1 (HexNAc)1 (Deoxyhexose)1 + (Man)3(GlcNAc)2 | Hybrid/complex | 1283.61 | YKNNSDISSTR (1 missed cleavage) |
| 16 | 171 | 2501.0410 | 1.6 | 0.004 | 1216.42 | (Hex)2 + (Man)3(GlcNAc)2 | Oligomannosidic | 1283.61 | YKNNSDISSTR (1 missed cleavage) |
| 17 | 171 | 2663.0940 | −4.1 | −0.011 | 1378.48 | (Hex)3 + (Man)3(GlcNAc)2 | Oligomannosidic | 1283.61 | YKNNSDISSTR (1 missed cleavage) |
| 18 | 171 | 3547.3690 | 19.7 | >0.025 | 2553.91 | (Hex)2 (HexNAc)3 (Deoxyhexose)1 (NeuAc)2 + (Man)3(GlcNAc)2 | Complex | 992.45 | NNSDISSTR |
| 19 | 171 | 3344.2890 | 19.7 | >0.025 | 2350.83 | (Hex)2 (HexNAc)2 (Deoxyhexose)1 (NeuAc)2 + (Man)3(GlcNAc)2 | Complex | 992.45 | NNSDISSTR |
| 20 | 171 | 3256.3370 | 10.0 | >0.025 | 2262.81 | (Hex)2 (HexNAc)3 (Deoxyhexose)1 (NeuAc)1 + (Man)3(GlcNAc)2 | Complex | 992.45 | NNSDISSTR |
| 21 | 171 | 3110.216 | 10.1 | >0.025 | 2262.81 | (Hex)2 (HexNAc)3 (Deoxyhexose)1 (NeuAc)1 + (Man)3(GlcNAc)2 | Complex | 992.45 | NNSDISSTR |
| 22 | 171 | 3053.195 | 9.8 | >0.025 | 2059.74 | (Hex)2 (HexNAc)2 (Deoxyhexose)1 (NeuAc)1 + (Man)3(GlcNAc)2 | Complex | 992.45 | NNSDISSTR |
| 23 | 171 | 2907.137 | 1.4 | 0.004 | 1913.68 | (Hex)2 (HexNAc)2 (NeuAc)1 + (Man)3(GlcNAc)2 | Complex | 992.45 | NNSDISSTR |
| 24 | 171 | 2762.1 | 2.0 | 0.006 | 1768.64 | (Hex)2 (HexNAc)2 (Deoxyhexose)1 + (Man)3(GlcNAc)2 | Complex | 992.45 | NNSDISSTR |
| 25 | 171 | 2616.042 | −5.0 | −0.013 | 1622.58 | (Hex)2 (HexNAc)2 + (Man)3(GlcNAc)2 | Complex | 992.45 | NNSDISSTR |
| 26 | 171 | 2371.936 | −6.3 | −0.015 | 1378.48 | (Hex)3 + (Man)3(GlcNAc)2 | Oligomannosidic | 992.45 | NNSDISSTR |
| 27 | 171 | 2209.883 | −9.5 | −0.021 | 1216.42 | (Hex)2 + (Man)3(GlcNAc)2 | Oligomannosidic | 992.45 | NNSDISSTR |
| 28 | 395 | 3355.283 | −1.4 | −0.005 | 2553.91 | (Hex)2 (HexNAc)3 (Deoxyhexose)1 (NeuAc)2 + (Man)3(GlcNAc)2 | Complex | 800.37 | THTNISE |
| 29 | 395 | 3152.203 | −0.6 | −0.007 | 2350.83 | (Hex)2 (HexNAc)2 (Deoxyhexose)1 (NeuAc)2 + (Man)3(GlcNAc)2 | Complex | 800.37 | THTNISE |
| 30 | 395 | 3064.188 | −1.3 | −0.005 | 2262.814 | (Hex)2 (HexNAc)3 (Deoxyhexose)1 (NeuAc)1 + (Man)3(GlcNAc)2 | Complex | 800.37 | THTNISE |
| 31 | 395 | 3209.226 | −0.5 | −0.003 | 2407.852 | (Hex)2 (HexNAc)3 (NeuAc)2 + (Man)3(GlcNAc)2 | Complex | 800.37 | THTNISE |
| 32 | 395 | 2699.056 | −0.9 | −0.004 | 1897.682 | (Hex)1 (HexNAc)2 (Deoxyhexose)1 (NeuAc)1 + (Man)3(GlcNAc)2 | Complex | 800.37 | THTNISE |
| 33 | 395 | 2861.109 | −1.7 | −0.006 | 2059.735 | (Hex)2 (HexNAc)2 (Deoxyhexose)1 (NeuAc)1 + (Man)3(GlcNAc)2 | Complex | 800.37 | THTNISE |
| 34 | 395 | 2918.13 | −2.5 | −0.009 | 2116.756 | (Hex)2 (HexNAc)3 (NeuAc)1 + (Man)3(GlcNAc)2 | Complex | 800.37 | THTNISE |
| 35 | 395 | 2902.136 | −0.9 | −0.008 | 2100.762 | (Hex)1 (HexNAc)3 (Deoxyhexose)1 (NeuAc)1 + (Man)3(GlcNAc)2 | Complex | 800.37 | THTNISE |
| 36 | 402 | 2270.929 | −1.8 | −0.004 | 1054.37 | (Hex)4 (HexNAc)2 | Paucimannosidic | 1215.55 | SHPNATFSAVGE |
| 37 | 402 | 2432.982 | −0.4 | −0.001 | 1216.423 | (Hex)2 + (Man)3(GlcNAc)2 | Oligomannosidic | 1215.55 | SHPNATFSAVGE |
| 38 | 402 | 2595.035 | 0.0 | 0.000 | 1378.476 | (Hex)3 + (Man)3(GlcNAc)2 | Oligomannosidic | 1215.55 | SHPNATFSAVGE |
| 39 | 402 | 2757.087 | −0.7 | −0.002 | 1540.528 | (Hex)4 + (Man)3(GlcNAc)2 | Oligomannosidic | 1215.55 | SHPNATFSAVGE |
| 40 | 402 | 2919.14 | −0.7 | −0.002 | 1702.581 | (Hex)5 + (Man)3(GlcNAc)2 | Oligomannosidic | 1215.55 | SHPNATFSAVGE |
| 41 | 402 | 3081.193 | −2.6 | −0.008 | 1864.634 | (Hex)6 + (Man)3(GlcNAc)2 | Oligomannosidic | 1215.55 | SHPNATFSAVGE |
| 42 | 402 | 2311.956 | −0.9 | −0.002 | 1095.397 | (HexNAc)1 + (Man)3(GlcNAc)2 | Hybrid/complex | 1215.55 | SHPNATFSAVGE |
| 43 | 402 | 2474.008 | −4.9 | −0.012 | 1257.449 | (Hex)1 (HexNAc)1 + (Man)3(GlcNAc)2 | Hybrid/complex | 1215.55 | SHPNATFSAVGE |
| 44 | 402 | 2636.061 | −2.3 | −0.006 | 1419.502 | (Hex)2 (HexNAc)1 + (Man)3(GlcNAc)2 | Hybrid/complex | 1215.55 | SHPNATFSAVGE |
| 45 | 402 | 2798.114 | −3.2 | −0.009 | 1581.555 | (Hex)3 (HexNAc)1 + (Man)3(GlcNAc)2 | Hybrid | 1215.55 | SHPNATFSAVGE |
| 46 | 332 | 4908.98 | ∼75 | >0.025 | 2553.91 | (Hex)2 (HexNAc)3 (Deoxyhexose)1 (NeuAc)2 + (Man)3(GlcNAc)2 | Complex | 2354.06 | GLTFQQNASSM(SO)CVPDQDTAIR |
| 47 | 332 | 4705.9 | −8.0 | >0.025 | 2350.83 | (Hex)2 (HexNAc)2 (Deoxyhexose)1 (NeuAc)2 + (Man)3(GlcNAc)2 | Complex | 2354.06 | GLTFQQNASSM(SO)CVPDQDTAIR |
| 48 | 332 | 4617.884 | 0.9 | 0.004 | 2262.814 | (Hex)2 (HexNAc)3 (Deoxyhexose)1 (NeuAc)1 + (Man)3(GlcNAc)2 | Complex | 2354.06 | GLTFQQNASSM(SO)CVPDQDTAIR |
| 49 | 332 | 4471.826 | 0.0 | 0.000 | 2116.756 | (Hex)2 (HexNAc)3 (NeuAc)1 + (Man)3(GlcNAc)2 | Complex | 2354.06 | GLTFQQNASSM(SO)CVPDQDTAIR |
| 50 | 332 | 4455.832 | 4.0 | 0.018 | 2100.762 | (Hex)1 (HexNAc)3 (Deoxyhexose)1 (NeuAc)1 + (Man)3(GlcNAc)2 | Complex | 2354.06 | GLTFQQNASSM(SO)CVPDQDTAIR |
| 51 | 332 | 4414.805 | 4.3 | 0.019 | 2059.735 | (Hex)2 (HexNAc)2 (Deoxyhexose)1 (NeuAc)1 + (Man)3(GlcNAc)2 | Complex | 2354.06 | GLTFQQNASSM(SO)CVPDQDTAIR |
| 52 | 332 | 4326.789 | 3.7 | 0.016 | 1971.719 | (Hex)2 (HexNAc)3 (Deoxyhexose)1 + (Man)3(GlcNAc)2 | Complex | 2354.06 | GLTFQQNASSM(SO)CVPDQDTAIR |
| 53 | 332 | 4268.747 | 3.7 | 0.016 | 1913.677 | (Hex)2 (HexNAc)2 (NeuAc)1 + (Man)3(GlcNAc)2 | Complex | 2354.06 | GLTFQQNASSM(SO)CVPDQDTAIR |
| 54 | 332 | 4123.71 | 2.2 | 0.009 | 1768.64 | (Hex)2 (HexNAc)2 (Deoxyhexose)1 + (Man)3(GlcNAc)2 | Complex | 2354.06 | GLTFQQNASSM(SO)CVPDQDTAIR |
| 55 | 332 | 4430.8 | 4.3 | 0.019 | 2075.73 | (Hex)3 (HexNAc)2 (NeuAc)1 + (Man)3(GlcNAc)2 | Hybrid | 2354.06 | GLTFQQNASSM(SO)CVPDQDTAIR |
| 56 | 332 | 4164.736 | 3.8 | 0.016 | 1809.666 | (Hex)1 (HexNAc)3 (Deoxyhexose)1 + (Man)3(GlcNAc)2 | Complex | 2354.06 | GLTFQQNASSM(SO)CVPDQDTAIR |
| 57 | 332 | 4892.982 | ∼50 | >0.025 | 2553.91 | (Hex)2 (HexNAc)3 (Deoxyhexose)1 (NeuAc)2 + (Man)3(GlcNAc)2 | Complex | 2338.07 | GLTFQQNASSMCVPDQDTAIR |
| 58 | 332 | 4689.905 | −1.5 | −0.007 | 2350.83 | (Hex)2 (HexNAc)2 (Deoxyhexose)1 (NeuAc)2 + (Man)3(GlcNAc)2 | Complex | 2338.07 | GLTFQQNASSMCVPDQDTAIR |
| 59 | 332 | 4601.889 | 3.5 | 0.016 | 2262.814 | (Hex)2 (HexNAc)3 (Deoxyhexose)1 (NeuAc)1 + (Man)3(GlcNAc)2 | Complex | 2338.07 | GLTFQQNASSMCVPDQDTAIR |
| 60 | 332 | 4455.831 | 4.0 | 0.018 | 2116.756 | (Hex)2 (HexNAc)3 (NeuAc)1 + (Man)3(GlcNAc)2 | Complex | 2338.07 | GLTFQQNASSMCVPDQDTAIR |
| 61 | 332 | 4439.837 | 4.1 | 0.018 | 2100.762 | (Hex)1 (HexNAc)3 (Deoxyhexose)1 (NeuAc)1 + (Man)3(GlcNAc)2 | Complex | 2338.07 | GLTFQQNASSMCVPDQDTAIR |
| 62 | 332 | 4398.81 | 4.1 | 0.018 | 2059.735 | (Hex)2 (HexNAc)2 (Deoxyhexose)1 (NeuAc)1 + (Man)3(GlcNAc)2 | Complex | 2338.07 | GLTFQQNASSMCVPDQDTAIR |
| 63 | 332 | 4310.794 | 3.0 | 0.013 | 1971.719 | (Hex)2 (HexNAc)3 (Deoxyhexose)1 + (Man)3(GlcNAc)2 | Complex | 2338.07 | GLTFQQNASSMCVPDQDTAIR |
| 64 | 332 | 4252.752 | 6.6 | >0.025 | 1913.677 | (Hex)2 (HexNAc)2 (NeuAc)1 + (Man)3(GlcNAc)2 | Complex | 2338.07 | GLTFQQNASSMCVPDQDTAIR |
| 65 | 332 | 4107.715 | 6.6 | −0.002 | 1768.64 | (Hex)2 (HexNAc)2 (Deoxyhexose)1 + (Man)3(GlcNAc)2 | Complex | 2338.07 | GLTFQQNASSMCVPDQDTAIR |
| 66 | 332 | 4414.805 | 4.3 | 0.019 | 2075.73 | (Hex)3 (HexNAc)2 (NeuAc)1 + (Man)3(GlcNAc)2 | Hybrid | 2338.07 | GLTFQQNASSMCVPDQDTAIR |
| 67 | 332 | 4148.741 | 1.9 | 0.008 | 1809.666 | (Hex)1 (HexNAc)3 (Deoxyhexose)1 + (Man)3(GlcNAc)2 | Complex | 2338.07 | GLTFQQNASSMCVPDQDTAIR |
| 68 | 563 | 3435.47 | 5.5 | 0.019 | 1054.37 | (Hex)4 (HexNAc)2 | Paucimannosidic | 2380.09 | STGKPTLYNVSLV(MSO)SDTAGTCY |
| 69 | 563 | 3597.523 | 3.3 | 0.012 | 1216.423 | (Hex)2 + (Man)3(GlcNAc)2 | Oligomannosidic | 2380.09 | STGKPTLYNVSLV(MSO)SDTAGTCY |
| 70 | 563 | 3759.576 | 2.9 | 0.011 | 1378.476 | (Hex)3 + (Man)3(GlcNAc)2 | Oligomannosidic | 2380.09 | STGKPTLYNVSLV(MSO)SDTAGTCY |
| 71 | 563 | 3921.628 | 2.3 | 0.009 | 1540.528 | (Hex)4 + (Man)3(GlcNAc)2 | Oligomannosidic | 2380.09 | STGKPTLYNVSLV(MSO)SDTAGTCY |
| 72 | 563 | 4083.681 | 2.2 | 0.009 | 1702.581 | (Hex)5 + (Man)3(GlcNAc)2 | Oligomannosidic | 2380.09 | STGKPTLYNVSLV(MSO)SDTAGTCY |
| 73 | 563 | 4245.734 | 5.9 | 0.025 | 1864.634 | (Hex)6 + (Man)3(GlcNAc)2 | Oligomannosidic | 2380.09 | STGKPTLYNVSLV(MSO)SDTAGTCY |
| 74 | 71 (J-chain) | 3142.294 | 0.8 | 0.003 | 1913.677 | (Hex)2 (HexNAc)2 (NeuAc)1 + (Man)3(GlcNAc)2 | Complex | 1227.61 | ENISDPTSPLR |
| 75 | 71 (J-chain) | 3288.352 | −0.3 | −0.001 | 2059.735 | (Hex)2 (HexNAc)2 (Deoxyhexose)1 (NeuAc)1 + (Man)3(GlcNAc)2 | Complex | 1227.61 | ENISDPTSPLR |
| 76 | 71 (J-chain) | 3345.373 | 2.4 | 0.008 | 2116.756 | (Hex)2 (HexNAc)3 (NeuAc)1 + (Man)3(GlcNAc)2 | Complex | 1227.61 | ENISDPTSPLR |
| 77 | 71 (J-chain) | 2851.199 | 2.5 | 0.007 | 1622.582 | (Hex)2 (HexNAc)2 + (Man)3(GlcNAc)2 | Complex | 1227.61 | ENISDPTSPLR |
| 78 | 71 (J-chain) | 3491.431 | 0.7 | 0.002 | 2262.814 | (Hex)2 (HexNAc)3 (Deoxyhexose)1 (NeuAc)1 + (Man)3(GlcNAc)2 | Complex | 1227.61 | ENISDPTSPLR |
| 79 | 71 (J-chain) | 2997.257 | −1.6 | −0.005 | 1768.64 | (Hex)2 (HexNAc)2 (Deoxyhexose)1 + (Man)3(GlcNAc)2 | Complex | 1227.61 | ENISDPTSPLR |
| 80 | 71 (J-chain) | 3054.278 | 0.5 | 0.002 | 1825.661 | (Hex)2 (HexNAc)3 + (Man)3(GlcNAc)2 | Complex | 1227.61 | ENISDPTSPLR |
| 81 | 71 (J-chain) | 3200.34 | −2.2 | −0.007 | 1826.661 | (Hex)2 (HexNAc)3 (Deoxyhexose)1 + (Man)3(GlcNAc)2 | Complex | 1227.61 | ENISDPTSPLR |
RESULTS
The potential glycosites from IgM are listed in Table I. After an in-solution trypsin/GluC digest of human polyclonal IgM, an aliquot of 750 ng was injected to the LC system without prior glycopeptide enrichment. Separation was carried out within a short 15-min gradient as described in the experimental procedures section. As shown in the workflow graph (Fig. 1 and Fig. 2), the nano-LC separation was fractionated at a rate of 1 Hz onto the microarray substrate. As described in the experimental procedures section, a PNGaseF digestion of every other peak was carried out under a protecting oil phase, with the aim to generate two traces on the chip: one PNGaseF-treated trace with deglycosylated peptides and free glycans and an untreated trace containing still the intact glycopeptides (Fig. 1). Peptides that are not N-glycosylated are not affected by this treatment and are therefore found in both traces.
Table I. N-glycosylation sites from IGHM_human (P01871) and IGJ_human (P01591). The glycopeptides from the glycosylation site Asn 171 was predominantly detected with one missed trypsin cleavage and glycopeptides from Asn 563 / Asn 332 were found by a majority oxidized, presumably on methionine. In-silico protein digestion and theoretical mass calculation was performed using PeptideMass tool on ExPASy (http://web.expasy.org/peptide_mass/). The observed masses from the initial screening were obtained on a low resolution MALDI-TOF-MS and identification was based on appearance in the treated spots. Mass errors for identified glycopeptides are shown in Table II.
| Peptide | Calculated | Observed | ||||
|---|---|---|---|---|---|---|
| Asn (mu chain) | (Trypsin/GluC) | MC | [M+H]+ | MSO | (Delta Da) | Glycoform |
| 171 | YKNNSDISSTR | 1 | 1285.6 | x | −0.23 | Complex (hybrid, oligomannosidic) |
| 171 | NNSDISSTR | 0 | 994.44 | x | x | Complex (hybrid, oligomannosidic) |
| 332 | GLTFQQNASSMCVPDQDTAIR | 0 | 2340.05 | Detected | −0.39 | Complex (hybrid) |
| 395 | THTNISE | 0 | 802.35 | x | −0.12 | Complex |
| 402 | SHPNATFSAVGE | 0 | 1217.54 | x | −0.2 | Oligomannosidic (hybrid) |
| 563 | STGKPTLYNVSLVMSDTAGTCY | 0 | 2366.08 | Detected | −0.41 | Oligomannosidic |
| Asn (J chain) | Peptide (Trypsin/GluC) | MC | [M+H]+ | MSO | (Delta Da) | Glycoform |
| 71 | ENISDPTSPLR | 0 | 1229.6 | x | −0.21 | Complex |
Fig. 2.
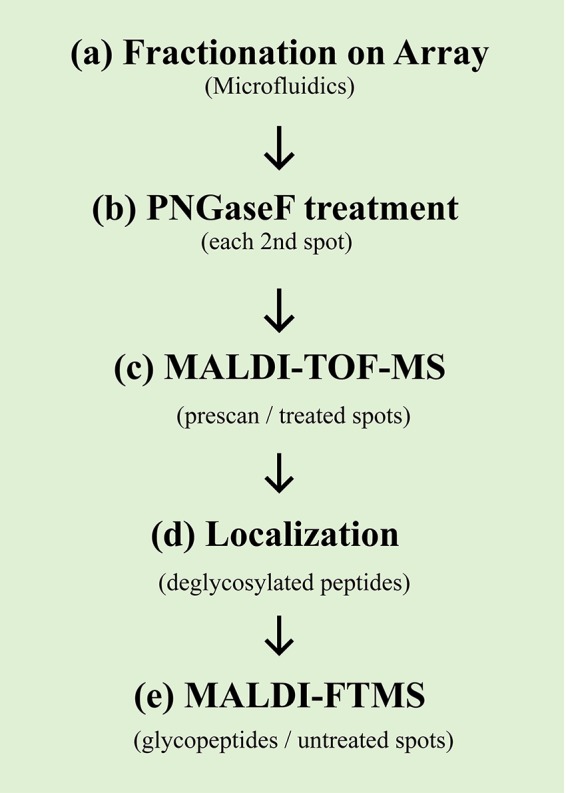
Workflow for the site-specific glycosylation analysis as used for IgM (a-e). After fractionation of the eluent from the nano-LC separation (a), a specific portion of the collected fractions (every other spot) was digested using PNGaseF (b). Subsequently, a first low-resolution MALDI-TOF-MS scan in the lower mass range of the PNGaseF-treated spots was performed (c). After the localization of the deglycosylated peptides in the initial data set (d), a high-resolution MALDI-FTMS scan (at a high mass range) was performed solely on the selected untreated spots.
Data Mining and Analysis of the Glycosylation Sites from Human Serum IgM
By extracting ion traces for the masses of the potential deglycosylated peptides, we were able to identify the position of the deglycosylated peptides within the treated trace on the microarray slide. The adjacent spots were further investigated to proof the absence of the same peaks. In order to facilitate a detailed analysis of the glycopeptide clusters, we finally analyzed the untreated spots of the identified areas with a MALDI-FTMS instrument (Bruker solariX). This straightforward and systematic approach allowed the analysis of IgM site-specific glycosylation within one single LC run. Data evaluation was performed using glycoMod Tool (69), by allowing a maximum mass deviation of 0.025 Da in average for the individual structures. The investigated and detected glycosites are indicated in the BPI chromatogram in Fig. 3 and were also summarized in Table I. Adjacent untreated spots are supposed to be absent of the deglycosylated peptides, as it is shown for Asn 332 in Fig. 4 (more detailed also in supplemental Fig. S3). A complete list of identified glycopeptides including the proposed glycan composition can be found in Table II. A representative MALDI-FTMS spectrum of each glycosite is shown in Fig. 5. Taking into account that MALDI-MS is more prone to in source fragmentation of labile sugar residues like sialic acids, the here presented method was not primary evaluated for exact quantification of the glycoforms, but provides more a fast and complete identification of a site specific glycan profile. Nevertheless, profiles were found very similar as obtained by RP-ESI-MS, presumably a result of the low post source fragmentation in the FTMS instrument.
Fig. 3.
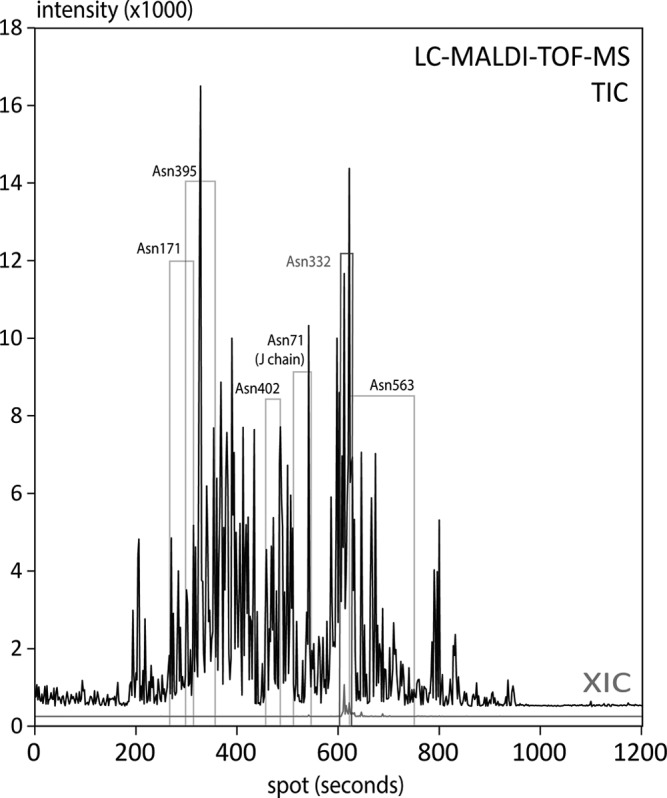
Upper trace: TIC of the treated spots (each 2nd spot on the chip) generated by the lower-resolution scan using a MALDI-TOF-MS instrument. The elution areas of the deglycosylated peptides from individual sites are indicated with boxes, which were identified by the appearance of the deglycosylated peptide after PNGaseF treatment. The glycopeptide for Asn 563 provided a broad tailing peak (broad box). Lower trace (red): Example for an extracted ion chromatogram (XIC) from the treated spots, as shown for the deglycosylated peptide from glycosite Asn 332 ([M+H+]+ = 2340 Da).
Fig. 4.

The two panels show the MALDI-TOF-MS spectra from two adjacent spots (n and n+1 s). In the treated spot at Nr 608 (= spot n), the deglycosylated peptide of Asn 332 can be detected. This peak is absent in the consecutive spot Nr 609 (= spot n+1), which is untreated. The untreated spots contain the intact glycopeptides and were further analyzed with a high resolution MALDI-FTMS instrument (Fig. 5, and supplemental Fig. S3). (All peaks are labeled with monoisotopic masses).
Fig. 5.

MALDI-FTMS spectra representative for each glycosite of the IgM mu chain as well as of the J-chain. Peaks were labeled with monoisotopic masses [M+H+]+. A direct comparison with the ESI-MS reference measurements is presented in the electronic supplemental information (supplemental Fig. S2A–S2F).
Glycopeptides for Asn 563 and Asn 332 show an almost equal portion of methionine oxidation. The glycopeptide for the glycosite Asn 171 was mainly detected with one missed trypsin cleavage. A glycan sub-group distribution graph was evaluated by considering the most intense spectra from each site, which is provided in supplemental Fig. S1. Furthermore, we compared the identified profiles, which were obtained by employing reversed-phase (RP) ESI-MS (35, 70). Here, the data-mining process was assisted by knowledge gained from the MALDI-MS analysis and by the present literature (13, 62, 64). Representative (deconvoluted) spectra for both methods, RP-ESI-MS and RP-microarray-MALDI-FTMS, revealed very similar profiles for all glycosites (supplemental information figures 2a-f). This was rather surprising, because a recent inter laboratory study by Leymarie et al., revealed for the common approaches used in glycoproteomics rather strong deviations in their quantitative as well as qualitative results between different laboratories (71).
Mining for Glycopeptides by Means of a Pairwise Peak-list Comparison
The method furthermore offers the option of a pairwise peak lists comparison between treated and untreated spots, where the appearance of a peptide in the treated spot indicates a deglycosylated peptide. There is an intrinsic correlation between the two different traces, that is, the presence of a deglycosylated peptide in one spot n assures the presence of the intact glycopeptide cluster in spot n-1 or n+1. If the peptide mass is obtained from the digested peak, the glycan composition can then be identified by using a prediction software like the GlycoMod tool (69), as well as by fragmentation experiments performed on the intact glycopeptides. The peptide sequence can then be also more easily obtained by sequencing the deglycosylated peptide in the treated trace, instead of gathering sequence tags from the fragmentation of the intact glycopeptide.
Human Serum IgM Site-specific Glycosylation Profile
Here, we provide the first complete and detailed site-specific mass spectrometric analysis of the glycosylation of the human serum IgM using a high-resolution and high mass accuracy MALDI-MS instrument. Initial work published by Chapman and Kornfeld in 1979 was based on the preparative fractionation of glycopeptides, amino acid analysis by liquid chromatography, and monosaccharide analysis by gas-liquid chromatography (62, 63). The authors describe Man5 and Man6 on Asn 402 and Man6 and Man8 on Asn 563. A recent study by Loos et al. using LC-ESI-MS assigned major glycoforms of the mu chain, which also confirmed the pioneering work of Chapman et al. (62, 63). The major glycoforms found here by the microarray-MALDI-FTMS approach were in agreement with the results obtained by the previous studies. In addition we could provide a comprehensive and a detailed analysis, assigning a total of 81 glycopeptide peaks to the IgM mu chain and to the J chain with highest mass accuracy (Table II). Thereby we detected some minor portions of oligomannosidic glycans as well as hybrid-type glycans, also on Asn 171. Glycosite Asn 563 carried exclusively oligomannosidic structures, but site Asn 402 exhibited ∼10% hybrid-type glycans. Glycosites Asn 395 and the J chain carried only complex type glycans with one or two sialic acid residues, bisecting GlcNAc and one fucose residue. Arnold et al. (64), demonstrated by exoglycosidase digests that the fucose residue present is a core fucosylation. The overall main glycoforms were biantennary fucosylated glycans, carrying one sialic acid with or without a bisecting GlcNAc. Taking into account that Asn 332, Asn 395 and the J chain carry complex-type glycans, the HPLC data are in good agreement with our data obtained by glycopeptide analysis. Furthermore, assuming that Asn 563 and Asn 402 are fully glycosylated, and that Asn 171 and Asn 332 contain minor amounts of oligomannosidic as well as hybrid-type glycans, there would be more oligomannosidic and hybrid type glycans present then estimated by the recent glycomics based study. A combination of the revealed structures further provides the potential targets for mannose-binding lectin (72), which is known to rely on multiple binding targets.
Summary
Using a droplet-microfluidic device a microarray chip and MALDI-FTMS, we were able to provide a first detailed site specific glycosylation profile for all glycosylation sites from human polyclonal IgM - requiring one single LC run. An on-chip PNGaseF digest of alternating one-second fractions from a nano-LC generated two traces: a PNGaseF-treated trace and an untreated trace. A correlation between separate approaches or analytical runs was not required because the digestion and the control were from one and the same chromatographic peak. In an initial MALDI-MS scan the location of the deglycosylated peptide on the chip was identified and further in a second round the intact glycopeptides were investigated in the neighbored untreated spots. Where the screening for the deglycosylated peptides was found straight with the TOF based MALDI-MS instrument, the very detailed and high resolution profiles of the high molecular weight complex type glycopeptides could be just obtained using the MALDI-FTMS instrument. Nevertheless, acquisition with both instruments were performed on the same analytical run stored on a single chip in the size of a microscope slide, demonstrating the further possibility to analyze more complex and heterogeneous samples by using longer gradients in combination with larger high density slides for storage and reaction. Overall, we assigned more than 80 glycopeptide peaks for all 5 glycosylation sites from IGHM and one from the J-chain with high mass accuracy.
Supplementary Material
Acknowledgments
We thank Alfredo J. Ibáñez, Robert Steinhoff, and Stephan Fagerer for helpful advices with our MALDI-MS measurements. Furthermore we thank Konstantins Jefimovs and Rolf Brönnimann from EMPA Dübendorf, Jens Boertz from Sigma-Aldrich, Rolf Häflinger and Dr. Xiangyang Zhang from the MS-Service for their assistance with the MALDI-FTMS system.
Footnotes
Author contributions: M.P., S.K.K., F.W., P.S.D., and R.Z. designed research; M.P., S.K.K., and J.K. performed research; M.P., S.K.K., F.W., P.S.D., and R.Z. contributed new reagents or analytic tools; M.P. and J.K. analyzed data; M.P., J.K., P.S.D., and R.Z. wrote the paper.
* This work was supported by the European Research Council (ERC Starting Grant nμLIPIDS, Grant No. 203428) and the Swiss KTI (Kommission für Technologie und Innovation; Grant No. 13123.1 PFNM-NM). Simon K. Küster acknowledges financial support from the scholarship fund of the Swiss Chemical Industry (SSCI).
 This article contains supplemental Figs. S1 to S3.
Conflicts of interest: MP, FW and RZ are developing a commercial product based on the microarray for mass spectrometry technology.
1 The abbreviations used are:
- ESI
- electrospray ionization
- MALDI
- matrix assisted laser desorption ionization
- FTMS
- Fourier transform MS
- RP-ESI-MS
- reverse phase-ESI-MS
- CID
- collision-induced dissociation
- TOF
- time-of-flight.
REFERENCES
- 1. Apweiler R., Hermjakob H., Sharon N. (1999) On the frequency of protein glycosylation, as deduced from analysis of the SWISS-PROT database. Biochim. Biophys. Acta 1473, 4–8 [DOI] [PubMed] [Google Scholar]
- 2. Lis H., Sharon N. (1993) Protein glycosylation. Structural and functional aspects. Eur. J. Biochem. 218, 1–27 [DOI] [PubMed] [Google Scholar]
- 3. Zaia J. (2011) At last, functional glycomics. Nat. Methods 8, 55–57 [DOI] [PubMed] [Google Scholar]
- 4. An H. J., Froehlich J. W., Lebrilla C. B. (2009) Determination of glycosylation sites and site-specific heterogeneity in glycoproteins. Curr. Opin. Chem. Biol. 13, 421–426 [DOI] [PMC free article] [PubMed] [Google Scholar]
- 5. Rudd P. M., Elliott T., Cresswell P., Wilson I. A., Dwek R. A. (2001) Glycosylation and the immune system. Science 291, 2370–2376 [DOI] [PubMed] [Google Scholar]
- 6. Zauner G., Selman M. H., Bondt A., Rombouts Y., Blank D., Deelder A. M., Wuhrer M. (2013) Glycoproteomic analysis of antibodies. Mol. Cell. Proteomics 12, 856–865 [DOI] [PMC free article] [PubMed] [Google Scholar]
- 7. Deshpande N., Jensen P. H., Packer N. H., Kolarich D. (2010) GlycoSpectrumScan: fishing glycopeptides from MS spectra of protease digests of human colostrum sIgA. J. Proteome Res. 9, 1063–1075 [DOI] [PubMed] [Google Scholar]
- 8. Plomp R., Hensbergen P. J., Rombouts Y., Zauner G., Dragan I., Koeleman C. A., Deelder A. M., Wuhrer M. (2013) Site-Specific N-Glycosylation Analysis of Human Immunoglobulin E. J. Proteome Res. 13, 536–546. [DOI] [PubMed] [Google Scholar]
- 9. Huang J., Guerrero A., Parker E., Strum J. S., Smilowitz J. T., German J. B., Lebrilla C. B. (2015) Site-Specific Glycosylation of Secretory Immunoglobulin A from Human Colostrum. J. Proteome Res. 13, 681–691 [DOI] [PMC free article] [PubMed] [Google Scholar]
- 10. Stadlmann J., Pabst M., Altmann F. (2010) Analytical and Functional Aspects of Antibody Sialylation. J. Clin. Immunol. 30, 15–19 [DOI] [PMC free article] [PubMed] [Google Scholar]
- 11. Mimura Y., Ashton P. R., Takahashi N., Harvey D. J., Jefferis R. (2007) Contrasting glycosylation profiles between Fab and Fc of a human IgG protein studied by electrospray ionization mass spectrometry. J. Immunol. Methods 326, 116–126 [DOI] [PubMed] [Google Scholar]
- 12. Horn M. P., Zuercher A. W., Imboden M. A., Rudolf M. P., Lazar H., Wu H., Hoiby N., Fas S. C., Lang A. B. (2010) Preclinical in vitro and in vivo characterization of the fully human monoclonal IgM antibody KBPA101 specific for Pseudomonas aeruginosa serotype IATS-O11. Antimicrob. Agents Chemother. 54, 2338–2344 [DOI] [PMC free article] [PubMed] [Google Scholar]
- 13. Loos A., Gruber C., Altmann F., Mehofer U., Hensel F., Grandits M., Oostenbrink C., Stadlmayr G., Furtmuller P. G., Steinkellner H. (2014) Expression and glycoengineering of functionally active heteromultimeric IgM in plants. Proc. Natl. Acad. Sci U.S.A. 111, 6263–6268. [DOI] [PMC free article] [PubMed] [Google Scholar]
- 14. Sola R. J., Griebenow K. (2010) Glycosylation of therapeutic proteins: an effective strategy to optimize efficacy. BioDrugs 24, 9–21 [DOI] [PMC free article] [PubMed] [Google Scholar]
- 15. Pabst M., Wu S. Q., Grass J., Kolb A., Chiari C., Viernstein H., Unger F. M., Altmann F., Toegel S. (2010) IL-1beta and TNF-alpha alter the glycophenotype of primary human chondrocytes in vitro. Carbohydr. Res. 345, 1389–1393 [DOI] [PubMed] [Google Scholar]
- 16. Toegel S., Pabst M., Wu S. Q., Grass J., Goldring M. B., Chiari C., Kolb A., Altmann F., Viernstein H., Unger F. M. (2010) Phenotype-related differential alpha-2,6- or alpha-2,3-sialylation of glycoprotein N-glycans in human chondrocytes. Osteoarthritis Cartilage 18, 240–248 [DOI] [PMC free article] [PubMed] [Google Scholar]
- 17. Ruhaak L. R., Uh H. W., Beekman M., Hokke C. H., Westendorp R. G., Houwing-Duistermaat J., Wuhrer M., Deelder A. M., Slagboom P. E. (2011) Plasma protein N-glycan profiles are associated with calendar age, familial longevity and health. J. Proteome Res. 10, 1667–1674 [DOI] [PubMed] [Google Scholar]
- 18. Pabst M., Altmann F. (2011) Glycan analysis by modern instrumental methods. Proteomics 11, 631–643 [DOI] [PubMed] [Google Scholar]
- 19. Geyer H., Geyer R. (2006) Strategies for analysis of glycoprotein glycosylation. Biochim. Biophys. Acta 1764, 1853–1869 [DOI] [PubMed] [Google Scholar]
- 20. Pless D. D., Lennarz W. J. (1977) Enzymatic conversion of proteins to glycoproteins. Proc. Natl. Acad. Sci U.S.A.74, 134–138 [DOI] [PMC free article] [PubMed] [Google Scholar]
- 21. Satomi Y., Shimonishi Y., Takao T. (2004) N-glycosylation at Asn(491) in the Asn-Xaa-Cys motif of human transferrin. FEBS Letters 576, 51–56 [DOI] [PubMed] [Google Scholar]
- 22. Tarentino A. L., Gomez C. M., Plummer T. H., Jr. (1985) Deglycosylation of asparagine-linked glycans by peptide:N-glycosidase F. Biochemistry 24, 4665–4671 [DOI] [PubMed] [Google Scholar]
- 23. Takahashi N. (1977) Demonstration of a new amidase acting on glycopeptides. Biochem. Biophys. Res. Commun. 76, 1194–1201 [DOI] [PubMed] [Google Scholar]
- 24. Zielinska D. F., Gnad F., Schropp K., Wisniewski J. R., Mann M. (2012) Mapping N-glycosylation sites across seven evolutionarily distant species reveals a divergent substrate proteome despite a common core machinery. Mol. Cell 46, 542–548 [DOI] [PubMed] [Google Scholar]
- 25. Parekh R. B., Tse A. G., Dwek R. A., Williams A. F., Rademacher T. W. (1987) Tissue-specific N-glycosylation, site-specific oligosaccharide patterns and lentil lectin recognition of rat Thy-1. EMBO J. 6, 1233–1244 [DOI] [PMC free article] [PubMed] [Google Scholar]
- 26. Dell A., Thomas-Oates J. E., Rogers M. E., Tiller P. R. (1988) Novel fast atom bombardment mass spectrometric procedures for glycoprotein analysis. Biochimie 70, 1435–1444 [DOI] [PubMed] [Google Scholar]
- 27. Sasaki H., Ochi N., Dell A., Fukuda M. (1988) Site-specific glycosylation of human recombinant erythropoietin: analysis of glycopeptides or peptides at each glycosylation site by fast atom bombardment mass spectrometry. Biochemistry 27, 8618–8626 [DOI] [PubMed] [Google Scholar]
- 28. Weisshaar G., Hiyama J., Renwick A. G. (1991) Site-specific N-glycosylation of human chorionic gonadotrophin–structural analysis of glycopeptides by one- and two-dimensional 1H NMR spectroscopy. Glycobiology 1, 393–404 [DOI] [PubMed] [Google Scholar]
- 29. Linsley K. B., Chan S. Y., Chan S., Reinhold B. B., Lisi P. J., Reinhold V. N. (1994) Applications of electrospray mass spectrometry to erythropoietin N- and O-linked glycans. Anal. Biochem. 219, 207–217 [DOI] [PubMed] [Google Scholar]
- 30. Wuhrer M., Catalina M. I., Deelder A. M., Hokke C. H. (2007) Glycoproteomics based on tandem mass spectrometry of glycopeptides. J. Chromatogr. 849, 115–128 [DOI] [PubMed] [Google Scholar]
- 31. Pan S., Chen R., Aebersold R., Brentnall T. A. (2011) Mass spectrometry based glycoproteomics–from a proteomics perspective. Mol. Cell. Proteomics 10, R110 003251 [DOI] [PMC free article] [PubMed] [Google Scholar]
- 32. Parker B. L., Thaysen-Andersen M., Solis N., Scott N. E., Larsen M. R., Graham M. E., Packer N. H., Cordwell S. J. (2013) Site-specific glycan-Peptide analysis for determination of N-glycoproteome heterogeneity. J. Proteome Res. 12, 5791–5800 [DOI] [PubMed] [Google Scholar]
- 33. Getie-Kebtie M., Franke P., Aksamit R., Alterman M. A. (2008) Experimental evaluation of protein identification by an LC/MALDI/on-target digestion approach. J. Proteome Res. 7, 3697–3707 [DOI] [PubMed] [Google Scholar]
- 34. Zhang Y., Go E. P., Desaire H. (2008) Maximizing coverage of glycosylation heterogeneity in MALDI-MS analysis of glycoproteins with up to 27 glycosylation sites. Anal. Chem. 80, 3144–3158 [DOI] [PubMed] [Google Scholar]
- 35. Pabst M., Chang M., Stadlmann J., Altmann F. (2012) Glycan profiles of the 27 N-glycosylation sites of the HIV envelope protein CN54gp140. Biol. Chem. 393, 719–730 [DOI] [PubMed] [Google Scholar]
- 36. Krokhin O., Ens W., Standing K. G., Wilkins J., Perreault H. (2004) Site-specific N-glycosylation analysis: matrix-assisted laser desorption/ionization quadrupole-quadrupole time-of-flight tandem mass spectral signatures for recognition and identification of glycopeptides. Rapid Commun. Mass Spectrom. 18, 2020–2030 [DOI] [PMC free article] [PubMed] [Google Scholar]
- 37. Kolarich D., Jensen P. H., Altmann F., Packer N. H. (2012) Determination of site-specific glycan heterogeneity on glycoproteins. Nat. Protocols 7, 1285–1298 [DOI] [PubMed] [Google Scholar]
- 38. Wollscheid B., Bausch-Fluck D., Henderson C., O'Brien R., Bibel M., Schiess R., Aebersold R., Watts J. D. (2009) Mass-spectrometric identification and relative quantification of N-linked cell surface glycoproteins. Nat. Biotechnol. 27, 378–386 [DOI] [PMC free article] [PubMed] [Google Scholar]
- 39. Kolarich D., Weber A., Pabst M., Stadlmann J., Teschner W., Ehrlich H., Schwarz H. P., Altmann F. (2008) Glycoproteomic characterization of butyrylcholinesterase from human plasma. Proteomics 8, 254–263 [DOI] [PubMed] [Google Scholar]
- 40. Bloom J. W., Madanat M. S., Ray M. K. (1996) Cell line and site specific comparative analysis of the N-linked oligosaccharides on human ICAM-1des454–532 by electrospray ionization mass spectrometry. Biochemistry 35, 1856–1864 [DOI] [PubMed] [Google Scholar]
- 41. Ling V., Guzzetta A. W., Canova-Davis E., Stults J. T., Hancock W. S., Covey T. R., Shushan B. I. (1991) Characterization of the tryptic map of recombinant DNA derived tissue plasminogen activator by high-performance liquid chromatography-electrospray ionization mass spectrometry. Anal. Chem. 63, 2909–2915 [DOI] [PubMed] [Google Scholar]
- 42. Medzihradszky K. F., Maltby D. A., Hall S. C., Settineri C. A., Burlingame A. L. (1994) Characterization of protein iv-glycosylation by reversed-phase microbore liquid chromatography/electrospray mass spectrometry, complementary mobile phases, and sequential exoglycosidase digestion. J. Am. Soc. Mass Spectrom. 5, 350–358 [DOI] [PubMed] [Google Scholar]
- 43. Schindler P. A., Settineri C. A., Collet X., Fielding C. J., Burlingame A. L. (1995) Site-specific detection and structural characterization of the glycosylation of human plasma proteins lecithin:cholesterol acyltransferase and apolipoprotein D using HPLC/electrospray mass spectrometry and sequential glycosidase digestion. Protein Sci. 4, 791–803 [DOI] [PMC free article] [PubMed] [Google Scholar]
- 44. Wuhrer M., Koeleman C. A., Hokke C. H., Deelder A. M. (2005) Protein glycosylation analyzed by normal-phase nano-liquid chromatography–mass spectrometry of glycopeptides. Anal. Chem. 77, 886–894 [DOI] [PubMed] [Google Scholar]
- 45. Stavenhagen K., Hinneburg H., Thaysen-Andersen M., Hartmann L., Varon Silva D., Fuchser J., Kaspar S., Rapp E., Seeberger P. H., Kolarich D. (2013) Quantitative mapping of glycoprotein micro-heterogeneity and macro-heterogeneity: an evaluation of mass spectrometry signal strengths using synthetic peptides and glycopeptides. J. Mass Spectrom. 48, i. [DOI] [PubMed] [Google Scholar]
- 46. Wohlgemuth J., Karas M., Eichhorn T., Hendriks R., Andrecht S. (2009) Quantitative site-specific analysis of protein glycosylation by LC-MS using different glycopeptide-enrichment strategies. Anal. Biochem. 395, 178–188 [DOI] [PubMed] [Google Scholar]
- 47. Calvano C. D., Zambonin C. G., Jensen O. N. (2008) Assessment of lectin and HILIC based enrichment protocols for characterization of serum glycoproteins by mass spectrometry. J. Proteomics 71, 304–317 [DOI] [PubMed] [Google Scholar]
- 48. Zhang H., Li X. J., Martin D. B., Aebersold R. (2003) Identification and quantification of N-linked glycoproteins using hydrazide chemistry, stable isotope labeling and mass spectrometry. Nat. Biotechnol. 21, 660–666 [DOI] [PubMed] [Google Scholar]
- 49. Parker B. L., Palmisano G., Edwards A. V., White M. Y., Engholm-Keller K., Lee A., Scott N. E., Kolarich D., Hambly B. D., Packer N. H., Larsen M. R., Cordwell S. J. (2011) Quantitative N-linked glycoproteomics of myocardial ischemia and reperfusion injury reveals early remodeling in the extracellular environment. Mol. Cell. Proteomics 10, M110 006833 [DOI] [PMC free article] [PubMed] [Google Scholar]
- 50. Selman M. H., Hoffmann M., Zauner G., McDonnell L. A., Balog C. I., Rapp E., Deelder A. M., Wuhrer M. (2012) MALDI-TOF-MS analysis of sialylated glycans and glycopeptides using 4-chloro-alpha-cyanocinnamic acid matrix. Proteomics 12, 1337–1348 [DOI] [PubMed] [Google Scholar]
- 51. Demelbauer U. M., Zehl M., Plematl A., Allmaier G., Rizzi A. (2004) Determination of glycopeptide structures by multistage mass spectrometry with low-energy collision-induced dissociation: comparison of electrospray ionization quadrupole ion trap and matrix-assisted laser desorption/ionization quadrupole ion trap reflectron time-of-flight approaches. Rapid Commun. Mass Spectrom. 18, 1575–1582 [DOI] [PubMed] [Google Scholar]
- 52. Huddleston M. J., Bean M. F., Carr S. A. (1993) Collisional fragmentation of glycopeptides by electrospray ionization LC/MS and LC/MS/MS: methods for selective detection of glycopeptides in protein digests. Anal. Chem. 65, 877–884 [DOI] [PubMed] [Google Scholar]
- 53. Dage J. L., Ackermann B. L., Halsall H. B. (1998) Site localization of sialyl Lewis (x) antigen on alpha1-acid glycoprotein by high performance liquid chromatography-electrospray mass spectrometry. Glycobiology 8, 755–760 [DOI] [PubMed] [Google Scholar]
- 54. Nanni P., Panse C., Gehrig P., Mueller S., Grossmann J., Schlapbach R. (2013) PTM MarkerFinder, a software tool to detect and validate spectra from peptides carrying post-translational modifications. Proteomics 13, 2251–2255 [DOI] [PubMed] [Google Scholar]
- 55. Dalpathado D. S., Desaire H. (2008) Glycopeptide analysis by mass spectrometry. Analyst 133, 731–738 [DOI] [PubMed] [Google Scholar]
- 56. Saba J., Dutta S., Hemenway E., Viner R. Increasing the productivity of glycopeptides analysis by using higher-energy collision dissociation-accurate mass-product-dependent electron transfer dissociation. Int. J. Proteomics 2012:560391, 2012 [DOI] [PMC free article] [PubMed] [Google Scholar]
- 57. Pittenauer E., Allmaier G. (2009) High-energy collision induced dissociation of biomolecules: MALDI-TOF/RTOF mass spectrometry in comparison to tandem sector mass spectrometry. Comb. Chem. High Throughput Screen 12, 137–155 [DOI] [PubMed] [Google Scholar]
- 58. Sparbier K., Asperger A., Resemann A., Kessler I., Koch S., Wenzel T., Stein G., Vorwerg L., Suckau D., Kostrzewa M. (2007) Analysis of glycoproteins in human serum by means of glycospecific magnetic bead separation and LC-MALDI-TOF/TOF analysis with automated glycopeptide detection. J. Biomol. Tech. 18, 252–258 [PMC free article] [PubMed] [Google Scholar]
- 59. Kuster S. K., Pabst M., Jefimovs K., Zenobi R., Dittrich P. S. (2014) Droplet-Based Fractionation of Nano-LC Separations on Microarrays for Analysis with Sub-Peak Resolution Using MALDI-MS. Anal. Chem. 86, 4848–4855 [DOI] [PubMed] [Google Scholar]
- 60. Go E. P., Irungu J., Zhang Y., Dalpathado D. S., Liao H. X., Sutherland L. L., Alam S. M., Haynes B. F., Desaire H. (2008) Glycosylation site-specific analysis of HIV envelope proteins (JR-FL and CON-S) reveals major differences in glycosylation site occupancy, glycoform profiles, and antigenic epitopes' accessibility. J. Proteome Res. 7, 1660-1674 [DOI] [PMC free article] [PubMed] [Google Scholar]
- 61. Kuster S. K., Pabst M., Zenobi R., Dittrich P. S. (2015) Screening for protein phosphorylation using nanoscale reactions on microdroplet arrays. Angewandte Chemie 54, 1671–1675 [DOI] [PubMed] [Google Scholar]
- 62. Chapman A., Kornfeld R. (1979) Structure of the high mannose oligosaccharides of a human IgM myeloma protein. I. The major oligosaccharides of the two high mannose glycopeptides. J. Biol. Chem. 254, 816–823 [PubMed] [Google Scholar]
- 63. Chapman A., Kornfeld R. (1979) Structure of the high mannose oligosaccharides of a human IgM myeloma protein. II. The minor oligosaccharides of high mannose glycopeptide. J. Biol. Chem. 254, 824–828 [PubMed] [Google Scholar]
- 64. Arnold J. N., Wormald M. R., Suter D. M., Radcliffe C. M., Harvey D. J., Dwek R. A., Rudd P. M., Sim R. B. (2005) Human serum IgM glycosylation: identification of glycoforms that can bind to mannan-binding lectin. J. Biol. Chem. 280, 29080–29087 [DOI] [PubMed] [Google Scholar]
- 65. Urban P. L., Jefimovs K., Amantonico A., Fagerer S. R., Schmid T., Madler S., Puigmarti-Luis J., Goedecke N., Zenobi R. (2010) High-density micro-arrays for mass spectrometry. Lab Chip 10, 3206–3209 [DOI] [PubMed] [Google Scholar]
- 66. Pabst M., Fagerer S. R., Kohling R., Kuster S. K., Steinhoff R., Badertscher M., Wahl F., Dittrich P. S., Jefimovs K., Zenobi R. (2013) Self-aliquoting microarray plates for accurate quantitative matrix-assisted laser desorption/ionization mass spectrometry. Anal. Chem. 85, 9771–9776 [DOI] [PubMed] [Google Scholar]
- 67. Grass J., Pabst M., Chang M., Wozny M., Altmann F. (2011) Analysis of recombinant human follicle-stimulating hormone (FSH) by mass spectrometric approaches. Anal. Bioanal. Chem. 400, 2427–2438 [DOI] [PubMed] [Google Scholar]
- 68. Kehry M., Sibley C., Fuhrman J., Schilling J., Hood L. E. (1979) Amino acid sequence of a mouse immunoglobulin mu chain. Proc. Natl. Acad. Sci U.S.A. 76, 2932–2936 [DOI] [PMC free article] [PubMed] [Google Scholar]
- 69. Cooper C. A., Gasteiger E., Packer N. H. (2001) GlycoMod–a software tool for determining glycosylation compositions from mass spectrometric data. Proteomics 1, 340–349 [DOI] [PubMed] [Google Scholar]
- 70. Stadlmann J., Pabst M., Kolarich D., Kunert R., Altmann F. (2008) Analysis of immunoglobulin glycosylation by LC-ESI-MS of glycopeptides and oligosaccharides. Proteomics 8, 2858–2871 [DOI] [PubMed] [Google Scholar]
- 71. Leymarie N., Griffin P. J., Jonscher K., Kolarich D., Orlando R., McComb M., Zaia J., Aguilan J., Alley W. R., Altmann F., Ball L. E., Basumallick L., Bazemore-Walker C. R., Behnken H., Blank M. A., Brown K. J., Bunz S. C., Cairo C. W., Cipollo J. F., Daneshfar R., Desaire H., Drake R. R., Go E. P., Goldman R., Gruber C., Halim A., Hathout Y., Hensbergen P. J., Horn D. M., Hurum D., Jabs W., Larson G., Ly M., Mann B. F., Marx K., Mechref Y., Meyer B., Moginger U., Neusubeta C., Nilsson J., Novotny M. V., Nyalwidhe J. O., Packer N. H., Pompach P., Reiz B., Resemann A., Rohrer J. S., Ruthenbeck A., Sanda M., Schulz J. M., Schweiger-Hufnagel U., Sihlbom C., Song E., Staples G. O., Suckau D., Tang H., Thaysen-Andersen M., Viner R. I., An Y., Valmu L., Wada Y., Watson M., Windwarder M., Whittal R., Wuhrer M., Zhu Y., Zou C. (2013) Interlaboratory study on differential analysis of protein glycosylation by mass spectrometry: the ABRF glycoprotein research multi-institutional study 2012. Mol. Cell. Proteomics 12, 2935–2951 [DOI] [PMC free article] [PubMed] [Google Scholar]
- 72. Hart M. L., Saifuddin M., Uemura K., Bremer E. G., Hooker B., Kawasaki T., Spear G. T. (2002) High mannose glycans and sialic acid on gp120 regulate binding of mannose-binding lectin (MBL) to HIV type 1. AIDS Res. Hum. Retroviruses 18, 1311–1317 [DOI] [PubMed] [Google Scholar]
Associated Data
This section collects any data citations, data availability statements, or supplementary materials included in this article.