

Abstract
Plasma glycoproteins and extracellular vesicles represent excellent sources of disease biomarkers, but laboratory detection of these circulating structures are limited by their relatively low abundance in complex biological fluids. Although intensive research has led to the development of effective methods for the enrichment and isolation of either plasma glycoproteins or extracellular vesicles from clinical materials, at present it is not possible to enrich both structures simultaneously from individual patient sample, a method that affords the identification of biomarker combinations from both entities for the prediction of clinical outcomes will be clinically useful. We have therefore developed an enrichment method for use in mass spectrometry-based proteomic profiling that couples prolonged ultracentrifugation with electrostatic repulsion-hydrophilic interaction chromatography, to facilitate the recovery of both glycoproteins and extracellular vesicles from nondepleted human plasma. Following prolonged ultracentrifugation, plasma glycoproteins and extracellular vesicles were concentrated as a yellow suspension, and simultaneous analyses of low abundant secretory and vesicular glycoproteins was achieved in a single LC-MS/MS run. Using this systematic prolonged ultracentrifugation-electrostatic repulsion-hydrophilic interaction chromatography approach, we identified a total of 127 plasma glycoproteins at a high level of confidence (FDR ≤ 1%), including 48 glycoproteins with concentrations ranging from pg to ng/ml. The novel enrichment method we report should facilitate future human plasma-based proteome and glycoproteome that will identify novel biomarkers, or combinations of secreted and vesicle-derived biomarkers, that can be used to predict clinical outcomes in human patients.
Human plasma contain proteins released from multiple organs and tissue compartments, including both secreted molecules and extracellular vesicles that reflect the physiological or pathological status of the cell of origin (1). In addition to ease of access, plasma represents one of the most comprehensive sources of potential biomarkers of disease processes, hence proteomic profiling of human plasma can provide clinically useful information on a wide range of human pathologies. The plasma proteome contains asparagine-linked (N-linked) glycosylated proteins from secreted proteome, proteins enclosed in extracellular vesicles or shed from plasma membranes, and these low abundant glycoproteins play key roles in cell–cell interactions, signal transduction, protein function modulation, developmental pathways, immune defense, and disease pathogenesis (2, 3). Given that glycosylation is the most prevalent post-translational modification of human proteins (2, 4), methods that can enrich these low abundant molecules for characterization of aberrant glycosylation should enable the identification of novel biomarkers of clinical outcomes.
The most clinically useful protein biomarkers in cancer medicine are glycosylated molecules, including HER2 in breast cancer, PSA in prostate cancer, CEA in colorectal cancer, CA-125 in ovarian cancer, and α-fetoprotein in hepatocellular carcinoma (5, 6). To date, MS coupled with high-resolution liquid chromatography (LC) has been the preferred tool for the identification of trypsin-digested N-glycopeptides and glycosylation sites (7, 8). However, study of the human plasma glycoproteome remains challenging because of the vast dynamic range of protein abundance, which can span up to 12 orders of magnitude (8). In addition, the low ionization efficiency of plasma glycopeptides, combined with the relatively high quantities of interfering nonglycosylated counterparts in the sample, can often result in signal suppression when subjected to MS analyses (7). This complexity exceeds the analytical capabilities of MS techniques (up to five orders of magnitude) for detection of low-abundance glycopeptides; hence detection of low-abundance glycoproteins from the whole tryptic digest can be an extremely arduous task. Advances in MS technology, combined with the development of effective fractionation and enrichment strategies to simplify plasma prior to MS analyses, have facilitated the identification of lower abundant species in complex biofluids (9, 10). In efforts to enhance the detection of the N-glycoproteome, selective enrichment of N-glycopeptides has been attempted using diverse strategies including lectin affinity chromatography (11, 12), solid-phase extraction of N-linked glycoproteins (13), size exclusion chromatography (14), boronic acid affinity chromatography (15), titanium dioxide chromatography (16), hydrophilic interaction chromatography (17, 18), and ERLIC1 (19, 20). Although these methodologies are effective in achieving higher coverage of the glycoproteome, removal of important albumin and/or solid support-bound proteins may result in inadvertent loss of potential protein markers (21).
Circulating extracellular vesicles and exosomes are released by a multitude of different cell types under both physiological and pathological conditions (22). Although extracellular vesicles can be isolated using methods such as filtration concentration, flotation density gradients and immunocapture beads, the most widely used method is successive centrifugation followed by ultracentrifugation (UC) (23, 24). Extracellular vesicles are known to be involved in myriad cellular processes including coagulation (25), inflammation (26), tumor progression (27), immune response regulation (28), ectodomain shedding of membrane proteins (29), antigen presentation (30), intracellular communication (31), transfer of RNA and proteins (32) and transfer of infectious cargo (prions and retroviruses) (33, 34). In addition, extracellular vesicles have been implicated in the pathogenesis of vascular disorders (35, 36), cancers (37, 38), diabetes (39) and infectious diseases (40, 41). Collectively, these data highlight the immense potential of using these blood-based biomarkers to predict diverse clinical outcomes.
Given that both plasma glycoproteins and extracellular vesicles represent excellent sources of potential disease biomarkers, a method that supports simultaneous enrichment of both entities from individual bodily fluid sample would be enable the identification of novel biomarkers, or combinations of biomarkers, that can predict clinical outcomes in human patients. We therefore developed a systematic enrichment method that couples prolonged ultracentrifugation (PUC) with ERLIC [PUC-ERLIC], for the simultaneous isolation of secretory and extracellular vesicle-enriched glycoproteins from nondepleted human plasma. We show that application of this method facilitates the successful recovery of both high- and low-abundant plasma glycoproteins with concentrations ranging from pg/ml–mg/ml. Using this combined PUC-ERLIC approach, we achieved high-confidence identification (FDR ≤ 1%) of a total of 599 unique N-glycopeptides and 361 unique N-glycosylation sites which were assigned to 127 glycoproteins in nondepleted plasma, including 48 glycoproteins that displayed concentration ranges as low as pg-ng/ml.
EXPERIMENTAL PROCEDURES
All water used in the experiments was prepared using a Milli-Q system (Millipore, Bedford, MA). All chemicals were purchased from Sigma-Aldrich (St Louis, MO) unless stated otherwise.
Human Plasma
The study was approved by the institutional review board of National University Hospital Singapore (NUHS). Blood was obtained from heart disease patients (n = 20) prior to coronary artery bypass graft surgery (CABG) and then stored on ice until plasma isolation (conducted within 4h of collection into lithium-heparin vacutainers). Plasma was separated from whole blood by centrifugation at 2500 × g for 30min at 4 °C, and then frozen at −150 °C in the NUHS AtheroExpress Repository until subsequent proteomic processing. Two biological replicates were performed in this study, and plasma samples from all 20 patients were combined in equal proportions to obtain a total volume of 5 ml prior to analysis (in order to minimize biological variation). Written informed consent was obtained from all study participants.
PUC-Based Enrichment of Secretory Glycoprotein and Extracellular Vesicles
A total of 5 ml pooled plasma was diluted with 25 ml of 1 × phosphate buffer saline (PBS) and then differentially centrifuged at 200 × g (30min), 2000 × g (30min) and 12,000 × g (60min) at 4 °C to exclude intact cells and cellular debris. The resultant supernatant was aliquoted into a 25 × 89 mm polycarbonate tube (Type 50.2 Ti rotor, Beckman Coulter, Brea, CA) and enriched plasma glycoproteins and extracellular vesicles were pelleted at 200,000 × g (18h, 4 °C) using a Beckman L100-XP Ultracentrifuge (Beckman Coulter, Brea, CA). The enriched glycoprotein and extracellular vesicular fraction was then resuspended in 1 × PBS and pelleted at 200,000 × g (18h, 4 °C) to remove residual contaminants.
Cryo-Electron Microscopy (Cryo-EM)
Electron microscope grids coated with holey carbon film (R2/2 Quantifoil) were glow discharged, and a 4 μl droplet of extracellular vesicle-enriched suspension was deposited onto the grid at 99% humidity. Excess liquid was blotted with filter paper and plunged into liquid ethane (Vitrobot, FEI Company, Hillsboro, OR). Cryo grids were imaged using a field emission gun transmission electron microscope operated at 80kV (Arctica, FEI Company, Hillsboro, OR), and equipped with a direct electron detector (Falcon II, FEI Company, Hillsboro, OR). Images were recorded at a nominal magnification of 23,500×.
Western blot Analyses
A total of 50 μg secretory and extracellular vesicle proteins were lysed in 4 × Laemmli protein sample buffer (BioRad, Hercules, CA), resolved on 8–12% polyacrylamide gels, and transferred onto 0.45 μm nitrocellulose membranes (BioRad, Hercules, CA). Membranes were blocked and incubated overnight at 4 °C with antiAlix antibody (1:1000 Ab88743; Abcam, Cambridge, MA), antiCD9 antibody (1:1000 sc-13118; Santa Cruz Biotechnology, Santa Cruz, CA) and antiCD81 antibody (1:1000 sc-9158; Santa Cruz Biotechnology), followed by incubation with horseradish-peroxidase-conjugated secondary antibody (Santa Cruz Biotechnology; 1:4000, sc-2371, sc-2370), and then immunodetection using an enhanced chemiluminescence assay (Millipore Coporation, Billerica, MA).
In-Solution Tryptic Digestion
Proteomic sample preparation was performed according to previously described methods designed to minimize experimentally-induced deamidation (42, 43), except for minor modifications. Briefly, the secretory and extracellular vesicle-enriched glycoproteins were resuspended in 2 ml lysis buffer containing 8 m urea and 50 mm ammonium acetate (pH 6.0). Plasma proteins were quantified in a 96-well plate using a bicinchoninic acid (BCA) assay according to the manufacturer's protocol. Disulfide bonds were reduced by incubating 300 μg protein in 20 mm dithiothreitol (DTT) for 3 h at 30 °C, and were then alkylated in the dark using 55 mm iodoacetamide (IAA) for 1h at room temperature. Prior to tryptic digestion, the urea concentration was diluted to less than 1 m using 50 mm ammonium acetate buffer (pH 6.0) to ensure optimal trypsin activity. Proteins were enzymatically digested overnight at 37 °C using sequencing-grade trypsin (Promega, Madison, WI) at a 1:100 ratio (w/w, trypsin/protein). The tryptic peptides were desalted using a Sep-Pak C18 cartridge (Waters, Milford, MA) and the eluted peptides were dried in a vacuum concentrator.
ERLIC Fractionation
Selective enrichment of glycosylated peptides was performed accordingly to a previously described method (44), with minor modifications. Briefly, vacuum-dried peptides were reconstituted in 200 μl mobile phase A (80% acetonenitrile [ACN] containing 0.1% formic acid [FA]) and fractionated using a PolyWAX LP weak anion-exchange column (4.6 × 200 mm, 5 μm, 300Å; PolyLC, Columbia, MD) on a Prominence UFLC system (Shimadzu, Kyoto, Japan). The UV spectra of the peptides were collected at 280 nm. Mobile phase A and mobile phase B (10% ACN, 2% FA) were used with a 90 min gradient of 0–5% B over 8 min and 5–28% B over 37min followed by 45min at 100% B (constant flow rate of 1 ml/min). Forty-five separate fractions were collected, combined into 14 pooled fractions, and then vacuum-dried (illustration available in supplementary Fig. S1).
Deglycosylation
Glycopeptides were deglycosylated using PNGase F (New England BioLabs, Beverly, MA) in 50 mm ammonium acetate (pH 5.0) as previously described (42, 43) to minimize experimentally-induced deamidation. Peptides were deglycosylated overnight at 37 °C and then dried using a vacuum concentrator prior to reconstitution in LC-MS/MS compatible buffer (3% ACN, 0.1% FA).
LC-MS/MS
The fractionated peptides were separated and analyzed using a LC-MS/MS system that comprised a Ultimate 3000 RSLC nano-HPLC system (Dionex, Amsterdam, NL) coupled to an online LTQ-FT Ultra linear ion trap mass spectrometer (Thermo Scientific Inc., Bremen, Germany). Approximately 3 μg of peptides from each fraction were injected into a Zorbax peptide trap column (Agilent Technologies, Santa Clara, CA) via the auto-sampler of the Dionex system, and were subsequently resolved in a capillary column (75 μm × 10 cm) which was packed with C18 AQ (5 μm, 300Å; Bruker-Michrom, Auburn, CA), and run at a flow rate of 300 nL/min. Buffer A (0.1% FA in HPLC water) and buffer B (0.1% FA in ACN) were used to establish the 60 min gradient; starting with 1min of 5–8% B, 44 min of 8–32% B, 7 min of 32–55% B, 1 min of 55–90% B and 2 min of 90% B, followed by re-equilibration in 5% B for 5 min. The samples were ionized in an ADVANCE™ CaptiveSpray™ Source (Bruker Michrom Billerica, MA) with an electrospray potential of 1.5kV. The LTQ-FT Ultra was set to perform data acquisition in the positive ion mode. A full MS scan (350–1600 m/z range) was acquired in the FT-ICR cell at a resolution of 100,000 and a maximum ion accumulation time of 1000ms. The automatic gain control target for FT was set at 1 × 10⁶, and precursor ion charge state screening was activated. The linear ion trap was used to collect peptides and measure the peptide fragments generated by CID. The default automatic gain control setting was used in the linear ion trap (full MS target 3.0 × 10⁴, MSn 1 × 10⁴). The 10 most intense ions above a 500 count threshold were selected for fragmentation in CID (MS2), which was performed concurrently with a maximum ion accumulation time of 200 ms. Dynamic exclusion was activated for the process, with a repeat count of one and exclusion duration of 60 s. For CID, the activation Q was set at 0.25, isolation width (m/z) was 2.0, activation time was 30ms, and normalized collision energy was 35%.
Data Analyses
The extract_msn program (version 4.0) as found in Bioworks Browser 3.3 (Thermo Electron, Bremen, Germany) was used to extract tandem MS spectra in dta format from the raw data of LTQ-FT ultra. Protein identification was performed by querying against the extracted Uniprot Human database (Released on 11/29/2013; 176,946 sequences, 70,141,034 residues), by means of an in-house Mascot server (version 2.4.1, Matrix Science, Boston, MA). Target-decoy search strategy was employed for the estimation of false positive identification. The search was limited to a maximum of two missed trypsin cleavages; # 13 C of 2; peptide precursor mass tolerances of 5.1ppm; and 0.8 Da mass tolerance for fragment ions. Carbamidomethylation of cysteine residues was set as a fixed modification, whereas oxidation of methionine residues and deamidation of asparagine residues were set as variable modifications. Mascot results were exported to csv file format and then further processed in Microsoft Excel. Identified peptides were sorted from smallest to largest Mascot peptide expect value (a measure of random match probability), and largest to smallest ion score. The resultant peptide list was used for calculation of false discovery rate [FDR = 2*(decoy hits/total hits)*100%], using an in-house script. The FDR associated with the searched data set was 1% at the peptide level. In order to reduce the presence of outliers in our data set, only peptides with ion scores greater than homology or identity scores were selected for further analysis.
Data Annotation
Several open source online bioinformatics software tools including STRAP v1.5 (45), AmiGO v2 (46, 47), and DAVID v6.7 (48, 49) were used to determine plasma glycoproteins function. Peptide sequences were submitted to NCBI BLASTP (50, 51) search against a nonredundant protein sequences (nr) using NCBI server default settings.
RESULTS AND DISCUSSION
Development of a Novel PUC-ERLIC Strategy for Glycoproteome Enrichment
Plasma glycoproteins and extracellular vesicles represent excellent sources of disease biomarkers, but technical challenges have so far prevented the isolation of both structures in parallel from individual patient samples. In order to develop an efficient new method for simultaneous isolation of glycoproteins and extracellular vesicles from human plasma, we first sought to simplify the composition of this highly complex biological fluid using ultracentrifugation (UC). We therefore prediluted human plasma fivefold and increased our standard UC speed and duration (from 100,000 × g for 2 h to 200,000 × g for 18 h) in order to reduce plasma viscosity and improve sedimentation efficiency (Fig. 1). We recovered a visible yellow suspension that was found to be highly enriched in soluble glycoproteins and extracellular vesicles when extracted and digested into peptides using trypsin under denaturing conditions. The glycopeptides from soluble glycoproteins and extracellular vesicles were then further enriched using ERLIC. Finally, the glycopeptide N-linked glycans were cleaved using PNGase F prior to analysis by reverse-phase LC MS/MS.
Fig. 1.
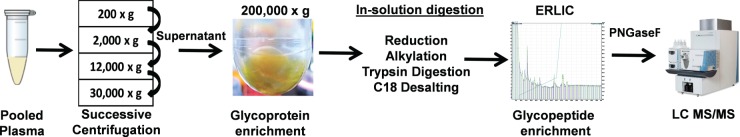
PUC-ERLIC proteomics workflow showing plasma sample preparation for the simultaneous isolation of secretory and extracellular vesicle-enriched glycoproteins prior to mass spectrometry. Yellow suspension collected after PUC was found to be enriched in glycoproteins.
Isolation of Extracellular Vesicles from Human Plasma
UC is the most common method used for extracellular vesicles isolation, but this approach often results in copelleting of protein aggregates and other membrane fragments (23). We recognize the presence of inadvertent trace of contaminants in our extracellular vesicles fraction; therefore we define our preparation as “extracellular vesicles-enriched” in place of “pure extracellular vesicles” in this study.
The enrichment of extracellular vesicles using PUC was ascertained by Cryo-EM (Fig. 2A and 2B), Western blotting (Fig. 2C) and proteomic analyses (detailed searched information available in supplemental Data S1, worksheet 18hMarkers01). When viewed by EM, the harvested extracellular vesicles displayed circular morphology, were membrane-bound, and exhibited a size range comparable to that of exosomes (50–100 nm diameter) (32). Western blot analyses of widely-used exosomal markers including Alix, CD9, and CD81 (52) confirmed the presence of extracellular vesicles in both of the biological replicates obtained by PUC, and numerous exosome-specific membrane proteins were detected in our proteomic data set, including FLOT1, TSG101, HSP70, ALIX/PDCD6IP, CD9, CD81, and CD63 (52). Together, the data obtained from our EM, Western blot, and proteomic analyses provided strong evidence of extracellular vesicle enrichment using PUC.
Fig. 2.
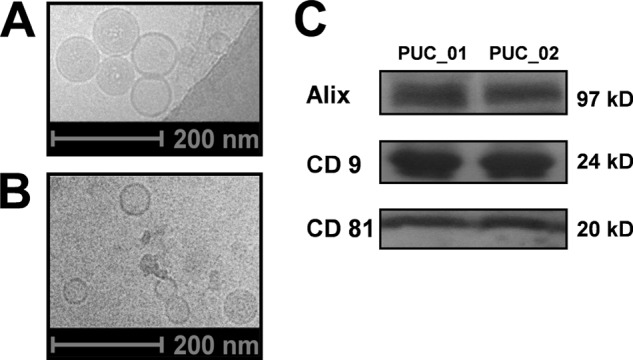
Plasma extracellular vesicles isolated using prolonged ultracentrifugation (PUC). A, Electron micrographs of harvested extracellular vesicles (sizes 50–100nm, recorded at 23,500× magnification with a defocus of −6μM). B, Electron micrographs of extracellular vesicles recorded on carbon (23,500× magnification with a defocus of −6μM). C, Western blot analyses of harvested proteins using extracellular vesicle markers Alix, CD9 and CD81. PUC-01 and PUC-02 are biological replicates.
PUC Facilitates Simultaneous Enrichment of Secretory Glycoproteins and Extracellular Vesicles
Standard protocols for the isolation of extracellular vesicles typically require 2 h of UC. In order to assess whether extended UC duration favors the recovery of extracellular vesicles and secretory glycoproteins, we compared the data obtained via PUC-ERLIC with a standard UC-ERLIC approach (detailed experimental protocols available in supplemental Procedures). As depicted in Fig. 3A, a translucent yellow pellet was recovered from plasma after 2 h of standard UC, but after 18 h of UC (PUC) the same volume of plasma gave rise to a pellet that was significantly larger, darker in shade, and surrounded by a dense yellow suspension. This observation suggested that PUC may be superior to standard UC in terms of pellet recovery.
Fig. 3.
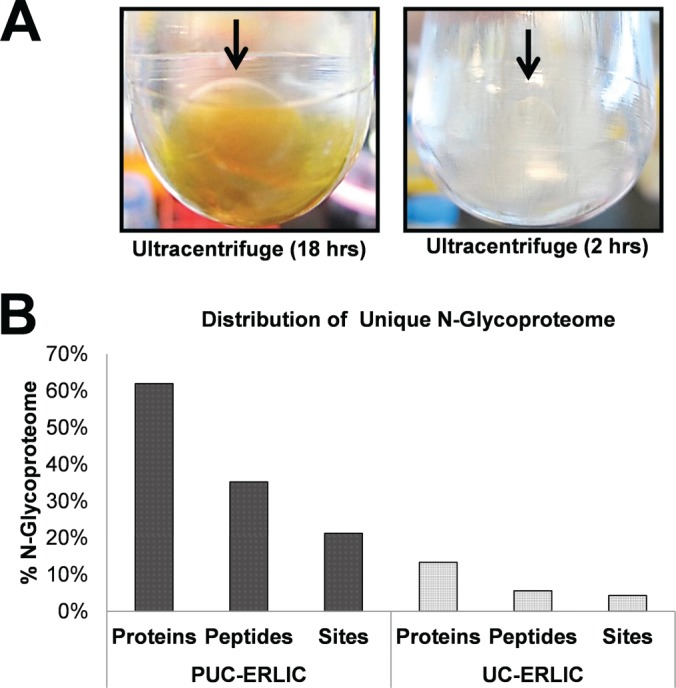
Prolonged ultracentrifugation (PUC) enables simultaneous recovery of secretory and extracellular vesicle-enriched glycoproteins from human plasma. A, Comparison of fractions recovered from 5 mL total plasma after 18 h or 2 h of UC. Yellow pellet recovered after PUC (18 h) was significantly larger and more visible than the pellet recovered after UC (2 h). B, Proportion of unique N-glycoproteins, N-glycopeptides, and N-glycosylated sites obtained when using PUC-ERLIC or standard UC-ERLIC approaches (both with PNGase F treatment). Significant glycoprotein enrichment was observed after PUC-ERLIC. The glycosylation percentage was calculated using the number of unique glycosylated products divided by the sum of all unique glycosylated and unmodified peptides.
We next examined the glycoproteome of the extracellular vesicle-enriched suspensions obtained by standard UC or PUC. As shown in Fig. 3B, the glycoproteome obtained using our novel PUC-ERLIC approach exhibited a fourfold higher representation of asparagine-linked (N-linked) glycosylated proteins compared with the standard UC-ERLIC-generated glycoproteome (detailed searched information available in supplemental Data S2, worksheet PNGaseAll01), indicating enrichment of secretory glycoproteins by PUC. Consistent with these data, 99 of 127 glycoproteins identified after PUC-ERLIC were annotated as secreted proteins in DAVID v6.7 (48, 49) (detailed searched information available in supplemental Data S2, worksheet PNGaseNMotif02), indicating that the yellow suspension generated by PUC was highly enriched in soluble glycoproteins. Based on the dramatic visual difference in pellet recovery and glycoproteomic composition, our data show that prolonged UC time facilitates the simultaneous sedimentation of secretory glycoproteins and extracellular vesicles from human plasma.
Despite growing interest in the field of extracellular vesicle biology and the extensive use of UC for their isolation, our report is the first to describe the recovery of a yellow extracellular vesicle fraction enriched with soluble glycoproteins from human plasma. The exact mechanism by which PUC enables enrichment of glycoproteins from plasma is currently unclear. However, we speculate that the larger and extensively branched secretory N-glycoproteins form denser components than their unmodified counterparts, leading to pelleting alongside extracellular vesicles during extended UC. Based on these findings, it appears that PUC-ERLIC is more effective than standard UC-ERLIC for the enrichment of both secretory and low abundant extracellular vesicle-enriched N-glycosylated plasma proteins.
Evaluation of Glycoproteome Enrichment by PUC-ERLIC
In order to assess the performance of PUC and ERLIC to plasma glycoproteome enrichment when using our novel strategy, we next compared the protein/peptide composition of samples subjected to PUC alone, ERLIC alone, or PUC-ERLIC combined (detailed experimental protocols available in supplemental Procedures). As shown in Fig. 4A, the percentage of unique plasma N-glycoproteins recovered was significantly higher when using PUC-ERLIC (∼62%) compared with ERLIC alone (∼34%) or PUC alone (∼24%) (detailed searched information available in supplemental Data S2, worksheet PNGaseAll01). The reduced recovery of N-glycoproteome components observed when using ERLIC alone or PUC alone confirmed the known analytical limitations of MS for the detection of low abundance glycoproteins in crude plasma. Approximately 24% of the total unique proteins identified in the PUC sample fractions were glycosylated, indicating that glycoproteins were substantially enriched by extended hours of UC. When comparing the profile of glycoproteins obtained by PUC-ERLIC with those obtained when using PUC alone or ERLIC alone, we observed that a significant number of proteins overlapped, indicating high commonality and complementarity between the three approaches (Fig. 4B). Of a total 137 glycosylated proteins identified, 59 were detected using more than one approach, corresponding to an overlap of ∼43% between the different methods. However, PUC-ERLIC recovered a substantially higher number of unique glycosylated proteins from nondepleted human plasma than either PUC or ERLIC alone. This significant improvement in detection of unique N-glycoproteins (∼twofold), N-glycopeptides (∼fivefold) and N-glycosites (∼fourfold) using PUC-ERLIC indicated synergistic effects of this combined approach for glycoproteome enrichment that exceeded the performance of the individual component methods.
Fig. 4.
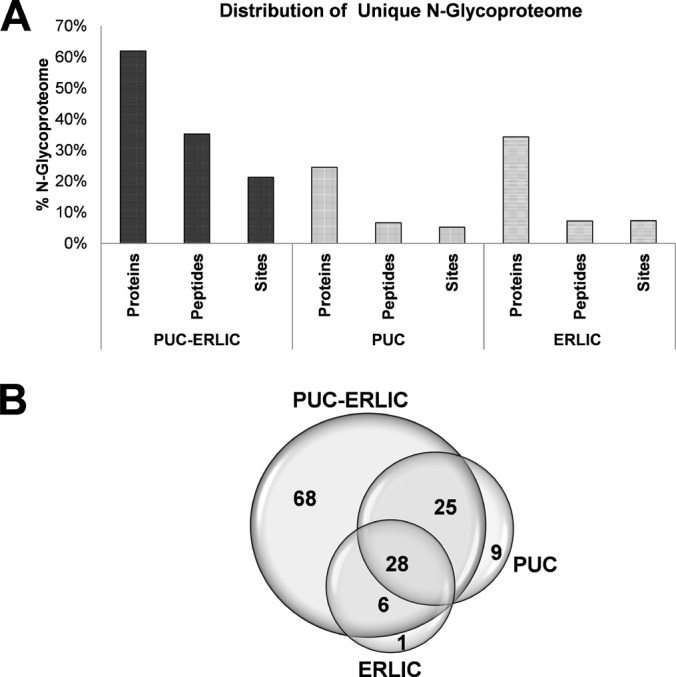
PUC-ERLIC facilitates enrichment of the N-glycoproteome of human plasma. A, Proportion of unique N-glycoproteins, N-glycopeptides, and N-glycosylated sites obtained using PUC-ERLIC, PUC alone, or ERLIC alone (all with prior PNGase F treatment). The glycosylation percentage was calculated using the number of unique glycosylated products divided by the sum of all unique glycosylated and unmodified peptides. B, Venn diagram of overlapping plasma N-glycoproteins obtained using PUC-ERLIC, PUC alone, or ERLIC alone.
Selective Glycopeptide Enrichment Using ERLIC
We next assessed the efficiency of glycopeptides enrichment by ERLIC when used in our combined PUC-ERLIC method. The mixed-mode chromatography method ERLIC was originally developed for the enrichment of phosphopeptides and separation of charged biomolecules (53), and it has been optimized for the efficient separation of retained glycopeptides from background unmodified peptides based on differences in charge and polarity (19, 20), which exploits the electrostatic attraction of negatively charged sialylated glycopeptides, and the hydrophilic interaction of carbohydrate groups with the weak anion exchange resin under acidic conditions. When applying this approach to the analysis of human plasma samples, the majority of nonglycosylated peptides elute in the flow-through (fractions 0–3), which is collected during the first 8 min of the gradient MS run (range 70–66% ACN). Using this method, we observed that negatively charged and hydrophilic glycopeptides were eluted after the unmodified peptides and were collected in fractions 4–44 (illustration available in supplemental Fig. S1A). We then combined the individual glycopeptide-enriched fractions into 14 pooled fractions, and detected a gradual increase in the proportions of glycopeptides present in the later fractions (illustration available in supplemental Fig. S1B), indicating that ERLIC facilitates significant enrichment of plasma glycopeptides after PUC.
Assessment of False Positive N-linked Glycosylation Sites
The use of standard alkaline reaction buffers to conduct N-linked glycoproteomic experiments promotes nonenzymatic deamidation of Asn to Asp (42, 43) may hamper the accurate assignment of N-glycosylation sites (54). It has been shown that without affecting protein and peptide identification, chemically induced deamidation were significantly minimized under acidic digestion and deglycosylation conditions at pH 6.0 (42, 43). Here, we evaluate the accuracy with which N-glycosylation sites could be assigned after plasma protein enrichment by PUC-ERLIC. The carbohydrate moiety in N-linked glycosylation is attached to an asparagine residue (Asn/N) followed by a nonproline amino acid (X) and then a serine (S)/threonine (T)/Cysteine (C), resulting in a consensus N-X-S/T/C sequence motif that is used in the assignment of N-glycopeptides. Typically, PNGase F treatment is used to deglycosylate the N-glycopeptides via deamidation of Asn to aspartic acid (Asp/D) (+0.984 Da) at the site of glycan attachment, and the corresponding change in peptide mass can be detected using tandem mass spectrometry (MS/MS). Unfortunately, MS/MS is unable to distinguish PNGase F-mediated deamidation from spontaneous or artificially-induced Asn deamidation (54). In order to determine the extent of true-positive versus false-positive assignment of N-glycoslyation sites, we next performed an independent PUC-ERLIC experiment without PNGase F treatment and identified a total of just four unique Asn deamidated peptides (detailed searched information available in supplemental Data S3, worksheet NoPNGasAll01) that matched the consensus N-X-S/T/C motif (equivalent to 0.68% FDR for all N-glycopeptides in our study). These falsely assigned N-glycosylated peptides as shown in Table I were excluded from further analyses. In addition, the PUC-ERLIC experiment without PNGase F treatment enabled the identification of 252 unique deamidated peptides that lacked the N-linked sequence and instead contained the common deamidation N-G or N-S motif (55) at the +1 position (detailed searched information available in supplemental Data S3, worksheet NoPNGaseDeamid02), which likely arose from deamidation in vivo. These 252 peptides represented ∼12% of the total 2171 unique plasma peptides identified in our study. Given the precautions taken to reduce artificial deamidation when conducting these analyses and the low frequency of chemical deamidation observed, we believe that PUC-ERLIC facilitates robust assignment of N-glycosylation sites based on PNGase F-mediated deamidation.
Table I. Proteins and peptides identified in human plasma with false glycosylation assignment. Deamidated sites that match the consensus N-X-S/T/C glycosylation motifs are underlined and bold.
| Accession | Protein description | Peptide sequence | Peptide score | N-X-S/T/C position |
|---|---|---|---|---|
| P01616 | Ig kappa chain V-II region MIL | RFSGSGSGTNFTLKI | 95.68 | N74 |
| A6NNI4 | CD9 antigen | KAIHYALNCCGLAGGVEQFISDICPKK | 41.73 | N82 |
| U3KQ34 | Interleukin-1 receptor-associated kinase 1-binding protein 1 | KMQNICNFLVEKL | 50.55 | N53 |
| P08603 | Complement factor H | KSPDVINGSPISQKI | 57.14 | N217 |
Efficacy of PUC-ERLIC for the Enrichment of Low-Abundance Plasma Glycoproteins
Analysis of our PUC-ERLIC glycoproteomic data by querying against the Mascot search engine returned a total of 599 unique N-glycopeptides and 361 unique N-glycosylation sites assigned to 127 distinct glycoproteins in undepleted human plasma (overall confidence level ≥99%; detailed searched information available in supplemental Data S2, worksheet PNGaseAll01), MS/MS spectrum of all glycosylated peptides available in supplemental Information S1. In this study, 94–98% of the total detected N-glycosylated sites matched the stringent canonical motif N-X-S/T, with the N-X-T motif being more frequent than the N-X-S motif. A minor proportion of N-glycosites (2–6%) matched the rare N-X-C motif (detailed information available in supplemental Data S2, worksheet PNGaseNMotif02).
We next compared the N-glycosylated plasma proteins identified in our study with data sets obtained from previous studies that used common protocols for N-glycoprotein enrichment. Using a similar LC-MS/MS platform to that employed in the current report, Yang et al. (56) used solid phase extraction of N-linked glycoproteins (SPEG) to enable the identification of 462 glycopeptides from 185 N-glycoproteins in nondepleted human plasma. In contrast, Drake et al. (57) used affinity capture workflows to facilitate the detection of 227 N-glycosylation sites covering 119 N-glycoproteins recovered from MARS-depleted plasma. As illustrated in Fig. 5, our PUC-ERLIC approach enabled the detection of 109 N-glycosylated proteins among the total 229 N-glycosylated proteins reported by the different studies (detailed information available in supplemental Data S4, worksheet CompareStudy), which accounts for at least 48% of glycosylated proteins identified. As established methods such as SPEG and lectin affinity have proved to be useful in the enrichment of glycoproteome, the overlapped of ∼57% glycoproteins among the three different methodologies shows that enrichment by PUC-ERLIC is at least as efficient as the current alternative methods. Importantly, there is no other method at present that offers the enrichment of both extracellular vesicles and glycoproteins in a single experiment.
Fig. 5.
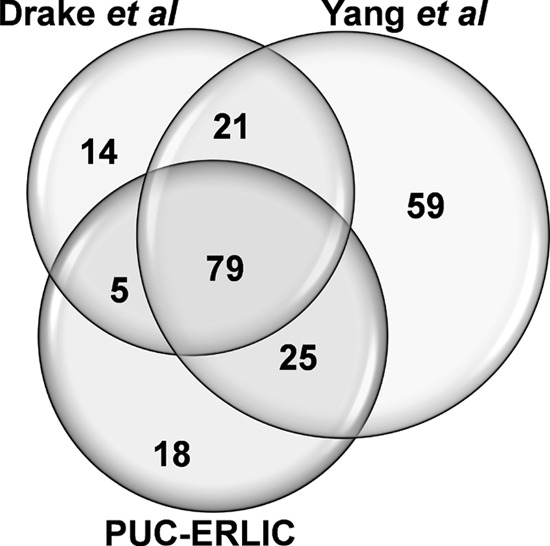
Venn diagram showing the N-glycosylated plasma proteins identified using PUC-ERLIC (current study), SPEG approach (Yang et al (56)) or affinity capture method (Drake et al (57)).
We next determined the presence of known extracellular vesicle proteins in our data set by conducting literature surveys in Exocarta, a web-based central repository that catalogs exosomal RNA, lipids, and proteins (http://www.exocarta.org/) (58). As summarized in Table II, among the total 127 glycoproteins identified in our data set 58 have previously been cataloged as extracellular vesicle proteins in Exocarta (human plasma data bank) and in consolidated reference studies (59–61). A total 46% of the extracellular vesicle proteins identified in our study were glycosylated, thus providing further evidence that PUC-ERLIC enables substantial enrichment of vesicle-derived glycoproteins. To our knowledge, our report is the first to describe the glycoprotein composition of extracellular vesicles enriched from human plasma, and accordingly, the remaining 69 glycosylated proteins identified by our analyses were undocumented in the Exocarta human plasma data bank.
Table II. Extracellular vesicle-associated glycoproteins as cataloged in Exocarta. Evidence of cataloged extracellular vesicle proteins obtained from listed references.
| No. | UniProt ID | Gene symbol | Protein score | Protein description | Extracellular vesicle proteins | Ref. |
|---|---|---|---|---|---|---|
| 1 | P04217 | A1BG | 5598 | Alpha-1B-glycoprotein | Y | (59) |
| 2 | P01023 | A2M | 8107 | Alpha-2-macroglobulin | Y | (59) |
| 3 | P43652 | AFM | 3787 | Afamin | Y | (59) |
| 4 | C9JV77 | AHSG | 81282 | Alpha-2-HS-glycoprotein | Y | (59) |
| 5 | P02768 | ALB | 285547 | Serum albumin | Y | (59) |
| 6 | P02760 | AMBP | 11966 | Protein AMBP | Y | (59) |
| 7 | P04114 | APOB | 1640 | Apolipoprotein B-100 | Y | (60) |
| 8 | C9JF17 | APOD | 5406 | Apolipoprotein D | Y | (60) |
| 9 | F8WF14 | BCHE | 901 | Cholinesterase | Y | (59) |
| 10 | H0YFH3 | C1R | 1036 | Complement C1r subcomponent | Y | (59) |
| 11 | F8WCZ6 | C1S | 381 | Complement C1s subcomponent | Y | (59) |
| 12 | P01024 | C3 | 6503 | Complement C3 | Y | (59) |
| 13 | P0C0L5 | C4B | 52520 | Complement C4-B | Y | (59) |
| 14 | P04003 | C4BPA | 2570 | C4b-binding protein alpha chain | Y | (59) |
| 15 | Q5VVQ7 | C4BPB | 5187 | C4b-binding protein beta chain | Y | (60) |
| 16 | P07357 | C8A | 1189 | Complement component C8 alpha chain | Y | (59) |
| 17 | P02748 | C9 | 7324 | Complement component C9 | Y | (59) |
| 18 | B4E1Z4 | CFB | 6621 | Complement factor B | Y | (59) |
| 19 | P08603 | CFH | 35443 | Complement factor H | Y | (59) |
| 20 | Q03591 | CFHR1 | 2208 | Complement factor H-related protein 1 | Y | (59) |
| 21 | Q02985 | CFHR3 | 791 | Complement factor H-related protein 3 | Y | (59) |
| 22 | P10909 | CLU | 8364 | Clusterin | Y | (60) |
| 23 | P00450 | CP | 50977 | Ceruloplasmin | Y | (59) |
| 24 | P22792 | CPN2 | 417 | Carboxypeptidase N subunit 2 | Y | (59) |
| 25 | E9PIT3 | F2 | 2800 | Thrombin light chain | Y | (59) |
| 26 | Q9Y6R7 | FCGBP | 980 | IgGFc-binding protein | Y | (60) |
| 27 | P02671 | FGA | 1132 | Fibrinogen alpha chain | Y | (59) |
| 28 | P02675 | FGB | 14861 | Fibrinogen beta chain | Y | (59) |
| 29 | C9JC84 | FGG | 10296 | Fibrinogen gamma chain | Y | (59) |
| 30 | F8W7G7 | FN1 | 259 | Fibronectin | Y | (59) |
| 31 | P00738 | HP | 166762 | Haptoglobin | Y | (59) |
| 32 | P00739 | HPR | 136434 | Haptoglobin-related protein | Y | (59) |
| 33 | P02790 | HPX | 32600 | Hemopexin | Y | (59) |
| 34 | P04196 | HRG | 17014 | Histidine-rich glycoprotein | Y | (59) |
| 35 | P01591 | IGJ | 1829 | Immunoglobulin J chain | Y | (60) |
| 36 | H7C4N8 | ITGB1 | 105 | Integrin beta-1 | Y | (59) |
| 37 | F5H7E1 | ITIH1 | 1655 | Inter-alpha-trypsin inhibitor heavy chain H1 | Y | (59) |
| 38 | Q5T985 | ITIH2 | 15178 | Inter-alpha-trypsin inhibitor heavy chain H2 | Y | (59) |
| 39 | Q14624-2 | ITIH4 | 5879 | Isoform 2 of Inter-alpha-trypsin inhibitor heavy chain H4 | Y | (59) |
| 40 | P01042-2 | KNG1 | 47217 | Isoform LMW of Kininogen-1 | Y | (59) |
| 41 | H0YCG2 | LAMP2 | 242 | Lysosome-associated membrane glycoprotein 2 | Y | (61) |
| 42 | Q08380 | LGALS3BP | 3599 | Galectin-3-binding protein | Y | (59) |
| 43 | Q07954 | LRP1 | 562 | Prolow-density lipoprotein receptor-related protein 1 | Y | (60) |
| 44 | F8W876 | MASP1 | 78 | Mannan-binding lectin serine protease 1 heavy chain | Y | (60) |
| 45 | O00187 | MASP2 | 85.18 | Mannan-binding lectin serine protease 2 | Y | (60) |
| 46 | Q13201 | MMRN1 | 272 | Multimerin-1 | Y | (60) |
| 47 | P02763 | ORM1 | 3105 | Alpha-1-acid glycoprotein 1 | Y | (59) |
| 48 | P19652 | ORM2 | 968 | Alpha-1-acid glycoprotein 2 | Y | (59) |
| 49 | P01833 | PIGR | 81 | Polymeric immunoglobulin receptor | Y | (60) |
| 50 | P27169 | PON1 | 15059 | Serum paraoxonase/arylesterase 1 | Y | (59) |
| 51 | P01009 | SERPINA1 | 28362 | Alpha-1-antitrypsin | Y | (60) |
| 52 | G3V5I3 | SERPINA3 | 16582 | Alpha-1-antichymotrypsin | Y | (59) |
| 53 | P01008 | SERPINC1 | 16622 | Antithrombin-III | Y | (59) |
| 54 | B4E1F0 | SERPING1 | 20410 | Plasma protease C1 inhibitor | Y | (59) |
| 55 | P02787 | TF | 27433 | Serotransferrin | Y | (59) |
| 56 | P07996 | THBS1 | 87 | Thrombospondin-1 | Y | (60) |
| 57 | P04004 | VTN | 18138 | Vitronectin | Y | (60) |
| 58 | P04275 | VWF | 281 | Von Willebrand factor | Y | (60) |
Next, to evaluate the dynamic range of detection using our method, we conducted literature surveys to assess the approximate concentrations of the plasma glycoproteins identified in our study. A total 62% of the 127 glycoproteins identified in our report were present in the μg/ml–mg/ml concentration range, and were annotated among the top 150 “high abundant” plasma proteins (Table III). The 12 most abundant components of plasma comprise ∼95% of the total protein content, and albumin alone accounts for around 50% of all plasma protein (62, 63). Importantly, these high abundant plasma components did not hinder our detection of 48 low abundant proteins that were identified in the range of pg/ml–ng/ml, including vascular endothelial growth factor receptor 3 (FLT4; 4.1 ng/ml) (64), multiple epidermal growth factor-like domains protein 8 (MEGF8; 4.3pg/ml) (64), and cysteine-rich secretory protein 3 (CRISP3; 6.3 pg/ml) (65). In order to establish unambiguous identification, a precursor ion mass tolerance of 5 ppm and peptide FDR ≤ 1% was used in this study. The use of a narrow mass tolerance of 5ppm eliminates the miss-assignment of C13 peak of the native peptide as deamidated peptide (66, 67). 137 unique glycosylated peptides assigned to 48 low abundant proteins were statistically matched (p < 0.05) and most deamidated peptides have been identified with high mascot score and low expect values (e.g. MEGF8 (ALLTNVSSVALGSR), Peptide Score: 119.99, Expect value: 1.60E-10; FLT4 (LVIQNANVSAMYK), Peptide Score: 53.85, Expect value: 0.00093; CRISP3 (DSCKASCNCSNSIY), Peptide Score: 47.72, Expect value: 5.50E-05), which indicates the unambiguous identification of homologous protein (detailed information available in supplemental Data S2, worksheet PNGaseLowAbund03). The pertinent MS/MS spectra and fragment ion assignment of all 137 low abundant peptides MS/MS spectra and fragment ion assignment have been manually curated and documented in supplemental Information S2. In addition, complementary sequence homology search on all individual low abundant glycosylated peptide sequences (deamidated with D residue) and on their nonmodified counterparts (native with N residue) were submitted to NCBI BLASTP (50, 51). The protein homologues hits obtained from the BLASTP (50, 51) search were consistent with the protein hits obtained from Mascot search (detailed information available in supplemental Information S3), the overall sequence identity when examined among species was found to be considerably high (> 90%), and found that none of these peptides shares sequence homology to another protein in the NCBI nr database. Thus, we conclude that the possibility of low abundant protein miss-assignment by Mascot is considerably low in our data set.
Table III. Estimated concentrations of the identified plasma glycoproteins (literature survey).
| No. | UniProt accession no. | No. unique peptide(s) | Protein description | Top 150 plasma proteinsa | Conc. in plasma (mg/ml)b | Ref. |
|---|---|---|---|---|---|---|
| 1 | P04217 | 3 | Alpha-1B-glycoprotein | Y | 0.133 | (71) |
| 2 | P01023 | 6 | Alpha-2-macroglobulin | Y | 1.609 | (64) |
| 3 | P43652 | 4 | Afamin | Y | 0.035 | (71) |
| 4 | C9JV77 | 10 | Alpha-2-HS-glycoprotein | Y | 0.082 | (72) |
| 5 | P02768 | 2 | Serum albumin | Y | 33.3 | (64) |
| 6 | P02760 | 19 | Protein AMBP | Y | 0.048 | (72) |
| 7 | K7EKF6 | 2 | Angiopoietin-related protein 6 | N | *NA | *NA |
| 8 | H0Y512 | 2 | Adipocyte plasma membrane-associated protein | N | 0.000029 | (72) |
| 9 | P04114 | 5 | Apolipoprotein B-100 | Y | 0.2989 | (71) |
| 10 | K7EMC3 | 1 | Apolipoprotein C-IV | Y | 4.6 | (72) |
| 11 | C9JF17 | 9 | Apolipoprotein D | Y | 0.082 | (72) |
| 12 | P02749 | 12 | Beta-2-glycoprotein 1 | Y | 0.0725 | (71) |
| 13 | Q5SRP5 | 3 | Apolipoprotein M | Y | 0.0015 | (72) |
| 14 | O75882 | 9 | Attractin | Y | 0.00066 | (72) |
| 15 | F8WF14 | 10 | Cholinesterase | Y | 0.00017 | (72) |
| 16 | B4DLJ9 | 7 | Biotinidase | Y | 0.00049 | (72) |
| 17 | P02745 | 3 | Complement C1q subcomponent subunit A | Y | 0.0012 | (72) |
| 18 | H0YFH3 | 3 | Complement C1r subcomponent | Y | 0.0043 | (72) |
| 19 | Q9NZP8 | 2 | Complement C1r subcomponent-like protein | N | 0.00026 | (72) |
| 20 | F8WCZ6 | 2 | Complement C1s subcomponent | Y | 0.0052 | (72) |
| 21 | P01024 | 1 | Complement C3 | Y | 1.73 | (65) |
| 22 | P0C0L5 | 3 | Complement C4-B | Y | 0.104 | (71) |
| 23 | P04003 | 12 | C4b-binding protein alpha chain | Y | 0.011 | (72) |
| 24 | Q5VVQ7 | 8 | C4b-binding protein beta chain | Y | 0.00053 | (72) |
| 25 | P13671 | 1 | Complement component C6 | Y | 0.0037 | (72) |
| 26 | P07357 | 4 | Complement component C8 alpha chain | Y | 0.0024 | (72) |
| 27 | F5GY80 | 1 | Complement component C8 beta chain | Y | 0.0028 | (72) |
| 28 | P02748 | 3 | Complement component C9 | Y | 0.01393 | (71) |
| 29 | H0Y2P0 | 1 | CD44 antigen | N | 0.000035 | (72) |
| 30 | P33151 | 1 | Cadherin-5 | N | 0.00011 | (72) |
| 31 | E9PPW2 | 1 | Cadherin-related family member 5 | N | 0.0000044 | (72) |
| 32 | B4E1Z4 | 16 | Complement factor B | Y | 0.00126 | (71) |
| 33 | P08603 | 25 | Complement factor H | Y | 0.0287 | (71) |
| 34 | Q03591 | 2 | Complement factor H-related protein 1 | Y | 0.057 | (72) |
| 35 | Q02985 | 1 | Complement factor H-related protein 3 | Y | 0.00014 | (72) |
| 36 | B1ALQ8 | 1 | Complement factor H-related protein 4 | Y | 0.000059 | (72) |
| 37 | Q5VYL6 | 1 | Complement factor H-related protein 5 | Y | 0.000011 | (72) |
| 38 | G3XAM2 | 7 | Complement factor I light chain | Y | 0.0000057 | (72) |
| 39 | P10909 | 9 | Clusterin | Y | 0.0914 | (71) |
| 40 | J3KRP0 | 2 | Beta-Ala-His dipeptidase | Y | 0.00023 | (72) |
| 41 | P00450 | 12 | Ceruloplasmin | Y | 0.0649 | (71) |
| 42 | Q96IY4 | 4 | Carboxypeptidase B2 | Y | 0.0007 | (72) |
| 43 | P22792 | 3 | Carboxypeptidase N subunit 2 | Y | 0.002 | (72) |
| 44 | J3KPA1 | 1 | Cysteine-rich secretory protein 3 | N | 6.30E-09 | (73) |
| 45 | Q5T382 | 2 | Dopamine beta-hydroxylase | N | 0.00011 | (72) |
| 46 | P03951 | 5 | Coagulation factor XI | N | 0.000063 | (72) |
| 47 | P00748 | 2 | Coagulation factor XII | N | 0.0143 | (65) |
| 48 | P05160 | 1 | Coagulation factor XIII B chain | Y | 0.00096 | (72) |
| 49 | E9PIT3 | 6 | Thrombin light chain | N | 0.00941 | (71) |
| 50 | P12259 | 5 | Coagulation factor V | Y | 0.006417 | (65) |
| 51 | B1AHL2 | 3 | Fibulin-1 | Y | 0.00062 | (72) |
| 52 | Q9Y6R7 | 3 | IgGFc-binding protein | N | 0.0003 | (72) |
| 53 | P02671 | 1 | Fibrinogen alpha chain | Y | 1.5 | (71) |
| 54 | P02675 | 7 | Fibrinogen beta chain | Y | 0.706 | (71) |
| 55 | C9JC84 | 8 | Fibrinogen gamma chain | Y | 0.0233 | (71) |
| 56 | E9PD35 | 1 | Vascular endothelial growth factor receptor 3 | N | 0.0000041 | (72) |
| 57 | F8W7G7 | 2 | Fibronectin | Y | 0.02 | (72) |
| 58 | Q8NBJ4 | 1 | Golgi membrane protein 1 | N | 0.0000092 | (72) |
| 59 | P80108 | 8 | Phosphatidylinositol-glycan-specific phospholipase D | Y | 0.00046 | (72) |
| 60 | Q8IZF2 | 1 | Probable G-protein coupled receptor 116 | N | 0.000012 | (72) |
| 61 | Q9ULI3 | 1 | Protein HEG homolog 1 | N | 0.0000066 | (72) |
| 62 | D6RAR4 | 1 | Hepatocyte growth factor activator | N | 0.00024 | (72) |
| 63 | P00738 | 69 | Haptoglobin | Y | 1.1 | (71) |
| 64 | P00739 | 1 | Haptoglobin-related protein | Y | 0.0407 | (74) |
| 65 | P02790 | 8 | Hemopexin | Y | 0.4762 | (71) |
| 66 | P04196 | 2 | Histidine-rich glycoprotein | Y | 0.035 | (72) |
| 67 | P05362 | 2 | Intercellular adhesion molecule 1 | N | 0.000071 | (72) |
| 68 | J3QQX6 | 1 | Intercellular adhesion molecule 2 | N | 0.000037 | (72) |
| 69 | P35858 | 2 | Insulin-like growth factor-binding protein complex acid labile subunit | N | 0.0015 | (72) |
| 70 | B3KWK7 | 3 | Insulin-like growth factor binding protein 3, isoform CRA | Y | 0.0057 | (72) |
| 71 | P01876 | 6 | Ig alpha-1 chain C region | Y | *NA | *NA |
| 72 | P01877 | 1 | Ig alpha-2 chain C region | Y | *NA | *NA |
| 73 | P01857 | 1 | Ig gamma-1 chain C region | Y | *NA | *NA |
| 74 | P01859 | 1 | Ig gamma-2 chain C region | Y | *NA | *NA |
| 75 | P01860 | 1 | Ig gamma-3 chain C region | Y | *NA | *NA |
| 76 | P01861 | 1 | Ig gamma-4 chain C region | Y | 0.32 | (72) |
| 77 | P01871 | 9 | Ig mu chain C region | Y | 0.32 | (72) |
| 78 | P01591 | 3 | Immunoglobulin J chain | Y | 0.0056 | (72) |
| 79 | H7C4N8 | 1 | Integrin beta-1 | N | 0.000011 | (72) |
| 80 | F5H7E1 | 6 | Inter-alpha-trypsin inhibitor heavy chain H1 | Y | 0.024 | (72) |
| 81 | Q5T985 | 3 | Inter-alpha-trypsin inhibitor heavy chain H2 | Y | 0.021 | (72) |
| 82 | Q06033 | 2 | Inter-alpha-trypsin inhibitor heavy chain H3 | Y | 0.002 | (72) |
| 83 | Q14624-2 | 6 | Isoform 2 of Inter-alpha-trypsin inhibitor heavy chain H4 | Y | 0.042 | (72) |
| 84 | H0YAC1 | 8 | Plasma kallikrein heavy chain | Y | 0.0026 | (72) |
| 85 | P01042-2 | 15 | Isoform LMW of Kininogen-1 | Y | 1.085 | (64) |
| 86 | H0YCG2 | 1 | Lysosome-associated membrane glycoprotein 2 | N | 0.0000073 | (72) |
| 87 | P04180 | 1 | Phosphatidylcholine-sterol acyltransferase | N | 0.00022 | (72) |
| 88 | Q08380 | 4 | Galectin-3-binding protein | N | 0.00044 | (72) |
| 89 | Q16609 | 1 | Putative apolipoprotein(a)-like protein 2 | Y | 0.0886 | (71) |
| 90 | P02750 | 4 | Leucine-rich alpha-2-glycoprotein | Y | 0.0027 | (72) |
| 91 | Q07954 | 1 | Prolow-density lipoprotein receptor-related protein 1 | N | 0.00002 | (72) |
| 92 | P51884 | 5 | Lumican | Y | 0.004 | (72) |
| 93 | Q9Y5Y7 | 1 | Lymphatic vessel endothelial hyaluronic acid receptor 1 | N | 0.0000062 | (72) |
| 94 | F8W876 | 2 | Mannan-binding lectin serine protease 1 heavy chain | N | 0.00024 | (72) |
| 95 | O00187 | 1 | Mannan-binding lectin serine protease 2 | N | 0.0028 | (72) |
| 96 | Q7Z7M0 | 1 | Multiple epidermal growth factor-like domains protein 8 | N | 4.30E-09 | (72) |
| 97 | Q13201 | 3 | Multimerin-1 | N | 0.0000072 | (72) |
| 98 | G3XAK1 | 3 | Hepatocyte growth factor-like protein alpha chain | N | 0.00025 | (72) |
| 99 | F8W6L6 | 1 | Myosin-10 | N | *NA | *NA |
| 100 | P02763 | 8 | Alpha-1-acid glycoprotein 1 | Y | 0.000383 | (64) |
| 101 | P19652 | 3 | Alpha-1-acid glycoprotein 2 | Y | 0.22 | (72) |
| 102 | Q96PD5 | 11 | N-acetylmuramoyl-l-alanine amidase | N | 0.014 | (72) |
| 103 | E7ER40 | 1 | PHD finger protein 3 | N | *NA | *NA |
| 104 | Q6UXB8 | 1 | Peptidase inhibitor 16 | N | 0.000041 | (72) |
| 105 | P01833 | 2 | Polymeric immunoglobulin receptor | N | 0.000025 | (72) |
| 106 | B3KUE5 | 3 | Phospholipid transfer protein | N | 0.000064 | (72) |
| 107 | P27169 | 3 | Serum paraoxonase/arylesterase 1 | Y | 0.0077 | (72) |
| 108 | Q15166 | 1 | Serum paraoxonase/lactonase 3 | Y | 0.000011 | (72) |
| 109 | H0Y5A1 | 2 | Prostaglandin-H2 d-isomerase | N | 0.012 | (72) |
| 110 | P35542 | 1 | Serum amyloid A-4 protein | Y | 0.03 | (72) |
| 111 | P14151 | 3 | l-selectin | N | 0.000936 | (64) |
| 112 | D6REX5 | 9 | Selenoprotein P | Y | 0.00051 | (72) |
| 113 | P01009 | 6 | Alpha-1-antitrypsin | Y | 0.1374 | (71) |
| 114 | G3V5I3 | 12 | Alpha-1-antichymotrypsin | Y | 0.11 | (72) |
| 115 | P29622 | 3 | Kallistatin | Y | 0.0011 | (72) |
| 116 | G3V350 | 2 | Corticosteroid-binding globulin | Y | 0.0012 | (72) |
| 117 | P05543 | 2 | Thyroxine-binding globulin | Y | 0.0013 | (72) |
| 118 | P01008 | 9 | Antithrombin-III | Y | 0.058 | (65) |
| 119 | P05546 | 8 | Heparin cofactor 2 | Y | 0.044 | (65) |
| 120 | I3L4N7 | 1 | Pigment epithelium-derived factor | Y | 0.00736 | (71) |
| 121 | B4E1F0 | 8 | Plasma protease C1 inhibitor | Y | 0.012 | (72) |
| 122 | B0FWH6 | 2 | Sex hormone-binding globulin | Y | 0.00026 | (72) |
| 123 | B5MCY1 | 1 | Tudor domain-containing protein 15 | N | *NA | *NA |
| 124 | P02787 | 13 | Serotransferrin | Y | 1.5 | (71) |
| 125 | P07996 | 2 | Thrombospondin-1 | N | 0.00051 | (72) |
| 126 | P04004 | 6 | Vitronectin | Y | 0.0197 | (64) |
| 127 | P04275 | 3 | Von Willebrand factor | Y | 0.007698 | (64) |
* NA, data not available.
a Top 150 plasma protein annotation obtained from Hortin etal. (62).
a Approximate plasma concentration in mg/ml (obtained fromlisted references).
Because our enrichment method enabled the efficient detection of low abundant glycoproteins in plasma, it may be possible to use this technique to identify N-glycosylated biomarkers and potential therapeutic targets in human patient samples. Indeed, our analyses of human plasma from heart disease patients revealed the presence of lymphatic vessel endothelial hyaluronic acid receptor 1 (LYVE1), a lymphangiogenic glycoprotein which is reportedly involved in myocardial remodeling after infarction (68, 69). Our novel PUC-ERLIC approach may therefore enable the detection of cardiac glycoproteins involved in myocardial healing, and could potentially be used to identify biomarkers of distinct clinical outcomes in patients undergoing heart surgery. The fact that we achieved a dynamic range of detection greater than 108 without the use of any immunodepletion strategies also reflects the effectiveness of PUC-ERLIC for reducing plasma complexity. These data show that provided the samples are prepared well prior to analysis, it is possible to increase the depth of glycoproteomic data obtained from complex biological samples by developing sensitive detection technologies, and that these technologies have significant potential to uncover novel biomarkers of diseases.
Functional Annotation of Plasma Glycoproteins
In order to determine the utility of PUC-ERLIC for the identification of glycoproteomic biomarkers for possible use in the clinic, we next assessed the molecular functions, biological processes, and subcellular localization of the secretory and extracellular vesicle-derived molecules identified in our study. To do this, we conducted Gene Ontology (GO) annotation using tools including STRAP1.5 (45), AmiGO2 (46, 47), and DAVID v6.7 (48, 49) (detailed annotation available in supplemental Data S5, worksheet GOAnn). GO molecular function categorization (Fig. 6A) suggested that binding activity (50.6%) was overrepresented among the glycoproteins we identified, followed by catalytic activity (18.3%) and regulation of enzyme activity (15.2%), all of which are known molecular roles of N-glycoproteins. The principal biological functions associated with these molecules were regulation (28.0%), cellular processes (16%), and metabolic processes or responses to stimuli (12%) (Fig. 6B). Glycoproteins involved in immune responses and interaction with cells and organisms were equally well represented in our data set (both 9%). Other known physiological functions of glycoproteins such as localization (9%), developmental processes (6%) and cell growth (1%) were also annotated.
Fig. 6.

Gene Ontology (GO) functional annotation showing the proportionate distribution of identified glycoproteins according to their (A) molecular functions, (B) biological processes, and (C) cellular localization. Predictions were obtained using STRAP v1.5(45), AmiGO v2(46, 47) and DAVID v6.7(48, 49).
Because of the location of glycosyltransferase in the endoplasmic reticulum (ER) and golgi apparatus, N-glycosylation is typically restricted to secreted proteins and extracellular membrane proteins (2). Some of the N-glycosylated proteins in our combined data set (9.9%) exhibited annotations in atypical locations (cytoplasmic, nuclear, or mitochondrial), but further analysis revealed that these annotations were nonexclusive. In contrast, GO annotation of subcellular localization for the remaining glycoproteins predicted that the majority (69.4%) were either extracellular or expressed at the plasma membrane (Fig. 6C). Consistent with these data, we also detected two extracellular vesicle-specific proteins (GO:0070062); Cadherin-related family member 5 (CDHR5) and Lysosome-associated membrane glycoprotein 2 (LAMP2).
Extraction of membrane proteins, which comprise 20–30% of the total proteome, has until now been extremely challenging because of their low abundance in accessible biological fluids and the inherent hydrophobicity of cellular membranes (70). Strikingly, our results show that substantial recovery of glycosylated plasma membrane proteins (20.3%) can be achieved by PUC-ERLIC, in parallel with the enrichment of secreted N-glycosylated proteins, thus enabling a wide range of proteomic coverage that could be applied to the identification of candidate biomarkers (or combinations of biomarkers), as well as the discovery of potential therapeutic targets in human diseases.
CONCLUSIONS
Circulating glycoproteins and extracellular vesicles secreted from damaged/infected host cells and tissues represent excellent sources of potential biomarkers of human pathologies. In this study, we showed that glycoprotein enrichment by PUC-ERLIC facilitates the simultaneous recovery of both secretory and extracellular vesicle-derived glycoproteins from nondepleted human plasma, which could in part be attributed to the synergistic effects of using PUC and ERLIC in combination. When using PUC, we were able to recover a yellow, extracellular vesicle-containing fraction (confirmed by cryo-EM, Western blot and proteomic analyses), and this fraction was found to be highly enriched in secretory glycoproteins that could potentially be probed for prognostic/diagnostic biomarkers. Indeed, the low levels of chemical deamidation observed in our study and correspondingly low FDR (0.68%) indicates that our approach enabled both significant glycoprotein enrichment and robust assignment of N-glycosylation sites, thus achieving the level of performance and accuracy required to enable these data to be translated into real clinical applications.
In sum, in a single LC-MS/MS run, we confidently identified a total of 127 glycoproteins in human plasma samples, including 599 unique glycopeptides and 361 unique glycosylation sites (FDR ≤ 1%). Our novel PUC-ERLIC method enabled the detection of 48 low-abundant glycoproteins (pg/ml–ng/ml) in human plasma without the need for prior depletion of high-abundance molecules, hence this approach may offer a new way of overcoming the technical challenges associated with delineating the complex protein composition of human plasma. Using plasma obtained from heart disease patients, we have identified, LYVE1, a cardiac-specific remodeling glycoprotein that has been reported to be involved in myocardium healing. The proteomics data set obtained in this study not only directly addresses the current paucity of knowledge on the glycoproteomic composition of extracellular vesicles in human plasma, but also show potential to assist the future development of candidate biomarkers for use in a wide variety of clinical diseases.
Supplementary Material
Acknowledgments
We thank Dr. Andrew Wong from the Division of Structural Biology and Biochemistry at Nanyang Technological University for his assistance with the Cryo-EM images.
Footnotes
Author contributions: E.C. and S.S. designed research; E.C. and K.S. performed research; D.d., C.L., V.S., and S.S. contributed new reagents or analytic tools; E.C. and S.S. analyzed data; E.C., D.d., and S.S. wrote the paper.
* This work is in part supported by the Singapore National Research Foundation under its CBRG (NMRC/CBRG/0004/2012) administered by the Singapore Ministry of Health's National Medical Research Council, and the Singapore National Research Foundation under its CRP (NRF2011 NRF-CRP 001-109).
 This article contains supplemental Procedures, Information S1 to S3, Data, S1 to S5, and Fig. S1.
1 The abbreviations used are:
- ACN
- Acetonitrile
- ALIX/PDCD6IP
- Programmed cell death 6-interacting protein
- BCA
- Bicinchoninic acid
- CABG
- Coronary artery bypass graft surgery
- CD63
- CD 63 Antigen
- CD81
- CD 81 Antigen
- CD9
- CD 9 Antigen
- CID
- Collision induced dissociation
- DTT
- Dithiothreitol
- EM
- Electron microscopy
- ERLIC
- Electrostatic repulsion-hydrophilic interaction chromatography
- FA
- Formic acid
- FDR
- False Discovery Rate
- FLOT1
- Flotillin-1
- GO
- Gene ontology
- HPLC
- High performance liquid chromatography
- HSP70
- Heat shock 70 kDa protein 1A/1B
- IAA
- Iodoacetamide
- LC
- Liquid chromatography
- MARS
- Multiple Affinity Removal System
- MS
- Mass spectrometry
- NUHS
- National University Hospital Singapore
- PBS
- Phosphate buffer saline
- PTM
- Post-translational modification
- PUC
- Prolonged ultracentrifugation
- TSG101
- Tumor susceptibility gene 101 protein
- UC
- Ultracentrifugation.
REFERENCES
- 1. Shao H., Chung J., Balaj L., Charest A., Bigner D. D., Carter B. S., Hochberg F. H., Breakefield X. O., Weissleder R., Lee H. (2012) Protein typing of circulating microvesicles allows real-time monitoring of glioblastoma therapy. Nat, Med. 18, 1835–1840 [DOI] [PMC free article] [PubMed] [Google Scholar]
- 2. Zielinska D. F., Gnad F., Wisniewski J. R., Mann M. (2010) Precision mapping of an in vivo N-glycoproteome reveals rigid topological and sequence constraints. Cell 141, 897–907 [DOI] [PubMed] [Google Scholar]
- 3. Kaji H., Shikanai T., Sasaki-Sawa A., Wen H., Fujita M., Suzuki Y., Sugahara D., Sawaki H., Yamauchi Y., Shinkawa T., Taoka M., Takahashi N., Isobe T., Narimatsu H. (2012) Large-scale identification of N-glycosylated proteins of mouse tissues and construction of a glycoprotein database, GlycoProtDB. J. Proteome Res. 11, 4553–4566 [DOI] [PubMed] [Google Scholar]
- 4. Zielinska D. F., Gnad F., Schropp K., Wisniewski J. R., Mann M. (2012) Mapping N-glycosylation sites across seven evolutionarily distant species reveals a divergent substrate proteome despite a common core machinery. Mol. Cell 46, 542–548 [DOI] [PubMed] [Google Scholar]
- 5. Berven F. S., Ahmad R., Clauser K. R., Carr S. A. (2010) Optimizing performance of glycopeptide capture for plasma proteomics. J. Proteome Res. 9, 1706–1715 [DOI] [PMC free article] [PubMed] [Google Scholar]
- 6. Ahn Y. H., Kim K. H., Shin P. M., Ji E. S., Kim H., Yoo J. S. (2012) Identification of low-abundance cancer biomarker candidate TIMP1 from serum with lectin fractionation and peptide affinity enrichment by ultrahigh-resolution mass spectrometry. Anal. Chem. 84, 1425–1431 [DOI] [PubMed] [Google Scholar]
- 7. Qu Y., Xia S., Yuan H., Wu Q., Li M., Zou L., Zhang L., Liang Z., Zhang Y. (2011) Integrated sample pretreatment system for N-linked glycosylation site profiling with combination of hydrophilic interaction chromatography and PNGase F immobilized enzymatic reactor via a strong cation exchange precolumn. Anal. Chem. 83, 7457–7463 [DOI] [PubMed] [Google Scholar]
- 8. Hakimi A., Auluck J., Jones G. D., Ng L. L., Jones D. J. (2014) Assessment of reproducibility in depletion and enrichment workflows for plasma proteomics using label-free quantitative data-independent LC-MS. Proteomics 14, 4–13 [DOI] [PubMed] [Google Scholar]
- 9. Tang H. Y., Ali-Khan N., Echan L. A., Levenkova N., Rux J. J., Speicher D. W. (2005) A novel four-dimensional strategy combining protein and peptide separation methods enables detection of low-abundance proteins in human plasma and serum proteomes. Proteomics 5, 3329–3342 [DOI] [PubMed] [Google Scholar]
- 10. Keshishian H., Addona T., Burgess M., Kuhn E., Carr S. A. (2007) Quantitative, multiplexed assays for low abundance proteins in plasma by targeted mass spectrometry and stable isotope dilution. Mol. Cell. Proteomics 6, 2212–2229 [DOI] [PMC free article] [PubMed] [Google Scholar]
- 11. Gonzalez-Begne M., Lu B., Liao L., Xu T., Bedi G., Melvin J. E., Yates J. R., 3rd (2011) Characterization of the human submandibular/sublingual saliva glycoproteome using lectin affinity chromatography coupled to multidimensional protein identification technology. J. Proteome Res. 10, 5031–5046 [DOI] [PMC free article] [PubMed] [Google Scholar]
- 12. Jung K., Cho W., Regnier F. E. (2009) Glycoproteomics of plasma based on narrow selectivity lectin affinity chromatography. J. Proteome Res. 8, 643–650 [DOI] [PubMed] [Google Scholar]
- 13. Tian Y., Zhou Y., Elliott S., Aebersold R., Zhang H. (2007) Solid-phase extraction of N-linked glycopeptides. Nat. Protoc. 2, 334–339 [DOI] [PMC free article] [PubMed] [Google Scholar]
- 14. Alvarez-Manilla G., Atwood J., 3rd, Guo Y., Warren N. L., Orlando R., Pierce M. (2006) Tools for glycoproteomic analysis: size exclusion chromatography facilitates identification of tryptic glycopeptides with N-linked glycosylation sites. J. Proteome Res. 5, 701–708 [DOI] [PubMed] [Google Scholar]
- 15. Li H., Liu Z. (2012) Recent advances in monolithic column-based boronate-affinity chromatography. TrAC Trends Anal. Chem. 37, 148–161 [Google Scholar]
- 16. Palmisano G., Lendal S. E., Engholm-Keller K., Leth-Larsen R., Parker B. L., Larsen M. R. (2010) Selective enrichment of sialic acid-containing glycopeptides using titanium dioxide chromatography with analysis by HILIC and mass spectrometry. Nat. Protoc. 5, 1974–1982 [DOI] [PubMed] [Google Scholar]
- 17. Alpert A. J., Shukla M., Shukla A. K., Zieske L. R., Yuen S. W., Ferguson M. A., Mehlert A., Pauly M., Orlando R. (1994) Hydrophilic-interaction chromatography of complex carbohydrates. J. Chromatogr. A 676, 191–122 [DOI] [PubMed] [Google Scholar]
- 18. Calvano C. D., Zambonin C. G., Jensen O. N. (2008) Assessment of lectin and HILIC based enrichment protocols for characterization of serum glycoproteins by mass spectrometry. J. Proteomics 71, 304–317 [DOI] [PubMed] [Google Scholar]
- 19. Lewandrowski U., Lohrig K., Zahedi R., Walter D., Sickmann A. (2008) Glycosylation site analysis of human platelets by electrostatic repulsion hydrophilic interaction chromatography. Clin. Proteomics 4, 25–36 [Google Scholar]
- 20. Zhang H., Guo T., Li X., Datta A., Park J. E., Yang J., Lim S. K., Tam J. P., Sze S. K. (2010) Simultaneous characterization of glyco- and phosphoproteomes of mouse brain membrane proteome with electrostatic repulsion hydrophilic interaction chromatography. Mol. Cell. Proteomics 9, 635–647 [DOI] [PMC free article] [PubMed] [Google Scholar]
- 21. Bellei E., Bergamini S., Monari E., Fantoni L. I., Cuoghi A., Ozben T., Tomasi A. (2011) High-abundance proteins depletion for serum proteomic analysis: concomitant removal of nontargeted proteins. Amino Acids 40, 145–156 [DOI] [PubMed] [Google Scholar]
- 22. Cocucci E., Racchetti G., Meldolesi J. (2009) Shedding microvesicles: artefacts no more. Trends Cell Biol. 19, 43–51 [DOI] [PubMed] [Google Scholar]
- 23. van der Pol E., Boing A. N., Harrison P., Sturk A., Nieuwland R. (2012) Classification, functions, and clinical relevance of extracellular vesicles. Pharmacol. Rev. 64, 676–705 [DOI] [PubMed] [Google Scholar]
- 24. Simpson R. J., Lim J. W. E., Moritz R. L., Mathivanan S. (2009) Exosomes: proteomic insights and diagnostic potential. Exp. Rev. Proteomics 6, 267–283 [DOI] [PubMed] [Google Scholar]
- 25. Leroyer A., Tedgui A., Boulanger C. (2008) Role of microparticles in atherothrombosis. J. Int. Med. 263, 528–537 [DOI] [PubMed] [Google Scholar]
- 26. Bala S., Petrasek J., Mundkur S., Catalano D., Levin I., Ward J., Alao H., Kodys K., Szabo G.(2012) Circulating microRNAs in exosomes indicate hepatocyte injury and inflammation in alcoholic, drug-induced, and inflammatory liver diseases. Hepatology 56, 1946–1957 [DOI] [PMC free article] [PubMed] [Google Scholar]
- 27. Skog J., Würdinger T., Van Rijn S., Meijer D. H., Gainche L., Curry W. T., Carter B. S., Krichevsky A. M., Breakefield X. O. (2008) Glioblastoma microvesicles transport RNA and proteins that promote tumour growth and provide diagnostic biomarkers. Nat. Cell Biol. 10, 1470–1476 [DOI] [PMC free article] [PubMed] [Google Scholar]
- 28. Choudhuri K., Llodra J., Roth E. W., Tsai J., Gordo S., Wucherpfennig K. W., Kam L. C., Stokes D. L., Dustin M. L. (2014) Polarized release of T-cell-receptor-enriched microvesicles at the immunological synapse. Nature 507, 118–123 [DOI] [PMC free article] [PubMed] [Google Scholar]
- 29. Chen T., Guo J., Yang M., Zhu X., Cao X. (2011) Chemokine-containing exosomes are released from heat-stressed tumor cells via lipid raft-dependent pathway and act as efficient tumor vaccine. J. Immunol. 186, 2219. [DOI] [PubMed] [Google Scholar]
- 30. Mittelbrunn M., Gutierrez-Vazquez C., Villarroya-Beltri C., Gonzalez S., Sanchez-Cabo F., Gonzalez M. A., Bernad A., Sanchez-Madrid F. (2011) Unidirectional transfer of microRNA-loaded exosomes from T cells to antigen-presenting cells. Nat. Commun. 2, 282. [DOI] [PMC free article] [PubMed] [Google Scholar]
- 31. Loyer X., Vion A. C., Tedgui A., Boulanger C. M. (2014) Microvesicles as cell–cell messengers in cardiovascular diseases. Circ. Res. 114, 345–353 [DOI] [PubMed] [Google Scholar]
- 32. Valadi H., Ekström K., Bossios A., Sjöstrand M., Lee J. J., Lötvall J. O. (2007) Exosome-mediated transfer of mRNAs and microRNAs is a novel mechanism of genetic exchange between cells. Nat. Cell Biol. 9, 654–659 [DOI] [PubMed] [Google Scholar]
- 33. Booth A. M., Fang Y., Fallon J. K., Yang J. M., Hildreth J. E., Gould S. J. (2006) Exosomes and HIV Gag bud from endosome-like domains of the T cell plasma membrane. J. Cell Biol. 172, 923–935 [DOI] [PMC free article] [PubMed] [Google Scholar]
- 34. Fevrier B., Vilette D., Archer F., Loew D., Faigle W., Vidal M., Laude H., Raposo G. (2004) Cells release prions in association with exosomes. Proc. Natl. Acad. Sci. U.S.A. 101, 9683–9688 [DOI] [PMC free article] [PubMed] [Google Scholar]
- 35. Bernal-Mizrachi L., Jy W., Jimenez J. J., Pastor J., Mauro L. M., Horstman L. L., de Marchena E., Ahn Y. S. (2003) High levels of circulating endothelial microparticles in patients with acute coronary syndromes. Am. Heart J. 145, 962–970 [DOI] [PubMed] [Google Scholar]
- 36. Halkein J., Tabruyn S. P., Ricke-Hoch M., Haghikia A., Nguyen N. Q., Scherr M., Castermans K., Malvaux L., Lambert V., Thiry M., Sliwa K., Noel A., Martial J. A., Hilfiker-Kleiner D., Struman I. (2013) MicroRNA-146a is a therapeutic target and biomarker for peripartum cardiomyopathy. J. Clin. Invest. 123, 2143–2154 [DOI] [PMC free article] [PubMed] [Google Scholar]
- 37. Davila M., Amirkhosravi A., Coll E., Desai H., Robles L., Colon J., Baker C., Francis J. (2008) Tissue factor-bearing microparticles derived from tumor cells: impact on coagulation activation. J. Thromb. Haemost. 6, 1517–1524 [DOI] [PubMed] [Google Scholar]
- 38. D'Souza-Schorey C., Clancy J. W. (2012) Tumor-derived microvesicles: shedding light on novel microenvironment modulators and prospective cancer biomarkers. Genes Dev. 26, 1287–1299 [DOI] [PMC free article] [PubMed] [Google Scholar]
- 39. Sabatier F., Darmon P., Hugel B., Combes V., Sanmarco M., Velut J. G., Arnoux D., Charpiot P., Freyssinet J. M., Oliver C. (2002) Type 1 and type 2 diabetic patients display different patterns of cellular microparticles. Diabetes 51, 2840–2845 [DOI] [PubMed] [Google Scholar]
- 40. Rozmyslowicz T., Majka M., Kijowski J., Murphy S. L., Conover D. O., Poncz M., Ratajczak J., Gaulton G. N., Ratajczak M. Z. (2003) Platelet-and megakaryocyte-derived microparticles transfer CXCR4 receptor to CXCR4-null cells and make them susceptible to infection by X4-HIV. Aids 17, 33. [DOI] [PubMed] [Google Scholar]
- 41. Mack M., Kleinschmidt A., Bruhl H., Klier C., Nelson P. J., Cihak J., Plachy J., Stangassinger M., Erfle V., Schlondorff D. (2000) Transfer of the chemokine receptor CCR5 between cells by membrane-derived microparticles: a mechanism for cellular human immunodeficiency virus 1 infection. Nat. Med. 6, 769–775 [DOI] [PubMed] [Google Scholar]
- 42. Hao P., Ren Y., Alpert A. J., Sze S. K. (2011) Detection, evaluation, and minimization of nonenzymatic deamidation in proteomic sample preparation. Mol. Cell. Proteomics 10, O111 009381 [DOI] [PMC free article] [PubMed] [Google Scholar]
- 43. Hao P., Ren Y., Datta A., Tam J. P., Sze S. K. (2014) Evaluation of the Effect of Trypsin Digestion Buffers on Artificial Deamidation. Journal of proteome research 14, 1308–1314 [DOI] [PubMed] [Google Scholar]
- 44. Zhang H., Guo T., Li X., Datta A., Park J. E., Yang J., Lim S. K., Tam J. P., Sze S. K. (2010) Simultaneous characterization of glyco-and phosphoproteomes of mouse brain membrane proteome with electrostatic repulsion hydrophilic interaction chromatography. Mol. Cell. Proteomics 9, 635–647 [DOI] [PMC free article] [PubMed] [Google Scholar]
- 45. Bhatia V. N., Perlman D. H., Costello C. E., McComb M. E. (2009) Software tool for researching annotations of proteins: open-source protein annotation software with data visualization. Anal. Chem. 81, 9819–9823 [DOI] [PMC free article] [PubMed] [Google Scholar]
- 46. Ashburner M., Ball C. A., Blake J. A., Botstein D., Butler H., Cherry J. M., Davis A. P., Dolinski K., Dwight S. S., Eppig J. T., Harris M. A., Hill D. P., Issel-Tarver L., Kasarskis A., Lewis S., Matese J. C., Richardson J. E., Ringwald M., Rubin G. M., Sherlock G. (2000) Gene Ontology: tool for the unification of biology. The Gene Ontology Consortium. Nat. Genet. 25, 25–29 [DOI] [PMC free article] [PubMed] [Google Scholar]
- 47. Carbon S., Ireland A., Mungall C. J., Shu S., Marshall B., Lewis S. (2009) AmiGO: online access to ontology and annotation data. Bioinformatics 25, 288–289 [DOI] [PMC free article] [PubMed] [Google Scholar]
- 48. Huang da W., Sherman B. T., Lempicki R. A. (2009) Bioinformatics enrichment tools: paths toward the comprehensive functional analysis of large gene lists. Nucleic Acids Res. 37, 1–13 [DOI] [PMC free article] [PubMed] [Google Scholar]
- 49. Huang da W., Sherman B. T., Lempicki R. A. (2009) Systematic and integrative analysis of large gene lists using DAVID bioinformatics resources. Nat. Protoc. 4, 44–57 [DOI] [PubMed] [Google Scholar]
- 50. Altschul S. F., Gish W., Miller W., Myers E. W., Lipman D. J. (1990) Basic local alignment search tool. J. Mol. Biol. 215, 403–410 [DOI] [PubMed] [Google Scholar]
- 51. Altschul S. F., Madden T. L., Schäffer A. A., Zhang J., Zhang Z., Miller W., Lipman D. J. (1997) Gapped BLAST and PSI-BLAST: a new generation of protein database search programs. Nucleic Acids Res. 25, 3389–3402 [DOI] [PMC free article] [PubMed] [Google Scholar]
- 52. Ohno S., Ishikawa A., Kuroda M. (2013) Roles of exosomes and microvesicles in disease pathogenesis. Adv. Drug Deliv. Rev. 65, 398–401 [DOI] [PubMed] [Google Scholar]
- 53. Alpert A. J. (2008) Electrostatic repulsion hydrophilic interaction chromatography for isocratic separation of charged solutes and selective isolation of phosphopeptides. Anal. Chem. 80, 62–76 [DOI] [PubMed] [Google Scholar]
- 54. Beck F., Lewandrowski U., Wiltfang M., Feldmann I., Geiger J., Sickmann A., Zahedi R. P. (2011) The good, the bad, the ugly: validating the mass spectrometric analysis of modified peptides. Proteomics 11, 1099–1109 [DOI] [PubMed] [Google Scholar]
- 55. Robinson N. E. (2002) Protein deamidation. Proc. Natl. Acad. Sci. U.S.A. 99, 5283–5288 [DOI] [PMC free article] [PubMed] [Google Scholar]
- 56. Yang W., Laeyendecker O., Wendel S. K., Zhang B., Sun S., Zhou J.-Y., Ao M., Moore R. D., Jackson J. B., Zhang H. (2014) Glycoproteomic study reveals altered plasma proteins associated with HIV elite suppressors. Theranostics 4, 1153. [DOI] [PMC free article] [PubMed] [Google Scholar]
- 57. Drake P. M., Schilling B., Niles R. K., Braten M., Johansen E., Liu H., Lerch M., Sorensen D. J., Li B., Allen S., Hall S. C., Witkowska H. E., Regnier F. E., Gibson B. W., Fisher S. J. (2011) A lectin affinity workflow targeting glycosite-specific, cancer-related carbohydrate structures in trypsin-digested human plasma. Anal. Biochem. 408, 71–85 [DOI] [PMC free article] [PubMed] [Google Scholar]
- 58. Mathivanan S., Fahner C. J., Reid G. E., Simpson R. J. (2012) ExoCarta 2012: database of exosomal proteins, RNA, and lipids. Nucleic Acids Res. 40, D1241–D1244 [DOI] [PMC free article] [PubMed] [Google Scholar]
- 59. Bastos-Amador P., Royo F., Gonzalez E., Conde-Vancells J., Palomo-Diez L., Borras F. E., Falcon-Perez J. M. (2012) Proteomic analysis of microvesicles from plasma of healthy donors reveals high individual variability. J. Proteomics 75, 3574–3584 [DOI] [PubMed] [Google Scholar]
- 60. Looze C., Yui D., Leung L., Ingham M., Kaler M., Yao X., Wu W. W., Shen R.-F., Daniels M. P., Levine S. J. (2009) Proteomic profiling of human plasma exosomes identifies PPARγ as an exosome-associated protein. Biochem. Biophys. Res. Commun. 378, 433–438 [DOI] [PMC free article] [PubMed] [Google Scholar]
- 61. Caby M.-P., Lankar D., Vincendeau-Scherrer C., Raposo G., Bonnerot C. (2005) Exosomal-like vesicles are present in human blood plasma. Int. Immun. 17, 879–887 [DOI] [PubMed] [Google Scholar]
- 62. Hortin G. L., Sviridov D., Anderson N. L. (2008) High-abundance polypeptides of the human plasma proteome comprising the top four logs of polypeptide abundance. Clin. Chem. 54, 1608–1616 [DOI] [PubMed] [Google Scholar]
- 63. Hortin G. L., Sviridov D. (2010) The dynamic range problem in the analysis of the plasma proteome. J. Proteomics 73, 629–636 [DOI] [PubMed] [Google Scholar]
- 64. Percy A. J., Chambers A. G., Yang J., Borchers C. H. (2013) Multiplexed MRM-based quantitation of candidate cancer biomarker proteins in undepleted and nonenriched human plasma. Proteomics 13, 2202–2215 [DOI] [PubMed] [Google Scholar]
- 65. Percy A. J., Chambers A. G., Yang J., Domanski D., Borchers C. H. (2012) Comparison of standard- and nano-flow liquid chromatography platforms for MRM-based quantitation of putative plasma biomarker proteins. Anal. Bioanal. Chem. 404, 1089–1101 [DOI] [PubMed] [Google Scholar]
- 66. Hao P., Ren Y., Alpert A. J., Sze S. K. (2011) Detection, evaluation, and minimization of nonenzymatic deamidation in proteomic sample preparation. Mol. Cell. Proteomics 10, O111. 009381 [DOI] [PMC free article] [PubMed] [Google Scholar]
- 67. Nepomuceno A. I., Gibson R. J., Randall S. M., Muddiman D. C. (2013) Accurate identification of deamidated peptides in global proteomics using a quadrupole orbitrap mass spectrometer. J. Proteome Res. 13, 777–785 [DOI] [PMC free article] [PubMed] [Google Scholar]
- 68. Ishikawa Y., Akishima-Fukasawa Y., Ito K., Akasaka Y., Tanaka M., Shimokawa R., Kimura- Matsumoto M., Morita H., Sato S., Kamata I., Ishii T. (2007) Lymphangiogenesis in myocardial remodeling after infarction. Histopathology 51, 345–353 [DOI] [PMC free article] [PubMed] [Google Scholar]
- 69. Park J. H., Yoon J. Y., Ko S. M., Jin S. A., Kim J. H., Cho C. H., Kim J. M., Lee J. H., Choi S. W., Seong I. W., Jeong J. O. (2011) Endothelial progenitor cell transplantation decreases lymphangiogenesis and adverse myocardial remodeling in a mouse model of acute myocardial infarction. Exp. Mol. Med. 43, 479–485 [DOI] [PMC free article] [PubMed] [Google Scholar]
- 70. Mayne J., Starr A. E., Ning Z., Chen R., Chiang C. K., Figeys D. (2014) Fine tuning of proteomic technologies to improve biological findings: advancements in 2011–2013. Anal. Chem. 86, 176–195 [DOI] [PubMed] [Google Scholar]
- 71. Percy A. J., Chambers A. G., Smith D. S., Borchers C. H. (2013) Standardized protocols for quality control of MRM-based plasma proteomic workflows. J. Proteome Res. 12, 222–233 [DOI] [PubMed] [Google Scholar]
- 72. Farrah T., Deutsch E. W., Omenn G. S., Campbell D. S., Sun Z., Bletz J. A., Mallick P., Katz J. E., Malmstrom J., Ossola R., Watts J. D., Lin B., Zhang H., Moritz R. L., Aebersold R. (2011) A high-confidence human plasma proteome reference set with estimated concentrations in PeptideAtlas. Mol. Cell. Proteomics 10, M110 006353 [DOI] [PMC free article] [PubMed] [Google Scholar]
- 73. Udby L., Cowland J. B., Johnsen A. H., Sorensen O. E., Borregaard N., Kjeldsen L. (2002) An ELISA for SGP28/CRISP-3, a cysteine-rich secretory protein in human neutrophils, plasma, and exocrine secretions. J. Immunol. Methods 263, 43–55 [DOI] [PubMed] [Google Scholar]
- 74. Nielsen M. J., Petersen S. V., Jacobsen C., Oxvig C., Rees D., Moller H. J., Moestrup S. K. (2006) Haptoglobin-related protein is a high-affinity hemoglobin-binding plasma protein. Blood 108, 2846–2849 [DOI] [PubMed] [Google Scholar]
Associated Data
This section collects any data citations, data availability statements, or supplementary materials included in this article.