

Abstract
Histone post-translational modifications contribute to chromatin function through their chemical properties which influence chromatin structure and their ability to recruit chromatin interacting proteins. Nanoflow liquid chromatography coupled with high resolution tandem mass spectrometry (nanoLC-MS/MS) has emerged as the most suitable technology for global histone modification analysis because of the high sensitivity and the high mass accuracy of this approach that provides confident identification. However, analysis of histones with this method is even more challenging because of the large number and variety of isobaric histone peptides and the high dynamic range of histone peptide abundances. Here, we introduce EpiProfile, a software tool that discriminates isobaric histone peptides using the distinguishing fragment ions in their tandem mass spectra and extracts the chromatographic area under the curve using previous knowledge about peptide retention time. The accuracy of EpiProfile was evaluated by analysis of mixtures containing different ratios of synthetic histone peptides. In addition to label-free quantification of histone peptides, EpiProfile is flexible and can quantify different types of isotopically labeled histone peptides. EpiProfile is unique in generating layouts (i.e. relative retention time) of histone peptides when compared with manual quantification of the data and other programs (such as Skyline), filling the need of an automatic and freely available tool to quantify labeled and non-labeled modified histone peptides. In summary, EpiProfile is a valuable nanoflow liquid chromatography coupled with high resolution tandem mass spectrometry-based quantification tool for histone peptides, which can also be adapted to analyze nonhistone protein samples.
The nucleosome, the basic unit of chromatin, consists of 147 base pairs of DNA wrapped around histone proteins (H2A, H2B, H3, and H4). Histones play vital roles in chromatin, interacting with many signaling proteins and chromatin-structural proteins through various post-translational modifications (PTMs)1 (1–3). There are numerous PTMs on histones, including methylation (mono - me1, di - me2, tri - me3), acetylation (ac), phosphorylation (ph), ubiquitination, and SUMOylation (4). Histone PTMs can affect chromatin function, and therefore influence processes such as gene accessibility, DNA repair and chromosome condensation. Moreover, histone PTMs cross-talk in a synergistic manner to fine-tune gene expression (5). Therefore, quantification of histone PTMs has become a high priority to investigate cell regulation and epigenetics (6).
Traditionally, antibody-based methods (e.g. Western blot) have been used to analyze histone modifications (7), which have multiple disadvantages. First, antibodies are not available for every new PTM discovered. Second, PTMs on neighboring amino acids (e.g. H3K9me1–3 and H3S10ph) may prevent antibody binding, a phenomenon called epitope occlusion. Third, the quantification of PTMs via antibody-based methods is not sensitive to small differences (e.g. <twofold). Mass spectrometry (MS) has emerged as a sensitive and efficient technique to detect known and novel PTMs (8). The high mass accuracy and the high speed of modern mass spectrometers allow for sensitive, confident, and accurate peptide quantification when coupled with nanoflow liquid chromatography (nanoLC).
NanoLC-MS/MS analysis of protein digests (i.e. bottom-up MS) is nowadays a mature and widely applied technology. Data-dependent acquisition is the most commonly adopted MS acquisition method to identify peptides via bottom-up MS (9–12), generating MS1 and MS2 spectra. Nevertheless, histone proteins are particularly challenging to analyze by using the generalized bottom-up workflow. As histones are rich with lysines and arginines, tryptic digest of histones generates short peptides that are difficult to be retained on C18 columns. To improve histone peptide retention, the unmodified and mono-methylated lysines and peptide N terminus can be selectively chemically propionylated (13–16), preventing tryptic digest after lysine to generate longer peptides. Moreover, peptide identification through traditional database searches leads to a large number of false positives, as allowing several dynamic modifications (e.g. me1/me2/me3, ac, ph) dramatically increases the number of molecular candidates and thus the possibility to achieve a false hit (12). Therefore, software tools that quantify histone peptides require additional data to correctly map a given peptide, such as previous knowledge of peptide retention time.
Quantification of histone peptides is particularly challenging because of presence of isobaric peptides, near isobaric PTMs such as tri-methylation (42.047 Da) and acetylation (42.011 Da), and low abundant species. Previous knowledge about relative peptide retention time (RT) enables differentiation between species close in mass and therefore selection of the correct peak for integration of the area of the chromatographic peak (i.e. area under curve or AUC). However, determination of peptide RT might be difficult because of their low abundance though acid extraction was performed to purify histones. This problem can be solved by using isotopically labeled synthetic histone peptides (17), or data independent approaches (18). When using relative retention time information to assign peak identities, reproducible nanoLC is crucial, especially because some isobaric peptides co-elute. In this case, the MS acquisition method must perform targeted MS2 for the co-eluting isobaric peptides at the specific time that they elute. These species can be discriminated and quantified based on the intensity of fragment ions unique to each species. For instance, the peptides KacSTGGKAPR (H3K9ac) and KSTGGKacAPR (H3K14ac) have the same mass and overlap at the nanoLC elution (the full protein sequence of human canonical histone H3 and H4 are shown in Fig. 1A). Thus, the co-eluting isobaric peptides could not be quantified separately based on the MS1 signal, but the unique fragment ions present in MS2 spectra allow them to be quantified individually.
Fig. 1.

Histones are a challenge for quantitative mass spectrometry analyses. A, Human histone H3.1 and H4 protein sequences. B, Spline fitting to calculate AUC: blue lines are the original peaks and pink lines are the fitted peaks. C, An example of isobaric PTM modified peptides. The above MS2 is matched with H3K18ac, and the same MS2 is also matched with H3K23ac below. D, The workflow of EpiProfile: inputting precursor m/z and charge state, extracting elution profiles, selecting the correct chromatographic peak, calculating AUC, and outputting quantification tables and figures.
There have been few computational investigations attempting to solve the problem of quantifying co-eluting isobaric peptides. DiMaggio et al. used a mixed integer linear optimization (MILP) framework to quantify partially co-eluting isobaric histone peptides from electron transfer dissociation (ETD) spectra (19). The framework is comprised of two MILP models: (1) enumerating the entire space of the modified forms that satisfy a given peptide mass and (2) determining the relative composition of the modified forms in the spectrum. Another study by Guan et al. identified isobaric peptides by searching ETD MS/MS spectra for ions representing all possible configurations of modified peptides using a visual assistance program. The relative abundances of these species were estimated by using a nonnegative least squares procedure (20). Other quantification programs can also perform accurate peak picking, but are commonly not as suitable for heavily modified and isobaric histone peptides (e.g. Skyline) (21). These software programs are unable to provide the layouts of histone peptides (i.e. relative RTs) or discriminate all isobaric modified peptides, two tasks that are vital for full characterization of a histone sample.
In this study, we developed a new quantification program named EpiProfile. EpiProfile extracts ion chromatography for known histone peptides by using previous knowledge about their elution profiles. Moreover, it discriminates and quantifies the isobaric histone peptides by resolving the linear equations listed with the peak heights of unique fragment ions between the two modification sites in the MS2 spectra (e.g. ions between H3K9ac and H3K14ac). We evaluated the accuracy of EpiProfile by mixing different ratios of synthetic histone peptides, and then tested EpiProfile by analyzing nanoLC-MS/MS data sets of the following samples: purified histones from HeLa cells, a synthetic histone peptide library, and histone peptides labeled during cell growth with 13C-labeled glucose media or stable isotope labeling by amino acids in cell culture (SILAC) (22). We compared EpiProfile to manual quantification of the data, and also with the openly available program Skyline. We found that manual quantification is obviously time-consuming and that Skyline cannot generate the layouts of histone peptides and cannot discriminate four or six-component isobaric peptides, a common occurrence in histone data. Moreover, EpiProfile is highly flexible, and thus it can be used to analyze various protein samples, including isotopically labeled peptides and nonhistone data sets.
MATERIALS AND METHODS
Data Sets
We used four data sets: (1) endogenous histones from HeLa cells; (2) synthetic heavy-labeled histone peptides; (3) 13C glucose labeled histones; and (4) SILAC labeled histones. We uploaded all the data files to ProteomeXchange with the identifier PXD001541.
Endogenous Histones from HeLa Cells
HeLa Cell Culture - As previously described (23), HeLa cells were cultured in suspension with Minimum Essential Medium Eagle (MEM) Joklik modification with 10% Newborn Calf Serum (Thermo Scientific SH30118.03, UT), 1% Glutamax (Gibco, 35050–079, NY), and 1% penicillin/streptomycin (Gibco, 15140–122, NY). The cell density was maintained within the range of 1–10 × 105 cells/ml. Histones were acid extracted and subjected to chemical derivatization using propionic anhydride and trypsin digestion as previously described (24). Samples were then desalted and loaded by auto-sampler onto an online nanoLC-MS/MS as described in (24).
Nanoflow Liquid Chromatography Tandem Mass Spectrometry (nanoLC-MS/MS) - The samples were loaded onto an Orbitrap Velos Pro mass spectrometer at 300 nL/min. Histone peptides were resolved on a two-step gradient from 2% ACN to 30% ACN in 0.1% formic acid over 40 min, then from 30% ACN to 95% ACN in 0.1% formic acid over 20 min. Orbitrap Velos Pro was operated in the data dependent acquisition (DDA) mode with dynamic exclusion enabled (repeat count: 1, exclusion duration: 0.5 min). MS instrument methods were set up as previously reported (25). Every cycle one full MS scan (m/z 290 to 1600) was collected and followed by 12 MS2 scans using collision induced dissociation (CID). The isolation window was set at 2.0 m/z. Ions with a charge state of one and a rejection list of common contaminant ions (including keratin, trypsin and BSA) (exclusion width = 10 ppm) were excluded from MS2 spectra.
Synthetic Heavy-labeled Histone Peptides
Synthetic peptides were purchased via Cell Signaling Technology Protein-Aqua (MA) as described (17). Briefly, a library of 93 synthetic histone peptides was assembled, including the most abundant modified and unmodified forms. Heavy amino acids (e.g. 4.0071 Da for A, 6.0138 Da for P, and 3.0037 Da for G) were used to discriminate the endogenous peptides, which have the same mass (e.g. H3K9ac (KacSTGGKAPR) with one heavy P and H3K14ac (KSTGGKacAPR) with one heavy P and one heavy G).
13C Glucose Labeled Histones
13C glucose was previously used to study the dynamics of histone acetylation, and the data from that paper is used here (26). In brief, 13C glucose was added to the HEK293 cells in which the histones were extracted at different time points, such as 10 min, 20 min, 1 h, 2 h, and 24 h. Glucose is converted to acetyl-CoA and therefore labels any histone acetylation sites (2Da mass shift per acetyl group).
SILAC Labeled Histones
For SILAC labeling, HeLa cells were synchronized with double thymidine block as previously described (23) and supplemented with stable isotope labeled arginine (13C615N4) (Cambridge Isotope Labs, CNLM-539-H) and dialyzed FBS (Gemini 100–108) upon releasing from the double thymidine block. Mitotic HeLa cells were collected 11 h after the releasing started.
EpiProfile
The authors developed the quantification program, named EpiProfile, for high-resolution mass spectra. Fig. 1D shows the workflow of EpiProfile. The input of EpiProfile is m/z values and charge states of peptides. After one peptide is inputted, elution profiles of the peptide expected isotopes are reconstructed from MS scans. The extracted elution profile of the mono-isotopic mass for each given peptide is then selected. Three data types are extracted: RT, AUC, and full width at half maximum (FWHM). The final output contains both Excel tables and PDF figures.
The main challenges in quantifying histone peptides are determining the RTs of peptides and discriminating isobaric peptides. We modified EpiProfile to solve these problems. To accurately quantify histone peptides, we set the following parameters: xtract 1.0.0.2 in pFind Studio (pfind.ict.ac.cn) to generate peak lists (from RAW to MS1 and MS2), precursor mass tolerance ±10 ppm, fragment mass tolerance ±0.4 Da for CID, trypsin only cleaving after arginine and up to 2 miscleavages, Propionyl[Peptide N-term]/+56.026 as the fixed modification, Propionyl[K]/+56.026, Acetyl[K]/+42.011, Methyl_Propionyl[K]/+70.042, Dimethyl[K]/+28.031, Trimethyl[K]/+42.047, and Phospho[ST]/+79.966 as variable modifications. The quantification of histone peptides in EpiProfile consists of four steps: (1) extracting RT and AUC for the unmodified peptides; (2) locating RT for the modified peptides; (3) extracting RT and AUC for the modified peptides; (4) producing layouts and combining results.
Extracting RT and AUC for the Unmodified Peptides
Extracting RT and AUC for the unmodified peptides consists of three steps: (1) reconstructing elution profiles for the peptide isotopes; (2) determining the RT; (3) calculating the AUC.
Reconstructing elution profiles for the peptide isotopes - We calculate the expected isotopes for each peptide using its m/z value and charge state (noted as mz and c). The average value of the mass difference between adjacent isotopic peaks is 1.0032 Da (noted as d) (27). The m/z value of the mono-isotopic peak (noted as P0) is mz, the m/z value of the first isotope (noted as P1) is mz+d/c, and the m/z value of the second isotope (noted as P2) is mz+2*d/c. The potential contaminating m/z value of the peak before the mono-isotopic peak (noted as P_1) is mz-d/c. Next, we reconstruct elution profiles for these four peaks from the first MS scan to the last MS scan. In each MS scan, the candidate isotopes are determined. The theoretical isotopic pattern of the precursor can be calculated using its mass and the “averagine” model (28). All matching peaks with mass deviations no more than the instrument accuracy (e.g. 10 ppm) for these four peaks are selected. If there are two or more matching peaks for P0 or P1, then all of the combinations (one from P0 and the other from P1) are compared with the theoretical pattern for the P0 and P1 pair, and the closest combination is selected. We set the conditions to select candidate isotopes: (1) there is no P_1, or P_1 is lower than P0, and (2) the intensity ratio of P1 to P0 is in the reasonable range of the theoretical ratio of P1 to P0 (e.g. between 1/5 and 5). Compared with the way of reconstructing elution profile only by the mono-isotopic peak, our method is more accurate because it can eliminate contaminating peaks.
Determining the RT - First all chromatographic peaks in the mono-isotopic elution profile are isolated. Peaks below a threshold (i.e. 1/1000 of the highest peak in the profile) are considered as noise peaks, and their intensities are set to 0. Therefore, chromatographic peaks are flanked by areas of zero intensity, where the positions of the first and last nonzero values are the boundaries of chromatographic peaks. Several mono-isotopic elution profiles may exist for a given peptide as several m/z values may fall within the 10 ppm range of the theoretical m/z value. We select one of these chromatographic peaks for the input peptide, with the default selection of the highest chromatographic peak. Furthermore, isobaric and nearly isobaric peptides will have an m/z within 10 ppm of each other, causing multiple overlapping chromatographic peaks or one single unresolved peak. For these cases, MS2 spectra can be used to distinguish separate contributions of individual peptides to the chromatographic peak signal. For endogenous histones, the unmodified peptide is usually the most abundant species. For instance, unmodified H3 9–17 and H3K9me1K14ac have the same mass, but the former is usually more abundant. If there are MS2 identified for the unmodified peptides, then the MS2 spectra can be used to determine the RT. Alternatively, the largest chromatographic peak is selected for the unmodified peptide. In some rare cases the unmodified peptide is less abundant than the modified peptides. If the automatic peak assignment is incorrect, manual peak assignment can be used to make necessary corrections by putting the peptide sequence and its corresponding RT into the input parameter file.
Calculating the AUC - To start, the AUC of the monoisotopic peak is calculated. Because the collection interval (the time difference between two adjacent peaks) in elution profiles is not equal, the AUCs of different peptides that are calculated by summing their MS1 intensities cannot be compared with each other. Instead we set equal time intervals (i.e. 0.03 s), and then obtain the intensity for each time point by fitting a spline function to the chromatographic peaks (in Fig. 1B blue lines are the original and pink lines are the fitted). AUCs of different peptides calculated in this manner can be compared. Next, any overlaps in peptide isotopic patterns are detected, and the contribution from the front isotopic patterns (i.e. lower peptide mass) to the input monoisotopic peak is subtracted. Finally, to compare different peptides with different lengths, the sum of theoretical isotopic pattern for each peptide (e.g. the theoretical isotopic pattern of 1000 Da is [1, 0.556, 0.178, 0.042, 0.008], so the sum is 1.784) is multiplied by the monoisotopic AUC.
Locating RT for the Modified Peptides
The order of the RT for each set of modified peptides is based on prior knowledge of how each modification on a peptide affects the peptide propionic anhydride reactivity and hydrophobicity. For a given peptide backbone, me1 elutes later than the unmodified, ac elutes earlier than the unmodified, and both me2 and me3 elute almost at the same time and earlier than ac. Once the RT of the unmodified peptide is determined, the RTs of the modified peptides can be located within the predicted time area with respect to the unmodified peptide based on the type of modification. EpiProfile considers all detectable charge states, and different charge states have the same RTs for the same peptide. To locate the RTs, EpiProfile only uses the charge state with the most abundant component for each peptide.
Extracting RT and AUC for the Modified Peptides
The RTs and AUCs are extracted using all of the charge states for each peptide. The sum of AUCs for all charge states is the total AUC for each peptide. If there are several isobaric peptides co-eluting (e.g. H3 9–17 one-ac, H4 4–17 one-ac, and H4 4–17 two-ac), the signals of individual species within the overall chromatographic peak should be discriminated. Because different isobaric species co-elute in one chromatographic peak, MS2 spectra are needed to discriminate between them. The unique fragment ions between modification sites can be used (e.g. in Fig. 1C b1-b5 and y4-y8 between K18 and K23 are unique fragment ions that have different masses for H3K18ac and H3K23ac). For co-eluting species such as H3K18ac and H3K23ac, we can calculate the ratio of K18ac to K23ac in each scan (K18ac/K23ac) using the peak height of fragment ion pairs unique to K18 and K23 (e.g. the b1 ion in K18ac and K23ac) from the mixed MS2 spectra. We can then use the ratios to discriminate K18ac and K23ac contribution to the total chromatography peak. It is relatively easy to discriminate two species compared with four or six species. We show the equations required to discriminate two, four, and six species in the supplemental Methods. EpiProfile can be used to discriminate seven commonly encountered histone isobaric mixtures: H3K9ac versus H3K14ac, H3K18ac versus H3K23ac, H3K18me1 versus H3K23me1, H3K27me1 versus H3K36me1, H4 4–17 one-ac, H4 4–17 two-ac, and H4 4–17 three-ac.
Producing Layouts and Combining Results
Layouts show the extracted chromatographic peak for each peptide. All data are outputted to a table (as shown in Table I). The first column is the peptide groups. The next three columns are RT, AUC, and ratio (i.e. the proportion of each AUC within the total AUC for a peptide group). If there are two or more data files, their RT, AUC, and ratio are outputted in the next columns so that it is convenient to compare the relative abundance of specific modifications within a peptide group across separate data files.
Table I. Quantification of endogenous histone peptides.
| Peptide | 1, histone test |
||
|---|---|---|---|
| RT(min) | Area | Ratio | |
| TKQTAR(H3 3–8) | |||
| Unmod | 22.64 | 1.02E+09 | 0.80787 |
| K4me1 | 26.12 | 2.42E+08 | 0.19113 |
| K4me2 | 14.01 | 2.62E+05 | 0.00021 |
| K4me3 | 14.01 | 3.80E+04 | 0.00003 |
| K4ac | 20.25 | 9.69E+05 | 0.00077 |
| KSTGGKAPR(H3 9–17) | |||
| Unmod | 28.03 | 1.51E+09 | 0.20066 |
| K9me1 | 30.83 | 8.94E+08 | 0.11846 |
| K9me2 | 21.01 | 2.48E+09 | 0.32874 |
| K9me3 | 20.89 | 1.42E+09 | 0.18840 |
| K9ac | 26.44 | 2.68E+07 | 0.00356 |
| K14ac | 26.63 | 3.60E+08 | 0.04766 |
| K9me1K14ac | 29.44 | 2.21E+08 | 0.02934 |
| K9me2K14ac | 19.67 | 4.62E+08 | 0.06124 |
| K9me3K14ac | 19.58 | 1.53E+08 | 0.02030 |
| K9acK14ac | 24.75 | 1.25E+07 | 0.00166 |
RESULTS
After developing EpiProfile for analyzing histone modified peptides, we investigated the following: (1) evaluation of the ability of EpiProfile to discriminate isobaric peptides, (2) quantification of endogenous histone peptides, (3) quantification of synthetic heavy labeled histone peptides, (4) quantification of 13C glucose labeled acetylated histone peptides, and (5) quantification of SILAC labeled histone peptides. While the first application demonstrates the theoretical feasibility of EpiProfile, the second to fifth applications demonstrate the flexibility of EpiProfile to accommodate multiple analysis needs for histone PTM quantification.
Evaluation of the Ability of EpiProfile to Discriminate Isobaric Peptides
In endogenous samples, many isobaric PTM modified histone peptides co-elute during C18 based nanoLC separations. For example, the H3 peptide spanning the 9–17 amino acids (KSTGGKAPR) can contain either H3K9ac or H3K14ac, and these mono-acetylated peptides co-elute chromatographically. Similarly, the H3 peptide spanning the 18–26 amino acids (KQLATKAAR) can contain either H3K18ac or H3K23ac, and these mono-acetylated peptides also often co-elute chromatographically. We therefore used synthetic peptides to evaluate the accuracy of EpiProfile to calculate the abundance of isobaric peptides within a chromatographic peak. We used peptides containing the modifications: H3K9ac, H3K14ac, H3K18ac, and H3K23ac. Both MS1 and MS2 information can be used to quantify the synthetic peptide mixtures. As their synthetic masses are distinct (their charge +2 m/z values are 531.303, 532.805, 574.349, and 578.356, respectively), their elution profiles can be calculated individually (as shown in supplemental Fig. 1A). To quantify the peptides using MS2 information, they are co-fragmented in the same isolation window (3 m/z for H3K9ac and H3K14ac with the target m/z of 532.555, 5.5 m/z for H3K18ac and H3K23ac with the target m/z of 576.854, which can include the mono-isotopic peak of H3K9ac and H3K18ac and the second isotope of H3K14ac and H3K23ac, respectively). EpiProfile utilizes the MS2 fragmentation information to quantify the endogenous versions of the peptides as they are isobaric to each other. The synthetic peptides enable us to directly compare quantifications obtained from both MS1 and MS2 information, therefore providing nice evaluation of the EpiProfile algorithm in MS2 quantification (as shown in supplemental Fig. 1B and 1C).
We mixed the synthetic peptides in different ratios for three replicates: 19:1, 9:1, 4:1, 1:1, 1:4, 1:9, and 1:19. These ratios were chosen because we typically observed a similar distribution of peptide abundances in endogenous histone samples. Supplemental Table S1 and Fig. 2 show the evaluation procedure and results. The average and standard deviation of measured proportions (e.g. H3K9ac/H3K14ac) were calculated. We observed that the proportion calculated by MS1 of H3K9ac was usually lower than the input concentration. We therefore corrected for this detection efficiency as previously described (17). All the corrected proportions were very close to the input (as shown in Fig. 2). The results of the ratios for H3K9ac versus H3K14ac, and H3K18ac versus H3K23ac show that the proportions of isobaric mixtures calculated by EpiProfile are accurate.
Fig. 2.

Evaluation of discriminating isobaric mixtures in EpiProfile by utilization of different mixed ratios of synthetic histone modified peptides. Synthetic peptides H3K9ac versus H3K14ac, and H3K18ac versus H3K23ac are mixed with different ratios for three replicates: 19:1, 9:1, 4:1, 1:1, 1:4, 1:9, and 1:19. The proportion of each peptide is measured by MS1 and MS2. The measured MS1 proportion is different from the expected. So the measured MS1 proportion is normalized to the expected. The measured MS2 proportion is also corrected by the same factor. The corrected mean and standard deviation for each ratio are shown. The results show that proportions between MS1 and MS2 are similar.
Quantification of Endogenous Histone Peptides
To quantify endogenous histone peptides, the input for EpiProfile is the RAW data files and the output is a table of the relative ratios for nine peptide groups in different data files. In each group of the output file, the unmodified peptide shows the sequence backbone, and the modified peptides show different modifications on the backbone. Table I shows the EpiProfile output for two peptide groups, including the RT, AUC, and relative abundance of different modified forms of each peptide.
We focus on nine peptide groups from histone H3 and H4 as they carry the most commonly observed and biologically important histone PTMs. For each data file, there are nine layouts for histone peptide groups. Layouts for two peptide groups extracted by EpiProfile are plotted in Fig. 3. The peptide group H3 3–8 TKQTAR (Fig. 3A) includes five modified forms of the same peptide backbone. The second peptide group H3 9–17 KSTGGKAPR (Fig. 3B) includes ten modified forms of the same peptide backbone. Fig. 3A illustrates that the order of the peptide elution times starting with the earliest eluting peak (layout) is: K4me2 and K4me3, K4ac, the unmodified (K4un), and K4me1; K4me2 and K4me3, and K4ac have very low abundance (they present only 0.1% of the total peptide abundance as shown in Table I). As we mentioned above, the unmodified and mono-methylated peptides also have propionyl groups on them. This additional mass is accounted for in the algorithm; otherwise, the peptide mass will be incorrectly calculated. Fig. 3B shows that the order of different forms of the H3 9–17 peptide is: K9me2K14ac and K9me3K14ac, K9me2 and K9me3, K9acK14ac, K9ac and K14ac, the unmodified (K9unK14un), K9me1K14ac, and K9me1. It can also be observed that several peptides, including K9unK14un versus K9me1K14ac and K9me2 versus K9me3K14ac, have the same precursor m/z but different RT, thus it is easy to resolve and accurately quantify them. However, K9ac and K14ac have the same precursor m/z and are not chromatographically resolved, so it is impossible to discriminate them solely by their MS1 spectra.
Fig. 3.
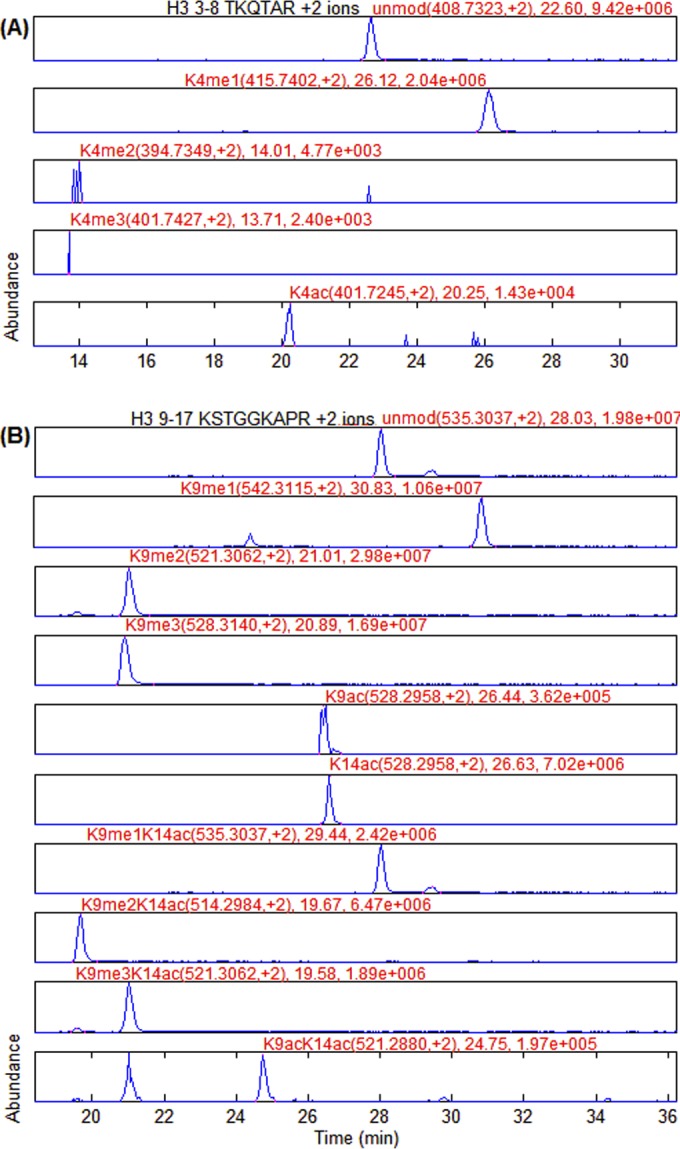
Layouts of two peptide groups from endogenous histones. The histone H3 3–8 peptide has five peptides. The histone H3 9–17 peptide has ten peptides. The start point, the middle point and the end point of each chromatographic peak are marked. The modification form, peptide m/z and charge state, retention time and peak intensity are annotated above the middle point. The order of different forms of the H3 3–8 peptide (layout) is: K4me2 and K4me3, K4ac, the unmodified (K4un), and K4me1. The order of different forms of the H3 9–17 peptide (layout) is: K9me2K14ac and K9me3K14ac, K9me2 and K9me3, K9acK14ac, K9ac and K14ac, the unmodified (K9unK14un), K9me1K14ac, and K9me1.
To discriminate isobaric peptides co-eluting under the same chromatographic peak, EpiProfile uses the fragment ions between the modification sites in the mixed MS2 spectra (as shown in Fig. 1C). Fig. 4A shows the discrimination of H3 9–17 K9ac and K14ac. The black profile is the entire chromatographic peak composed of both the H3K9ac and H3K14ac peptides. EpiProfile is able to extract from the entire peak the H3K9ac peptide as shown in the red profile and the H3K14ac peptide as shown in the blue profile. Note that the elution profiles for H3K9ac and H3K14ac do not perfectly overlap with each other because of relatively small differences in the RT between the two modified forms. Based on the EpiProfile deconvolution, we obtain a relative quantification of the two mono-acetylated peptides as H3K9ac:H3K14ac = 6%:94%, which is close to 1:19 as in the above evaluation experiment for EpiProfile. The H3K14ac peptide elutes later than the H3K9ac peptide and is the predominant mono-acetylated peptide in this sample.
Fig. 4.
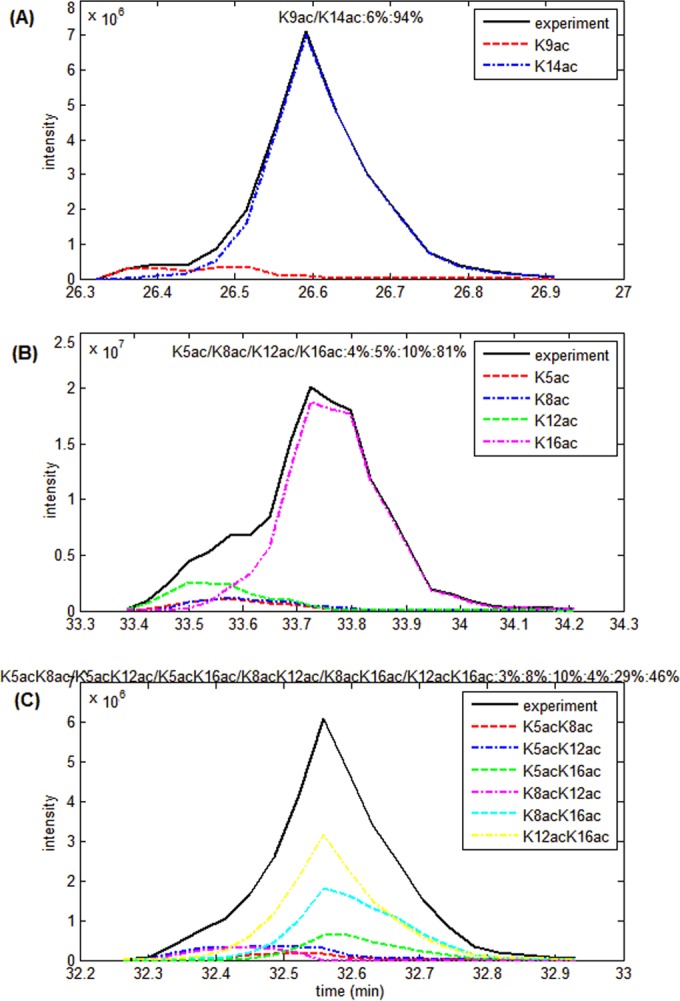
Discriminating isobaric mixtures with two, four and six component species. The black solid profile is the entire chromatographic peak. Other dotted profiles are the individual species for: A, H3 K9/K14 mono-acetylated peptides; B, H4 K5/K8/K12/K16 mono-acetylated peptides; C, H4 K5/K8/K12/K16 di-acetylated peptides.
The histone H4 4–17 peptide presents a more difficult challenge because of the four potentially modifiable lysines in the same peptide, namely at K5, K8, K12, and K16. The relative quantification of the four possible (selecting one in four) modified forms of the mono-acetylated H4 4–17 peptide is K5:K8:K12:K16 = 4%:5%:10%:81% (Fig. 4B). H4K16ac elutes the latest and is the predominant species. The relative quantification of the six possible (selecting two in four) modified forms of the di-acetylated peptide is K5K8:K5K12:K5K16:K8K12:K8K16:K12K16 = 3%:8%:10%:4%:29%:46% (Fig. 4C). H4K12acK16ac is the predominant di-acetylated peptide. Similarly, we used EpiProfile to discriminate and quantify isobaric components of H3 18–26 K18ac versus K23ac, H3 18–26 K23me1 versus K18me1, H3 27–40 K36me1 versus K27me1, and H4 4–17 three-ac (as shown in supplemental Fig. S2). In conclusion, EpiProfile can solve the isobaric problems reliably and faster than with manual quantification.
Quantification of Synthetic Heavy Labeled Histone Peptides
Lin et al. recently published results using a histone peptide library with 93 synthetic histone peptides containing unmodified and modified sequences (17). This synthetic histone peptide library is valuable for this study because it can be used to determine the retention time of low-abundance modifications (e.g. H3K4me2 and H3K4me3, etc) and discriminate isobaric peptides by different masses (e.g. H3K9ac and H3K14ac, H4 4–17 one-ac, two-ac, and three-ac, etc). Therefore, the synthetic library can be used to validate the quantification of histone peptides using various programs, such as EpiProfile.
To quantify synthetic peptides, the input of EpiProfile is the path of data files as well as the m/z values and charge states of the synthetic peptides. The output is a table of the relative ratios for 17 peptide groups in different data files. Table II shows two peptide groups testing on one data file, including the endogenous and synthetic m/z values, RT, AUC, and relative abundance. In the first column the highlighted amino acids denote which residues are heavy labeled (e.g. the heavy A mass is 4.0071 Da larger than the light A).
Table II. Quantification of synthetic heavy labeled histone peptides. The highlighted amino acids mean that they are heavy, for example, the heavy A has more of 4.0071 Da than the light A.
| Endogenous peptides | Synthetic peptides | RT(min) | Area | Ratio | |||||
|---|---|---|---|---|---|---|---|---|---|
| TKQTAR | (+1) | (+2) | (+1) | (+2) | |||||
| TKQTAR | 816.458 | 408.733 | 820.465 | 410.736 | 18.34 | 1.56E+09 | 0.156 | ||
| TKme1QTAR | 830.474 | 415.741 | 834.481 | 417.744 | 21.58 | 6.72E+09 | 0.671 | ||
| TKme2QTAR | 788.463 | 394.735 | 792.470 | 396.739 | 10.82 | 8.19E+08 | 0.082 | ||
| TKme3QTAR | 802.478 | 401.743 | 806.485 | 403.747 | 10.82 | 7.15E+08 | 0.071 | ||
| TphKQTAR | 896.424 | 448.716 | 900.431 | 450.719 | 18.22 | 2.07E+08 | 0.021 | ||
| KSTGGKAPR | (+1) | (+2) | (+3) | (+1) | (+2) | (+3) | |||
| KSTGGKAPR | 1069.601 | 535.304 | 357.205 | 1075.614 | 538.311 | 359.210 | 23.2 | 2.98E+10 | 0.189 |
| Kme1STGGKAPR | 1083.616 | 542.312 | 361.877 | 1089.630 | 545.319 | 363.882 | 25.91 | 2.72E+10 | 0.173 |
| Kme2STGGKAPR | 1041.606 | 521.307 | 347.874 | 1047.619 | 524.314 | 349.878 | 16.61 | 1.14E+10 | 0.072 |
| Kme3STGGKAPR | 1055.621 | 528.314 | 352.545 | 1067.642 | 534.325 | 356.553 | 16.46 | 5.69E+09 | 0.036 |
| KacSTGGKAPR | 1055.584 | 528.296 | 352.533 | 1061.598 | 531.303 | 354.538 | 21.68 | 1.51E+10 | 0.096 |
| KSTGGKacAPR | 1055.584 | 528.296 | 352.533 | 1064.602 | 532.805 | 355.539 | 21.93 | 1.66E+10 | 0.105 |
| Kme1STGGKacAPR | 1069.601 | 535.304 | 357.205 | 1075.614 | 538.311 | 359.210 | 24.68 | 3.17E+10 | 0.201 |
| Kme2STGGKacAPR | 1027.589 | 514.299 | 343.202 | 1033.603 | 517.306 | 345.206 | 14.95 | 5.73E+09 | 0.036 |
| Kme3STGGKacAPR | 1041.606 | 521.307 | 347.874 | 1051.625 | 526.317 | 351.214 | 14.86 | 5.14E+09 | 0.033 |
| KacSTGGKacAPR | 1041.568 | 521.288 | 347.861 | 1047.582 | 524.295 | 349.866 | 20.23 | 9.09E+09 | 0.058 |
Supplemental Fig. S3 shows the layouts of synthetic peptides in Table II, in which the peptides are mixed in equal solution concentrations. In Table II of the synthetic peptides, the ratios of H3K4me2 and H3K4me3 are 8 and 7%, respectively; whereas in Table I of the endogenous peptides, the ratios of H3K4me2 and H3K4me3 are 0.02% and 0.003%, respectively. In supplemental Fig. S3A of the synthetic peptides, the peak height of H3K4me2 and H3K4me3 is close to the unmodified, and there are many time points in their chromatographic peaks; whereas in Fig. 3A of the endogenous peptides, the peak height of H3K4me2 and H3K4me3 is only 0.1% of the unmodified, and there are only few time points in their chromatographic peaks. Though the peak height of H3K4me2 and H3K4me3 is very low in endogenous histones, they can be detected by EpiProfile, and the synthetic peptides validate that their RTs in endogenous histones are correct. Although this current study does not intend to illustrate the relative quantification among the synthetic peptides, we do observe very similar detection efficiencies as in the previous study (17).
In Supplemental Fig. S3B of synthetic peptides, H3K9me3K14ac elutes earlier than H3K9me2, which is the same order as in Fig. 3B of endogenous peptides. H3K9ac elutes earlier than H3K14ac, which is also the same order as in Fig. 3B. Thus, the library of synthetic histone peptides can be used to easily discriminate isobaric peptide mixtures because of differences in the synthetic peptide masses and the library can be used to validate that the RTs detected by EpiProfile are correct.
Quantification of 13C Glucose Labeled Acetylated Histone Peptides
Evertts et al. used 13C glucose labeling to generate 13C-acetyl-CoA, which in turn labeled acetyl sites on histones, extracting histones at different time points: 10 min, 20 min, 1 h, 2 h, and 24 h (26). The m/z of “light” 12C-acetylated H3K9ac/K14ac is 528.296. Because there are two carbons in an acetyl group, we should observe a 2Da mass shift to 529.299 m/z for the doubly charged H3K9ac/K14ac mono-acetylated peptide that is labeled with 13C-acetyl. The dynamic change in the relative abundance of 12C and 13C-labeled H3K9ac/K14ac is shown in supplemental Fig. S4. As the labeling time increased, the 13C peak increased relative to the 12C peak. Because the second isotope of the 12C peak overlaps with the 13C peak at 529.299 m/z, the abundance of the second isotope of the 12C peak calculated from the theoretical isotopic pattern should be subtracted from the observed peak to calculate the correct abundance of the 13C peak.
The results of the heavy acetyl labeling experiment as analyzed by EpiProfile are given in Table III. The first column shows the peptide pairs. The second column shows the charge +2 m/z. The third column shows the RT for each peptide. The next five columns show the ratios of 13C/(13C+12C) for different time points. To calculate the ratios, AUC of the 12C peak is calculated, AUC of the 13C peak is calculated by subtracting AUC of the second isotope of the 12C peak from the observed peak, and then the ratio is calculated by AUC of the 12C peak divided by the sum of AUC of the 12C and 13C peaks. The 13C ratio of H3K9ac/K14ac reaches 50% around 1 h (i.e. half-max time), and the ratios of the other five acetyl peptides reach 50% around 2 h. Fig. 5 shows the acetylation rates for H3K9ac/K14ac and H3K18ac/K23ac (1.42 h for half-max time of H3K9ac/K14ac, 1.85 h for half-max time of H3K18ac/K23ac), in which the circles show the measured ratios and the lines show the fitting curves. The logarithmic function, y = A * (1 − e−x/B), is used to fit the acetylation rates. The fitting function and the trend of acetylation rate was found to be similar to the previous study (26). The difference between the EpiProfile results and the results from Evertts et al. is the calculation of the ratio and the speed of analysis. EpiProfile completes the analysis for all labeled acetylation sites within minutes whereas the previous manual analysis took at the minimum hours, demonstrating the power of this algorithm in histone PTM analysis.
Table III. Quantification of 13C glucose labeled acetylated histone peptides.
| Peptide | mz(+2) | RT(min) | 1,10 min |
2,20 min |
3,1 hr |
4,2 hr |
5,24 hr |
|---|---|---|---|---|---|---|---|
| Ratio | Ratio | Ratio | Ratio | Ratio | |||
| H3K9ac/K14ac | |||||||
| 12C | 528.296 | 48.17 | 0.8349 | 0.7136 | 0.6471 | 0.4626 | 0.2945 |
| 13C | 529.299 | 48.17 | 0.1651 | 0.2864 | 0.3529 | 0.5374 | 0.7055 |
| H3K9me1K14ac | |||||||
| 12C | 535.304 | 51.17 | 0.8733 | 0.7374 | 0.6226 | 0.5213 | 0.3440 |
| 13C | 536.307 | 51.17 | 0.1267 | 0.2626 | 0.3774 | 0.4787 | 0.6560 |
| H3K9me2K14ac | |||||||
| 12C | 514.298 | 41.97 | 0.8668 | 0.7479 | 0.7066 | 0.5554 | 0.3809 |
| 13C | 515.302 | 41.97 | 0.1332 | 0.2521 | 0.2934 | 0.4446 | 0.6191 |
| H3K9me3K14ac | |||||||
| 12C | 521.306 | 41.82 | 0.8741 | 0.7294 | 0.8183 | 0.5326 | 0.3597 |
| 13C | 522.309 | 41.82 | 0.1259 | 0.2706 | 0.1817 | 0.4674 | 0.6403 |
| H3K18ac/K23ac | |||||||
| 12C | 570.84 | 58.68 | 0.8710 | 0.7389 | 0.6674 | 0.5351 | 0.3596 |
| 13C | 571.843 | 58.68 | 0.1290 | 0.2611 | 0.3326 | 0.4649 | 0.6404 |
| H4 4–17 one-ac | |||||||
| 12C | 768.946 | 56.41 | 0.8892 | 0.7523 | 0.6758 | 0.5359 | 0.4013 |
| 13C | 769.949 | 56.41 | 0.1108 | 0.2477 | 0.3242 | 0.4641 | 0.5987 |
Fig. 5.
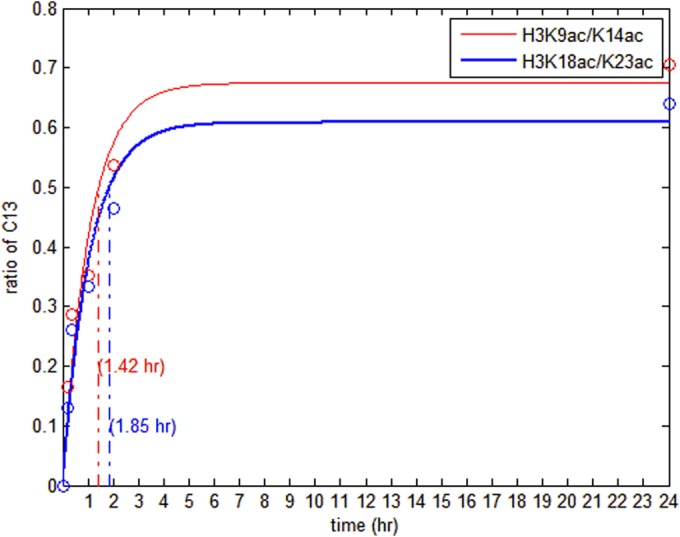
Histone acetylation rates measured by acetyl labeling via 13C glucose. The circles are the measured ratios of 13C glucose labeled peptides at the different time points. The solid lines are the fitting curves. The 13C ratio of H3K9ac/K14ac reaches 50% in 1.42 h (i.e. half-max time), and the ratios of H3K18ac/K23ac reaches 50% in 1.85 h. So H3K9ac/K14ac is faster than H3K18ac/K23ac in the acetylation rate.
Quantification of SILAC Labeled Histone Peptides
Assuming 100% chemical derivatization efficiency, the lysines in the histone samples are either propionylated, modified, or both. Thus trypsin cleavage is restricted to the C-terminal position of arginine. We only used heavy arginine (13C615N4) to SILAC-label histones so that there would only be one heavy amino acid per peptide. The results of SILAC labeling histone peptides from HeLa cells as analyzed by EpiProfile are given in Table IV, including the light and heavy pair, charge +2 m/z values, RT, and ratio. Fig. 6 shows the example of the H3K9ac/K14ac containing peptide. The MS1 shows that the light and heavy isotopic clusters are separate. Their chromatographic peaks are extracted, and their ratios can be calculated with each AUC divided by the total AUC. The ratio shows that the heavy of H3K9ac/K14ac is 1.57 fold of the light. After the systematic error is eliminated with more ratios, we can judge the up-regulation or down-regulation of histone peptides by the heavy to light ratios.
Table IV. Quantification of SILAC labeled histone peptides.
| Peptide | mz(+2) | RT(min) | Ratio |
|---|---|---|---|
| H3K9ac/K14ac | |||
| Light | 528.296 | 20.74 | 0.3892 |
| Heavy | 533.300 | 20.74 | 0.6108 |
| H3K9acK14ac | |||
| Light | 521.288 | 19.13 | 0.5996 |
| Heavy | 526.292 | 19.13 | 0.4004 |
| H3K9me1K14ac | |||
| Light | 535.304 | 23.94 | 0.5051 |
| Heavy | 540.308 | 23.94 | 0.4949 |
| H3K9me2K14ac | |||
| Light | 514.298 | 13.9 | 0.7633 |
| Heavy | 519.302 | 13.9 | 0.2367 |
| H3K18ac/K23ac | |||
| Light | 570.84 | 32.67 | 0.5728 |
| Heavy | 575.844 | 32.67 | 0.4272 |
| H3K18acK23ac | |||
| Light | 563.832 | 30.94 | 0.5537 |
| Heavy | 568.836 | 30.94 | 0.4463 |
Fig. 6.
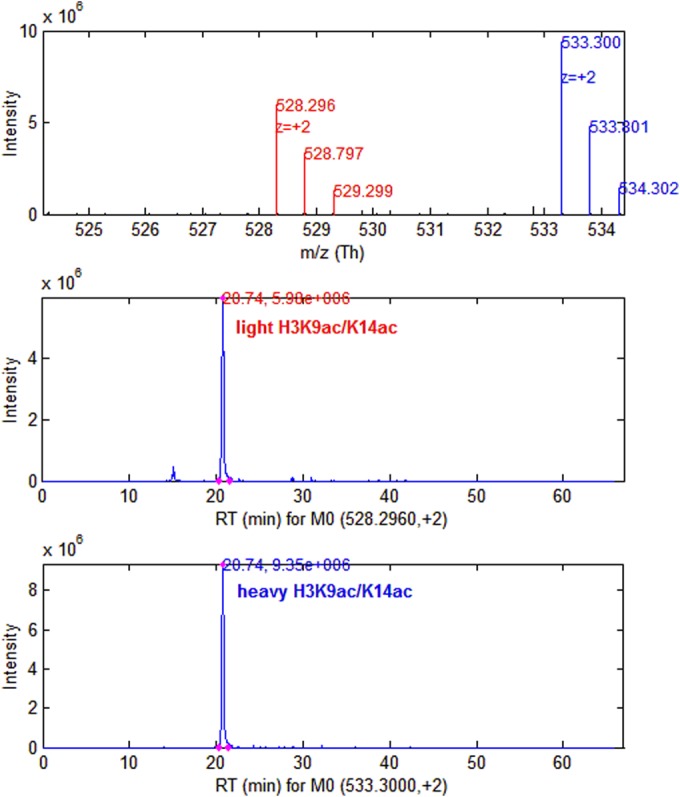
The SILAC pair of histone H3K9ac/K14ac peptide. The light and the heavy peptides are shown, with isotopic clusters and corresponding chromatographic peaks of mono-isotopic peaks. Their ratios can be calculated with each AUC divided by the total AUC. The ratio shows that the heavy of H3K9ac/K14ac is 1.57-fold of the light.
DISCUSSION
After demonstrating the applications of EpiProfile for quantifying histone peptides, we discuss the following: (1) comparison of EpiProfile to manual quantification and also to Skyline; (2) and potential extension of the EpiProfile program.
Comparison of EpiProfile to Manual Quantification
There are many challenges for quantifying histone PTMs, such as determining the RTs (especially for low-abundance peptides that often do not generate MS2 spectra), determining the boundaries of the chromatographic peaks, subtracting the contribution of the previous isotopic peak from the observed peak for the input peptide, and summing the AUCs of the isotopic peaks by the theoretical isotopic pattern. As can be imagined, it is time-consuming to do all the jobs manually, and manual quantification results are typically not consistent between different users. Reconstructing elution profiles while eliminating contaminating peaks is novel in EpiProfile. This is practically impossible to do by manual quantification and this is not typically performed by other programs. Discriminating two-component isobaric mixtures by MS2 is time-consuming, whereas discriminating four or six-component isobaric mixtures are more difficult by manual quantification. In contrast, all the time-consuming procedures are properly and quickly handled by EpiProfile. For example, it would take several weeks to manually quantify the synthetic peptide library data (as Lin's paper (17)), however, it only takes about two hours to perform these calculations and get the similar results using EpiProfile.
Comparison of EpiProfile to the Skyline Program
We have also compared EpiProfile to one of the more flexible available programs, Skyline. To the best of our knowledge, we did find some significant differences between EpiProfile and Skyline. Skyline can align the same peptides between different runs and lets users select models to determine individual RTs, whereas EpiProfile can automatically obtain the layouts of histone peptides (i.e. the time relationship between different PTMs). Skyline notices that the peak before the monoisotopic peak (P_1) might be useful, but does not use the P_1 peak. In contrast, EpiProfile uses the P_1 peak to eliminate contaminating peaks. Skyline also notices that some isotopic peaks are interfered, and it can adjust the boundaries of chromatographic peaks to get better peaks and minimize this interference. In contrast, EpiProfile can subtract the contribution from the previous isotopic peaks or ignore the interference from the latter isotopic peaks using the theoretical isotopic pattern, thus giving more accurate quantification. Skyline can discriminate a two-component isobaric peptide mixture as it is a more straightforward determination, but cannot discriminate four or six-component isobaric peptides as it is not equipped with more complex equations to do so. This can be seen in supplemental Table S2. EpiProfile and Skyline perform similarly to quantify the modified peptides from the histone H3 9–17 peptide (KSTGGKAPR), even the mono-acetylated K9ac/K14ac containing peptide, which is a co-eluting two-component isobaric peptide peak. However, the Skyline program starts to have issues when analyzing the more complex histone H4 4–17 peptide (GKGGKGLGKGGAKR), which can be acetylated at four residues (four or six component mixture depending on the number of simultaneously acetylated residues) that frequently co-elute. Last, obtaining the layouts of histone peptides is crucial to make sure that one is quantifying histone PTM containing peptides accurately, and Skyline currently cannot provide these. In summary, Skyline is a valuable program suited for generally less complex peptides, whereas EpiProfile is especially useful for the highly modified histone peptides.
Potential Extension of the EpiProfile Program
As demonstrated above, EpiProfile is flexible to handle many different types of data. We present here in this study how EpiProfile quantifies human histone peptides from cell lines such as HeLa cells, HEK293 cells, etc. Moreover, EpiProfile can certainly be applied to analysis of histones from other species, such as yeast, mouse, plants, etc, which have divergent histone sequences. We focused on nine histone peptide groups for H3 and H4 in this study. Nevertheless, this program can also be applied to other histones, such as H2A, H2B, etc. In the examples given in this study, EpiProfile quantifies multiple data files by directly comparing the relative ratios among different histone peptide groups. EpiProfile can be applied to compare the relative amount of the same peptide or peptide groups across different data files by the AUCs. If there are two or more conditions, the AUCs of the same peptides in one file can be used as a normalization standard, similar to acting as a loading control. Quantification of the other files can be also all normalized to this loading control to eliminate the systematic error. Currently, EpiProfile quantifies Thermo .RAW files, but it can be applied to quantify other instrument files with different formats.
Additionally, EpiProfile can be extended to analyze peptides from general proteomics experiments other than histones. The input of EpiProfile is m/z values and charge states of peptides. Some information can be extracted for the input, such as RT, AUC, and FWHM for chromatographic peaks. EpiProfile can be used to extract the chromatographic peaks to show the MS1 isotopic clusters and elution profiles for the identified peptides. If the samples are isotopically labeled, both the unlabeled and labeled peptides can be annotated in MS1 (as shown in Fig. 6). EpiProfile can also be used to test the performance of the nanoLC system. For example, EpiProfile can use the m/z values and charge states of Bovine Serum Albumin (BSA) or other standard peptides to extract the chromatographic peaks and calculate FWHM. In our nanoLC-MS system, the FWHM for BSA is 0.2 min, and the FWHM for histone peptides is 0.3 min, whereas they use different nanoLC methods (e.g. different gradients). Finally, EpiProfile can be used for the label-free quantification of general proteins. The unique peptides can be identified from all data files using database search programs such as pFind, their m/z values, charge states, RTs based on MS2 identification can be used to extract AUC in each data file, and the comparative ratios by their AUCs can be collected to do the normalization.
In conclusion, we developed EpiProfile to solve the problems of histone peptide quantification. The challenges in quantifying histone peptides are determining the RTs of different modified peptides and discriminating isobaric mixtures. For non-isobaric peptides, the RTs can be determined by the MS1 signal. For isobaric peptides, each species can be discriminated by the fragment ions of MS2 spectra. We evaluated EpiProfile by mixing different ratios of synthetic peptides to show the accuracy of discriminating isobaric mixtures, tested EpiProfile against endogenous histone samples and synthetic peptides, and then applied EpiProfile to quantify 13C glucose labeled acetylated peptides and SILAC-labeled peptides. EpiProfile is faster and unique compared with manual quantification. Furthermore, EpiProfile is especially designed for histone peptides, and Skyline is for general peptides and can neither generate histone peptide layouts nor discriminate all isobaric peptides. In addition, EpiProfile is flexible and can be extended to quantify more species, more histone peptides, more data files, and even non-histone peptides. EpiProfile is a valuable quantification tool for both histone and non-histone peptides.
Supplementary Material
Acknowledgments
We thank Adam G. Evertts for providing the 13C glucose labeled data, Barry M. Zee and Kelly R. Karch for reviewing the manuscript, and Wen-Bing Hu for valuable suggestions.
Footnotes
Author contributions: Z.Y. and B.A.G. designed research; Z.Y., S. Lin, R.C.M., X.C., N.V.B., X.W., S.S., and S. Liu performed research; Z.Y. analyzed data; Z.Y., S. Lin, S.S., and B.A.G. wrote the paper.
* BAG acknowledges funding from an NIH Innovator grant (DP2OD007447) from the Office of the Director, NIH grant R01GM110174, and the National Science Foundation (NSF) Early Faculty CAREER award.
 This article contains supplemental Figs. S1 to S4, Tables S1 and S2, and Materials.
1 The abbreviations used are:
- PTM
- post-translational modification
- un
- unmodified
- ac
- acetylation
- me1
- mono-methylation
- me2
- di-methylation
- me3
- tri-methylation
- ph
- phosphorylation
- RT
- retention time
- AUC
- area under curve
- FWHM
- full width at half maximum
- ETD
- electron transfer dissociation
- CID
- collision induced dissociation
- SILAC
- stable isotope labeling by amino acid in cell culture.
REFERENCES
- 1. Arnaudo A. M., Garcia B. A. (2013) Proteomic characterization of novel histone post-translational modifications. Epigenetics Chromatin 6, 24. [DOI] [PMC free article] [PubMed] [Google Scholar]
- 2. Arnaudo A. M., Molden R. C., Garcia B. A. (2011) Revealing histone variant induced changes via quantitative proteomics. Crit. Rev. Biochem.. Mol. Biol. 46, 284–294 [DOI] [PMC free article] [PubMed] [Google Scholar]
- 3. Yuan Z. F., Arnaudo A. M., Garcia B. A. (2014) Mass spectrometric analysis of histone proteoforms. Annu. Rev. Anal. Chem. 7, 113–128 [DOI] [PMC free article] [PubMed] [Google Scholar]
- 4. Sidoli S., Cheng L., Jensen O. N. (2012) Proteomics in chromatin biology and epigenetics: Elucidation of post-translational modifications of histone proteins by mass spectrometry. J. Proteomics 75, 3419–3433 [DOI] [PubMed] [Google Scholar]
- 5. Young N. L., Dimaggio P. A., Garcia B. A. (2010) The significance, development and progress of high-throughput combinatorial histone code analysis. Cell. Mol. Life Sci. 67, 3983–4000 [DOI] [PMC free article] [PubMed] [Google Scholar]
- 6. Britton L. M., Gonzales-Cope M., Zee B. M., Garcia B. A. (2011) Breaking the histone code with quantitative mass spectrometry. Expert Rev. Proteomics 8, 631–643 [DOI] [PMC free article] [PubMed] [Google Scholar]
- 7. Cheung P. (2004) Generation and characterization of antibodies directed against di-modified histones, and comments on antibody and epitope recognition. Methods Enzymol. 376, 221–234 [DOI] [PubMed] [Google Scholar]
- 8. Mann M., Kelleher N. L. (2008) Precision proteomics: the case for high resolution and high mass accuracy. Proc. Natl. Acad. Sci. U.S.A. 105, 18132–18138 [DOI] [PMC free article] [PubMed] [Google Scholar]
- 9. Perkins D. N., Pappin D. J., Creasy D. M., Cottrell J. S. (1999) Probability-based protein identification by searching sequence databases using mass spectrometry data. Electrophoresis 20, 3551–3567 [DOI] [PubMed] [Google Scholar]
- 10. Fu Y., Yang Q., Sun R., Li D., Zeng R., Ling C. X., Gao W. (2004) Exploiting the kernel trick to correlate fragment ions for peptide identification via tandem mass spectrometry. Bioinformatics 20, 1948–1954 [DOI] [PubMed] [Google Scholar]
- 11. Eng J. K., McCormack A. L., Yates J. R. (1994) An approach to correlate tandem mass spectral data of peptides with amino acid sequences in a protein database. J. Am. Soc. Mass Spectrom. 5, 976–989 [DOI] [PubMed] [Google Scholar]
- 12. Yuan Z. F., Lin S., Molden R. C., Garcia B. A. (2014) Evaluation of proteomic search engines for the analysis of histone modifications. J. Proteome Res. 13, 4470–4478 [DOI] [PMC free article] [PubMed] [Google Scholar]
- 13. Bonaldi T., Imhof A., Regula J. T. (2004) A combination of different mass spectroscopic techniques for the analysis of dynamic changes of histone modifications. Proteomics 4, 1382–1396 [DOI] [PubMed] [Google Scholar]
- 14. Peters A. H., Kubicek S., Mechtler K., O'Sullivan R. J., Derijck A. A., Perez-Burgos L., Kohlmaier A., Opravil S., Tachibana M., Shinkai Y., Martens J. H., Jenuwein T. (2003) Partitioning and plasticity of repressive histone methylation states in mammalian chromatin. Mol. Cell 12, 1577–1589 [DOI] [PubMed] [Google Scholar]
- 15. Syka J. E., Marto J. A., Bai D. L., Horning S., Senko M. W., Schwartz J. C., Ueberheide B., Garcia B., Busby S., Muratore T., Shabanowitz J., Hunt D. F. (2004) Novel linear quadrupole ion trap/FT mass spectrometer: performance characterization and use in the comparative analysis of histone H3 post-translational modifications. J. Proteome Res. 3, 621–626 [DOI] [PubMed] [Google Scholar]
- 16. Garcia B. A., Mollah S., Ueberheide B. M., Busby S. A., Muratore T. L., Shabanowitz J., Hunt D. F. (2007) Chemical derivatization of histones for facilitated analysis by mass spectrometry. Nat. Protoc. 2, 933–938 [DOI] [PMC free article] [PubMed] [Google Scholar]
- 17. Lin S., Wein S., Gonzales-Cope M., Otte G. L., Yuan Z. F., Afjehi-Sadat L., Maile T., Berger S. L., Rush J., Lill J. R., Arnott D., Garcia B. A. (2014) Stable Isotope labeled histone peptide library for histone post-translational modification and variant quantification by mass spectrometry. Mol. Cell. Proteomics. 13, 2450–2466 [DOI] [PMC free article] [PubMed] [Google Scholar]
- 18. Sidoli S., Lin S., Xiong L., Bhanu N. V., Karch K. R., Johansen E., Hunter C., Mollah S., Garcia B. A. (2015) SWATH Analysis for Characterization and Quantification of Histone Post-translational Modifications. Mol. Cell. Proteomics. mcp.O114.046102 [DOI] [PMC free article] [PubMed] [Google Scholar]
- 19. DiMaggio P. A., Jr., Young N. L., Baliban R. C., Garcia B. A., Floudas C. A. (2009) A mixed integer linear optimization framework for the identification and quantification of targeted post-translational modifications of highly modified proteins using multiplexed electron transfer dissociation tandem mass spectrometry. Mol. Cell. Proteomics 8, 2527–2543 [DOI] [PMC free article] [PubMed] [Google Scholar]
- 20. Guan S., Burlingame A. L. (2010) Data processing algorithms for analysis of high resolution MSMS spectra of peptides with complex patterns of posttranslational modifications. Mol. Cell. Proteomics 9, 804–810 [DOI] [PMC free article] [PubMed] [Google Scholar]
- 21. Schilling B., Rardin M. J., MacLean B. X., Zawadzka A. M., Frewen B. E., Cusack M. P., Sorensen D. J., Bereman M. S., Jing E., Wu C. C., Verdin E., Kahn C. R., Maccoss M. J., Gibson B. W. (2012) Platform-independent and label-free quantitation of proteomic data using MS1 extracted ion chromatograms in skyline: application to protein acetylation and phosphorylation. Mol. Cell. Proteomics 11, 202–214 [DOI] [PMC free article] [PubMed] [Google Scholar]
- 22. Ong S. E., Blagoev B., Kratchmarova I., Kristensen D. B., Steen H., Pandey A., Mann M. (2002) Stable isotope labeling by amino acids in cell culture, SILAC, as a simple and accurate approach to expression proteomics. Mol. Cell. Proteomics 1, 376–386 [DOI] [PubMed] [Google Scholar]
- 23. Zee B. M., Britton L. M., Wolle D., Haberman D. M., Garcia B. A. (2012) Origins and formation of histone methylation across the human cell cycle. Mol. Cell. Biol. 32, 2503–2514 [DOI] [PMC free article] [PubMed] [Google Scholar]
- 24. Lin S., Garcia B. A. (2012) Examining histone posttranslational modification patterns by high-resolution mass spectrometry. Methods Enzymol. 512, 3–28 [DOI] [PMC free article] [PubMed] [Google Scholar]
- 25. Zee B. M., Levin R. S., Dimaggio P. A., Garcia B. A. (2010) Global turnover of histone post-translational modifications and variants in human cells. Epigenetics Chromatin 3, 22. [DOI] [PMC free article] [PubMed] [Google Scholar]
- 26. Evertts A. G., Zee B. M., Dimaggio P. A., Gonzales-Cope M., Coller H. A., Garcia B. A. (2013) Quantitative dynamics of the link between cellular metabolism and histone acetylation. J. Biol. Chem. 288, 12142–12151 [DOI] [PMC free article] [PubMed] [Google Scholar]
- 27. Yuan Z. F., Liu C., Wang H. P., Sun R. X., Fu Y., Zhang J. F., Wang L. H., Chi H., Li Y., Xiu L. Y., Wang W. P., He S. M. (2012) pParse: a method for accurate determination of monoisotopic peaks in high-resolution mass spectra. Proteomics 12, 226–235 [DOI] [PubMed] [Google Scholar]
- 28. Senko M. W., Beu S. C., McLaffertycor F. W. (1995) Determination of monoisotopic masses and ion populations for large biomolecules from resolved isotopic distributions. J. Am. Soc. Mass Spectrom. 6, 229–233 [DOI] [PubMed] [Google Scholar]
Associated Data
This section collects any data citations, data availability statements, or supplementary materials included in this article.