Abstract
Heparin and heparan sulfate are very large linear polysaccharides that undergo a complex variety of modifications and are known to play important roles in human development, cell–cell communication and disease. Sequencing of highly sulfated glycosaminoglycan oligosaccharides like heparin and heparan sulfate by liquid chromatography-tandem mass spectrometry (LC-MS/MS) remains challenging because of the presence of multiple isomeric sequences in a complex mixture of oligosaccharides, the difficulties in separation of these isomers, and the facile loss of sulfates in MS/MS. We have previously introduced a method for structural sequencing of heparin/heparan sulfate oligosaccharides involving chemical derivatizations that replace labile sulfates with stable acetyl groups. This chemical derivatization scheme allows the use of reversed phase LC for high-resolution separation and MS/MS for sequencing of isomeric heparan sulfate oligosaccharides. However, because of the large number of analytes present in complex mixtures of heparin/HS oligosaccharides, the resulting LC-MS/MS data sets are large and cannot be annotated with existing glycomics software because of the specifically designed chemical derivatization strategy. We have developed a tool, called GAG-ID, to automate the interpretation of derivatized heparin/heparan sulfate LC-MS/MS data based on a modified multivariate hypergeometric distribution to weight the annotation of more intense peaks. The software is tested on a LC-MS/MS data set collected from a mixture of 21 synthesized heparan sulfate tetrasaccharides. By testing the discrimination of scoring with this system, we show that stratifying peaks into different intensity classes benefits the discrimination of scoring, and GAG-ID is able to properly assign all 21 synthetic tetrasaccharides in a defined mixture from a single LC-MS/MS run.
Heparin and heparan sulfate (HS)1 are involved in numerous physiological (1) and pathophysiological (2) processes, including cellular and organ development (3, 4), cancer (5, 6), and angiogenesis (7). Furthermore, heparin and heparan sulfate have been linked to regulation of cell growth (8), cell adhesion (9), inflammation and immune cell migration (10), neural development and regeneration (11, 12), and hemostasis (13). Heparin/HS is composed of variously sulfated hexuronic acid (1→4) d-glucosamine-repeating disaccharide building blocks, with heparin being a more heavily sulfated form of heparan sulfate (14). The uronic acid residue of heparin/HS may be either α-l-iduronic acid (IdoA) or β-d-glucuronic acid (GlcA) and can be unsubstituted or sulfated at the 2-O position. The modification reactions in heparin/HS biosynthesis are thought to occur in clusters along the chain, with regions devoid of sulfate separating the modified tracts. This arrangement gives rise to segments referred to as N-acetylated (NA), N-sulfated (NS), and mixed domains (NA/NS). The modification reactions often fail to go to completion, resulting in tremendous heterogeneity among the modified regions (15). Interestingly, the biological function of a particular region of heparin/HS is dictated primarily through the interactions that region has with specific effector proteins, and the specificity of these interactions is dictated by the pattern of modification of the heparin/HS region. This biologically essential microheterogeneity of heparin/HS makes sequencing of these oligosaccharide regions challenging because of the variable patterns of sulfation and acetylation, as well as the presence of epimers of uronic acid.
Tandem mass spectrometry (MS/MS) is an important tool for the structural characterization of carbohydrates, as it offers high sensitivity coupled with reproducible structural information (16, 17). However, a major challenge to the use of tandem mass spectrometry for structural sequencing of heparin/HS oligosaccharides is sulfate loss during fragmentation. As heparin/HS is collisionally activated, one of the most common fragmentation pathways is the loss of the sulfate modifications, resulting in a loss of structural information regarding the original site of sulfation. It has been shown that the loss of sulfate groups can be minimized by using a combination of charge state manipulation and metal ion adduction or by using alternative fragmentation methods instead of conventional collision induced dissociation, such as electron detachment dissociation and negative electron transfer dissociation (18–20). However, substantial difficulties remain in coupling this technology with separations technology capable of separating isomeric sequences. Our lab has developed a chemical derivatization strategy including sequential permethylation, desulfation, and pertrideuteroacetylation to allow successful separation and sequencing of mixtures of GAG oligosaccharide by LC-MS/MS. This method is attractive as it allows for electrospray-compatible separation of isomeric sequences and is able to fully sequence all sulfation and acetylation patterns using only glycosidic bond cleavages. However, the data from this derivatization method cannot be easily incorporated into current glycomics software, such as GlycoWorkbench (21, 22), because of the multistep derivatizations and lack of a confident scoring algorithm for evaluating matches (23).
Database searching approaches have been successfully shown in proteomic research as a key bioinformatics tool to link proteomic MS/MS spectra to peptide sequences from the protein database. The importance of scoring matches between peptide sequences and MS/MS spectra can be observed in the diversity of algorithms created for this purpose. Comparisons have been conducted by cross correlation (24), hypergeometric distribution (25, 26), Poisson distributions (27), Mowse scores (28), Bayesian statistics (29), dot products (30), and several other methods. Many of these algorithms score potential identifications by evaluating the number of fragment ions matched between each peptide sequence and an observed spectrum. However, these systems often do not distinguish between matching an intense peak and matching a minor peak. This does not benefit the discrimination of scoring, where matching the significant peaks in the spectrum should lead to a result being more reliable. Tabb and coworkers (31) have introduced an open-source program called MyriMatch, which uses a statistical model to score peptide matches and is based on multivariate hypergeometric distribution analysis. This program highlights the limitation of existing database search algorithms that count matched peaks without differentiating them by intensity. However, it is designed for proteomic research and modeled based on proteomic data sets.
The development of software tools in glycomics research is currently undergoing rapid changes, yet remains insufficient, especially in the fields of GAGs (32). Four software tools have recently been described for the targeted evaluation of GAG MS data. Venkatraman and coworkers (33) developed a systematic method to manually sequence oligosaccharides using sequential enzyme digestion from the target oligosaccharide, but the software reported lacks an advanced scoring system. Saad and Leary (34) refined this basic approach and introduced a program called heparin oligosaccharide sequencing tool (HOST) for automated sequencing using the results of tandem mass spectrometry for disaccharides produced by sequential enzyme digestion from the target oligosaccharide. The use of such a method is limited in application to structurally homogeneous samples and requires digestion with several heparin lyases. Later, Maxwell et al. (35) published an open-source program, GlycReSoft, for compositional annotation of multiple charged glycan ions from LC/MS data. Although this software aims to provide confident compositional analyses of oligosaccharides in complex data sets, it is limited to MS analysis to determine composition and not MS/MS data to provide oligosaccharide sequence.
Hu et al. (36) recently published HS-SEQ, the first comprehensive algorithm for HS de novo sequencing using high resolution negative electron transfer dissociation tandem mass spectra. Although the program successfully aims to optimize the sulfation patterns of GAG oligosaccharide without searching against a database, which does not exist because of the nontemplated nature of GAG biosynthesis, it is limited to analysis of a single compound instead of mixtures.
Heparin/HS oligosaccharides have linear structures composed of a finite and defined array of disaccharide sequences, analogous to peptide sequences. Therefore, we have pursued a strategy modeled on approaches currently used for analysis of peptide MS/MS data. However, the major difference is that peptide sequencing algorithms typically match the MS/MS spectra to a database of theoretical spectra derived from protein sequences computationally reconstructed from nucleic acid template sequencing, which does not exist for GAGs like heparin/HS. We have developed a theoretical sequence database, GAG-DB, which contains every possible derivatized sequence of heparin/HS for oligosaccharides up to dodecamer, and we use it as our database for spectral matching. We employed a multivariate hypergeometric distribution as the core scoring algorithm for matching experimental spectra to our comprehensive theoretical database. Our software, GAG-ID, scores oligosaccharide fragment ion matches against theoretical fragmentation patterns using a multivariate hypergeometric distribution scoring model in order to compute the probability of the match occurring by random chance for each pairing of candidate sequence and spectrum. Using theoretical HS sequence assignments to spectra generated from a defined mixture of 21 synthesized heparin/HS tetrasaccharides, the model is shown to produce probability-based scores that accurately identify the correct HS structure and discriminate correct from incorrect HS identifications.
This method for calculating the probability-based score that a synthesized oligosaccharide is present in the sample given the acquired mass spectrometric information is of great importance of glycosaminoglycan sequencing research. It is automated and does not fully rely on subjective “expert” judgment (manual validation). Furthermore, the searching time, which depends on the complexity of the sample and selected database size, is reasonable for the data set sizes typically encountered. Finally, our GAG-ID software coupled with our previously published heparin/HS derivatization LC-MS/MS method developed in our lab makes high-throughput sequencing of heparin/HS oligosaccharide mixtures possible.
EXPERIMENTAL PROCEDURES
Synthetic HS Tetrasaccharides
A synthetic HS tetrasaccharide library composed of 21 sequences was generously provided by Prof. Geert-Jan Boons group (37), which included a total of 21 tetrasaccharides with alkyl linker, varying in sulfation number and position as well as epimerizations (see supplemental Table S1).
Chemical Derivatization of HS Tetrasaccharides
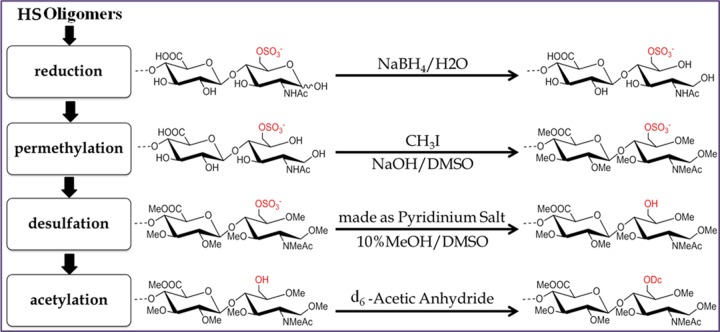
Complete permethylation, desulfation, and pertrideuteroacetylation were performed to replace the original sulfate groups with trideuteroacetyl groups. Detailed procedures have been described in our previous work for structural analysis of synthetic HS oligosaccharides (38) (Fig. 1). Briefly, the dried triethylammonium salts of HS tetrasaccharides (10–100 μg) were permethylated using sodium hydroxide and methyl iodide in dimethyl sulfoxide (DMSO), followed by desalting using a C18 Sep-Pak cartridge (Waters Co., Milford, MA). The pyridinium salts of the permethylated products were resuspended in DMSO containing 10% methanol and incubated for 4h at 95 °C to remove the sulfate groups. The dried desulfated products were then trideuteroacetylated by incubating with d6-acetic anhydride in pyridine at 50 °C overnight and solvent was dried under vacuum. The final derivatized products were resuspended in 10% acetonitrile/water at specified concentrations for subsequent LC-MS/MS analysis.
Fig. 1.
Chemical derivatizations of HS Oligogmers. Before MS/MS analysis, sequential chemical derivatizations were applied to HS oligomers, including permethylation, desulfation, and acetylation steps. d6-labeled acetic anhydride was used to differentiate the N-acetylated and N-sulfated amino-sugars, giving mass difference of 3Da for -COCH3. [Me:-CH3, Ac:-COCH3, Dc:-COCD3]
LC-MS/MS Analysis
Online reverse phase separations were performed on a C18 HALO fused core porous shell column (0.2 × 500 mm, 5.0 μm, 160 Å, Advanced Material Technology, Wilmington, DE). For separation of synthetic HS tetrasaccharides, a 140 min gradient was used from 35% to 55% buffer B. Buffer B was prepared as acetonitrile with 0.1% formic acid, and buffer A was 0.1% formic acid in water with or without 1 mm sodium formate. Flow rate of 2 μl/min and a 2 μl injection at a sample concentration of 1 μg/μl were used for both mixture analyses. Mass spectrometry was performed in positive ion mode on a Thermo LTQ-FT instrument (Thermo Scientific, Waltham, MA). Full MS were acquired in FT mode and CID-MS/MS spectra were acquired in ion trap mode. External calibration of the instrument produced mass accuracy of <5ppm for full MS spectra, which enabled the use of accurate mass measurement for composition determination of precursor ions. A data dependent MS/MS method was used, with the top-four abundant precursor ions selected, to trigger CID-MS/MS fragmentation. Instrument parameters were set as: spray voltage at 1–2 kV, capillary voltage at 40 V, tube lens at 80 V and capillary temperature at 250 °C. The collision energy for CID fragmentation was set between 30V and 50V.
Theoretical Database
The total number of tetrasaccharide sequences that were generated for GAG-DB, where the possible charge states of the precursor ions were +1 and +2, and the charge carrying ion was limited to proton (H+), was 992 (Table I). However, the total number of tetrasaccharide sequences increased to 3968 when a mixture of protons and sodiums were allowed as charge carriers, and when the reducing end was allowed to be reduced or nonreduced. The same trend applies for longer HS oligosaccharides. We have currently generated databases up to dodecasaccharide in length.
Table I. The number of theoretical sodiated oligosaccharide database entries in the GAG-DB.
| Length of Oligosaccharide | Number of Database Entries |
|---|---|
| Tetrasaccharide | 992 |
| Hexasaccharide | 15872 |
| Octasaccharide | 253952 |
| Decasaccharide | 4063232 |
| Dodecasaccharide | 65011712 |
Data Preprocessing
Prior to data analysis, each MS/MS spectrum was centroided and converted to Mascot generic format (mgf) using the open-source software ProteoWizard (http://proteowizard.sourceforge.net/) (40). The m/z list of each observed GAG precursor ion detected in the sample was compared with theoretical, derivatized precursor ions from GAG-DB as modified by user input (i.e. reducing end type, ionizing adduct type, size range) within a specified tolerance (± 0.05 Da for FT-ICR MS). A list of candidate precursor ions was generated and further annotated by searching against theoretical fragment ions with observed product ions.
Tunable Classification
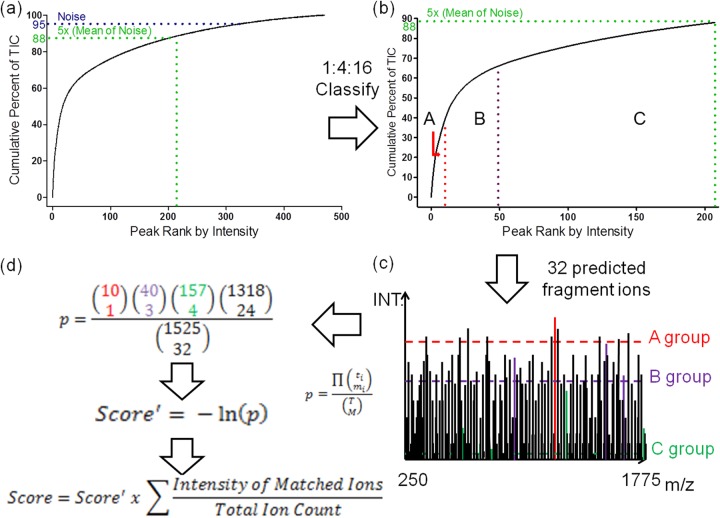
During preprocessing (see supplemental Fig. S1), the software computes the total ion count (TIC) for each spectrum by adding the fragment ion sorted from most to least intense for each MS/MS spectrum (Fig. 2, A). We optimized the number of ion intensity classes that should be employed during scoring. To reduce the risk of hitting the peaks randomly, we eliminated peaks below five times the background signal from the spectrum during preprocessing. Background signal was defined as the average of the 5% of the peaks with the lowest intensity in the spectrum. The remaining peaks were split into three classes based on intensity at a class population ratio of 1:4:16, with the class containing the most intense ions having the fewest peaks. This ratio was chosen according to the spectra quality, however, the ratio of 1:4:16 was verified by our synthetic HS/heparin GAG data set. For example, if three intensity classes were optimized and 207 peaks were retained from a particular MS/MS spectrum after preprocessing, the most intense “A” set will contain 10 peaks, the intermediate “B” set will contain 40 peaks, and the least intense “C” set will contain 157 peaks (Fig. 2B).
Fig. 2.
Matching and Scoring. A, During preprocessing, the fragment ions for each spectrum are sorted by intensity in decreasing order. The cumulative intensity from the most intense peak to the least intense peak is computed (represented by the curve). A fraction of the original TIC is retained (in this case, 88%), with the remaining peaks stripped out as minor peaks which often represent background noise or uncommon fragment ions not included in our theoretical database (e.g. minor cross-ring cleavages). B, The remaining peaks are split into classes, each of which has four times as many members as the previous class and are sorted by abundance. In this example, three classes were divided and marked as A, B, and C representatively with a population ratio of 1:4:16. C, An example shows how peaks matched to theoretical predicted fragment ions within the specified m/z tolerance (in this case 32 peaks out of 1525 bins are matched) are classified into different groups. D, A score', represented by the negative of the log probability, is reported. To penalize noisy spectra, the final score consists of score' weighted by the ratio of the summation of the ion current that is explained by the fragmentation model to the summation of the total product ion current.
Peak Assignment
For each theoretical fragment m/z value of a matched GAG structure, the corresponding location in an experimental spectrum is tested to determine whether or not any peak is present, and if so, the peak is placed in the appropriate class based on intensity. To match, an observed peak must fall within an m/z interval as determined by specified tolerance of the target location (±0.5 Da for ion traps). In the event that multiple peaks are present at a particular m/z interval for a single theoretical peak, the product ion with the highest intensity is taken as the match. In the event that multiple theoretical product ions could match a single experimental peak, only one match is counted for generating a score but both potential matches are reported in peak annotation. Although partial neutral losses of methanol and trideuteroacetic acid were common in the experimental protocol used, the neutral loss product ion is only considered as matched when both M and M-Δm are observed together. In the current software version, when the glycosidic bond cleavage product ion is observed intact (M), Δm of 63.034 for trideuteroacetic acid, of 32.026 for methanol, and of 144.042 for unsaturated nonreducing end cross-ring cleavage are considered.
Peak Binning
For each spectrum, the software counts the total number of intervals at which no peak is present. Furthermore, it also determines the total number of peaks in each intensity class. For illustration purposes, the set of intervals can be envisioned as a collection of bins where we assume the bin size is 1 Da (±0.5 Da accuracy). The bins represent the intervals that can be occupied, and the balls represent peaks in the spectrum. Red balls represent class A peaks, four times as many purple balls represent class B peaks, and four times again as many green balls represent class C peaks. Each matched observed fragment ions can then be represented by selecting a number of balls from this collection.
Multivariate Hyper-geometric Distribution
To compute the probability of this match occurring by random chance, the GAG-ID employed the multivariate hypergeometric (MVH) distribution:
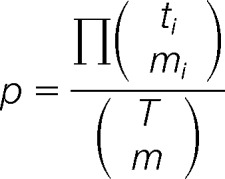 |
where p is the probability of the match occurring randomly, ti is the number of peaks from a particular intensity class in the spectrum, mi is the number of peaks from a particular intensity class matched to the theoretical fragment ion list, T is the total number of resolvable bins in the spectrum (as determined by mass tolerance), and M is the total number of theoretical peaks predicted from the GAG sequence, i is from 1 to (number of class) + 1. The number of missed matches and of “missing” peaks in the spectrum must be included in the ti and mi terms for this probability to be correct. GAG-ID employs the MVH distribution rather than the multinomial distribution. By matching to a peak of the highest intensity class, the probability that another peak will be randomly matched from this class by other predicted peaks can be reduced. The probability of peak assignment differentiates the MVH distribution from the multinomial distribution, as the matching of a peak to a specific class alters the probability of randomly matching to that class again. Returning to the ball analogy, this means that once a red ball has been drawn from the collection, the probability of drawing a red ball had been reduced because the ball had been removed from the collection. In contrast, “replacement” as practiced in binomial and multinomial does not alter the probability of randomly matching the members of a class upon matching of a peak to that class in our analogy, the red ball is returned to the pool before the next ball is drawn. Because each observed peak can only be matched to a single expected m/z value from a candidate GAG sequence, the “no replacement” rule better applies. For example, one spectrum contains 10 class A peaks, 40 class B peaks, and 157 class C peaks (red, purple, and green groups, respectively, Fig. 2B, 2C, and 2D). The spectrum extends from m/z 250 to 1775. The number of intervals that can be occupied in the spectrum (total number of bins) is 1525 (given an accuracy of ±0.5 Da), of which eight are occupied by classified peaks (i.e. colored balls), leaving 1517 voids (empty bins). For instruments of greater mass accuracy, the number of intervals that can be occupied for a given range of m/z values is higher than those with lower mass accuracy. Of 32 fragment ions that were predicted for a particular GAG sequence, one matched to class A peaks, three matched to class B peaks, and four matched to class C peaks, leaving 24 theoretical fragments with no observed m/z value in the spectrum. The probability for this match is
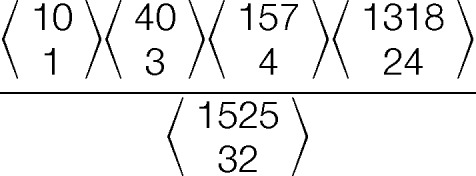 |
or 1.18 × 10⁻⁴. Transformed to the natural logarithm (ln) domain, the MVH distribution probability can be transformed to calculate with only addition and subtraction. The negative of this log probability is reported as score′. For example, the score′ for the situation described here is 9.04, indicating that the probability of this match occurring at random is e−9.04. Finally, to determine the final score, score′ is multiplied by the ratio of the summation of matched ion intensity to the summation of total ion intensity. This weighting factor is introduced to favor spectra where the bulk of the product ion intensity can be explained by our fragmentation model, penalizing noisy spectra.
Delta Deviation
Delta deviation (S-ΔDev (%)) represents the significance of the best assignment for each spectrum by comparing the score of the best assignment to the score of the second-best assignment. The larger the delta deviation is, the more significant the best assignment is. The function of delta deviation in GAG-ID is similar to dCn in SEQUEST (24). The S-ΔDev (%) is defined as below, where STop1 is the highest reporting score of the GAG sequence used to annotate the spectrum.
 |
Graphical User Interface (GUI)
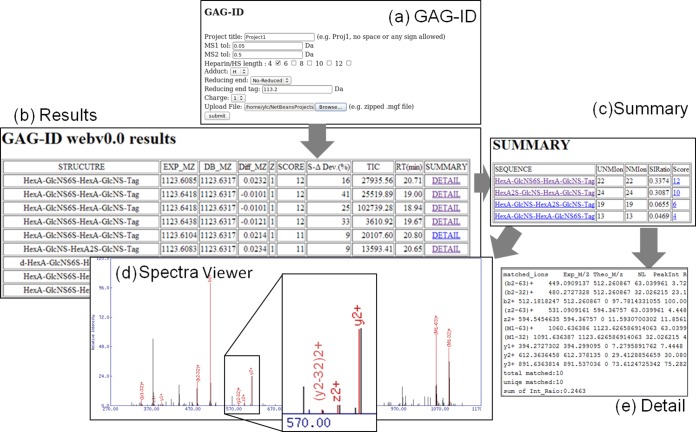
The core function of GAG-ID was written using the programming language Perl, and the client side service was implemented with Java. Fig. 3, illustrates the GAG-ID web interface and results output. All possible heparin sequences with a score greater than 0 are listed in the Results page and Summary page. The isomeric structures that scored greater than zero are listed in descending order of score in the Summary page. The annotated peaks are labeled in red in the Spectra Viewer. The Spectra Viewer was written in Perl and utilizes the MassSpec library, which is publicly available from CPAN (http://search.cpan.org/). The matched fragment ions are tabulated in the Detail page.
Fig. 3.
Screenshot of GAG-ID interface and report. The GAG result was generated with .mgf format of MS/MS spectra and parameters searched against the GAG-DB. A, The interface of GAG-ID data submission. Several parameters are required, including project name, tolerance for MS and MS/MS, database, HS length, modifications and input peak list (.mgf format). B, Results. The MS/MS search results, including experimental m/z (EXP MZ), theoretical m/z (DB MZ), difference between experimental and theoretical m/z (Diff MZ), charge (Z), Score, Delta deviation (S-ΔDev(%)), Total Ion Count (TIC), Retention Time(RT(min)), and a clickable link to the Summary page. C, Summary. The Summary page, listing the isomeric structures matched to that MS/MS spectrum with a score greater than zero, including sequence, number of unique matched ions (UNMIon), a summation of ion ratio matched (SIRatio), and score. D, SpectraViewer. When a sequence is clicked in Summary, the MS/MS data complete with peak annotation is presented by the spectra viewer. E, Detail. When a score is clicked in Summary, tabulated details of the matched fragment ions are listed for export by the user.
RESULTS
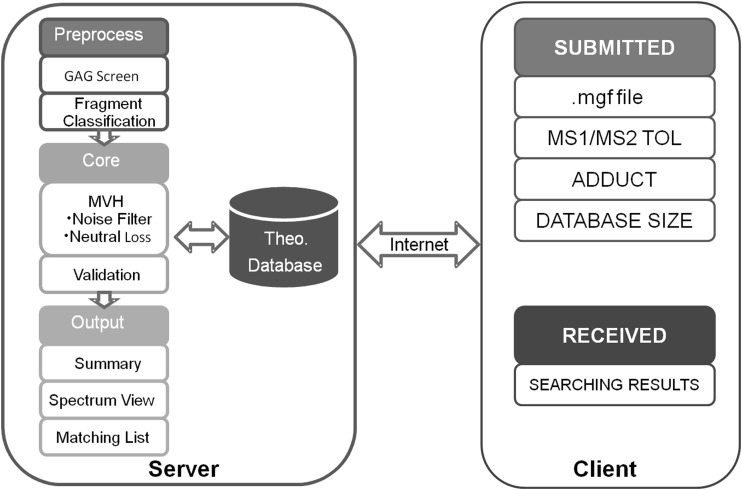
The ability to automatically annotate spectra with confidence from heparin/HS GAG mixture data sets was a primary goal for the development of GAG-ID. For this purpose, the theoretical GAG-DB was created and used to test a data set generated from LC-MS/MS analysis of a defined mixture of 21 synthetic, derivatized tetrasaccharides. The experimental MS/MS spectra were matched to theoretical spectra in the database, and the score was determined using MVH. The parameters for running GAG-ID for this defined mixture were: tetrasaccharide database, an m/z = 113.2 tag (alkyl linker) on the reducing end, 0.05 Da for MS1 tolerance, and 0.5 Da for MS/MS tolerance, and protons assigned as the charge-carrying species. The 992 theoretical tetrasccharide sequences were searched in the GAG-DB. Fig. 4 illustrates the GAG-ID web application, in which researchers are asked to input the MS/MS spectra and corresponding parameters. The GAG-ID server consists of three components, preprocessing, core, and output. The result of the calculation was a downloadable archive (see below).
Fig. 4.
GAG-ID web application. The web application allows users to analyze the LC-MS/MS spectrum for HS through the internet, including inputting search parameters and uploading the .mgf file from the client. The .mgf file will be processed, scored and summarized into the downloadable results package from server client.
GAG-ID Searching of a Data Set from a Defined Mixture of HS
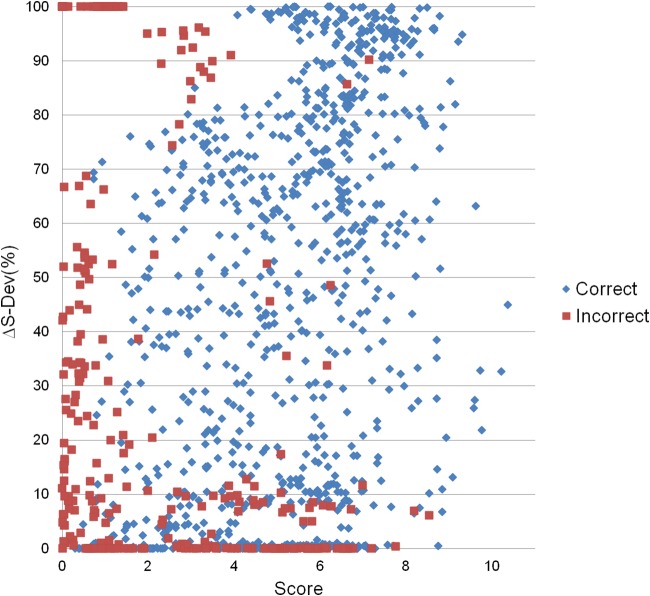
A mixture of 21 tetrasaccharides were processed by serial chemical derivatization and analyzed by LC-MS/MS. In this mixture, there were four sets of synthetic tetrasaccharides (see supplemental Table S1). Three of these four sets contained five isomeric structures (m/z = 1117.596, 1123.633, and 1154.648) and one of the four sets contained six isomeric structures (m/z = 1148.609). Not all isomeric structures can be differentiated by GAG-ID; a small number of isomers differ only by epimerization, which is not calculated in the current version of GAG-ID (see supplemental Table S2 and Figure S2). To reduce false positive hits, to enhance mixture analysis by MS/MS, and to lead to an overall faster running time, all observed precursor ions were filtered by GAG-DB. These 21 structures were completely sequenced by GAG-ID. Furthermore, to assign the level of confidence to scoring function, we used a discrimination function often applied in peptide/protein analysis, S-Δdev (%). To test the ability of GAG-ID to identify GAG sequences (as determined by score) and properly assign high confidence to these assignments as opposed to other isobaric sequences (as determined by S-Δdev (%) values), we plotted the correlation between Score and S-Δdev (%) for both correct and incorrect hits in our synthetic mixture (Fig. 5). GAG-ID is capable of clustering correct assignments (i.e. sequences that are known to be present in the defined tetrasaccharide mixture) at both high Score values and high S-Δdev (%) values, whereas incorrect assignments (i.e. sequences that are known to not be present in the defined tetrasaccharide mixture) cluster much more strongly at low Score and/or low S-Δdev (%) values. Some correct spectra assignments gave high Score values with low S-Δdev (%) values; as expected, these assignments tended to be of spectra of lower quality or chimeric spectra (see Chimeric MS/MS spectra section in Discussion).
Fig. 5.
Score versus S-ΔDev (%). The S-ΔDev (%) plotted versus the score reported by GAG-ID. The segregation of correct hits from a defined synthetic mixture of 21 tetrasaccharides (blue diamonds) versus incorrect hits (red boxes) indicate not only discrimination from the score value itself but also discrimination based on the confidence of score as represented by the S-ΔDev (%) value.
Peak Filtering and Classification
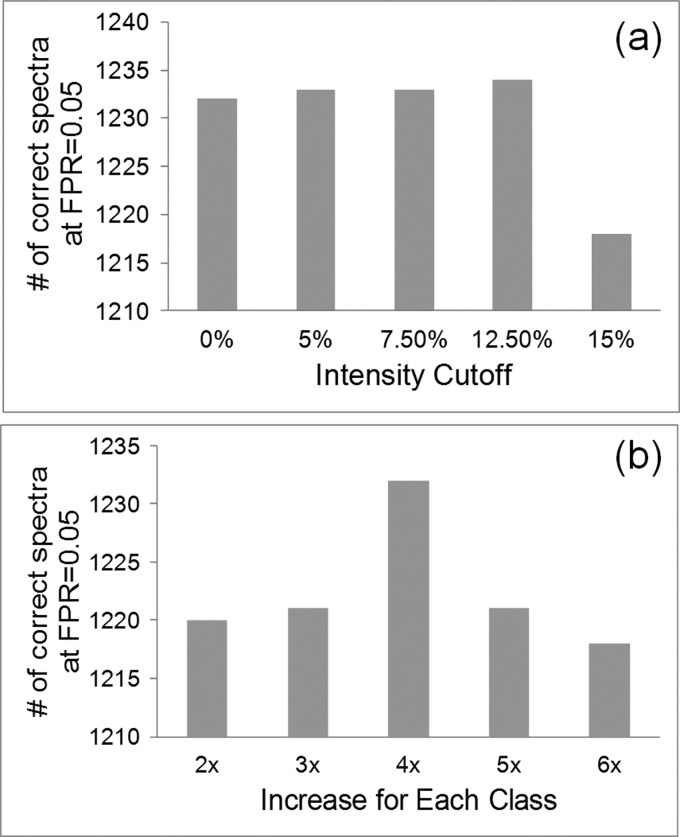
To determine the appropriate intensity filter, five intensity cut-off ratios were tested, from a no cut-off model up to six times the average of the lowest 5% intensity peaks model. Fig. 6A illustrated the intensity filtering evaluation. Here, in order to reduce the peaks variation from each spectrum without reducing discrimination in most cases, the method of taking the average of the lowest 5% abundant peaks was applied, instead of taking the absolute lowest 5% peak abundance as noisy filter. The three times (∼7.5%), five times (∼12.5%) to six times (∼15%) the average of the lowest 5% abundant peaks were filtered from each spectrum. This evaluation indicated that the five times (∼12.5%) model kept the most correct spectra at a score cutoff where the false positive rate (FPR) was 0.05. The FPR was defined as the number of MS/MS spectra where the assigned sequence was known to not be present in our standard mixture divided by the total number of assigned MS/MS spectra.
Fig. 6.
Evaluation. GAG-ID performance was evaluated using different thresholding and scoring configurations. The ability of each configuration to identify the largest number of correct hits in a defined mixture at a real FPR of 0.05 was tested. A, The intensity threshold was tested starting from 0% (no cutoff), 5% (absolute lowest 5% abundant peaks), 7.5%(three times the average of the lowest 5% abundant peaks), 12.5%(five times the average of the lowest 5% abundant peaks), and 15% (six times the average of the lowest 5% abundant peaks). B, Class sizes were in a ratio of N: 1 (n = 2, 3, 4, 5, and 6) for a three class system, with the most intense peaks residing in the smallest class.
Tabb and coworkers reported that the three class MVH model was effective in very dense and sparse spectra alike and reported no advantage in moving to a four class model (31). Five different configurations of the three-class MVH model were tested. From twofold to sixfold increase in the number of peaks in each class were tested, each segregating observed peaks into three classes of intensity. Class sizes were in a ratio of N:1 (n = 2, 3, 4, 5, and 6) with the most intense class holding the fewest peaks. Each increase in class number placed an increasing amount of importance on the intensity information for these peaks. This evaluation revealed that fourfold increase (1:4:16) model kept the most correct spectra for our synthetic tetrasaccharide mixture with a score cutoff yielding an FPR of 0.05 (Fig. 6B).
Performance
The running time of GAG-ID depends on the complexity of sample and the selected database. For example, in this report, the MS/MS run of the 21 tetrasaccharide mixture took 90 minutes to complete the full GAG-ID analysis. There were 18,682 MS/MS spectra acquired, 1306 MS/MS spectra which were identified as putative HS oligosaccharide sequence within specified tolerance, and 1295 MS/MS spectra with a resulting score higher than 0. Prior to the GAG-ID implementation, several minutes of manual assessment for each spectrum by an experienced analyst is required. The running time for GAG-ID is measured under the current programming environment, and the running time is expected to improve significantly in the Java based implementation, which is currently under development (data not shown).
Evaluation of Larger Oligosaccharides
In order to evaluate the performance of GAG-ID for the automated identification and annotation of MS/MS from longer HS oligosaccharides, LTQ spectra of a uniformly N-sulfated HS decamer, undecamer, and dodecamer previously analyzed and reported (38) were input into the GAG-ID program with the appropriate anhydrous mannose tag at the reducing end, databases of the appropriate length were chosen with full sodiation, and the spectra were run against our theoretical GAG-DB database. The results of these searches are shown in supplementary Material, supplemental Tables S3–S5. For the larger N-sulfated HS oligosaccharides, the low MS resolution of the LTQ were incapable of differentiating the composition of the derivatized HS from other potential compositions, resulting in multiple possible matches. The theoretical masses of the compositions for the N-sulfated HS oligosaccharides differed by less than 10ppm in some cases, requiring true accurate mass measurements in the MS-mode to correctly assign the composition of these large derivatized oligomers. Some of these matches with incorrect composition scored higher than any match with the correct composition, because of inaccurate assignment of product ions in the spectrum at the lower spectral resolutions. In each case, for the correct composition (supplemental Tables S3–S5, red outlines), the correct structure was the only scoring structure (data not shown), with high-quality product ion annotation for the MS/MS spectrum (e.g. supplemental Fig. S3 for the annotation of the N-sulfated decamer). These results clearly indicate the necessity for high-resolution MS for the correct identification of larger oligosaccharides using GAG-ID.
The mass accuracy required decreases as the length of the GAG decreases. MS/MS spectra of a previously analyzed and reported Arixtra-like heptamer (38) taken from a Waters Synapt G2 mass spectrometer with a MS1 mass tolerance of ±0.1 Da were searched by GAG-ID. This oligosaccharide is interesting not only for its increased length, but also for the heterogeneity of sulfation and the presence of a 3O-sulfated GlcNS. For oligosaccharides of this length, and at these moderate mass accuracies, only a single derivatized composition was identified (data not shown). Within this composition, the highest-scoring sequence was the correct sequence for the oligosaccharide (supplemental Table S6). As expected, as the length of the GAG and the heterogeneity of sulfation increases, the number of scoring matches increase. The result is a relatively low S-Δdev (%) for the score. These results hint at a length- and heterogeneity-dependence for confidence scoring, which may play a role as statistical methods for analyzing GAG-ID results are developed. However, even given these limitations, the correct sequence was reported as the top hit by GAG-ID, indicating the programs ability to make correct assignments given spectra of appropriate resolution and quality, even for larger and more heterogeneous oligosaccharides.
DISCUSSION
A primary bottleneck for dissemination of LC-MS/MS glycomics sequencing methods is the complexity of the data. There is currently no gold standard of features to be used for scoring of glycomics data, and a more profound exploration of features, as well as their relationships, would be beneficial to this problem. With potentially millions of MS/MS spectra per sample, the challenge of sorting through the putative identifications to determine the accuracy of each assignment is monumental, yet is of utmost importance for correct determination of the components within the biological sample. In addition, computational tools to evaluate the accuracy of correct identifications from these high-throughput analyses have not kept pace with technological advances.
Chimeric MS/MS Spectra
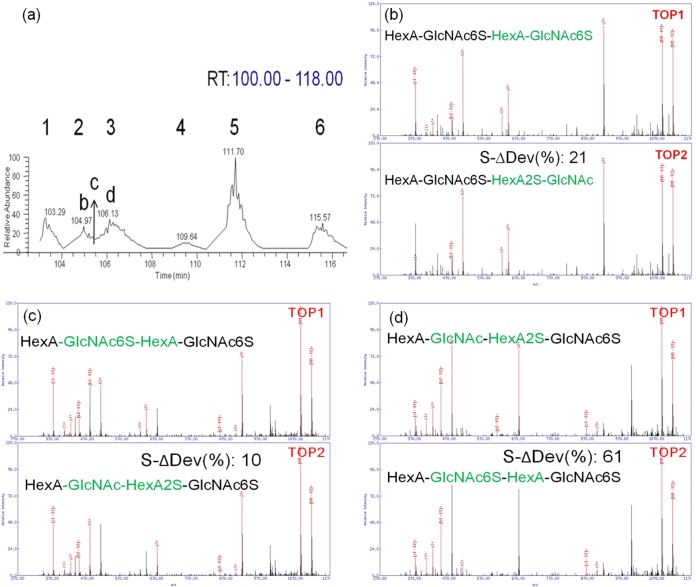
The heterogeneity of the GAGs not only raised the difficulty on sample separation but also led to problems in the analysis. For example, the species with m/z of 1148.609 has six synthesized isomeric tetramer structures. The six major peaks were successfully differentiated (Fig. 7A). The analytes observed at retention time between 104.97 (peak #2) and 106.13 (peak #3) have partially overlapped in the chromatogram. For the peak acquired at 104.97 min, GAG-ID correctly sequenced this peak as HexA-GlcNAc6S-HexA-GlcNAc6S-tag for the top assignment and s-Δdev (%) was 21 (Fig. 7B). For the peak acquired at 106.13 min, the GAG-ID correctly sequenced this peak as HexA-GlcNAc-HexA2S-GlcNAc6S-tag for the top assignment and s-Δdev (%) was 61 (Fig. 7D). Manual examination of the two spectra revealed that there were diagnostic ions to differentiate the Top 1 and Top 2 assignments. However, for the peak acquired at 105.42 min where the two analytes overlapped, GAG-ID sequenced this overlapped peak area as HexA-GlcNAc6S-HexA-GlcNAc6S-tag for the top assignment and HexA-GlcNAc-HexA2S-GlcNAc6S-tag for the second assignment. The S-Δdev (%) was only 10 (Fig. 7C). Manual examination of the MS/MS spectrum found diagnostic ions for both structures, with differentiation occurring based primarily on the relative intensities of the diagnostic ions. Based on these results, it appears that chimeric spectra (i.e. spectra resulting from the simultaneous fragmentation of two or more isobaric GAG sequences) may be determined in at least some cases by GAG-ID as structures with high scores but low S-Δdev (%) values.
Fig. 7.
HS Mixture. The species of m/z 1148. 609 has six synthesized isomeric tetramer structures in our defined mixture. A, The six major peaks were separated by LC. For the peaks that were fully resolved chromatographically (shown in B and D), our scoring function reported that their delta deviation were relatively large (i.e. >20). D, For chromatographically unresolved areas of the LC run (shown in C), our scoring function reported a low delta deviation (<15) with a relatively high score, indicating the presence of multiple isobaric species in the same MS/MS spectrum. The top two assignments from GAG-ID represented the two isomeric components cofragmented in the chimeric MS/MS spectrum.
Hu and coworkers (36) recently published the HS-SEQ, the first comprehensive algorithm for HS de novo sequencing using high resolution negative electron transfer dissociation tandem mass spectra. The authors concluded that de novo sequencing required high-quality tandem mass spectra where most glycosidic-bond cleavages were present and a significant number of terminal-containing product ions be unambiguously assigned. These two requirements are important but remain challenging for practical high-throughput analysis of experimental samples. One of the benefits of the derivatization approach to HS sequencing is the ability to fully sequence the HS oligosaccharide without the need for cross-ring cleavages, greatly reducing the requirements for spectral quality (38). Furthermore, in fully automated sequencing efforts driven by database searching, minimizing the need for human data review has depended on the ability to recognize cases where the target in question is either not in a database or if the database search is yielding a false-positive match. Correlation of the database search results with statistical validation, which has successfully shown and benefited proteomics research, can thus significantly improve the overall reliability of the process (41–43). Our results here show that the database searching approach has great potential, at least for short to moderate length oligosaccharides.
In conclusion, we have shown that GAG-ID is the first software package capable of analyzing LC-MS/MS data of derivatized HS oligosaccharides. GAG-ID is capable of quickly and accurately sequencing HS oligosaccharides using a moderately complex mixture of known HS oligosaccharide standards. The benefits of a database-driven approach to HS sequencing should allow for large data sets of LC-MS/MS runs to be analyzed quickly, and with statistical rigor. The MVH scoring used in our method may also be instructive to design novel algorithms for other complex molecules, once the separation difficulties have been addressed. GAG-ID also shows initial promise in identifying and helping to resolve simple chimeric MS/MS spectra involving two isobaric precursors, which is of tremendous importance in dealing with the high amounts of complexity present in GAG oligosaccharide mixtures. The ability to handle large numbers of MS/MS spectra from complex mixtures of heparin/HS is an essential step in the development of a “heparinomics” method for sequencing complex mixtures of these important biomolecules. A version of the algorithm with a graphical user interface is currently under development for public release. Additional efforts to determine diagnostic MS/MS features for assigning uronic acid epimerization and incorporate these assignments into GAG-ID are also currently underway.
Supplementary Material
Acknowledgments
We thank Prof. Geert-Jan Boons for supplying synthetic tetrasaccharides used for the development of GAG-ID. We also thank Rene Ranzinger and Brent Weatherly for critical remarks, Prof. David L. Tabb for helpful discussions and critical insights, and Sameer Gaherwar for assisting with the web application development.
Footnotes
Author contributions: R.H., R.O., and J.S.S. designed research; Y.C. and R.H. performed research; Y.C. contributed new reagents or analytic tools; Y.C., R.H., and J.S.S. analyzed data; Y.C. and J.S.S. wrote the paper.
* This research is supported by the National Institute of General Medical Sciences of the National Institutes of Health through the “Research Resource for Integrated Glycotechnology” (8P41 GM103390).
 This article contains supplemental Tables S1 to S6 and Figs. S1 to S3.
1 The abbreviations used are:
- HS
- heparan sulfate
- GAG
- glycosaminoglycans
- LC-MS/MS
- liquid chromatography-tandem mass spectrometry
- TIC
- total ion count
- MVH
- multivariate hypergeometric distribution
- DMSO
- dimethyl sulfoxide
- S-ΔDev
- (%) delta deviation
- GUI
- graphic user interface
- FPR
- false positive rate
- HexA
- glucuronic acid or iduronic acid
- d-HexA
- 4, 5-unsaturated uronic acid.
REFERENCES
- 1. Tumova S., Woods A., Couchman J. R. (2000) Heparan sulfate proteoglycans on the cell surface: versatile coordinators of cellular functions. Int. J. Biochem. Cell Biol. 32, 269–288 [DOI] [PubMed] [Google Scholar]
- 2. Sassaki G. L., Riter D. S., Santana Filho A. P., Guerrini M., Lima M. A., Cosentino C., Souza L. M., Cipriani T. R., Rudd T. R., Nader H. B., Yates E. A., Gorin P. A., Torri G., Iacomini M. (2011) A robust method to quantify low molecular weight contaminants in heparin: detection of tris(2-n-butoxyethyl) phosphate. Analyst 136, 2330–2338 [DOI] [PubMed] [Google Scholar]
- 3. Mitsiadis T. A., Salmivirta M., Muramatsu T., Muramatsu H., Rauvala H., Lehtonen E., Jalkanen M., Thesleff I. (1995) Expression of the heparin-binding cytokines, midkine (MK), and HB-GAM (pleiotrophin) is associated with epithelial-mesenchymal interactions during fetal development and organogenesis. Development 121, 37–51 [DOI] [PubMed] [Google Scholar]
- 4. Makarenkova H. P., Hoffman M. P., Beenken A., Eliseenkova A. V., Meech R., Tsau C., Patel V. N., Lang R. A., Mohammadi M. (2009) Differential interactions of FGFs with heparan sulfate control gradient formation and branching morphogenesis. Sci. Signal. 2, ra55. [DOI] [PMC free article] [PubMed] [Google Scholar]
- 5. Muramatsu T., Muramatsu H. (2008) Glycosaminoglycan-binding cytokines as tumor markers. Proteomics 8, 3350–3359 [DOI] [PubMed] [Google Scholar]
- 6. Knelson E. H., Nee J. C., Blobe G. C. (2014) Heparan sulfate signaling in cancer. Trends Biochem. Sci. 39, 277–288 [DOI] [PMC free article] [PubMed] [Google Scholar]
- 7. Iozzo R. V., San Antonio J. D. (2001) Heparan sulfate proteoglycans: heavy hitters in the angiogenesis arena. J. Clin. Invest. 108, 349–355 [DOI] [PMC free article] [PubMed] [Google Scholar]
- 8. Kresse H., Schonherr E. (2001) Proteoglycans of the extracellular matrix and growth control. J. Cell. Physiol. 189, 266–274 [DOI] [PubMed] [Google Scholar]
- 9. Lyon M., Gallagher J. T. (1998) Bio-specific sequences and domains in heparan sulphate and the regulation of cell growth and adhesion. Matrix Biol. 17, 485–493 [DOI] [PubMed] [Google Scholar]
- 10. Li J. P., Vlodavsky I. (2009) Heparin, heparan sulfate, and heparanase in inflammatory reactions. Thromb. Haemost. 102, 823–828 [DOI] [PubMed] [Google Scholar]
- 11. Holt C. E., Dickson B. J. (2005) Sugar codes for axons? Neuron 46, 169–172 [DOI] [PMC free article] [PubMed] [Google Scholar]
- 12. Dityatev A., Schachner M. (2003) Extracellular matrix molecules and synaptic plasticity. Nat. Rev. Neurosci. 4, 456–468 [DOI] [PubMed] [Google Scholar]
- 13. De Mattos D. A., Stelling M. P., Tovar A. M., Mourao P. A. (2008) Heparan sulfates from arteries and veins differ in their antithrombin-mediated anticoagulant activity. J. Thromb. Haemost. 6, 1987–1990 [DOI] [PubMed] [Google Scholar]
- 14. Jones C. J., Beni S., Limtiaco J. F., Langeslay D. J., Larive C. K. (2011) Heparin characterization: challenges and solutions. Annu. Rev. Anal. Chem. 4, 439–465 [DOI] [PubMed] [Google Scholar]
- 15. Esko J. D., Kimata K., Lindahl U. (2009) in Essentials of Glycobiology, eds Varki A, Cummings RD, Esko JD, Freeze HH, Stanley P, Bertozzi CR, Hart GW, Etzler ME. (Cold Spring Harbor (NY)). 2nd Ed. [PubMed] [Google Scholar]
- 16. Hirabayashi J., Hashidate T., Arata Y., Nishi N., Nakamura T., Hirashima M., Urashima T., Oka T., Futai M., Muller W. E., Yagi F., Kasai K. (2002) Oligosaccharide specificity of galectins: a search by frontal affinity chromatography. Biochim. Biophys. Acta 1572, 232–254 [DOI] [PubMed] [Google Scholar]
- 17. Wuhrer M., Deelder A. M., Hokke C. H. (2005) Protein glycosylation analysis by liquid chromatography-mass spectrometry. J. Chromatogr. B Analyt. Technol. Biomed. Life Sci. 825, 124–133 [DOI] [PubMed] [Google Scholar]
- 18. Zaia J., Costello C. E. (2003) Tandem mass spectrometry of sulfated heparin-like glycosaminoglycan oligosaccharides. Anal. Chem. 75, 2445–2455 [DOI] [PubMed] [Google Scholar]
- 19. Ly M., Leach F. E., 3rd, Laremore T. N., Toida T., Amster I. J., Linhardt R. J. (2011) The proteoglycan bikunin has a defined sequence. Nat. Chem. Biol. 7, 827–833 [DOI] [PMC free article] [PubMed] [Google Scholar]
- 20. Kailemia M. J., Li L., Ly M., Linhardt R. J., Amster I. J. (2012) Complete mass spectral characterization of a synthetic ultralow-molecular-weight heparin using collision-induced dissociation. Anal. Chem. 84, 5475–5478 [DOI] [PMC free article] [PubMed] [Google Scholar]
- 21. Ceroni A., Maass K., Geyer H., Geyer R., Dell A., Haslam S. M. (2008) GlycoWorkbench: a tool for the computer-assisted annotation of mass spectra of glycans. J. Proteome Res. 7, 1650–1659 [DOI] [PubMed] [Google Scholar]
- 22. Damerell D., Ceroni A., Maass K., Ranzinger R., Dell A., Haslam S. M. (2012) The GlycanBuilder and GlycoWorkbench glycoinformatics tools: updates and new developments. Biol. Chem. 393, 1357–1362 [DOI] [PubMed] [Google Scholar]
- 23. Tissot B., Ceroni A., Powell A. K., Morris H. R., Yates E. A., Turnbull J. E., Gallagher J. T., Dell A., Haslam S. M. (2008) Software tool for the structural determination of glycosaminoglycans by mass spectrometry. Anal. Chem. 80, 9204–9212 [DOI] [PubMed] [Google Scholar]
- 24. Eng J. K., McCormack A. L., Yates J. R. (1994) An approach to correlate tandem mass spectral data of peptides with amino acid sequences in a protein database. J. Am. Soc. Mass. Spectrom. 5, 976–989 [DOI] [PubMed] [Google Scholar]
- 25. Fridman T., Razumovskaya J., Verberkmoes N., Hurst G., Protopopescu V., Xu Y. (2005) The probability distribution for a random match between an experimental-theoretical spectral pair in tandem mass spectrometry. J. Bioinform. Comput. Biol. 3, 455–476 [DOI] [PubMed] [Google Scholar]
- 26. Sadygov R. G., Liu H., Yates J. R. (2004) Statistical models for protein validation using tandem mass spectral data and protein amino acid sequence databases. Anal. Chem. 76, 1664–1671 [DOI] [PubMed] [Google Scholar]
- 27. Geer L. Y., Markey S. P., Kowalak J. A., Wagner L., Xu M., Maynard D. M., Yang X., Shi W., Bryant S. H. (2004) Open mass spectrometry search algorithm. J. Proteome Res. 3, 958–964 [DOI] [PubMed] [Google Scholar]
- 28. Perkins D. N., Pappin D. J., Creasy D. M., Cottrell J. S. (1999) Probability-based protein identification by searching sequence databases using mass spectrometry data. Electrophoresis 20, 3551–3567 [DOI] [PubMed] [Google Scholar]
- 29. Zhang N., Aebersold R., Schwikowski B. (2002) ProbID: a probabilistic algorithm to identify peptides through sequence database searching using tandem mass spectral data. Proteomics 2, 1406–1412 [DOI] [PubMed] [Google Scholar]
- 30. Craig R., Beavis R. C. (2004) TANDEM: matching proteins with tandem mass spectra. Bioinformatics 20, 1466–1467 [DOI] [PubMed] [Google Scholar]
- 31. Tabb D. L., Fernando C. G., Chambers M. C. (2007) MyriMatch: highly accurate tandem mass spectral peptide identification by multivariate hypergeometric analysis. J. Proteome Res. 6, 654–661 [DOI] [PMC free article] [PubMed] [Google Scholar]
- 32. Kailemia M. J., Ruhaak L. R., Lebrilla C. B., Amster I. J. (2014) Oligosaccharide analysis by mass spectrometry: a review of recent developments. Anal. Chem. 86, 196–212 [DOI] [PMC free article] [PubMed] [Google Scholar]
- 33. Venkataraman G., Shriver Z., Raman R., Sasisekharan R. (1999) Sequencing complex polysaccharides. Science 286, 537–542 [DOI] [PubMed] [Google Scholar]
- 34. Saad O. M., Leary J. A. (2005) Heparin sequencing using enzymatic digestion and ESI-MSn with HOST: a heparin/HS oligosaccharide sequencing tool. Anal. Chem. 77, 5902–5911 [DOI] [PubMed] [Google Scholar]
- 35. Maxwell E., Tan Y., Tan Y., Hu H., Benson G., Aizikov K., Conley S., Staples G. O., Slysz G. W., Smith R. D., Zaia J. (2012) GlycReSoft: a software package for automated recognition of glycans from LC/MS data. PLoS One 7, e45474. [DOI] [PMC free article] [PubMed] [Google Scholar]
- 36. Hu H., Huang Y., Mao Y., Yu X., Xu Y., Liu J., Zong C., Boons G. J., Lin C., Xia Y., Zaia J. (2014) A Computational framework for heparan sulfate sequencing using high-resolution tandem mass spectra. Mol. Cell. Proteomics 13, 2490–2502 [DOI] [PMC free article] [PubMed] [Google Scholar]
- 37. Arungundram S., Al-Mafraji K., Asong J., Leach F. E., 3rd, Amster I. J., Venot A., Turnbull J. E., Boons G. J. (2009) Modular synthesis of heparan sulfate oligosaccharides for structure-activity relationship studies. J. Am. Chem. Soc. 131, 17394–17405 [DOI] [PMC free article] [PubMed] [Google Scholar]
- 38. Huang R., Liu J., Sharp J. S. (2013) An approach for separation and complete structural sequencing of heparin/heparan sulfate-like oligosaccharides. Anal. Chem. 85, 5787–5795 [DOI] [PMC free article] [PubMed] [Google Scholar]
- 39. Domon B., Costello C. E. (1988) A systematic nomenclature for carbohydrate fragmentations in FAB-MS/MS spectra of glycoconjugates. Glycoconj. J. 5, 397–409 [Google Scholar]
- 40. Kessner D., Chambers M., Burke R., Agus D., Mallick P. (2008) ProteoWizard: open source software for rapid proteomics tools development. Bioinformatics 24, 2534–2536 [DOI] [PMC free article] [PubMed] [Google Scholar]
- 41. Nesvizhskii A. I., Aebersold R. (2004) Analysis, statistical validation, and dissemination of large-scale proteomics datasets generated by tandem MS. Drug Discov. Today 9, 173–181 [DOI] [PubMed] [Google Scholar]
- 42. Nesvizhskii A. I., Keller A., Kolker E., Aebersold R. (2003) A statistical model for identifying proteins by tandem mass spectrometry. Anal. Chem. 75, 4646–4658 [DOI] [PubMed] [Google Scholar]
- 43. Keller A., Nesvizhskii A. I., Kolker E., Aebersold R. (2002) Empirical statistical model to estimate the accuracy of peptide identifications made by MS/MS and database search. Anal. Chem. 74, 5383–5392 [DOI] [PubMed] [Google Scholar]
Associated Data
This section collects any data citations, data availability statements, or supplementary materials included in this article.


