Abstract
Resistant malaria parasites are frequently found in mixed infections with drug-sensitive parasites. Particularly early in the evolutionary process, the frequency of these resistant mutants can be extremely low and below the level of molecular detection. We tested whether the rarity of resistance in infections impacted the health outcomes of treatment failure and the potential for onward transmission of resistance. Mixed infections of different ratios of resistant and susceptible Plasmodium chabaudi parasites were inoculated in laboratory mice and dynamics tracked during the course of infection using highly sensitive genotype-specific quantitative polymerase chain reaction (qPCR). Frequencies of resistant parasites ranged from 10% to 0.003% at the onset of treatment. We found that the rarer the resistant parasites were, the lower the likelihood of their onward transmission, but the worse the treatment failure was in terms of parasite numbers and disease severity. Strikingly, drug resistant parasites had the biggest impact on health outcomes when they were too rare to be detected by any molecular methods currently available for field samples. Indeed, in the field, these treatment failures would not even have been attributed to resistance.
Introduction
Drug-resistant malaria parasites are a major threat to public health.1–3 Detecting resistant parasites is important for monitoring and surveillance and to determine the health burden of resistance.1 Resistant parasites frequently occur in infections with sensitive parasites,4–6 a discovery first made with isozymes and then early polymerase chain reaction (PCR) methods.7 In recent years, more sensitive molecular marker detection assays have been developed such as ligase detection reaction fluorescent microspheres,5,8 high-resolution melting assays,6,9 and ultra-deep sequencing.10 These newer methods have reduced genotype detection thresholds from the frequencies of 10% to 20% achievable with traditional restriction fragment length polymorphism (RFLP) assays11,12 down to 1%. Ultra-deep sequencing has the theoretical potential to go to even lower, though so far as we are aware, this has yet to be achieved with field samples.
What role might resistant parasites play in determining health outcomes and the onward transmission of resistance if they are at frequencies of much less than 1%? Studying the importance of undetectable parasites is clearly a challenge. Here we investigate experimentally the impact of very rare resistant parasites on treatment failure, disease severity, and transmission using the rodent malaria model Plasmodium chabaudi. In an experimental setting, frequencies as low as 0.0001% can be measured because the genotypes of all parasites in an infection are known and so specific primers can be designed to follow each of them by quantitative PCR (qPCR). We asked whether the frequency of resistant parasites at the time of treatment affected 1) posttreatment parasite dynamics, 2) disease severity caused by treatment failure, and 3) onward transmission of resistance. We were also able to study treatment failure that current technologies would not attribute to resistance.
Material and Methods
Parasites and hosts.
Two genetically distinct clones were used: drug sensitive clone AJ5p (hereafter referred to as clone S) and drug resistant clone AS6p(pyr-1A) (hereafter referred to as clone R). Both clones were isolated from thicket rats, and subsequently cloned.13 Clone R was made resistant by a single high-dose exposure to pyrimethamine.14 Hosts were 8- to 15-week-old female C57Bl/6 laboratory mice (Charles River Laboratories, Wilmington, MA). To test for background variation in mouse health, a group of 10 sham-infected mice was monitored contemporaneously. All mice were kept on a 12:12 light:dark cycle, fed Laboratory Rodent Diet 5001 (LabDiet, PMI Nutrition International, Brentwood, MO) and received 0.05% para-aminobenzoic acid (PABA)–supplemented drinking water to enhance parasite growth.15
Experimental design, infections, and drug treatment.
The experiment consisted of mixed infections of clones R and S (Table 1). The inoculum of clone R consisted of 106, 105, 103, or 101 parasites and the inoculum of clone S was kept constant at 106 parasites per mouse. Control mice were sham injected with uninfected blood. Each treatment group consisted of five mice, except for the group with an inoculum of 101 resistant parasites, which consisted of 10 mice to allow for the possibility that some mice failed to become infected because of stochastic loss due to the low inoculum size, which in the end did not occur. Drug treatment started on day 6 postinfection (PI), which is when pronounced anemia and weight loss begin to show,16,17 and consisted of 8 mg/kg pyrimethamine dissolved in dimethyl sulfoxide (DMSO), administrated by intraperitoneal (i.p.) injection of 50 μL on 4 successive days. In previous studies, clone R has been completely resistant to this regimen, meaning that the drug did not affect parasitemia.4
Table 1.
Experimental setup
| Resistant | Susceptible | n | |
|---|---|---|---|
| Very abundant | 106 | 106 | 5 (5) |
| Abundant | 105 | 106 | 5 (4) |
| Rare | 103 | 106 | 5 (3) |
| Very rare | 101 | 106 | 10 (10) |
| Sham-injected control | − | − | 5 (5) |
Mice were simultaneously inoculated with given densities of resistant and susceptible parasites. Control mice were sham injected with uninfected red blood cells. Drug treatment was given on days 6–9 postinfection. The treatment group with very rare resistant parasites consisted of 10 mice at the start of the experiment; all other treatment groups consisted of five mice. Three mice had to be excluded from the analysis (see Methods); the number of mice included in the analysis is given between brackets.
Monitoring of infections.
Weight and red blood cell (RBC) density of the mice, together with asexual parasite density and gametocyte density of both clones, were measured daily (day 3–21 PI) and three times a week thereafter (day 23–49 PI). For each mouse (including uninfected control mice), 2 μL blood was taken by tail snip at each sampling time for RBC density measurements using flow cytometry (Beckman Coulter, High Wycombe, UK). A further 5 μL blood was taken for DNA extraction, which was carried out on the ABI Prism® 6100 Nucleic Acid PrepStation (Applied Biosystems, Foster City, CA) according to manufacturer's instructions. A further 10 μL blood was taken and lysed immediately for RNA extraction, using the “RNA Blood-DNA” method on the ABI Prism 6100 Nucleic Acid PrepStation. Afterward, RNA was conversed to single-stranded complementary DNA (cDNA) using the High-Capacity cDNA Archive Kit (Applied Biosystems).18 Both DNA and cDNA were stored at −80°C until quantification. In addition, a thin blood smear was made of each mouse on each sampling day.
To measure total parasite density (asexual parasites plus gametocytes), qPCR was performed on DNA using clone-specific assays.19 To measure gametocyte density, qPCR was performed on cDNA, using the same clone-specific assays.19,20 Asexual parasite density was estimated by subtracting the gametocyte density from the total parasite density.20 The PCR reaction volume of 25 μL for all assays consisted of 7 μL DNA or cDNA, 900 nM forward and reverse clone-specific primers, 250 nM TaqMan® MGB probe (Applied Biosystems) and 1x PerfeCTa™ qPCR FastMix™ (Quanta Biosciences, Gaithersburg, MD). All reactions were run on the ABI Prism 7500 Fast System (Applied Biosystems), using the assay: 95°C for 2 minutes, followed by 40 cycles of 95°C for 3 seconds and 60°C for 30 seconds. Quantification was based on serial dilutions of DNA and cDNA standards of known total parasite and gametocyte density, determined beforehand by careful microscopy.21
The study was carried out in strict accordance with the recommendations in the guide for the Care and Use of Laboratory Animals of the National Institutes of Health. The protocol was approved by the Animal Care and Use Committee of the Pennsylvania State University (permit number: 35790).
Statistical analysis.
Resistant asexual parasite densities and gametocyte densities posttreatment (day 10–49 PI) were summed to give an estimate of the total number of parasites present after treatment. In addition, as a measure of disease severity, maximum RBC loss and weight loss during relapse were calculated as the difference between the baseline value taken on the day before infection and the minimum reached following regression after day 12 PI. Time to slide positivity was estimated as an approximation of earliest relapse detection by thick smear microscopy under field circumstances. For this, we used a cutoff value of 50 parasites/μL blood.22 Finally, as a measure of transmission potential, the mean predicted infectiousness was calculated for both genotypes from the end of drug treatment (day 10 PI) onward using gametocyte densities in the density–infectivity function for clone R as derived from previous infection experiments.23 General linear models were used throughout. Relapse size and relative abundance at time of treatment were log transformed to meet normality assumptions. All statistical analyses were performed in R 3.0.0.24
Three mice had to be excluded from the analysis. One mouse died (103 R-inoculum), one failed for unknown reasons to respond to drug pressure (103 R-inoculum), and one mouse received an inoculum of several orders of magnitude lower than intended, as judged by the pretreatment infection kinetics (105 R-inoculum) (Table 1).
Results
After inoculation, resistant parasites grew less rapidly than susceptible parasites, which resulted in a reduction of relative abundance from 50% resistant parasites in the highest abundance group at time of inoculation to a mean of 9.7% resistant parasites at time of treatment (day 6 PI). In the other groups, frequencies of 9.1%, 0.1%, and 0.001% at inoculum became averages of 1.2%, 0.01%, and 0.0003%, respectively, by the time treatment was initiated (Figure 1).
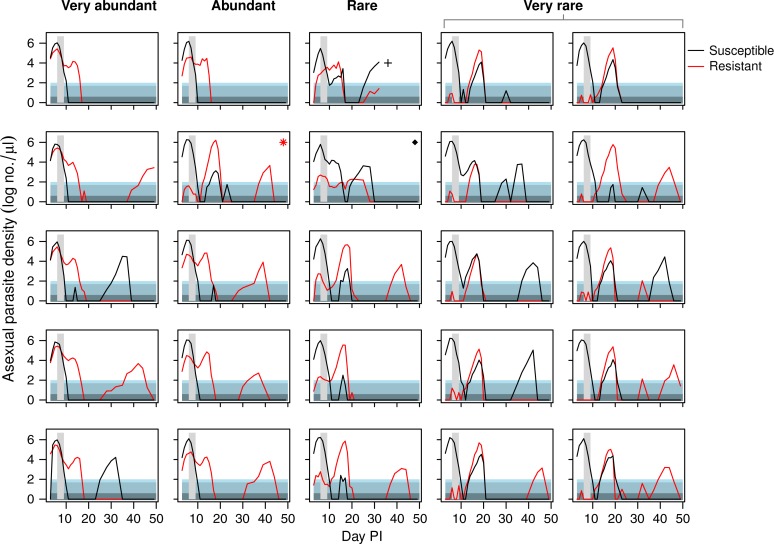
Figure 1.
Asexual parasite dynamics of resistant and susceptible parasites depicted separately for each individual mouse that received an inoculum with very abundant, abundant, rare, or very rare resistant parasites (see column headings). Vertical grey area shows timing and duration of treatment. Asterisk indicates a mouse that received a lower dose of resistant parasites than intended, the cross indicates a mouse that died during the infection, and the diamond indicates a mouse that did not respond to treatment because of unknown reasons. These three mice were excluded from the analysis (see Methods and Table 1). Horizontally shaded areas represent different levels of thick-smear microscopy detection ability. In lightest shade is the generally assumed detection threshold under field circumstances (50–100 parasites/μL, this could be even higher). Below that is the detection threshold under ideal laboratory circumstances (4–50 parasites/μL). At the bottom is the density that is considered to be below microscopy detection level.22
Kinetics of treatment failure.
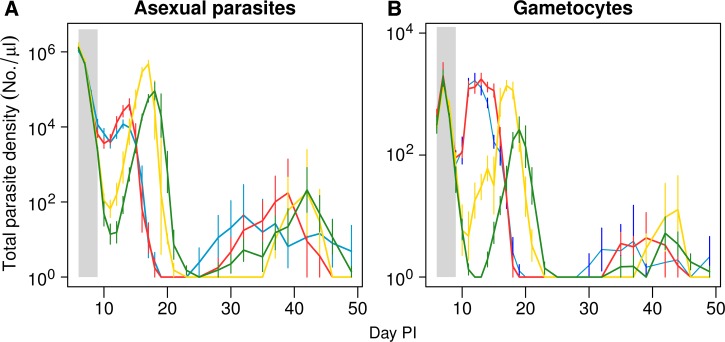
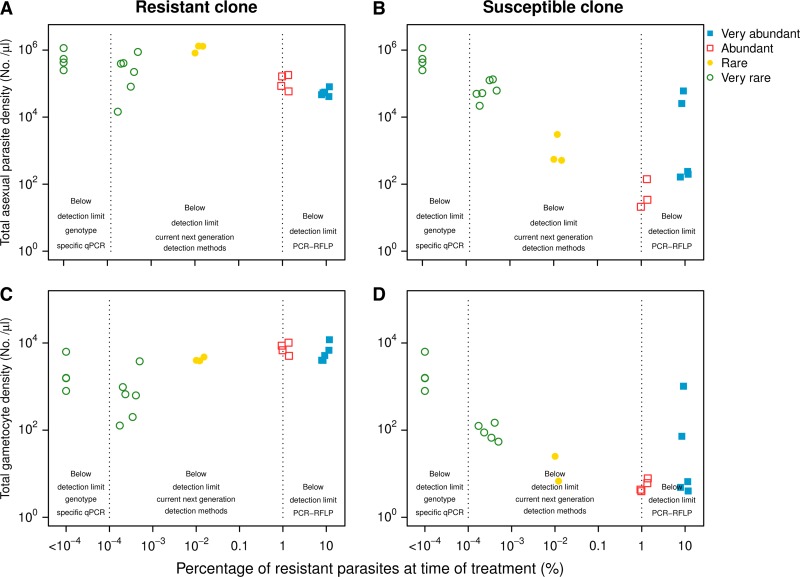
As found previously,4,17,19 drug treatment rapidly reduced the susceptible parasite population, allowing the expansion of the resistant parasite population, even of the rare resistant parasites (Figure 1). This relapse of resistant parasites was considerable in all treatment groups, but counterintuitively, the lower the relative abundance of resistance at time of treatment, the greater the posttreatment relapse (F1,20 = 9.5, P = 0.006) (Figure 2A , 3A ). The time to peak relapse was longer when resistant parasites were rare at time of treatment (mean of day 13.4, 14.0, 17.0, and 18.0 PI for infections in the very abundant, abundant, rare, and very rare experimental groups, respectively) (Figure 2A).
Figure 2.
Mean total asexual parasite dynamics (A) and gametocyte dynamics (B) following initiation of treatment. Infections were initiated with either very abundant (106, blue lines); abundant (105, red lines); rare (103, yellow lines); and very rare (101, green lines) inoculations of resistant parasites, contemporaneously with 106 susceptible parasites. Drug treatment was given on days 6–9 postinfection. Data are means (± standard error) of the total density of up to 10 mice.
Figure 3.
Total posttreatment recrudescence density (days 10–49 postinfection) of resistant (left panels) and susceptible (right panels) asexual parasites (top row) and gametocytes (bottom row) by percentage of resistant asexual parasites at start of treatment. Infections were initiated with very abundant (filled squares), abundant (open squares), rare (filled circles), and very rare (open circles) resistant parasites. Dotted vertical line indicates the detection limits of various molecular detection techniques (see introduction).
Unexpectedly, the drug treatment dose was insufficient to fully clear the susceptible parasite population. This led to a substantial relapse of susceptible parasites in the groups that started with rare or very rare resistant parasites. These relapses occurred only when the density of the resistant parasites was around 100 parasites/μL or lower at the end of treatment. The lower the density of resistant parasites (very rare group), the higher the relapse observed of the susceptible parasites (Figures 1 and 3).
All mice, regardless of starting density of resistant mutants, experienced treatment failure as defined by the World Health Organization25 (parasites present at the end of treatment or recrudescence). In 13 of the 22 infections, parasites were still detectable by thick-smear microscopy the day after the end of treatment. These 13 infections consisted of all nine infections in the very abundant and abundant groups as well as two infections in the rare treatment group and two in the very rare group. The remaining nine infections manifested as recrudescence: drug treatment reduced parasite densities below microscopy detection the day after treatment ended, but parasites later recovered to densities above thick-smear detectability. These nine relapsing infections all became slide positive again 6–8 days after initiation of drug treatment, with a mean of 7.3 days (Figure 1).
Host health.
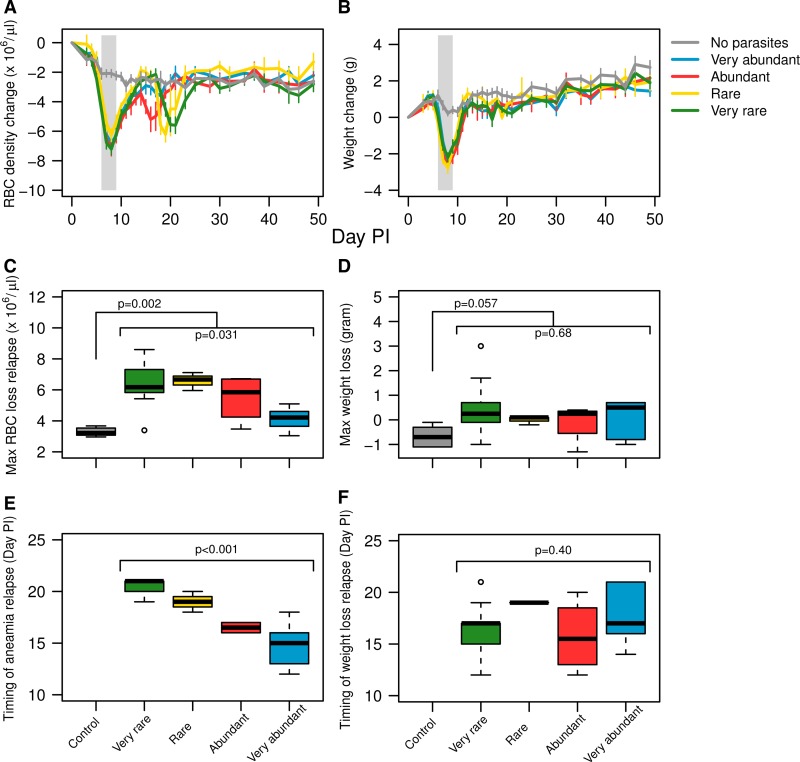
Uninfected control mice endured minor anemia and weight loss, attributed to handling and sampling stress, as well as drug and adjuvant side effects (Figure 4A and B). Following treatment, mouse weight did not show any significant deviations from steady growth and no differences were seen between treatment groups (Figure 4B and D). In contrast, mice in all groups had a bout of anemia after treatment as a consequence of parasite relapse, with the exception of mice that started with a very high abundance of resistant parasites (Figure 4A and C). These bouts of posttreatment anemia were the greatest in the groups where resistant parasites were rare or very rare (F3,18 = 3.7, P = 0.031). Because the relapse parasite peak occurred later in these groups, anemia peaks were also later (F3,18 = 25, P < 0.001) (Figure 4E). Thus, treatment failure had the biggest impact on host health when resistant parasites frequencies were < 0.01% at the time of treatment.
Figure 4.
Top row: mean change in red blood cell (RBC) density (A) and body weight (B) through time relative to day before infection of mice with infections initiated with very abundant susceptible parasites mixed with very abundant (blue line), abundant (red line), rare (yellow line), and very rare (green line) resistant parasites and control mice that were sham injected with uninfected blood (grey line). Middle row: maximum RBC loss (C) and weight loss (D) during relapse. Bottom row: time (day postinfection) until maximum RBC loss (E) and maximum weight loss (F) during the relapse phase.
Transmission stages.
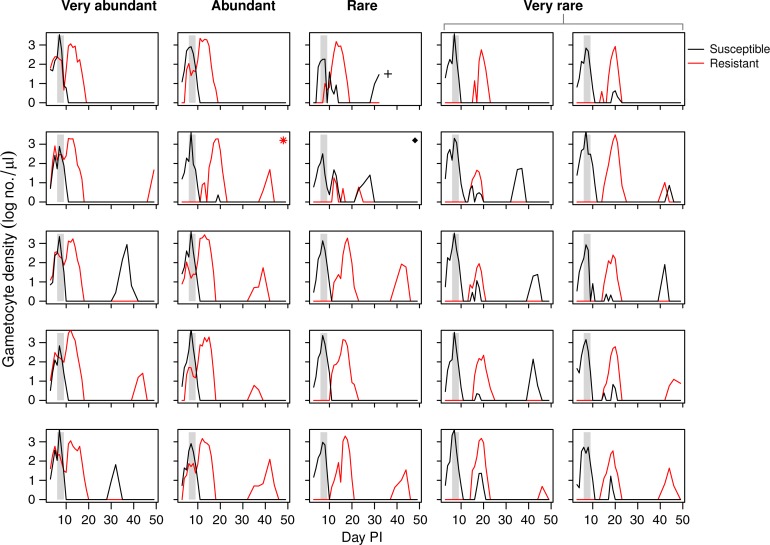
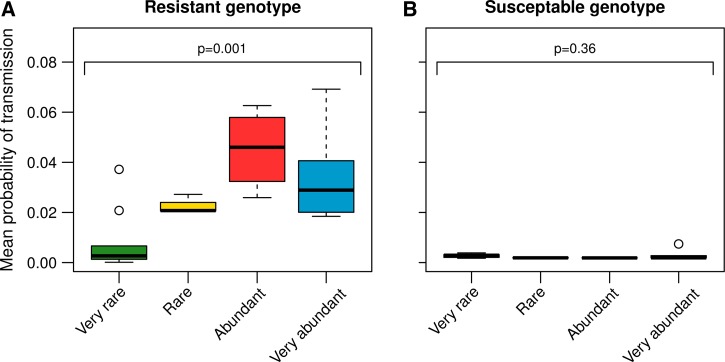
The dynamics of the transmission stages of the relapsing parasites followed the dynamics of the asexual parasites (Figures 2B and 5 ). Yet, in contrast to asexual parasite densities, the more common resistant parasites were on the first day of treatment, the more resistant gametocytes were detected in the period after treatment (F1,20 = 4.5, P = 0.038) (Figure 3C). To estimate the transmission potential of the relapses, we used an empirically derived gametocyte density-infectivity function.23 Resistant parasites had the highest potential to transmit when they started the infection at a higher density (F3,18 = 7.9, P = 0.001) (Figure 6A ). The transmission potential of the susceptible parasites during relapse was negligible (Figure 6B).
Figure 5.
Gametocyte dynamics of resistant and susceptible parasites depicted separately for each individual mouse that received an inoculum with very abundant, abundant, rare, or very rare resistant parasites (see column headings). Vertical grey areas show timing and duration of treatment. Asterisk indicates a mouse that received a lower dose of resistant parasites than intended, the cross indicates a mouse that died during the infection, and the diamond indicates a mouse that did not respond to treatment because of unknown reasons. These three mice were excluded from the analysis (see Methods and Table 1).
Figure 6.
Posttreatment (day 10–49 postinfection) probability of infecting mosquitoes with resistant (A) and susceptible (B) genotypes, estimated from an empirically derived gametocyte density—infectivity relationship (see Materials and Methods). Box plots show median, first, and third quartile of estimations and the whiskers indicate maximum and minimum estimations or 1.5 × interquartile range out of which case outliers are plotted. Sample sizes are as in Table 1.
Discussion
Malaria treatment failure due to drug resistance is a significant medical and public health challenge. Using a rodent model, we created infections in which resistant parasites would cause treatment failure, but by varying the density of resistant parasites used to seed an infection, we were able to explore the impact of the frequency of resistant parasites at the onset of treatment on the kinetics of treatment failure, disease severity, transmission potential, and the detection of resistance-induced treatment failure. We found that the rarer the resistant parasites when treatment began, the larger their posttreatment parasite relapse (Figures 1–3), likely because rarity means reduced priming of an acquired strain-specific immune response. Consequently, these infections with rare resistant parasites had greater anemia caused by treatment failure (Figure 4). The potential for onward transmission of resistance was least when resistant parasites were initially rare (Figure 5).
When treatment fails and relapses occur in an endemic setting, it can be a major challenge to determine whether the relapse is caused by true treatment failure or by a new infection acquired shortly after treatment. It has become a standard practice to use molecular genotyping to distinguish reinfection (where there will be genetically different parasites in pre- and posttreatment samples) from recrudescence (where pre- and posttreatment samples contain genetically identical parasites). The use of this so-called PCR correction is limited by the ability to detect parasite genotypes in the pretreatment sample. The standard RFLP-based assay1,7,11,12,26 can detect parasites clones at frequencies down to around 10%. There are several more sensitive assays, including capillary electrophoresis,27 heteroduplex tracking assays,28–30 molecular barcoding using high resolution melting assays,6,9 and ultra-deep sequencing,10,31 but for none of these methods have frequencies lower than 1% reported.
Using any of those technologies, the PCR correction approach would have incorrectly classified as reinfections the treatment failures in our rare or very rare treatment groups. This was because in those groups the resistant parasites were well below 1% at the start of treatment. In those infections, chemotherapy cleared parasites below microscopy (and in some cases even below qPCR) detection levels (Figure 1), but the resistant parasites nonetheless caused significant clinical signs 7–10 days after the cessation of treatment (Figure 4E). The concern that PCR correction will underestimate the impact of drug resistance has been raised before.11,32 More sensitive detection methods improve the classification of relapses,12 but our data suggest that even with the most advanced of the current technologies, clinically relevant treatment failure due to resistance may not be identified in many cases. Resistant parasites went undetected even by our highly sensitive genotype-specific qPCR in several pretreatment samples (Figure 3). Despite being undetectable, those resistant parasites relapsed to high densities and caused marked anemia.
Indeed, our results suggest the possibility that undetectably rare resistant parasites might be the most harmful to patient health. At least in our experiments, the most severe anemia following treatment occurred when resistant parasites were at frequencies of 0.01% or lower when treatment began (Figure 4). Of course P. falciparum in people and P. chabaudi in laboratory mice are not the same,16,33 not least because the mice in these experiments were naïve to malaria infections, perhaps giving the relapsing resistant clone an advantage it would not have in a semi-immune host. Nevertheless, it is intriguing that the relapses we saw occurred 7–10 days posttreatment, which, scaling the 24-hour life cycle of P. chabaudi to the 48-hour life cycle of P. falciparum, is suggestively similar to the 14–42 days seen in relapsing P. falciparum infections.25 The precise timings will of course depend on, among other things, the intrinsic replication rate of the parasite, host immunity, and the number of parasites surviving treatment. It might be possible to determine whether resistance is more clinically important in human malaria when it is rare by looking for a correlation between time to relapse and disease severity since, all else equal, low frequency resistance will take longer to relapse, as it did in our experiments (Figure 4E). Yet, in high endemic settings, the issue of distinguishing between recrudescence and reinfection remains.
Larger posttreatment populations of resistant parasites did not result in more gametocytes (Figures 3, 5, and 6A). This was partly because many gametocytes appeared soon after treatment, so that more were produced in total when resistant parasites were at high densities during that period (i.e., in the very abundant and abundant experimental groups). However, there also seem to be fewer gametocytes produced per asexual later in the infections (Figure 3, and compare Figures 1 and 5). This could be because of reductions in transmission stage production by rapidly replicating parasites34 or more effective anti-gametocyte immunity later in infections. Whatever, the net result was that there was less potential to transmit resistance when resistant parasites were rare at the time of treatment than when they were more abundant.
Unexpectedly, drug treatment was insufficient to fully clear the susceptible parasites, particularly in the rare and very rare groups (Figure 1). This relapse of the drug-sensitive clone could be because of de novo resistance mutations, or that the duration of treatment was not quite sufficient to eliminate all sensitive parasites. In previous experiments, the treatment regimen we used here was effective in clearing single-clone susceptible infections.16 It is therefore possible that relapse of susceptible parasites is facilitated by the presence of resistant parasites through some unknown mechanism (e.g., drug detoxification). This concurrent relapse of susceptible parasites undoubtedly affected the parasite kinetics in the rare and very rare groups and could have partly contributed to the observed increased anemia in these groups. Whatever the explanation, the reemergence of sensitive parasites was less likely when resistant parasites were at high densities after treatment (Figure 1). We assume this is because numerically dominant resistant parasites competitively suppress the replication of the susceptible parasites, just as susceptible parasites suppressed resistant parasites in the rare and very rare experimental groups before treatment. In contrast, when both genotypes are at similar densities, they are both able to recrudesce (rare and very rare groups and the excluded mouse that received less resistant parasites than intended in the abundant group; Figures 1 and 3).
More generally, our data suggest a note of caution for recent enthusiasms that pharmacogenetics can improve treatment outcomes. When economically feasible, resistance markers can be used to identify resistance before treatment and drugs chosen accordingly (personalized medicine). This is already the standard practice in the treatment of various bacterial35,36 and HIV infections37,38 in many countries, and could conceivably become so in malaria, at least in rich country or military settings. We contend that a fundamental challenge for this sort of personalized medicine will ultimately prove to be the amount of pathogen biomass that can be sampled and the ability of the molecular assay to detect very rare genotypes in that sample. The problem of detecting very rare resistance is the primary reason why the promise of personalized medicine for cancer treatment39,40 is falling short of its expectations.41 Malaria infections, being blood borne, are more mixed and likely less heterogeneous than cancer tumors, but nonetheless, the major and perhaps insurmountable challenge will be the detection of resistance when it is extremely rare. In our experiment, the most clinical harm was caused by parasites that were too rare to be detected in field samples with current technologies.
ACKNOWLEDGMENTS
We thank members of the RAPIDD program of the Science and Technology Directorate, Department of Homeland Security and the Fogarty International Center, National Institutes of Health, for discussion.
Disclaimer: The funders had no role in study design, data collection and analysis, decision to publish, or the preparation of the manuscript.
Footnotes
Financial support: This work was funded by the Institute of General Medical Science (R01 GM089932). Silvie Huijben was supported by a Branco Weiss Fellowship and Marie Curie Actions IIF Project 623703.
Authors' addresses: Silvie Huijben, ISglobal, Barcelona Centre for International Health Research (CRESIB), Hospital Clínic, Universitat de Barcelona, Barcelona, Spain, E-mail: silviehuijben@gmail.com. Brian H. K. Chan, Institute of Integrative Biology, University of Liverpool, Liverpool, United Kingdom, E-mail: brian.chan@liverpool.ac.uk. Andrew F. Read, Center for Disease Dynamics, The Pennsylvania State University, University Park, PA, E-mail: a.read@psu.edu.
References
- 1.World Health Organization . World Malaria Report 2013. Geneva, Switzerland: World Health Organization; 2013. [Google Scholar]
- 2.The malERA Consultative Group on Drugs A research agenda for malaria eradication: drugs. PLoS Med. 2011;8:e1000402. doi: 10.1371/journal.pmed.1000402. [DOI] [PMC free article] [PubMed] [Google Scholar]
- 3.Wells TNC, Alonso PL, Gutteridge WE. New medicines to improve control and contribute to the eradication of malaria. Nat Rev Drug Discov. 2009;8:879–891. doi: 10.1038/nrd2972. [DOI] [PubMed] [Google Scholar]
- 4.Huijben S, Sim DG, Nelson WA, Read AF. The fitness of drug-resistant malaria parasites in a rodent model: multiplicity of infection. J Evol Biol. 2011;24:2410–2422. doi: 10.1111/j.1420-9101.2011.02369.x. [DOI] [PMC free article] [PubMed] [Google Scholar]
- 5.Nankoberanyi S, Mbogo GW, LeClair NP, Conrad MD, Tumwebaze P, Tukwasibwe S, Kamya MR, Tappero J, Nsobya SL, Rosenthal PJ. Validation of the ligase detection reaction fluorescent microsphere assay for the detection of Plasmodium falciparum resistance mediating polymorphisms in Uganda. Malar J. 2014;13:95. doi: 10.1186/1475-2875-13-95. [DOI] [PMC free article] [PubMed] [Google Scholar]
- 6.Daniels R, Ndiaye D, Wall M, McKinney J, Sene PD, Sabeti PC, Volkman SK, Mboup S, Wirth DF. Rapid, field-deployable method for genotyping and discovery of single-nucleotide polymorphisms associated with drug resistance in Plasmodium falciparum. Antimicrob Agents Chemother. 2012;56:2976–2986. doi: 10.1128/AAC.05737-11. [DOI] [PMC free article] [PubMed] [Google Scholar]
- 7.Snounou G, Beck HP. The use of PCR genotyping in the assessment of recrudescence or reinfection after antimalarial drug treatment. Parasitol Today. 1998;14:462–467. doi: 10.1016/s0169-4758(98)01340-4. [DOI] [PubMed] [Google Scholar]
- 8.LeClair NP, Conrad MD, Baliraine FN, Nsanzabana C, Nsobya SL, Rosenthal PJ. Optimization of a ligase detection reaction-fluorescent microsphere assay for characterization of resistance-mediating polymorphisms in African samples of Plasmodium falciparum. J Clin Microbiol. 2013;51:2564–2570. doi: 10.1128/JCM.00904-13. [DOI] [PMC free article] [PubMed] [Google Scholar]
- 9.Daniels R, Volkman SK, Milner DA, Mahesh N, Neafsey DE, Park DJ, Rosen D, Angelino E, Sabeti PC, Wirth DF, Wiegand RC. A general SNP-based molecular barcode for Plasmodium falciparum identification and tracking. Malar J. 2008;7:223. doi: 10.1186/1475-2875-7-223. [DOI] [PMC free article] [PubMed] [Google Scholar]
- 10.Juliano JJ, Porter K, Mwapasa V, Sem R, Rogers WO, Ariey F, Wongsrichanalai C, Read A, Meshnick SR. Exposing malaria in-host diversity and estimating population diversity by capture-recapture using massively parallel pyrosequencing. Proc Natl Acad Sci USA. 2010;107:20138–20143. doi: 10.1073/pnas.1007068107. [DOI] [PMC free article] [PubMed] [Google Scholar]
- 11.Juliano JJ, Gadalla N, Sutherland CJ, Meshnick SR. The perils of PCR: can we accurately “correct” antimalarial trials? Trends Parasitol. 2010;26:119–124. doi: 10.1016/j.pt.2009.12.007. [DOI] [PMC free article] [PubMed] [Google Scholar]
- 12.Juliano JJ, Ariey F, Sem R, Tangpukdee N, Krudsood S, Olson C, Looareesuwan S, Rogers WO, Wongsrichanalai C, Meshnick SR. Misclassification of drug failures in Plasmodium falciparum clinical trials in southeast Asia. J Infect Dis. 2009;200:624–628. doi: 10.1086/600892. [DOI] [PMC free article] [PubMed] [Google Scholar]
- 13.Beale GJ, Carter R, Walliker D. Genetics. In: Killick-Kendrick R, Peters W, editors. Rodent Malaria. London, United Kingdom: Academic Press; 1978. 213–245. [Google Scholar]
- 14.Walliker D, Carter R, Sanderson A. Genetic studies on Plasmodium chabaudi: recombination between enzyme markers. Parasitology. 1975;70:19–24. doi: 10.1017/s0031182000048824. [DOI] [PubMed] [Google Scholar]
- 15.Jacobs RL. Role of p-aminobenzoic acid in Plasmodium berghei infection in the mouse. Exp Parasitol. 1964;15:213. doi: 10.1016/0014-4894(64)90017-7. [DOI] [PubMed] [Google Scholar]
- 16.Wargo AR, Huijben S, de Roode JC, Shepherd J, Read AF. Competitive release and facilitation of drug-resistant parasites after therapeutic chemotherapy in a rodent malaria model. Proc Natl Acad Sci USA. 2007;104:19914–19919. doi: 10.1073/pnas.0707766104. [DOI] [PMC free article] [PubMed] [Google Scholar]
- 17.Huijben S, Nelson WA, Wargo AR, Sim DG, Drew DR, Read AF. Chemotherapy, within-host ecology and the fitness of drug-resistant malaria parasites. Evolution. 2010;64:2952–2968. doi: 10.1111/j.1558-5646.2010.01068.x. [DOI] [PMC free article] [PubMed] [Google Scholar]
- 18.Wargo AR, Randle N, Chan BHK, Thompson J, Read AF, Babiker HA. Plasmodium chabaudi: reverse transcription PCR for the detection and quantification of transmission stage malaria parasites. Exp Parasitol. 2006;112:13–20. doi: 10.1016/j.exppara.2005.08.013. [DOI] [PubMed] [Google Scholar]
- 19.Huijben S, Bell AS, Sim DG, Tomasello D, Mideo N, Day T, Read AF. Aggressive chemotherapy and the selection of drug resistant pathogens. PLoS Pathog. 2013;9:e1003578. doi: 10.1371/journal.ppat.1003578. [DOI] [PMC free article] [PubMed] [Google Scholar]
- 20.Drew DR, Reece SE. Development of reverse-transcription PCR techniques to analyse the density and sex ratio of gametocytes in genetically diverse Plasmodium chabaudi infections. Mol Biochem Parasitol. 2007;156:199–209. doi: 10.1016/j.molbiopara.2007.08.004. [DOI] [PMC free article] [PubMed] [Google Scholar]
- 21.Cheesman SJ, de Roode JC, Read AF, Carter R. Real-time quantitative PCR for analysis of genetically mixed infections of malaria parasites: technique validation and applications. Mol Biochem Parasitol. 2003;131:83–91. doi: 10.1016/s0166-6851(03)00195-6. [DOI] [PubMed] [Google Scholar]
- 22.Wongsrichanalai C, Barcus MJ, Muth S, Sutamihardja A, Wernsdorfer WH. A review of malaria diagnostic tools: microscopy and rapid diagnostic test (RDT) Am J Trop Med Hyg. 2007;77((Suppl)):119–127. [PubMed] [Google Scholar]
- 23.Bell AS, Huijben S, Paaijmans KP, Sim DG, Chan BHK, Nelson WA, Read AF. Enhanced transmission of drug-resistant parasites to mosquitoes following drug treatment in rodent malaria. PLoS ONE. 2012;7:e37172. doi: 10.1371/journal.pone.0037172. [DOI] [PMC free article] [PubMed] [Google Scholar]
- 24.R Core Team . R: A Language and Environment for Statistical Computing. Vienna, Austria: The R Foundation for Statistical Computing; 2012. [Google Scholar]
- 25.World Health Organization . Guidelines for the Treatment of Malaria. 2nd Ed. Geneva, Switzerland: World Health Organization; 2010. http://www.who.int/malaria/publications/atoz/9789241547925/en/ Available at. [Google Scholar]
- 26.Stepniewska K, White NJ. Some considerations in the design and interpretation of antimalarial drug trials in uncomplicated falciparum malaria. Malar J. 2006;5:127. doi: 10.1186/1475-2875-5-127. [DOI] [PMC free article] [PubMed] [Google Scholar]
- 27.Greenhouse B, Myrick A, Dokomajilar C, Woo JM, Carlson EJ, Rosenthal PJ, Dorsey G. Validation of microsatellite markers for use in genotyping polyclonal Plasmodium falciparum infections. Am J Trop Med Hyg. 2006;75:836–842. [PMC free article] [PubMed] [Google Scholar]
- 28.Ngrenngarmlert W, Kwiek JJ, Kamwendo DD, Ritola K, Swanstrom R, Wongsrichanalai C, Miller RS, Ittarat W, Meshnick SR. Measuring allelic heterogeneity in Plasmodium falciparum by a heteroduplex tracking assay. Am J Trop Med Hyg. 2005;72:694–701. [PubMed] [Google Scholar]
- 29.Kwiek JJ, Alker AP, Wenink EC, Chaponda M, Kalilani LV, Meshnick SR. Estimating true antimalarial efficacy by heteroduplex tracking assay in patients with complex Plasmodium falciparum infections. Antimicrob Agents Chemother. 2007;51:521–527. doi: 10.1128/AAC.00902-06. [DOI] [PMC free article] [PubMed] [Google Scholar]
- 30.Juliano JJ, Bacon DJ, Mu J, Wang X, Meshnick SR. Novel dhps and pfcrt polymorphisms in Plasmodium falciparum detected by heteroduplex tracking assay. Am J Trop Med Hyg. 2009;80:734–736. [PMC free article] [PubMed] [Google Scholar]
- 31.Manske M, Miotto O, Campino S, Auburn S, Almagro-Garcia J, Maslen G, O'Brien J, Djimde A, Doumbo O, Zongo I, Ouedraogo JB, Michon P, Mueller I, Siba P, Nzila A, Borrmann S, Kiara SM, Marsh K, Jiang H, Su XZ, Amaratunga C, Fairhurst R, Socheat D, Nosten F, Imwong M, White NJ, Sanders M, Anastasi E, Alcock D, Drury E, Oyola S, Quail MA, Turner DJ, Ruano-Rubio V, Jyothi D, Amenga-Etego L, Hubbart C, Jeffreys A, Rowlands K, Sutherland C, Roper C, Mangano V, Modiano D, Tan JC, Ferdig MT, Amambua-Ngwa A, Conway DJ, Takala-Harrison S, Plowe CV, Rayner JC, Rockett KA, Clark TG, Newbold CI, Berriman M, MacInnis B, Kwiatkowski DP. Analysis of Plasmodium falciparum diversity in natural infections by deep sequencing. Nature. 2012;487:375–379. doi: 10.1038/nature11174. [DOI] [PMC free article] [PubMed] [Google Scholar]
- 32.Juliano JJ, Taylor SM, Meshnick SR. Polymerase chain reaction adjustment in antimalarial trials: molecular malarkey? J Infect Dis. 2009;200:5–7. doi: 10.1086/599379. [DOI] [PMC free article] [PubMed] [Google Scholar]
- 33.Stephens R, Culleton RL, Lamb TJ. The contribution of Plasmodium chabaudi to our understanding of malaria. Trends Parasitol. 2012;28:73–82. doi: 10.1016/j.pt.2011.10.006. [DOI] [PMC free article] [PubMed] [Google Scholar]
- 34.Pollitt LC, Mideo N, Drew DR, Schneider P, Colegrave N, Reece SE. Competition and the evolution of reproductive restraint in malaria parasites. Am Nat. 2011;177:358–367. doi: 10.1086/658175. [DOI] [PMC free article] [PubMed] [Google Scholar]
- 35.Malfertheiner P, Megraud F, O'Morain C, Bazzoli F, El-Omar E, Graham D, Hunt R, Rokkas T, Vakil N, Kuipers EJ. Current concepts in the management of Helicobacter pylori infection: the Maastricht III Consensus Report. Gut. 2007;56:772–781. doi: 10.1136/gut.2006.101634. [DOI] [PMC free article] [PubMed] [Google Scholar]
- 36.Dellit TH, Owens RC, McGowan JE, Gerding DN, Weinstein RA, Burke JP, Huskins WC, Paterson DL, Fishman NO, Carpenter CF, Brennan PJ, Billeter M, Hooton TM. Infectious Diseases Society of America and the Society for Healthcare Epidemiology of America guidelines for developing an institutional program to enhance antimicrobial stewardship. Clin Infect Dis. 2007;44:159–177. doi: 10.1086/510393. [DOI] [PubMed] [Google Scholar]
- 37.Günthard HF, Aberg JA, Eron JJ, Hoy JF, Telenti A, Benson CA, Burger DM, Cahn P, Gallant JE, Glesby MJ, Reiss P, Saag MS, Thomas DL, Jacobsen DM, Volberding PA, International Antiviral Society-USA Panel Antiretroviral treatment of adult HIV infection: 2014 recommendations of the International Antiviral Society-USA Panel. JAMA. 2014;312:410–425. doi: 10.1001/jama.2014.8722. [DOI] [PubMed] [Google Scholar]
- 38.Gonzalez-Serna A, Min JE, Woods C, Chan D, Lima VD, Montaner JSG, Harrigan PR, Swenson LC. Performance of HIV-1 drug resistance testing at low-level viremia and its ability to predict future virologic outcomes and viral evolution in treatment-naive individuals. Clin Infect Dis. 2014;58:1165–1173. doi: 10.1093/cid/ciu019. [DOI] [PMC free article] [PubMed] [Google Scholar]
- 39.Nguyen K-SH, Neal JW, Wakelee H. Review of the current targeted therapies for non-small-cell lung cancer. World J Clin Oncol. 2014;5:576–587. doi: 10.5306/wjco.v5.i4.576. [DOI] [PMC free article] [PubMed] [Google Scholar]
- 40.Saumet A, Mathelier A, Lecellier C-H. The potential of microRNAs in personalized medicine against cancers. Biomed Res Int. 2014;2014:642916. doi: 10.1155/2014/642916. [DOI] [PMC free article] [PubMed] [Google Scholar]
- 41.Madan RA, Gulley JL. (R)Evolutionary therapy: the potential of immunotherapy to fulfill the promise of personalized cancer treatment. J Natl Cancer Inst. 2015;107:347. doi: 10.1093/jnci/dju347. [DOI] [PMC free article] [PubMed] [Google Scholar]


