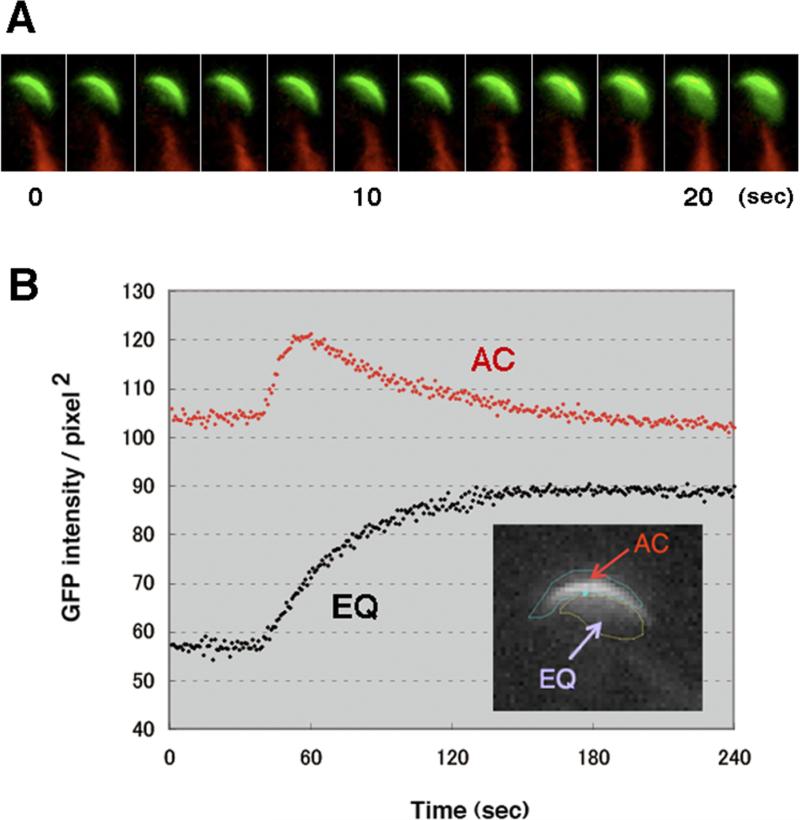
Figure 5.
Live imaging analysis of the transition between the AC and the EQ patterns. (A) Representative time-lapse images of a spermatozoon undergoing this transition. (B) The fluorescence intensity in the equatorial region area became stably higher after the transition, whereas upon the AC to EQ transition, the fluorescence in the acrosomal cap region increased transiently and returned to the original level. The fluorescence intensities of two arbitrary delimited areas of interest were measured over time.

