

Abstract
Background and Purpose
Leptin, an adipokine synthesized by the placenta during pregnancy, has been proposed for the management of preterm labour (PTL), as it is able to prevent in vitro uterine contractility and remodelling associated with labour onset. Another common feature of labour onset is the phenotypic switch of myometrial smooth muscle cells from a proliferative to a hypertrophic state. As proliferative effects have been demonstrated for leptin in other tissues, we aimed to investigate its ability to induce myometrial proliferation and thus to maintain uterine quiescence.
Experimental Approach
We stimulated human primary myometrial smooth muscle cells with leptin in the presence or absence of receptor antagonists or signalling pathway inhibitors.
Key Results
Leptin induced myometrial cell proliferation in a biphasic manner. At 6.25 ng·mL−1, leptin-induced proliferation was mediated by the leptin receptor and required the early activation of ERK1/2. At a concentration above 25 ng·mL−1, leptin induced direct non-specific stimulation of the IL-6 receptor, leading to NF-κB activation, and exerted anti-proliferative effects. However, at 50 ng·mL−1, leptin re-induces proliferation via IL-6 receptor stimulation that requires STAT3 and delayed ERK1/2 activation.
Conclusions and Implications
These data bring new insights into leptin signalling-induced myometrial proliferation and its interrelationship with the IL-6/IL-6 receptor axis. In the light of our previous work, the present study emphasizes the potential value of leptin in the pharmacological management of PTL and it also strengthens the hypothesis that leptin might be a contributory factor in the parturition-related disorders observed in obese women.
Tables of Links
| LIGANDS | |
|---|---|
| Curcumin | Tocilizumab |
| IL-6 | Triciribine |
| Leptin | U0126 |
These Tables list key protein targets and ligands in this article which are hyperlinked to corresponding entries in http://www.guidetopharmacology.org, the common portal for data from the IUPHAR/BPS Guide to PHARMACOLOGY (Pawson et al., 2014) and are permanently archived in the Concise Guide to PHARMACOLOGY 2013/14 (a,bAlexander et al., 2013a,b).
Introduction
The prevalence of obesity is increasing worldwide, including in women of reproductive age, which is a major concern because maternal obesity increases the risk of complications for both mother and foetus (Yu et al., 2006). Indeed, maternal obesity is associated with a wide spectrum of adverse pregnancy outcomes linked to a disruption in the parturition mechanisms resulting, particularly, in a delayed or difficult spontaneous labour onset, which can lead to higher rates of postdate pregnancies, and contribute to a greater need to induce labour (Arrowsmith et al., 2011). Induction failures, Caesarean section deliveries and post-partum haemorrhage have also been reported (Chu et al., 2007; Zhang et al., 2007). In obese subjects, an increase in adipose tissue is associated with a low-grade inflammatory state characterized by a moderate but chronic systemic rise in a number of adipokines, including leptin.
Leptin, a 16 kD protein, is the most studied adipokine and is produced and secreted by adipose tissue (Harris, 2014) as well as reproductive tissue such as placenta (Henson et al., 1998). Its main endocrine function is to maintain whole body energy homeostasis. Plasma leptin levels have been reported to be strongly correlated with both body mass index and total amount of fat mass and are elevated in obese subjects leading to a state of leptin resistance (Considine et al., 1996; Zhang and Scarpace, 2006). Circulating levels of leptin are between 5 to 15 ng·mL−1 in lean subjects, whereas the levels reach 40 to 60 ng·mL−1 in obese people (Sinha et al., 1996). Leptin acts by binding to its specific transmembrane receptor, the leptin receptor (also known as OB-R). Although leptin is not secreted by the myometrium, its receptors have been identified in this tissue (Wendremaire et al., 2011), as well as in the placenta (Henson et al., 1998) and endometrium (Kitawaki et al., 2000). Leptin receptors belong to the class I cytokine receptor family, sharing structural and functional similarities with IL-6 receptor. The extracellular leptin-binding domain of the leptin receptor possesses strong homology with the gp130 signal-transducing subunits of receptors for IL-6. Both leptin and its receptors share structural and functional similarities with the IL-6 receptor family; leptin stimulated leptin receptors are known to activate the three main signalling pathways that are activated by the IL-6 receptor: the JAK/STAT (not activated by short isoforms), PI3K/Akt and ERK1/2 pathways (Fruhbeck, 2006). However, it has been shown that IL-6 is also able to activate the NF-κB pro-inflammatory signalling pathway after binding to its receptor (Yang et al., 2013).
During pregnancy, the placenta becomes a significant source of leptin production (Senaris et al., 1997). Consistent with its placental production, leptin levels peak during the second trimester of pregnancy and fall precipitously after post-partum delivery (Hardie et al., 1997). Leptin produced by the placenta is secreted into both the maternal and foetal circulation (Bajoria et al., 2002; Domali and Messinis, 2002; Sagawa et al., 2002), suggesting a role throughout pregnancy. Moreover, in vitro studies have shown that leptin is able to oppose both spontaneous and oxytocin-induced contractions in human myometrium (Moynihan et al., 2006). It also prevents myometrial cell apoptosis and extracellular matrix remodelling (Wendremaire et al., 2011; 2013,), two common features of uterine preparation for labour (Smith, 2007), in an in vitro model of human myometrial inflammation. Another common feature of labour onset is the switch in the phenotype of myometrial smooth muscle cells from a proliferative to a hypertrophic state, which allows the synthesis of contractile material (Sharma et al., 2006; Magarinos et al., 2007; Saxena et al., 2007; Tanfin et al., 2011). Maintaining uterine smooth muscle cells in a proliferation state could, therefore, be a promising target for prevention of preterm labour (PTL).
Several studies have suggested that leptin has a proliferative effect (Sharma et al., 2006; Magarinos et al., 2007; Saxena et al., 2007). Hence, we hypothesized that leptin, by maintaining uterine quiescence, might be of interest as a tocolytic agent and could help to explain the parturition-related disorders observed in obese women. In the present study, we used an in vitro approach, thanks to the establishment of primary cell lines, to test if leptin is able to induce human myometrial cell proliferation.
Methods
Primary cell lines establishment
Myometrial biopsies were obtained from women undergoing elective Caesarean section delivery, mostly between 38 and 40 weeks of gestation, for cephalopelvic disproportion, before labour onset. This study was approved by the local ethics committee (Comité Consultatif de Protection des Personnes pour la Recherche Biomédicale, Dijon, France) and a written informed consent was obtained from all donors. Biopsies were cut into small strips and cultured in 100 mm culture dishes, in DMEM (Dominique Dutscher, Brumath, France) supplemented with 20% FBS (PAN Biotech., Aidenbach, Germany) and 1% of 100 IU·mL−1 penicillin G, 100 μg·mL−1 streptomycin and 0.025 mg·mL−1 amphotericin B (PAN Biotech.). After 2 weeks, cells reached confluence. The explants were gently removed; cells were harvested with trypsin 0.05%–EDTA 0.02%, centrifuged at 240× g for 10 min at room temperature (RT), resuspended in DMEM supplemented with 10% FBS at the required density and were placed into new culture dishes. All the experiments were performed on myometrial cells from the third to the sixth passage.
Stimulation protocol
Myometrial cells were seeded in 100 mm culture dishes (2 × 10⁵ cells for flow cytometry), 6-well plates (106 cells per well for Western blot) or on sterile 13 mm glass coverslips in 24-well plates (5 × 10⁴ cells per well for immunofluorescence), allowed to adhere for 24 h and starved for 72 h in serum-free low glucose (1 g·L−1) DMEM without phenol red and L-glutamine (Life Technologies, Carlsbad, CA, USA). Cells were stimulated in DMEM without phenol red, with 1% of FBS, with leptin at different concentrations (6.25, 25 and 50 ng·mL−1) for 24 or 12 h to assess cell number and percentage of cells in the S-phase, respectively, by flow cytometry. Leptin was dissolved in 20 mM Tris-HCl, pH 8.0, to the final concentration of 1 mg·mL−1. To investigate the cell cycle phase involved in proliferation, myometrial cells were stimulated for 4 h with leptin at 6.25 and 50 ng·mL−1. To investigate signalling pathways, cells were stimulated with leptin (6.25, 25 and 50 ng·mL−1) and a time course experiment was performed (1–5 min, 10–60 min and 1–8 h). Changes in signal phosphorylation of NF-κB, ERK1/2, Akt and STAT3 were analysed by Western blot. Inhibitors were initially dissolved in dimethyl sulphoxide (DMSO) to the concentration of 2 mM for U0126 and 10 mM for S3I-201, triciribine and curcumin. Stimulations were then performed in the presence of U0126 (10 μM), a MEK1/2 inhibitor; S3I-201 (10 μM), a STAT3 inhibitor; triciribine (5 μM), an Akt inhibitor or curcumin (1 μM), an NF-κB inhibitor. The specificity of the effect of leptin was assessed by using leptin receptor antagonist SHLA (100 ng·mL−1) or tocilizumab (1 μg·mL−1), an IL-6 receptor antagonist, added before leptin stimulation. Cells grown in serum-free media served as a negative control whereas cells grown in the presence of 10% serum served as a positive control for each experiment.
Cell proliferation analysis
Myometrial cells were harvested, centrifuged at 240× g for 10 min at RT and the pellets were resuspended in trypsin buffer (Spermine tetrahydrochloride, citrate and trypsin) and incubated for 13 min at RT. Then, RNase buffer (Spermine tetrahydrochloride, citrate, trypsin inhibitor and RNase from bovine pancreas) was added and the samples were incubated for a further 10 min at RT. Cells were finally stained with propidium iodide (PNN-1001, Invitrogen) and analysed with a LSRII flow cytometer (Becton Dickinson, BD, San Diego, CA, USA). The first stage was defined on a size-granularity dot plot to discriminate cells from debris and a second stage was performed on a red-area-red-width dot plot to discriminate single cells from doublets (Supporting Information). Cell proliferation was obtained by measuring the volume of each preparation needed to reach 10 000 events in the secondary stage. The cell cycle profile was determined by measuring the intensity of propidium iodide. The S-phase ratio was quantified with FlowJo software (Miltenyi Biotechnology, Paris, France) (Supporting Information Figure S1).
Western blot analysis
Cells were lysed in 100 μL of cold RIPA buffer [40 mM Tris-HCl (pH 7.4), 150 mM NaCl, 2 mM EDTA, 1 mM sodium orthovanadate, 50 mM sodium fluoride, 1% Triton X100, 1% protease inhibitor (P8340; Sigma Aldrich), 1% phosphatase inhibitor (P2850; Sigma-Aldrich)]. Total protein content was determined by Nanodrop (Thermo Scientific, Waltham, MA, USA) and samples were dissolved in Laemmli buffer [0.5 M Tris-HCl, pH 6.8, 10% (w v−1) SDS, 20% glycerol, 0.5% (w v−1) bromophenol blue] boiled for 3 min at 95°C. Thirty micrograms of total proteins were loaded per well and subjected to SDS-PAGE and transferred to a PVDF membrane. Membranes were blocked for 1 h in 5% non-fat dried milk powder in Tris-buffered saline/Tween 20 (TBST; 10 mM Tris, 150 mM NaCl and 0.1% Tween20, pH 7.8) at RT (TBS-tween 0.1%, non-fat dry milk 5%, BSA 0.1%). Blots were probed overnight at 4°C, with primary antibodies with a 1/1000 dilution of primary rabbit anti-phosphoSTAT3 (#9131), anti-phosphoERK1/2 (#9101) antibody or a 1/500 dilution of rabbit anti-phosphoAkt (#9271), anti-phosphoNF-κB (sc-33020), anti-cyclinD1 (#2978), mouse anti-cyclinE (#4129S) antibody, anti-NF-κB (sc-372), anti-ERK1/2 (#9101), anti-Akt (#9272), anti-STAT3 (#9132) or GAPDH antibody (sc-25778) in 1% non-fat dried milk powder in TBST. After three washes with TBST, blots were then incubated for 1 h at RT with HRP-conjugated anti-rabbit (sc- 2313) or anti-mouse antibody (sc-2314) at a dilution of 1/5000 or 1/10 000 and washed three times with TBST. Proteins were detected by enhanced chemiluminescence (ECL detection reagents, sc2048, Santa Cruz Biotechnology). Briefly, the membranes were incubated for 1 min in ECL and then exposed to Kodak films for 5 to 10 min. The films were then digitized using GS-800 densitometer and the bands were quantified with QuantityOne® software (BioRad, Hercules, CA, USA). For cyclin expression, the quantified bands were normalized with GAPDH and for phosphorylation assays, the bands were normalized with the total form of the corresponding protein.
Immunofluorescence analysis
Cells were fixed in cold 2% paraformaldehyde in PBS solution for 5 min at 4°C and blocked/permeabilized with PBS supplemented with 1% BSA and 0.1% saponin and incubated for 10 min at RT. Cells were incubated overnight at 4°C with primary rabbit polyclonal anti-phosphoERK1/2 or anti-phosphoNF-κB antibody (1/200 dilution in the blocking solution) and then with an Alexa fluor 488 coupled donkey anti-rabbit antibody (1/500 dilution in PBS 10% blocking solution) for 30 min at RT, away from light. Nuclei were stained with 4-6 diamidino-2-phenylindole at 100 ng·mL−1 (DAPI, D9542, Sigma-Aldrich) for 30 s at RT, away from light. The coverslips were rinsed twice in PBS and mounted onto superfrost slides in a Dako anti-fading mounting medium (Dako, S3023, Carpinteria, CA, USA). Slides were viewed on a fluorescence microscope Eclipse E400 (Nikon, Tokyo, Japan). Five representative pictures were taken in random chosen fields for each labelling. Pictures were then analysed and merged using ImageJ software (National Institutes of Health, Bethesda, MD, USA).
Protein/protein interaction analysis
Leptin and SHLA were biotinylated to a 3:1 molar ratio of biotin : protein using EZ-Link® NHS-PEG4-Biotin (#21330, Thermo Scientific, Waltham, MA, USA) to a final volume of 200 μL in PBS. Reactions were incubated for 30 min at RT and excess biotin was removed using Zeba™ spin desalting columns, 7K MWCO, 2 mL (#89890, Thermo Scientific). Biotinylated leptin and SHLA concentration was then adjusted to 2 μg·mL−1 in PBS for further use in interaction analysis. Kinetic interaction experiments were carried out using an Octet Red equipped with streptavidin SBC biosensor tips (ForteBio, Menlo Park, CA, USA). All experiments were performed at 25°C in PBS under 100× g agitation. Tips were saturated with 2 μg·mL−1 biotinylated ligand (leptin and SHLA) for 10 min, which typically resulted in capture levels of 0.9 ± 0.1 nm within a row of eight tips. For basic kinetic experiments and KD (equilibrium binding constant) determination, the leptin receptor and IL-6 receptor α were prepared at a 1.75-fold serial dilution (typically 3.5, 5.6, 9.8, 17.14 and 30 nM) plus buffer blank, association was then monitored for 10 min and dissociation into PBS followed for 1 h.
Statistical analysis
Differences among groups were determined using anova. When the main effect was significant (anova P < 0.01), a Dunn's multiple comparison test was then applied. Statistical analysis was carried out using GraphPad Instat software (version 3, GraphPad Software, Inc., San Diego, CA, USA). Statistically significant results between groups are defined as P < 0.05 (*), P < 0.01 (**) and P < 0.001 (***).
Drugs and solutions
Recombinant human leptin (L4146), pharmacological inhibitor of MEK1/2 (U0126, IC50 = 72 and 58 nM for MEK1 and MEK2, respectively), pharmacological inhibitor of STAT3 (S3I-201, IC50 = 86 μM), pharmacological inhibitor of Akt (triciribine, IC50 = 130 nM), pharmacological inhibitor of NF-κB (curcumin, IC50 = 17 μM) and DAPI (D9542) were purchased from Sigma-Aldrich (Saint-Louis, MO, USA). Signalling pathway and cyclin antibodies were purchased from Cell Signaling Technology (Danvers, MA, USA) as GAPDH. NF-κB p65 and secondary antibodies were purchased from Santa Cruz Biotechnology (Santa Cruz, CA, USA). Alexa fluor 488 coupled donkey anti-rabbit antibody was purchased from Invitrogen (A-21206, Saint-Aubin, France). Leptin antagonist (human super-active leptin antagonist, SHLA) was purchased from Protein Laboratories (Rehovot, Israel) and IL-6 receptor-inhibiting monoclonal antibody Roactemra® 20 mg·mL−1 (tocilizumab) was purchased from Roche (Boulogne-Billancourt, France). Recombinant human leptin receptor and recombinant IL-6 receptor α (Product No 389-LR/LF and No 227-SR/LF, respectively) were purchased from R&D Systems (Minneapolis, MN, USA). Recombinant human IL-6 (Product No130-095-365) was purchased from Miltenyi Biotechnology (Paris, France).
Results
Leptin receptor stimulation induces primary human myometrial smooth muscle cell proliferation
We first characterized the proliferative effect of leptin receptor stimulation in a primary culture of myometrial cells using leptin at three different doses: 6.25 ng·mL−1 (concentration described in non-obese pregnant women), 25 and 50 ng·mL−1 (average concentrations reported in moderate obesity and obesity respectively). We observed that leptin promotes myometrial cell proliferation by increasing both total cell number (Figure 1A) and the percentage of cells in the S-phase (Figure 1B and C) in a biphasic manner with two peaks at 6.25 and 50 ng·mL−1 showing, respectively, a 47.5 ± 8.32% and a 39.9 ± 10.51% increase in cell number and, respectively, two- and 1.6-fold increase in percentage of cells in the S-phase when compared with non-stimulated cells.
Figure 1.
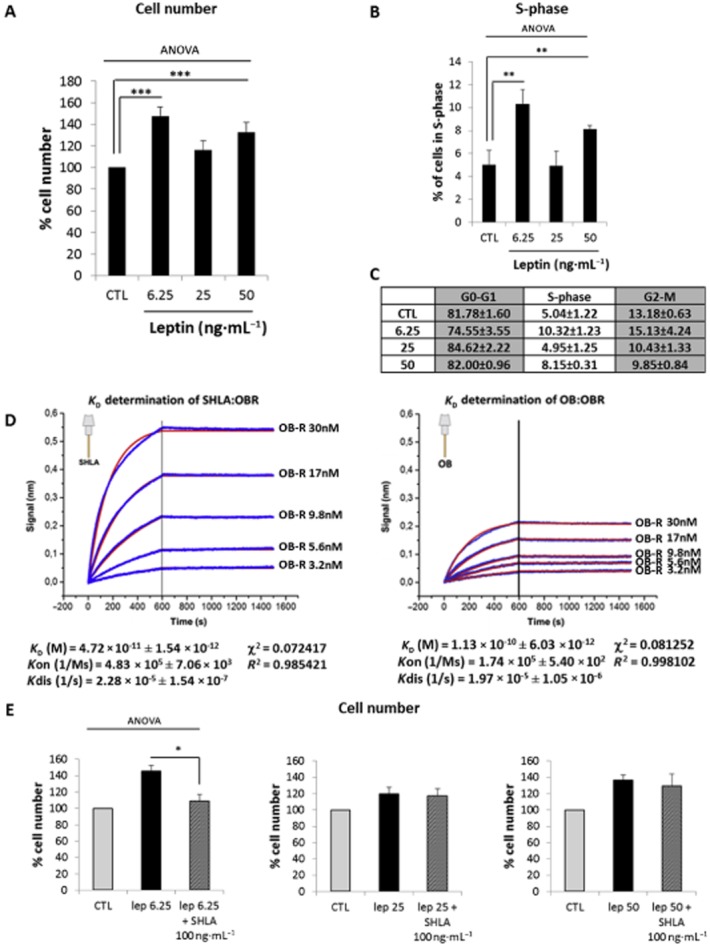
Leptin induces human myometrial smooth muscle cells (HM-SMC) proliferation. Cells were treated with leptin (6.25, 25 and 50 ng·mL−1) for 24 or 12 h (for cell number and S-phase, respectively), labelled with propidium iodide and analysed by flow cytometry. (A, B and C): Proliferation: cell number as a percentage of non-stimulated cells (CTL) (A) and percentage of cells in S-phase versus CTL (B) are presented as mean values ± SEM for five independent experiments. Percentage of cells in each phase of the cell cycle is expressed as mean values ± SEM for five independent experiments in (C). **P < 0.01 versus CTL, ***P < 0.001 versus CTL. (D) Determination of KD for SHLA : leptin receptor (OBR) and leptin (OB) : leptin receptor (OBR). Octet biosensors were saturated with 2 μg·mL−1 SHLA or leptin (OB) and incubated for 10 min with the leptin receptor (3.2, 5.6, 9.8, 17 and 30 nM) for association measurement and 15 min in PBS for dissociation measurement. Results are expressed as delayed wavelength versus time for the variable concentrations (blue curves). Fitting curves (red), KD (equilibrium binding constant), Kon (association rate constant), Kdis (dissociation rate constant), χ2 (chi-squared statistical test) and R2 (correlation coefficient) were determined in global 1:1 model. (E) Effect of leptin receptor antagonist, SHLA. Cells were treated with leptin (6.25, 25 and 50 ng·mL−1) for 24 h in the presence or absence of leptin antagonist SHLA (100 ng·mL−1). Cell numbers are expressed as percentage versus CTL and presented as mean values ± SEM from four independent experiments. *P < 0.05 versus leptin 6.25 alone.
Leptin-induced myometrial cell proliferation is selective for the leptin receptor stimulation at 6.25 but not at 50 ng·mL−1
To understand this biphasic effect, we assessed the potential loss of selectivity for the leptin receptor. Thus, myometrial cells were treated with leptin either at 6.25 or 50 ng·mL−1 alone or in the presence of the leptin receptor antagonist SHLA (Shpilman et al., 2011; Gertler and Elinav, 2014). First, we determined by use of the interference biolayer (Octet) that SHLA has a three-fold higher affinity for the leptin receptor than leptin (KDSHLA = 0.04 nM < KDLeptin = 0.12 nM for the leptin receptor; Figure 1D).
We observed that SHLA totally prevented leptin-induced increase in cell number when cells were stimulated with leptin at 6.25 ng·mL−1 whereas SHLA had no significant effect on proliferation induced by leptin at 25 or 50 ng·mL−1 (Figure 1E), indicating that there is a loss of selectivity and that the suppression of leptin-induced proliferation at 25 and 50 ng·mL−1 is not caused by stimulation of the leptin receptor.
As both leptin and its receptors share structural and functional similarities with the IL-6 receptor family, we hypothesized that leptin could also bind to the IL-6 receptor. We therefore assessed the effect of inhibiting the IL-6 receptor with tocilizumab (a humanized anti-human IL-6 receptor monoclonal antibody) on leptin-induced proliferative effects. As shown in Figure 2A, tocilizumab did not affect the increase in cell number induced by leptin at 6.25 ng·mL−1. However, when leptin was used at 25 and 50 ng·mL−1, we observed that tocilizumab significantly facilitated the proliferative effect of leptin. These results suggest that, with high doses of leptin, IL-6 receptor could be activated and responsible for a repression of leptin-induced proliferative effects. To strengthen this in vitro observation, we also demonstrated that leptin is able to bind to IL-6 receptors. Indeed, we measured an 18 nM affinity of leptin for the IL-6 receptor, indicating an affinity of leptin 15 times lower for the IL-6 receptor compared with the leptin receptor (Figure 2B), explaining why leptin can only activate the IL-6 receptor at high concentrations.
Figure 2.
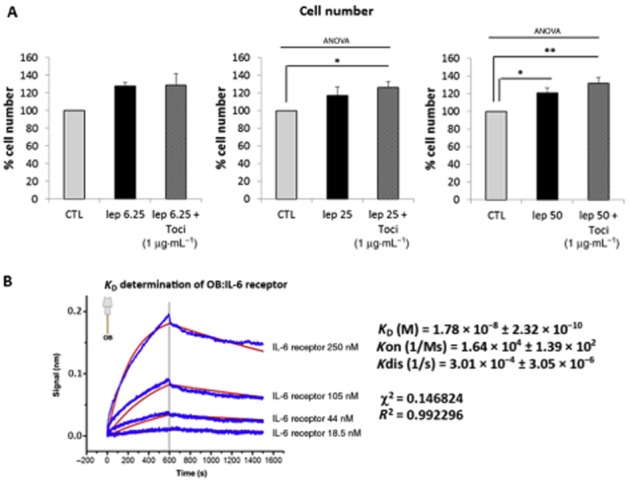
Leptin-induced human myometrial smooth muscle cells (HM-SMC) proliferation is selective for stimulation of the leptin receptor at 6.25 ng·mL−1 but not at 50 ng·mL−1. (A) Efffect of IL-6 receptor antagonist. Cells were treated with leptin (6.25, 25 and 50 ng·mL−1) for 24 h in the presence or absence of tocilizumab (1 μg·mL−1). Cell numbers are expressed as percentage versus CTL (unstimulated cells) and presented as mean values ± SEM from four independent experiments. *P < 0.05 versus CTL, **P < 0.01 versus CTL. (B) Determination of KD for leptin-IL-6 receptor. Octet biosensors were saturated with 2 μg·mL−1 leptin and incubated for 10 min with IL-6 receptor α (18.5, 44, 105 and 250 nM) for association measurement and 15 min in PBS for dissociation measurement. Results are expressed as delayed wavelength versus time for the variable concentrations (blue curves). Fitting curves (red), KD (equilibrium binding constant), Kon (association rate constant), Kdis (dissociation rate constant), χ2 (chi-squared statistical test) and R2 ( correlation coefficient) were determined in global 1:1 model.
Taken together, these results indicate that proliferation induced by leptin at 6.25 ng·mL−1 is specific to stimulation and activation of the leptin receptor. At higher concentrations, leptin also binds to the IL-6 receptor that may be responsible for its lack of proliferative effect observed at 25 ng·mL−1.
Specific- and non-specific-mediated proliferative effects of leptin require different signalling pathways
We next aimed to determine if leptin 6.25 ng·mL−1- and leptin 50 ng·mL−1-mediated proliferative effects are induced through different signalling pathways. We investigated the three main signalling pathways (ERK1/2, Akt, STAT3) using a pharmacological inhibitor approach.
We performed leptin stimulation at different doses, a low one specific to leptin receptor stimulation (6.25 ng·mL−1) and a high one involving activation of IL-6 receptors (50 ng·mL−1), in the presence or absence of the MEK1/2 inhibitor U0126, Akt inhibitor triciribine or STAT3 inhibitor S3I-201.
Flow cytometry analysis revealed that the blockade of MEK1/2 fully inhibited the proliferative effect of leptin at both 6.25 and 50 ng·mL−1 (Figure 3A), while S3I-201 only inhibited the proliferation induced by leptin 50 ng·mL−1 (Figure 3B), suggesting that the ERK1/2 signalling is required for both leptin receptor-specific and non-specific proliferative effects and that the STAT3 pathway is only required for the non-specific effects of leptin. No inhibition was observed with triciribine, suggesting that Akt is not involved in the proliferative effects of leptin (Figure 3C).
Figure 3.
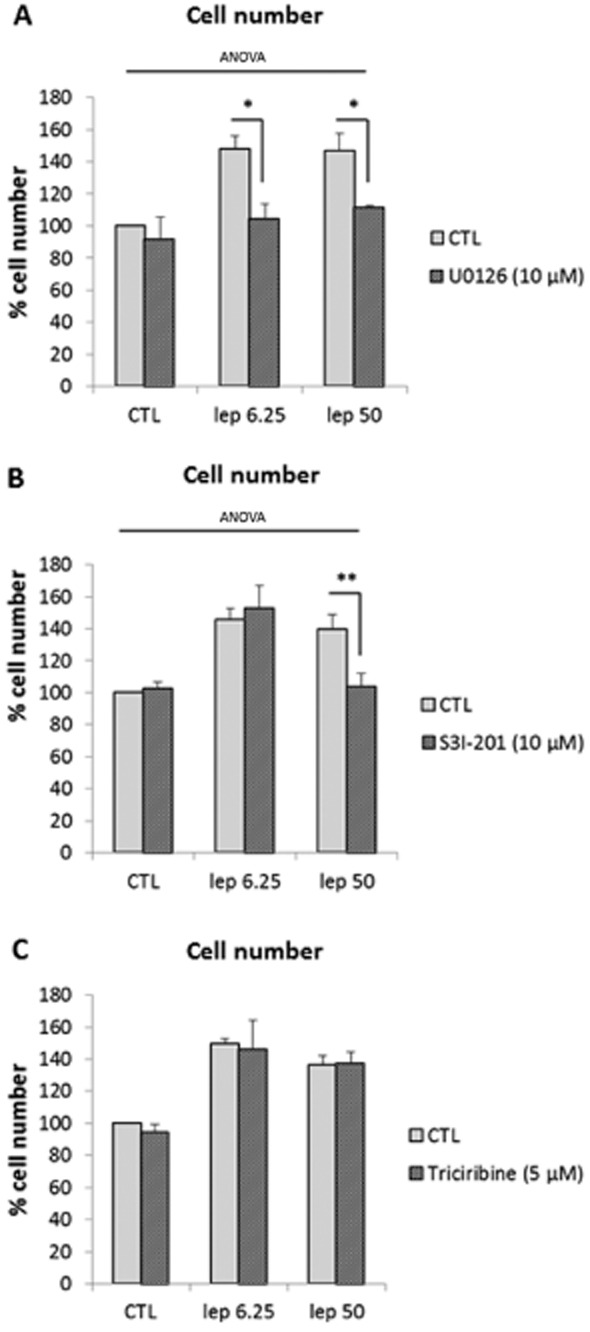
Leptin receptor-specific and non-specific mediated proliferative effects require different signalling pathways. (A) ERK1/2 inhibition. Cells were treated with leptin (6.25 and 50 ng·mL−1) for 24 h in the presence or absence of U0126 (10 μM). U0126 was added 1 h before leptin. Numbers are expressed as percentages versus CTL and presented as mean values ± SEM from four independent experiments. *P < 0.05 versus leptin 6.25 or 50 alone. (B) Effect of STAT3 inhibition. Cells were treated with leptin (6.25 and 50 ng·mL−1) for 24 h in the presence or absence of S3I-201 (10 μM). S3I-201 was added 1 h before leptin. Numbers are expressed as percentages versus CTL and presented as mean values ± SEM from four independent experiments. **P < 0.01 versus leptin 50 alone. (C) Effect of Akt inhibition. Cells were treated with leptin (6.25 and 50 ng·mL−1) for 24 h in the presence or absence of triciribine (5 μM). Triciribine was added 1 h before leptin. Numbers are expressed as percentages versus CTL and presented as mean values ± SEM from four independent experiments.
Leptin-induced myometrial cell proliferation at 6.25 ng·mL−1 involves the early activation of ERK1/2
To further characterize the differences in leptin-induced specific and non-specific signalling, we investigated the time course of the effects of stimulation and measured the abundance of the phosphorylated forms of ERK1/2. First in response to leptin 6.25 ng·mL−1, we observed an induction of ERK1/2 phosphorylation [1.7 ± 0.2-fold increase vs. control (CTL)] which appeared at 2 min and peaked after 3 min of stimulation (Figure 4A). We also observed that leptin induced a second wave of ERK1/2 phosphorylation (2.1 ± 0.2-fold increase vs. CTL) which appeared at 10 min and peaked after 50 min of stimulation (Figure 4B). These two peaks were associated with its translocation into myometrial cell nuclei (Figure 4C). No further activation of ERK1/2 was observed for longer stimulation times (Figure 4D). In accordance with our earlier results (Figure 3B and C), we did not observe any increase in the phosphorylation levels of STAT3 and Akt in response to leptin 6.25 ng·mL−1 (Supporting Information Figure S2). These results suggest that leptin receptor-specific signalling induced by leptin is mediated by an early and transient activation of ERK1/2.
Figure 4.
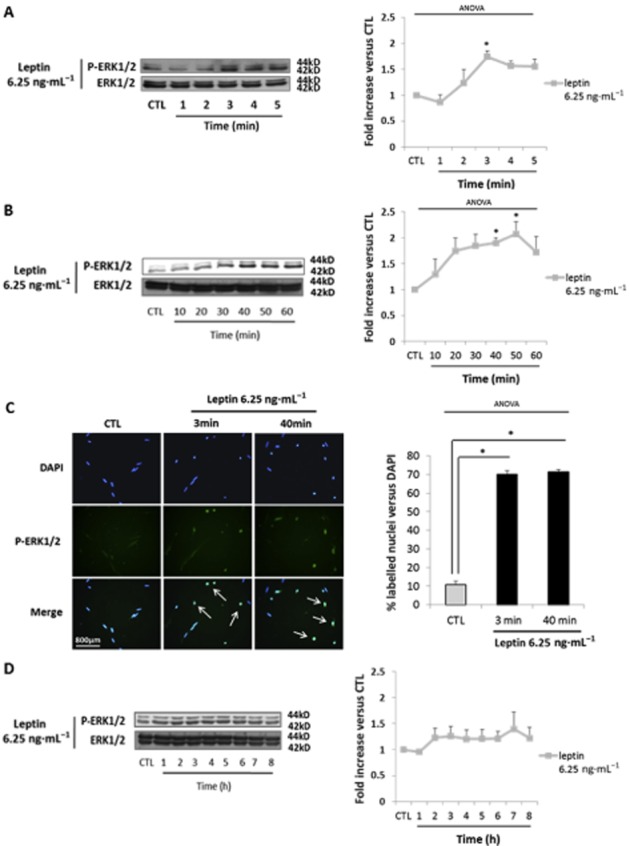
Leptin-induced human myometrial smooth muscle cells (HM-SMC) proliferation at 6.25 ng·mL−1 is mediated through ERK1/2 activation. (A, B and D) Western blots of p-ERK1/2. Cells were cultured with leptin at 6.25 ng·mL−1 for 0–5 min (A), 10–60 min (B) and 1–8h (D). The blots are representative of five independent experiments. Quantification: 42 kDa p-ERK1/2 bands were digitized and quantified with QuantityOne. Phosphorylated bands were compared with total of bands formed for each condition and presented as mean values ± SEM. *P < 0.05 versus CTL (non-stimulated cells). (C) P-ERK1/2 immunofluorescence. Fixed cells were labelled with anti-P-ERK1/2 antibody, Alexa fluor 488 and with DAPI for nuclear localization. Five representative pictures were taken with an epifluorescence microscope (×400) in random chosen fields for each labelling. Pictures were then analysed and merged using ImageJ software. Quantification: bars represented the mean ± SEM from four independent experiments. *P < 0.05 versus CTL (non-stimulated cells).
Leptin-(re)induced myometrial cell proliferation at 50 ng·mL−1 is mediated through STAT3/ERK1/2 activation
We next focused on the second signalling pathway, non-specific for the leptin receptor, induced by leptin at 50 ng·mL−1. Because we previously observed the requirement for both ERK1/2 and STAT3 for the proliferative effects of this dose, we measured the abundance of the phosphorylated forms of ERK1/2 and STAT3 in response to leptin 50 ng·mL−1. We observed an induction of STAT3 phosphorylation (3.3 ± 0.7-fold increase vs. CTL) which appeared at 1 h and peaked after 6 h of stimulation (Figure 5A). No induction of STAT3 was observed for short or intermediate stimulation times (Figure 5B). Interestingly, we observed a decrease in phosphorylated STAT3 when the IL-6 receptor antagonist tocilizumab and leptin 50 ng·mL−1 were used together (2.4 ± 0.2 vs. CTL) compared with leptin alone (3.3 ± 0.4 vs. CTL) (Supporting Information Figure S3A). Moreover, we observed that the use of leptin receptor antagonist SHLA potentiated the effect of leptin 50 ng·mL−1 on STAT3 phosphorylation (3.3. ± 0.4 vs. CTL and 8.1 ± 3.1 vs. CTL for leptin alone and leptin/SHLA respectively) (Supporting Information Figure S3B). Taken together, these results suggest that leptin 50 ng·mL−1-induced proliferation is mediated through STAT3 activation in an IL-6 receptor-dependent manner.
Figure 5.
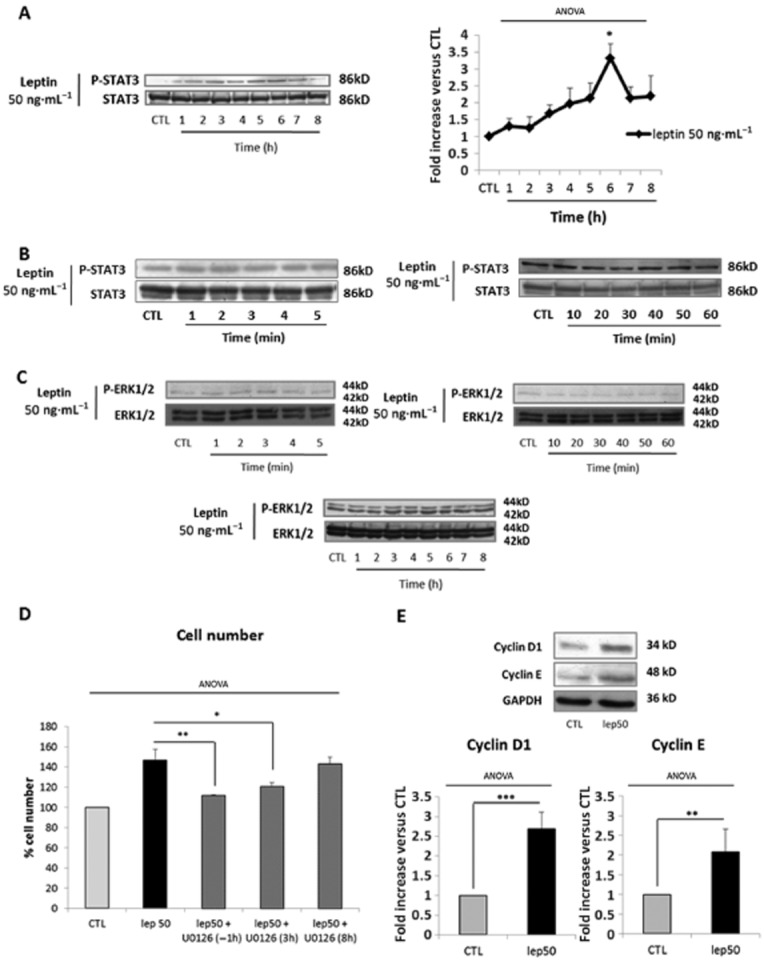
Leptin-induced myometrial cell proliferation at 50 ng·mL−1 is mediated through STAT3 activation. (A and B) Western blots p-STAT3. Cells were cultured with leptin 50 ng·mL−1 for 1–8 h (A) and 1–60 min (B). The blots are representative of four independent experiments. Quantification: 86 kDa p-STAT3 bands were digitized and quantified with QuantityOne. Phosphorylated bands are compared with total of bands formed for each condition and presented as mean values ± SEM. *P < 0.05 versus CTL (non-stimulated cells). (C) Western blots of p-ERK1/2. Cells were cultured with leptin at 50 ng·mL−1 for 0–5 min, 10–60 min and 1–8 h. The blots are representative of five independent experiments. Quantification: 42 kDa p-ERK1/2 bands were digitized and quantified with QuantityOne. Phosphorylated bands are compared with total of bands formed for each condition and presented as mean values ± SEM. (D) ERK1/2 inhibition. Cells were treated with leptin at 50 ng·mL−1 for 24 h in the presence or absence of U0126 (10 μM). U0126 was added 1 h before leptin stimulation (H-1), 3 h (H+3) or 8 h (H+8) after leptin treatment. Numbers are expressed as percentages versus CTL and presented as mean values ± SEM from four independent experiments. *P < 0.05, **P < 0.01 versus leptin 50 alone. (E) Cyclin D1 and cyclin E expression. Cells were stimulated with leptin at 50 ng·mL−1 for 4 h. The blots are representative of four independent experiments. The 34 kDa cyclin D1 and 48 kDa cyclin E bands were digitized and quantified with QuantityOne. Bands are compared with GAPDH for each condition. Relative quantities versus CTL are presented as mean values ± SEM. **P < 0.01 versus CTL, ***P < 0.001 versus CTL.
In contrast to what we observed with leptin 6.25 ng·mL−1, we did not observe ERK1/2 phosphorylation with leptin at 50 ng·mL−1 (Figure 5C). These results suggest that early leptin receptor-induced ERK1/2 activation is blocked when the non-specific pathway is concomitantly induced and could occur later on.
We, therefore, investigated the kinetics of inhibition with U0126 that was added either 1 h before (H-1) or 3 h (H+3) and 8 h (H+8) after leptin. We observed that the proliferative effects of leptin 50 ng·mL−1 were blocked when U0126 was added at H-1 and H+3 (Figure 5D), but not at H+8, indicating that ERK1/2 activation is required for leptin 50 ng·mL−1-induced proliferative effects and takes place 3 to 8 h after leptin stimulation. Both H+3 and H+8 failed to inhibit leptin 6.25 ng·mL−1-induced proliferative effects (Supporting Information Figure S3C), confirming an early activation of ERK1/2 in response to this low dose of leptin.
However, we still failed to detect the transient ERK1/2 activation in the longer time course (1–8 h). We therefore assessed cyclin D1 and E expression, which are classically described to be downstream targets of ERK1/2 activation (Meloche and Pouyssegur, 2007). We observed that 50 ng·mL−1 leptin induced the expression of both cyclin D1 and E after 4 h of stimulation (Figure 5E, 2.7 ± 0.4 and 2.1 ± 0.6-fold increase for cyclin D1 and cyclin E compared with untreated cells), confirming that ERK1/2 activation occurs between 3 and 8 h.
Finally, in accordance with our earlier results (Figure 3C), we did not observe any increase in the phosphorylation levels of Akt in response to leptin 50 ng·mL−1 (Supporting Information Figure S2B).
The NF-κB pathway is activated by high leptin concentrations in human myometrial cells
Because the IL-6 receptor shares the three pathways commonly activated by the leptin receptor but only IL-6 receptor stimulation activates NF-κB, we examined whether the interaction of leptin with the IL-6 receptor was associated with NF-κB activation, which is commonly involved in inflammatory and anti-proliferative effects.
We showed that leptin at 50 ng·mL−1 induced a significant increase in the phosphorylation of NF-κB whereas we did not observe any activation of NF-κB with leptin at 6.25 ng·mL−1. (Figure 6A and B). Our time-course response to leptin at 50 ng·mL−1 at short and intermediate times demonstrated an induction of NF-κB phosphorylation (1.8 ± 0.2-fold increase vs. CTL), which appeared at 2–3 min and peaked after 3–4 min of stimulation (Figure 6A), associated with its nuclear translocation (Figure 6C). Finally, we observed that leptin induced a second wave of NF-κB phosphorylation (2.2 ± 0.6-fold increase vs. CTL, Figure 6B), with nuclear translocation (Figure 6C) after 50 min of stimulation. Accordingly, with the lack of NF-κB phosphorylation after stimulation with leptin at 6.25 ng·mL−1, we did not observe its nuclear translocation.
Figure 6.
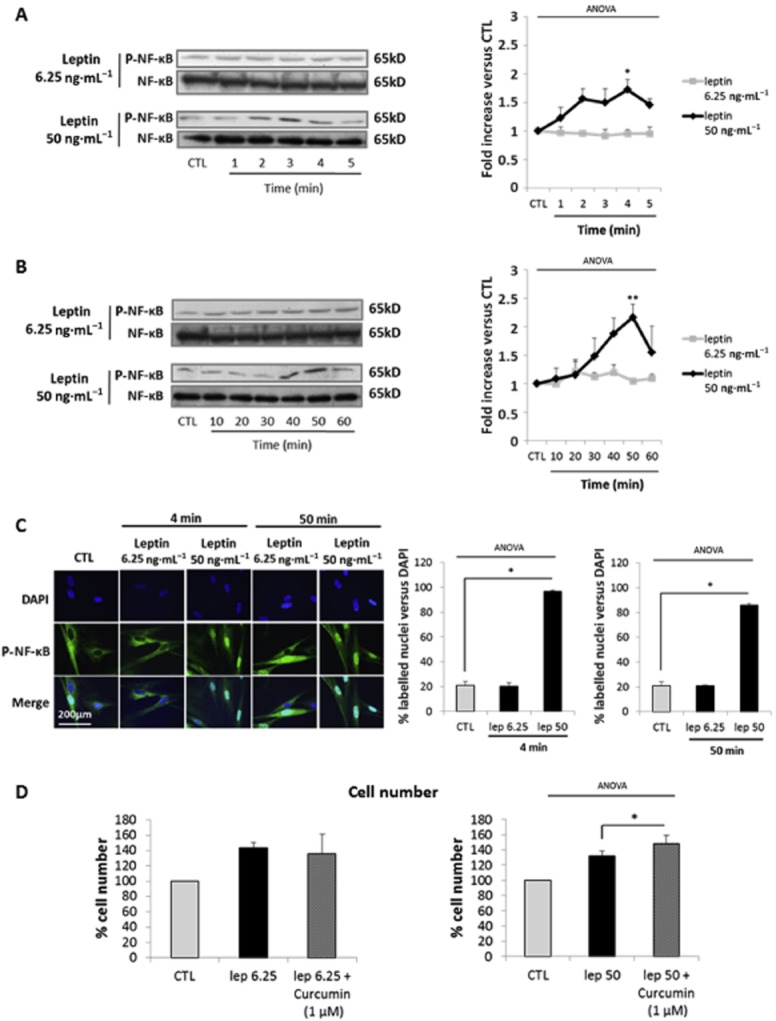
NF-κB signalling pathway is activated by high concentrations of leptin. (A,B) Western blots p-NF-κB. Cells were cultured with leptin (6.25, 50 ng·mL−1) for 0–5 (A) and 10–60 min (B). The blots are representative of four independent experiments. Quantification: 65 kD p-NF-κB bands were digitized and quantified with QuantityOne. Phosphorylated bands are compared with total of bands formed for each condition and presented as mean values ± SEM. *P < 0.05 versus CTL, **P < 0.01 versus CTL. (C) P-NF-κB immunofluorescence. Fixed cells were labelled with anti-P-NF-κB antibody, Alexa fluor 488 and with DAPI for nuclear localization. Pictures, taken with an epifluorescence microscope (×1000) in random chosen fields, are representative of five pictures taken for each condition. Quantification: bars represent the mean ± SEM from four independent experiments. *P < 0.05 versus CTL. (D) NF-κB inhibition. Cells were treated with leptin (6.25 and 50 ng·mL−1) in the presence or absence of curcumin (1 μM). Cell numbers are expressed as percentage versus CTL and presented as mean values ± SEM from four independent experiments. *P < 0.05 versus leptin 50 alone.
Interestingly, NF-κB phosphorylation is dose-dependently induced in response to leptin (Supporting Information Figure S4A), with the first significant effect observed with leptin 25 ng·mL−1. Moreover, leptin at 25 ng·mL−1 is also able to induce full activation of NF-κB (Supporting Information Figure S4B and C).
Therefore, we wanted to see if NF-κB was responsible for the absence of a proliferative effect of leptin at 25 ng·mL−1. Thus we studied the effect of curcumin, a NF-κB inhibitor, on leptin-induced cell proliferation. We observed that curcumin, which had no effect on the response to leptin 6.25 ng·mL−1, potentiated the proliferative effects of leptin 50 ng·mL−1 (Figure 6D) and was able to restore the proliferative effect to leptin 25 ng·mL−1 (Supporting Information Figure S4D).
NF-κB pathway activation is due to non-specific stimulation of the IL-6 receptor by leptin at high doses
Because NF-κB was only activated by high doses of leptin, we wondered if NF-κB phosphorylation was exclusively the result of IL-6 receptor activation or also involved leptin receptor activation. Cells were thus treated with leptin either at 50 ng·mL−1 alone or in the presence of either SHLA or tocilizumab.
We observed after both a short (4 min) and a long (50 min) time of stimulation with leptin at 50 ng·mL−1 that tocilizumab prevented leptin-induced NF-κB phosphorylation (Figure 7A) and nuclear translocation (Figure 7B) while SHLA did not prevent either NF-κB phosphorylation (Figure 8A) or nuclear translocation (Figure 8B). The same results were observed with leptin 25 ng·mL−1 (Supporting Information Figure S4E). These results indicate that NF-κB activation observed with high concentrations of leptin is specific to IL-6 receptor stimulation.
Figure 7.
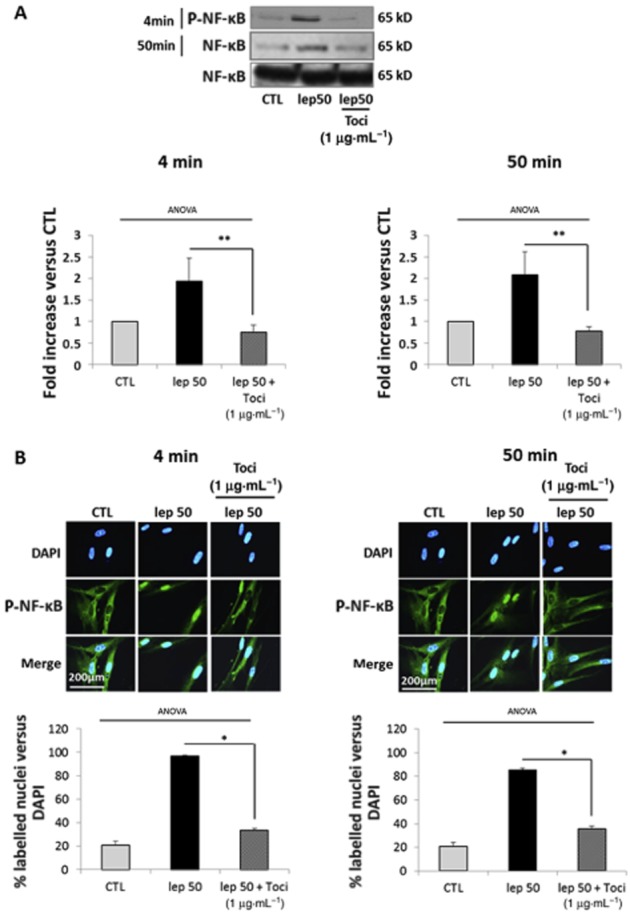
Leptin-induced NF-κB pathway activation is caused by non-specific stimulation of the IL-6 receptor. Cells were treated with leptin at 50 ng·mL−1 for 4 or 50 min in the presence or absence of tocilizumab (1 μg·mL−1). (A) Western blots for p-NF-κB. The blots are representative of four independent experiments. Quantification: 65 kD p-NF-κB bands were digitized and quantified with QuantityOne. Phosphorylated bands are compared with total form bands for each condition and represented as mean values ± SEM. **P < 0.01 versus lep50 alone. (B) P-NF-κB immunofluorescence: cells were labelled with anti-P-NF-κB antibody, Alexa fluor 488 and with DAPI for nuclear localization. Pictures, taken with an epifluorescence microscope (×1000) in random chosen fields, are representative of five pictures taken for each condition. Quantification: bars represent the mean ± SEM from four independent experiments. *P < 0.05 versus leptin 50 alone.
Figure 8.
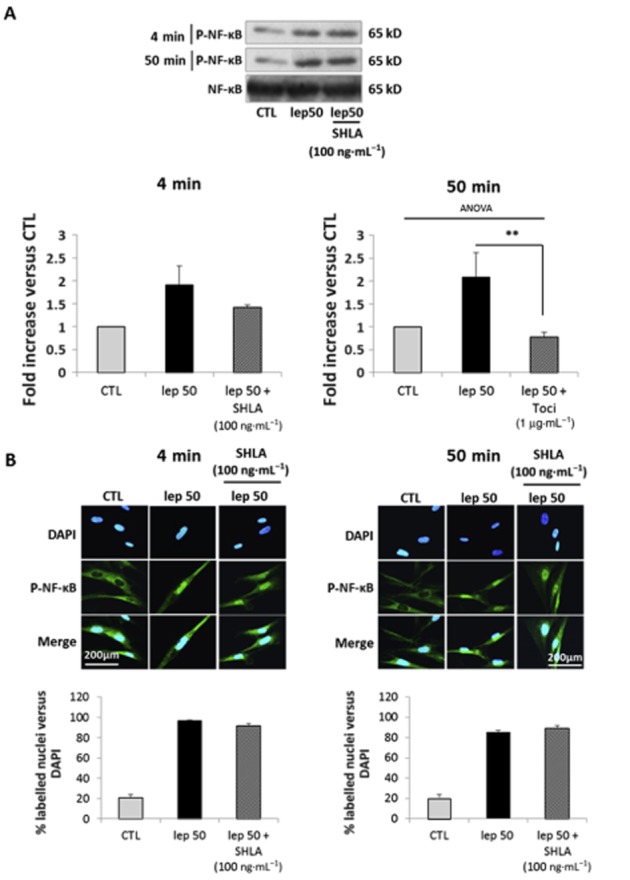
Leptin-induced NF-κB pathway activation is not mediated by stimulation of the leptin receptor. Cells were treated with leptin 50 ng·mL−1 for 4 and 50 min in the presence or absence of SHLA (100 ng·mL−1). (A) Western blots for p-NF-κB. The blots are representative of four independent experiments. Quantification: 65 kD p-NF-κB bands were digitized and quantified with QuantityOne. Phosphorylated bands are compared with total of bands formed for each condition and presented as mean values ± SEM. (B) P-NF-κB immunofluorescence: cells were labelled with anti-P-NF-κB antibody, Alexa fluor 488 and with DAPI for nuclear localization. Pictures, taken with an epifluorescence microscope (×1000) in random chosen fields, are representative of five pictures taken for each condition. Quantification: bars represent the mean ± SEM from three independent experiments.
Discussion
Proliferative effects of leptin on myometrial cells
High doses of leptin induce proliferation of myometrial cells via IL-6 receptor signalling
Leptin-induced proliferation is not specific for the leptin receptor at concentrations above 25 ng·mL−1, as proliferation was not prevented by SHLA. We further demonstrated both by competition and binding studies that this loss of selectivity was caused by the interaction of leptin with the IL-6 receptor.
Several studies have shown that leptin leads to the production of IL-6, which then activates IL-6 receptor signalling pathways. For example, leptin-induced IL-6 production, signalling and subsequent STAT3 activation promotes the proliferation of colon epithelial pre-neoplastic cells giving a biologically plausible link between leptin and obesity-associated colon cancer (Fenton et al., 2006). Leptin-induced IL-6 production also mediates several steps in the activation of the inflammatory response (Yang et al., 2013) and thus could contribute to the chronic low-grade inflammation observed in obesity. Nevertheless, in our study, we did not observe any IL-6 production by myometrial cells (Supporting Information Figure S5). We demonstrated that leptin was able to bind to the IL-6 receptor and induce proliferation at 50 ng·mL−1; this was mediated by IL-6 receptor stimulation as SHLA did not suppress this effect. Thus, we propose a new mechanism by which leptin, at concentrations corresponding to morbid obesity, directly interferes with the IL-6/IL-6 receptor axis involved in chronic low-grade inflammation.
Leptin-induced activation of the IL-6 receptor leads to modification of signalling pathways
In this study, we demonstrated that leptin-induced proliferation required ERK1/2 activation. This pathway has been widely studied as it is thought to be activated by virtually all mitogenic factors (Yang et al., 2013). ERK1/2 is indeed a key regulator of the early cell cycle induction, as it is involved in G0/G1 and G1/S transition and our team demonstrated a key role for the biphasic transient activation of ERK1/2 in mymetrial cell proliferation (Hadi et al., 2013). However, we only observed ERK1/2 phosphorylation and nuclear translocation in response to the lower dose of leptin. Nevertheless, kinetics experiments using an ERK1/2 inhibitor allowed us to determine that ERK1/2 activation occurred between 3 and 8 h, after stimulation with 50 ng·mL−1 leptin.
The ERK1/2 pathway activation is commonly described as being transiently activated, thus, when this activation does not occur directly upon the binding of a ligand to its receptor, the detection of its activation becomes challenging. However, we observed that the addition of U0126 together with leptin 50 ng·mL−1 significantly decreased cell number when compared with leptin 50 ng·mL−1 alone. Moreover, thanks to kinetics experiments using U0126, we demonstrated an activation of ERK1/2 pathway occurring between 3 and 8 h after the addition of 50 ng·mL−1 leptin. Furthermore, many studies have shown that ERK1/2 activation is responsible for cyclin D1 expression (Suzuki et al., 2002) and further favours cyclin D1-induced cyclin E expression. Thus, the induction of both cyclins expression after 4 h of stimulation with leptin at 50 ng·mL−1 confirms that the ERK1/2 pathway was activated around this time point. Taken together, these results suggest that ERK1/2 activation is involved in leptin 50 ng·mL−1-induced cell proliferation.
The last point concerning ERK1/2 signalling is that the effects of leptin at 6.25 ng·mL−1 relied on direct activation of the ERK1/2 pathway, while 50 ng·mL−1 leptin firstly activates the STAT3 pathway that later leads to ERK1/2 activation.
Upon phosphorylation, STAT3 promotes the transcription of downstream genes involved in cellular functions, such as proliferation, migration and anti-apoptotic functions (Levy and Lee, 2002). Studies have reported that STAT3 can induce proliferation independently of ERK1/2 activation (Fukada et al., 1996; Horiguchi et al., 2002), while other authors report cross-talks with ERK1/2 signalling (Chen et al., 2008; Liu et al., 2011; Morales-Prieto et al., 2013). In leptin-induced proliferation of endometrial cancer cells, STAT3 is able to directly phosphorylate ERK1/2 (Sharma et al., 2006). In this case, ERK1/2 activation occurs within the same kinetics as STAT3, which was not the case in our study. The delayed activation observed by us is more consistent with the cross-talk observed by others, where STAT3 induces the expression of the suppressor of cytokine signalling 3 (SOCS3) (Morales-Prieto et al., 2013), which in turn inactivates the negative regulator of Ras signalling, RasGAP, indirectly leading to an increase in ERK1/2 activity.
As mentioned previously, the IL-6 receptor- but not leptin receptor-mediated signalling is induced at high doses of leptin. The IL-6 receptor has also been demonstrated to induce the proliferation of various cell types [proB cells (Fukada et al., 1996), renal cancer cells (Horiguchi et al., 2002) and vascular smooth muscle cells (Morimoto et al., 1991)]. The associated signalling also involves STAT3, the major downstream target of IL-6 signalling, either independent (Horiguchi et al., 2002) or dependent on ERK1/2 activation (Toth et al., 2011). The IL-6 receptor is also able to trigger ERK1/2 activation independently of STAT3 activation, via SHP-2/ERK1/2 activation (Fukada et al., 1996). However, STAT3 activation in this cell type remains primordial as it induces the expression of the anti-apoptotic protein Bcl2 and protects the cell against death. Consistent with this, our team has demonstrated anti-apoptotic effects of leptin in the myometrium (Wendremaire et al., 2011).
Taken together, these results demonstrate that leptin directly activates the IL-6 receptor axis with pro- and anti-proliferative signalling dependent on the dose. IL-6 receptor activation also leads to modification of leptin receptor signalling. This could help to explain leptin resistance as this phenomenon can be caused by an impairment of leptin receptor signalling pathways. Indeed, obesity is associated with chronic low-grade IL-6 production that activates STAT3 and induces SOCS3 expression which phosphorylates the SH-2 domain of th eleptin receptor, leading to its inactivation (Fruhbeck, 2006).
Leptin in parturition
Leptin and obesity-related delivery disorders
Maternal obesity is associated with a wide spectrum of delivery disorders, such as postdate pregnancies or preterm deliveries. Indeed, it has been reported to be an independent predictor of a dysfunctional labour, with delayed labour onset leading to higher rates of postdates pregnancies (Cedergren, 2004; Denison et al., 2008; Arrowsmith et al., 2011). Surprisingly, maternal obesity seems to be associated with preterm deliveries (McDonald et al., 2010; Cnattingius et al., 2013). Although most of them are medically indicated because of obesity-related disorders, such as pre-eclampsia (Hendler et al., 2005), some authors reported an association between obesity and spontaneous preterm deliveries (Khatibi et al., 2012; Cnattingius et al., 2013).
Because obese women exhibit elevated circulating levels of leptin (Misra and Trudeau, 2011), we speculated that delivery disorders observed in these women are linked with the versatile effects of leptin on labour-associated processes, such as myometrial proliferation. The underlying mechanism for these differential effects of leptin is that elevated leptin concentrations are associated with an impaired myometrial response (mediated by stimulation of the IL-6 receptor instead of the leptin receptor), in favour of peripheral leptin resistance (Zhang and Scarpace, 2006) resulting from down-regulation of the leptin receptor (Liu et al., 2007). In more detail, we suggest that PTL observed in obese women might be caused by the activation of the IL-6 receptor/NF-κB pathway by leptin whereas postdate pregnancies might be linked to stimulation of the IL-6 receptor/STAT3 pathway leading to myometrial proliferation. Nevertheless, this assumption needs to be confirmed by further experiments as the stimulation protocol used in our study mimicked a single-dose exposure rather than a chronic one.
Leptin and pharmacological management of PTL
Leptin has been previously proposed as a tocolytic agent, as it exerts a potent cumulative inhibitory effect on myometrial contractions (Wuntakal and Hollingworth, 2010). Our team has also shown that leptin is able to prevent myometrial apoptosis and extracellular matrix remodelling, two common features of labour onset. In this study, we demonstrated that leptin induces proliferation of myometrial cells, maintaining them in contractile quiescence phase, adding to the interest in the use of leptin for the management of PTL. However, leptin is also able to induce NF-κB via stimulation of the IL-6 receptor. The NF-κB pathway has been demonstrated to have variable effects on cell apoptosis/survival, depending upon the activating stimuli. Indeed, the list of NF-κB target genes includes both proliferative [cyclin D1 (Hinz et al., 1999)] and pro-apoptotic [p53 and c-myc (Baeuerle and Henkel, 1994)] genes. Studies have demonstrated that the prosurvival effects of NF-κB require the concomitant expression of Bcl2 (Grimm et al., 1996), which is a target protein of the IL-6 receptor/STAT3 signalling pathway. Further studies have demonstrated a strong link between STAT3 activation and the NF-κB-induced proliferation in response to cytokines (Grivennikov and Karin, 2010). Thus, our results showing a requirement of STAT3 activation for the leptin/IL-6 receptor-triggered proliferation of myometrial cells are in line with these data. Moreover, we found that the NF-κB pathway activation is not only dispensable but also seems to have deleterious effects on the leptin-induced proliferation. Indeed, NF-κB inhibition potentiated the proliferative effects of leptin at 25 and 50 ng·mL−1. These results suggest that NF-κB, which partly represses the proliferative effect of leptin, could antagonize leptin receptor activation at high leptin doses and be responsible for the observed blockade of the early leptin receptor-mediated activation of ERK1/2.
In pregnancy, inflammation leads to myometrial cell differentiation and contractions. It has been shown that NF-κB regulates the pro-inflammatory and procontractile genes involved in labour and is required for the synthesis of prostaglandins (Christiaens et al., 2008). Thus, while leptin could be of interest to prevent PTL, caution is needed regarding the doses used to avoid the deleterious activation of NF-κB. Previous studies performed with leptin have used doses 10- to 100-fold higher than those used in our study (Caüzac et al., 2003; Chen et al., 2007; Huang et al., 2010). Nevertheless, experiments were performed on human myometrial biopsies and not with monolayers of cultured cells, thus it is difficult to compare these results with those obtained with the doses used in our studies.
Lastly, MacIntyre et al. (2014) recently demonstrated that NF-κB activation is not a functional requirement for infection/inflammation-induced PTL. Furthermore, in vivo studies have shown that amniotic perfusion of IL-6 in pregnant non-human primates is not able to induce PTL, as does IL-1β or TNF-α. Thus, the IL-6 receptor, as an inducer of myometrial cell proliferation, could, despite its pro-inflammatory effects, help to maintain the myometrium in a quiescent state.
Conclusion
These data bring new insights into leptin signalling and its interrelationship with the IL-6/IL-6 receptor axis as summarized in Figure 9. In the light of our previous work, the present study emphasizes the potential value of leptin in the pharmacological management of PTL, as it is able to maintain proliferation and to oppose the triggering mechanisms of labour, remodelling, apoptosis and their consequences (i.e. myometrial contractions). Nevertheless, as high doses of leptin also activate NF-κB, further studies are required to investigate if leptin also induces myometrial differentiation.
Figure 9.
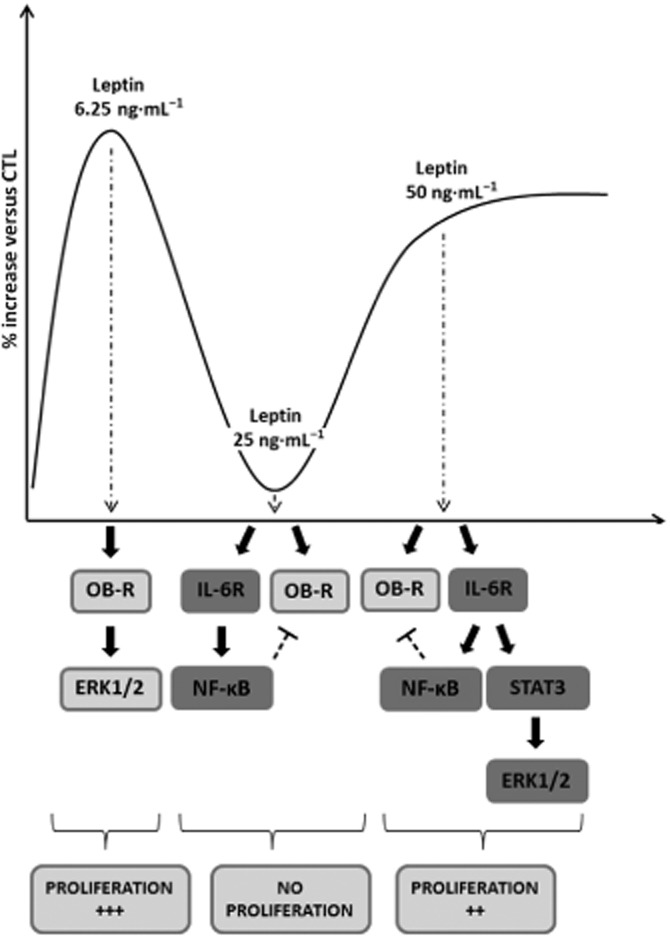
Putative signalling model for leptin-induced human myometrial cell proliferation. Leptin 6.25 ng·mL−1 is able to induce human myometrial cell proliferation via activation of the ERK1/2 signalling pathway, in an leptin receptor (OB-R)-dependent manner. At 25 ng·mL−1, leptin is able to bind both the IL-6 and leptin receptors. Leptin 25 ng·mL−1 induces the pro-inflammatory NF-κB pathway, which is supposed to inhibit leptin receptor signalling and thus to inhibit proliferation. Leptin 50 ng·mL−1 is able to induce the anti-proliferative NF-κB signalling pathway and the pro-proliferative STAT3/ERK1/2 pathway, in an IL-6 receptor-dependent manner, resulting in the proliferation of human myometrial cells.
Acknowledgments
This work was supported in part by the Regional Council of Burgundy (Conseil regional de Bourgogne) grant AOI Lirussi 2011.
Glossary
- ECL
enhanced chemiluminescence
- PTL
preterm labour
- RT
room temperature
- SHLA
human super-active leptin antagonist
- SOCS-3
Suppressor of cytokine signalling 3
- TBST
Tris-buffered saline/Tween 20
Author contributions
M. Barrichon, T. H. and M. W. performed the research. F. L., M. Bardou and M. Dumas designed the research study. R. S., C. P., G. M., M. Delignette, J. M. and P. S. contributed essential reagents or tools. M. Barrichon analysed the data. M. Barrichon, T. H., F. L. and C. G. wrote the paper.
Conflict of interest
The authors state no conflict of interest.
Supporting Information
Figure S1 Representative histograms of cell cycle analysis.
Figure S2 Akt and STAT3 signalling pathways. (A) STAT3 signalling pathway. Cells were stimulated with leptin at 6.25 ng·mL−1 for 0–5 and 10–60 min. Presented blots are representative of four independent experiments. (B) Akt signalling pathway. Cells were cultured with leptin at 6.25 or 50 ng·mL−1 for 0–5 min, 10–60 min and 1–8 h. Presented blots are representative of five independent experiments.
Figure S3 Leptin-induced STAT3 activation at 50 ng·mL−1 is IL-6 receptor dependent. (A,B) Western blots p-STAT3. Cells were cultured with leptin at 50 ng·mL−1 for 6 h in the presence or absence of (A) IL-6 receptor antagonist tocilizumab (1 μg·mL−1) or (B) leptin receptor antagonist SHLA (100 ng·mL−1). Presented blots are representative of four independent experiments. Quantification: 86 kDa bands were digitized and quantified with QuantityOne. Phosphorylated bands are compared with total protein for each condition and represented as mean value ± SEM, n = 4. *P < 0.05 versus lep50 alone. (C) ERK1/2 inhibition. Cells were treated with leptin at 6.25 ng·mL−1 for 24 h in the presence or absence of U0126 (10 μM). U0126 was added 1 h (H-1), 3 h (H+3) or 8 h (H+8) before or after leptin stimulation. Numbers are expressed as percentages versus control (CTL) and represented as mean values ± SEM from four independent experiments. *P < 0.05 versus lep6.25 alone.
Figure S4 NF-κB signalling pathway. Cells were treated with leptin at different concentrations (6.25, 12.5, 25, 50 and 100 ng·mL−1) for 50 min (A), at 25 ng·mL−1 for 0–5 min and 10–60 min (B), at 25 ng·mL−1 for 24 h in the presence or absence of curcumin (1 μM) (D) or at 25 ng·mL−1 for 4 or 50 min in the presence (E) or absence (C) of tocilizumab (1 μg·mL−1) or leptin antagonist SHLA (100 ng·mL−1). (A,B) Western blots p-NF-κB. Presented blots are representative of four independent experiments. Quantification: 65 kD p-NF-κB bands were digitized and quantified with QuantityOne. Phosphorylated bands are compared with total form bands for each condition and represented as mean values ± SEM. **P < 0.01 versus CTL. (C and E) p-NF-κB immunofluorescence: Cells were labelled with anti-P-NF-κB antibody, Alexa fluor 488 and with DAPI for nuclear localization. Five pictures were taken with an epifluorescence microscope (×1000) in random chosen fields for each condition. n = 3. (D) Flow cytometry. Total cell numbers are expressed as percentage versus control (CTL) and represented as mean values ± SEM from four independent experiments. **P < 0.01 versus lep25 alone.
Figure S5 IL-6 secretion. Concentrations of IL-6 (pg·mL−1) in supernatants from myometrial cells stimulated with leptin at 6.25, 25 and 50 ng·mL−1 were measured by elisa. Data are presented as percentage of IL-6 released compared with IL-6 level in supernatant of non-stimulated cells (CTL). Bars represented the mean ± SEM from four independent experiments.
Figure S6 Supplementary methods: Gating strategy for proliferation and cell cycle phase assessment.
References
- Alexander SPH, Benson HE, Faccenda E, Pawson AJ, Sharman JL, Spedding M, et al. The Concise Guide to PHARMACOLOGY 2013/14: Catalytic receptors. Br J Pharmacol. 2013a;170:1676–1705. doi: 10.1111/bph.12449. [DOI] [PMC free article] [PubMed] [Google Scholar]
- Alexander SPH, Benson HE, Faccenda E, Pawson AJ, Sharman JL, Spedding M, et al. The Concise Guide to PHARMACOLOGY 2013/14: Enzymes. Br J Pharmacol. 2013b;170:1797–1867. doi: 10.1111/bph.12451. [DOI] [PMC free article] [PubMed] [Google Scholar]
- Arrowsmith S, Wray S, Quenby S. Maternal obesity and labour complications following induction of labour in prolonged pregnancy. Brit J Obstet Gynaec. 2011;118:578–588. doi: 10.1111/j.1471-0528.2010.02889.x. [DOI] [PMC free article] [PubMed] [Google Scholar]
- Baeuerle PA, Henkel T. Function and activation of NF-kappa B in the immune system. Annu Rev Immunol. 1994;12:141–179. doi: 10.1146/annurev.iy.12.040194.001041. [DOI] [PubMed] [Google Scholar]
- Bajoria R, Sooranna SR, Ward BS, Chatterjee R. Prospective function of placental leptin at maternal-fetal interface. Placenta. 2002;23:103–115. doi: 10.1053/plac.2001.0769. [DOI] [PubMed] [Google Scholar]
- Caüzac M, Czuba D, Girard J, Hauguel-de Mouzon S. Transduction of leptin growth signals in placental cells is independent of JAK-STAT activation. Placenta. 2003;24:378–384. doi: 10.1053/plac.2002.0915. [DOI] [PubMed] [Google Scholar]
- Cedergren MI. Maternal morbid obesity and the risk of adverse pregnancy outcome. Obstet Gynecol. 2004;103:219–224. doi: 10.1097/01.AOG.0000107291.46159.00. [DOI] [PubMed] [Google Scholar]
- Chen C, Chang YC, Liu TP, Chang KJ, Guo IC. Leptin induces proliferation and anti-apoptosis in human hepatocarcinoma cells by up-regulating cyclin D1 and down-regulating Bax via a Janus kinase 2-linked pathway. Endocr Relat Cancer. 2007;14:513–529. doi: 10.1677/ERC-06-0027. [DOI] [PubMed] [Google Scholar]
- Chen RJ, Ho YS, Guo HR, Wang YJ. Rapid activation of Stat3 and ERK1/2 by nicotine modulates cell proliferation in human bladder cancer cells. Toxicol Sci. 2008;104:283–293. doi: 10.1093/toxsci/kfn086. [DOI] [PubMed] [Google Scholar]
- Christiaens I, Zaragoza DB, Guilbert L, Robertson SA, Mitchell BF, Olson DM. Inflammatory processes in preterm and term parturition. J Reprod Immunol. 2008;79:50–57. doi: 10.1016/j.jri.2008.04.002. [DOI] [PubMed] [Google Scholar]
- Chu SY, Kim SY, Schmid CH, Dietz PM, Callaghan WM, Lau J, et al. Maternal obesity and risk of cesarean delivery: a meta-analysis. Obesity Rev. 2007;8:385–394. doi: 10.1111/j.1467-789X.2007.00397.x. [DOI] [PubMed] [Google Scholar]
- Cnattingius S, Villamor E, Johansson S, Edstedt Bonamy AK, Persson M, Wikström AK, et al. Maternal obesity and risk of preterm delivery. JAMA. 2013;309:2362–2370. doi: 10.1001/jama.2013.6295. [DOI] [PubMed] [Google Scholar]
- Considine RV, Sinha MK, Heiman ML, Kriauciunas A, Stephens TW, Nyce MR, et al. Serum immunoreactive-leptin concentrations in normal-weight and obese humans. N Engl J Med. 1996;334:292–295. doi: 10.1056/NEJM199602013340503. [DOI] [PubMed] [Google Scholar]
- Denison FC, Price J, Graham C, Wild S, Liston WA. Maternal obesity, length of gestation, risk of postdates pregnancy and spontaneous onset of labour at term. Brit J Obstet Gynaec. 2008;115:720–725. doi: 10.1111/j.1471-0528.2008.01694.x. [DOI] [PMC free article] [PubMed] [Google Scholar]
- Domali E, Messinis IE. Leptin in pregnancy. J Matern Fetal Neonatal Med. 2002;12:222–230. doi: 10.1080/jmf.12.4.222.230. [DOI] [PubMed] [Google Scholar]
- Fenton JI, Hursting SD, Perkins SN, Hord NG. Interleukin-6 production induced by leptin treatment promotes cell proliferation in an Apc (Min/+) colon epithelial cell line. Carcinogenesis. 2006;27:1507–1515. doi: 10.1093/carcin/bgl018. [DOI] [PubMed] [Google Scholar]
- Fruhbeck G. Intracellular signalling pathways activated by leptin. Biochem J. 2006;393:7–20. doi: 10.1042/BJ20051578. [DOI] [PMC free article] [PubMed] [Google Scholar]
- Fukada T, Hibi M, Yamanaka Y, Takahashi-Tezuka M, Fujitani Y, Yamaguchi T, et al. Two signals are necessary for cell proliferation induced by a cytokine receptor gp130: involvement of STAT3 in anti-apoptosis. Immunity. 1996;5:449–460. doi: 10.1016/s1074-7613(00)80501-4. [DOI] [PubMed] [Google Scholar]
- Gertler A, Elinav E. Novel superactive leptin antagonists and their potential therapeutic applications. Curr Pharm Des. 2014;20:659–665. doi: 10.2174/13816128113199990014. [DOI] [PubMed] [Google Scholar]
- Grimm S, Bauer MK, Baeuerle PA, Schulze-Osthoff K. Bcl-2 down-regulates the activity of transcription factor NF-kappaB induced upon apoptosis. J Cell Biol. 1996;134:13–23. doi: 10.1083/jcb.134.1.13. [DOI] [PMC free article] [PubMed] [Google Scholar]
- Grivennikov SI, Karin M. Dangerous liaisons: STAT3 and NF-kappaB collaboration and crosstalk in cancer. Cytokine Growth Factor Rev. 2010;21:11–19. doi: 10.1016/j.cytogfr.2009.11.005. [DOI] [PMC free article] [PubMed] [Google Scholar]
- Hadi T, Barrichon M, Mourtialon P, Wendremaire M, Garrido C, Sagot P, et al. Biphasic Erk1/2 activation sequentially involving Gs and Gi signaling is required in beta3-adrenergic receptor-induced primary smooth muscle cell proliferation. Biochim Biophys Acta. 2013;1833:1041–1051. doi: 10.1016/j.bbamcr.2013.01.019. [DOI] [PubMed] [Google Scholar]
- Hardie L, Trayhurn P, Abramovich D, Fowler P. Circulating leptin in women: a longitudinal study in the menstrual cycle and during pregnancy. Clin Endocrinol (Oxf) 1997;47:101–106. doi: 10.1046/j.1365-2265.1997.2441017.x. [DOI] [PubMed] [Google Scholar]
- Harris RB. Direct and indirect effects of leptin on adipocyte metabolism. Biochim Biophys Acta. 2014;1842:414–423. doi: 10.1016/j.bbadis.2013.05.009. [DOI] [PMC free article] [PubMed] [Google Scholar]
- Hendler I, Goldenberg RL, Mercer BM, Iams JD, Meis PJ, Moawad AH, et al. The Preterm Prediction Study: association between maternal body mass index and spontaneous and indicated preterm birth. Am J Obstet Gynecol. 2005;192:882–886. doi: 10.1016/j.ajog.2004.09.021. [DOI] [PubMed] [Google Scholar]
- Henson MC, Swan KF, O'Neil JS. Expression of placental leptin and leptin receptor transcripts in early pregnancy and at term. Obstet Gynecol. 1998;92:1020–1028. doi: 10.1016/s0029-7844(98)00299-3. [DOI] [PubMed] [Google Scholar]
- Hinz M, Krappmann D, Eichten A, Heder A, Scheidereit C, Strauss M. NF-kappaB function in growth control: regulation of cyclin D1 expression and G0/G1-to-S-phase transition. Mol Cell Biol. 1999;19:2690–2698. doi: 10.1128/mcb.19.4.2690. [DOI] [PMC free article] [PubMed] [Google Scholar]
- Horiguchi A, Oya M, Marumo K, Murai M. STAT3, but not ERKs, mediates the IL-6-induced proliferation of renal cancer cells, ACHN and 769P. Kidney Int. 2002;61:926–938. doi: 10.1046/j.1523-1755.2002.00206.x. [DOI] [PubMed] [Google Scholar]
- Huang F, Xiong X, Wang H, You S, Zeng H. Leptin-induced vascular smooth muscle cell proliferation via regulating cell cycle, activating ERK1/2 and NF-κB. Acta Biochim Biophys Sin (Shanghai) 2010;42:325–331. doi: 10.1093/abbs/gmq025. [DOI] [PubMed] [Google Scholar]
- Khatibi A, Brantsaeter AL, Sengpiel V, Kacerovsky M, Magnus P, Morken NH, et al. Prepregnancy maternal body mass index and preterm delivery. Am J Obstet Gynecol. 2012;207:e211–e217. doi: 10.1016/j.ajog.2012.06.002. [DOI] [PubMed] [Google Scholar]
- Kitawaki J, Koshiba H, Ishihara H, Kusuki I, Tsukamoto K, Honjo H. Expression of leptin receptor in human endometrium and fluctuation during the menstrual cycle. J Clin Endocrinol Metab. 2000;85:1946–1950. doi: 10.1210/jcem.85.5.6567. [DOI] [PubMed] [Google Scholar]
- Levy DE, Lee CK. What does Stat3 do? J Clin Invest. 2002;109:1143–1148. doi: 10.1172/JCI15650. [DOI] [PMC free article] [PubMed] [Google Scholar]
- Liu Y, Lv L, Xiao W, Gong C, Yin J, Wang D, et al. Leptin activates STAT3 and ERK1/2 pathways and induces endometrial cancer cell proliferation. J Huazhong Univ Sci Technol. 2011;31:365–370. doi: 10.1007/s11596-011-0382-7. [DOI] [PubMed] [Google Scholar]
- Liu ZJ, Bian J, Liu J, Endoh A. Obesity reduced the gene expressions of leptin receptors in hypothalamus and liver. Hormone Metab Res. 2007;39:489–494. doi: 10.1055/s-2007-981680. [DOI] [PubMed] [Google Scholar]
- MacIntyre DA, Lee YS, Migale R, Herbert BR, Waddington SN, Peebles D, et al. Activator protein 1 is a key terminal mediator of inflammation-induced preterm labor in mice. FASEB J. 2014;28:2358–2368. doi: 10.1096/fj.13-247783. [DOI] [PubMed] [Google Scholar]
- Magarinos MP, Sanchez-Margalet V, Kotler M, Calvo JC, Varone CL. Leptin promotes cell proliferation and survival of trophoblastic cells. Biol Reprod. 2007;76:203–210. doi: 10.1095/biolreprod.106.051391. [DOI] [PubMed] [Google Scholar]
- McDonald SD, Han Z, Mulla S, Beyene J, Knowledge Synthesis G. Overweight and obesity in mothers and risk of preterm birth and low birth weight infants: systematic review and meta-analyses. BMJ. 2010;341:c3428. doi: 10.1136/bmj.c3428. [DOI] [PMC free article] [PubMed] [Google Scholar]
- Meloche S, Pouyssegur J. The ERK1/2 mitogen-activated protein kinase pathway as a master regulator of the G1- to S-phase transition. Oncogene. 2007;26:3227–3239. doi: 10.1038/sj.onc.1210414. [DOI] [PubMed] [Google Scholar]
- Misra VK, Trudeau S. The influence of overweight and obesity on longitudinal trends in maternal serum leptin levels during pregnancy. Obesity. 2011;19:416–421. doi: 10.1038/oby.2010.172. [DOI] [PubMed] [Google Scholar]
- Morales-Prieto DM, Ospina-Prieto S, Chaiwangyen W, Weber M, Holters S, Schleussner E, et al. Intranuclear crosstalk between extracellular regulated kinase1/2 and signal transducer and activator of transcription 3 regulates JEG-3 choriocarcinoma cell invasion and proliferation. ScientificWorldJournal. 2013;2013:259845. doi: 10.1155/2013/259845. [DOI] [PMC free article] [PubMed] [Google Scholar]
- Morimoto S, Nabata T, Koh E, Shiraishi T, Fukuo K, Imanaka S, et al. Interleukin-6 stimulates proliferation of cultured vascular smooth muscle cells independently of interleukin-1 beta. J Cardiovasc Pharmacol. 1991;17(Suppl. 2):S117–S118. doi: 10.1097/00005344-199117002-00026. [DOI] [PubMed] [Google Scholar]
- Moynihan AT, Hehir MP, Glavey SV, Smith TJ, Morrison JJ. Inhibitory effect of leptin on human uterine contractility in vitro. Am J Obstet Gynecol. 2006;195:504–509. doi: 10.1016/j.ajog.2006.01.106. [DOI] [PubMed] [Google Scholar]
- Pawson AJ, Sharman JL, Benson HE, Faccenda E, Alexander SP, Buneman OP, et al. NC-IUPHAR. The IUPHAR/BPS Guide to PHARMACOLOGY: an expert-driven knowledgebase of drug targets and their ligands. Nucl Acids Res. 2014;42:D1098–D1106. doi: 10.1093/nar/gkt1143. (Database Issue): [DOI] [PMC free article] [PubMed] [Google Scholar]
- Sagawa N, Yura S, Itoh H, Mise H, Kakui K, Korita D, et al. Role of leptin in pregnancy – a review. Placenta. 2002;23(Suppl. A):S80–S86. doi: 10.1053/plac.2002.0814. [DOI] [PubMed] [Google Scholar]
- Saxena NK, Sharma D, Ding X, Lin S, Marra F, Merlin D, et al. Concomitant activation of the JAK/STAT, PI3K/AKT, and ERK signaling is involved in leptin-mediated promotion of invasion and migration of hepatocellular carcinoma cells. Cancer Res. 2007;67:2497–2507. doi: 10.1158/0008-5472.CAN-06-3075. [DOI] [PMC free article] [PubMed] [Google Scholar]
- Senaris R, Garcia-Caballero T, Casabiell X, Gallego R, Castro R, Considine RV, et al. Synthesis of leptin in human placenta. Endocrinology. 1997;138:4501–4504. doi: 10.1210/endo.138.10.5573. [DOI] [PubMed] [Google Scholar]
- Sharma D, Saxena NK, Vertino PM, Anania FA. Leptin promotes the proliferative response and invasiveness in human endometrial cancer cells by activating multiple signal-transduction pathways. Endocr Relat Cancer. 2006;13:629–640. doi: 10.1677/erc.1.01169. [DOI] [PMC free article] [PubMed] [Google Scholar]
- Shpilman M, Niv-Spector L, Katz M, Varol C, Solomon G, Ayalon-Soffer M, et al. Development and characterization of high affinity leptins and leptin antagonists. J Biol Chem. 2011;286:4429–4442. doi: 10.1074/jbc.M110.196402. [DOI] [PMC free article] [PubMed] [Google Scholar]
- Sinha MK, Opentanova I, Ohannesian JP, Kolaczynski JW, Heiman ML, Hale J, et al. Evidence of free and bound leptin in human circulation. Studies in lean and obese subjects and during short-term fasting. J Clin Invest. 1996;98:1277–1282. doi: 10.1172/JCI118913. [DOI] [PMC free article] [PubMed] [Google Scholar]
- Smith R. Parturition. N Engl J Med. 2007;356:271–283. doi: 10.1056/NEJMra061360. [DOI] [PubMed] [Google Scholar]
- Suzuki TJKT, Ajima R, Nakamura T, Yoshida Y, Yamamoto T. Phosphorylation of three regulatory serines of Tob by Erk1 and Erk2 is required for Ras-mediated cell proliferation and transformation. Genes Dev. 2002;16:1356–1370. doi: 10.1101/gad.962802. [DOI] [PMC free article] [PubMed] [Google Scholar]
- Tanfin Z, Leiber D, Robin P, Oyeniran C, Breuiller-Fouche M. Endothelin-1: physiological and pathological roles in myometrium. Int J Biochem Cell Biol. 2011;43:299–302. doi: 10.1016/j.biocel.2010.10.009. [DOI] [PubMed] [Google Scholar]
- Toth KG, McKay BR, De Lisio M, Little JP, Tarnopolsky MA, Parise G. IL-6 induced STAT3 signalling is associated with the proliferation of human muscle satellite cells following acute muscle damage. PLoS ONE. 2011;6:e17392. doi: 10.1371/journal.pone.0017392. [DOI] [PMC free article] [PubMed] [Google Scholar]
- Wendremaire M, Bardou M, Peyronel C, Hadi T, Sagot P, Morrison JJ, et al. Effects of leptin on lipopolysaccharide-induced myometrial apoptosis in an in vitro human model of chorioamnionitis. Am J Obstet Gynecol. 2011;205:e361–e369. doi: 10.1016/j.ajog.2011.05.041. [DOI] [PubMed] [Google Scholar]
- Wendremaire M, Mourtialon P, Goirand F, Lirussi F, Barrichon M, Hadi T, et al. Effects of leptin on lipopolysaccharide-induced remodeling in an in vitro model of human myometrial inflammation. Biol Reprod. 2013;88:45. doi: 10.1095/biolreprod.112.104844. [DOI] [PubMed] [Google Scholar]
- Wuntakal R, Hollingworth T. Leptin – a tocolytic agent for the future? Med Hypotheses. 2010;74:81–82. doi: 10.1016/j.mehy.2009.07.039. [DOI] [PubMed] [Google Scholar]
- Yang WH, Liu SC, Tsai CH, Fong YC, Wang SJ, Chang YS, et al. Leptin induces IL-6 expression through OBRl receptor signaling pathway in human synovial fibroblasts. PLoS ONE. 2013;8:e75551. doi: 10.1371/journal.pone.0075551. [DOI] [PMC free article] [PubMed] [Google Scholar]
- Yu CK, Teoh TG, Robinson S. Obesity in pregnancy. Brit J Obstet Gynaec. 2006;113:1117–1125. doi: 10.1111/j.1471-0528.2006.00991.x. [DOI] [PubMed] [Google Scholar]
- Zhang J, Bricker L, Wray S, Quenby S. Poor uterine contractility in obese women. Brit J Obstet Gynaec. 2007;114:343–348. doi: 10.1111/j.1471-0528.2006.01233.x. [DOI] [PubMed] [Google Scholar]
- Zhang Y, Scarpace PJ. The role of leptin in leptin resistance and obesity. Physiol Behav. 2006;88:249–256. doi: 10.1016/j.physbeh.2006.05.038. [DOI] [PubMed] [Google Scholar]
Associated Data
This section collects any data citations, data availability statements, or supplementary materials included in this article.
Supplementary Materials
Figure S1 Representative histograms of cell cycle analysis.
Figure S2 Akt and STAT3 signalling pathways. (A) STAT3 signalling pathway. Cells were stimulated with leptin at 6.25 ng·mL−1 for 0–5 and 10–60 min. Presented blots are representative of four independent experiments. (B) Akt signalling pathway. Cells were cultured with leptin at 6.25 or 50 ng·mL−1 for 0–5 min, 10–60 min and 1–8 h. Presented blots are representative of five independent experiments.
Figure S3 Leptin-induced STAT3 activation at 50 ng·mL−1 is IL-6 receptor dependent. (A,B) Western blots p-STAT3. Cells were cultured with leptin at 50 ng·mL−1 for 6 h in the presence or absence of (A) IL-6 receptor antagonist tocilizumab (1 μg·mL−1) or (B) leptin receptor antagonist SHLA (100 ng·mL−1). Presented blots are representative of four independent experiments. Quantification: 86 kDa bands were digitized and quantified with QuantityOne. Phosphorylated bands are compared with total protein for each condition and represented as mean value ± SEM, n = 4. *P < 0.05 versus lep50 alone. (C) ERK1/2 inhibition. Cells were treated with leptin at 6.25 ng·mL−1 for 24 h in the presence or absence of U0126 (10 μM). U0126 was added 1 h (H-1), 3 h (H+3) or 8 h (H+8) before or after leptin stimulation. Numbers are expressed as percentages versus control (CTL) and represented as mean values ± SEM from four independent experiments. *P < 0.05 versus lep6.25 alone.
Figure S4 NF-κB signalling pathway. Cells were treated with leptin at different concentrations (6.25, 12.5, 25, 50 and 100 ng·mL−1) for 50 min (A), at 25 ng·mL−1 for 0–5 min and 10–60 min (B), at 25 ng·mL−1 for 24 h in the presence or absence of curcumin (1 μM) (D) or at 25 ng·mL−1 for 4 or 50 min in the presence (E) or absence (C) of tocilizumab (1 μg·mL−1) or leptin antagonist SHLA (100 ng·mL−1). (A,B) Western blots p-NF-κB. Presented blots are representative of four independent experiments. Quantification: 65 kD p-NF-κB bands were digitized and quantified with QuantityOne. Phosphorylated bands are compared with total form bands for each condition and represented as mean values ± SEM. **P < 0.01 versus CTL. (C and E) p-NF-κB immunofluorescence: Cells were labelled with anti-P-NF-κB antibody, Alexa fluor 488 and with DAPI for nuclear localization. Five pictures were taken with an epifluorescence microscope (×1000) in random chosen fields for each condition. n = 3. (D) Flow cytometry. Total cell numbers are expressed as percentage versus control (CTL) and represented as mean values ± SEM from four independent experiments. **P < 0.01 versus lep25 alone.
Figure S5 IL-6 secretion. Concentrations of IL-6 (pg·mL−1) in supernatants from myometrial cells stimulated with leptin at 6.25, 25 and 50 ng·mL−1 were measured by elisa. Data are presented as percentage of IL-6 released compared with IL-6 level in supernatant of non-stimulated cells (CTL). Bars represented the mean ± SEM from four independent experiments.
Figure S6 Supplementary methods: Gating strategy for proliferation and cell cycle phase assessment.