Abstract
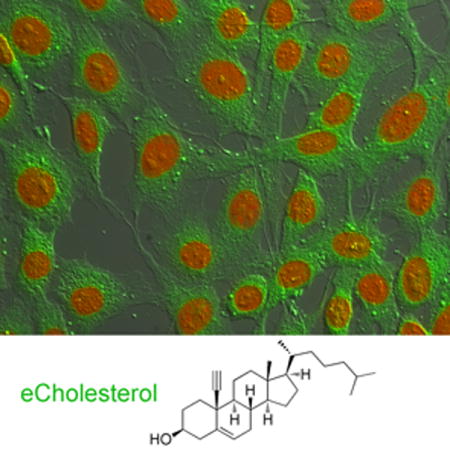
Cholesterol is a fundamental lipid component of eukaryotic membranes and a precursor of potent signaling molecules, such as oxysterols and steroid hormones. Cholesterol and oxysterols are also essential for Hedgehog signaling, a pathway critical in embryogenesis and cancer. Despite their importance, imaging sterols in cells is currently very limited. We introduce a robust and versatile method for sterol microscopy based on C-19 alkyne cholesterol and oxysterol analogs. These sterol analogs are fully functional: they rescue growth of cholesterol auxotrophic cells and faithfully recapitulate the multiple roles that sterols play in Hedgehog signal transduction. Alkyne sterol analogs incorporate efficiently into cellular membranes and can be imaged with high resolution via copper(I)-catalyzed azide-alkyne cycloaddition. We demonstrate the use of alkyne sterol probes for visualizing the subcellular distribution of cholesterol, and for two-color imaging of sterols and choline phospholipids. Our imaging strategy should be broadly applicable to studying the role of sterols in normal physiology and disease.
Keywords: cholesterol, Hedgehog, membranes, click chemistry, microscopy
Graphical abstract
Introduction
Cholesterol (Chol) plays important structural and regulatory functions in eukaryotic membranes[1], and its cellular levels are tightly controlled by complex mechanisms that regulate its synthesis, uptake, distribution and elimination[2]. By modulating the physical properties of phospholipid bilayers and through their interaction with membrane proteins, Chol has a broad impact on a large number of cellular processes. Chol is also a metabolic precursor of oxysterols and steroid hormones, which have potent effects on cell signaling, metabolism and gene expression. Finally, sterols have emerged as playing critical roles in Hedgehog (Hh) signaling, a pathway involved in many aspects of embryonic development, in adult stem cell maintenance and in multiple human cancers[3]. Sterols are important for three essential steps in Hh signaling: 1) Chol is covalently attached to the Hh ligand in the signaling cell[4], a modification critical for proper Hh signaling; defects in Chol attachment to the Hh ligand cause holoprosencephaly, one of the most frequent congenital malformations of the central nervous system[5]; 2) in vertebrates, Chol is required for activation of the seven-spanner membrane protein Smoothened (Smo)[6] and thus for Hh signal transduction in the responding cell[7]; this requirement has been proposed to underlie the defective Hh signaling seen in inborn errors of cholesterol synthesis; and 3) oxysterols bind and activate vertebrate Smo[8], an interaction required for normal Hh signaling[9].
Contrasting the importance of sterols in biology, the methods currently available for their microscopic imaging in cells are few and often suffer from major limitations. One sterol imaging approach uses fluorescent derivatives of Chol in which a fluorophore moiety (such as NBD or BODIPY) replaces part of the isooctyl tail[10] or is attached to the 3β-OH group[11]; these derivatives are problematic because the bulky fluorophores perturb critical structural elements of the Chol molecule. Another approach makes use of Chol analogs with conjugated double bonds, which display intrinsic fluorescence, such as cholestatrienol[12] or dehydroergosterol[13]; these sterols are good Chol mimics but have poor fluorescence characteristics (low extinction coefficient and photostability) and absorb at short wavelengths, where cellular autofluorescence and phototoxicity are high. Alternatively, Chol can be visualized indirectly, using fluorescent polyene macrolide antibiotics that bind Chol, such as filipin and nystatin[14]; this method is prone to artifacts and is limited by the poor fluorescence properties of these molecules (low extinction coefficient, poor photostability, and short excitation wavelengths). These indirect methods for cholesterol detection have been further refined, to improve probe photostability. One strategy employs fluorescent conjugates of theonellamides[15], bicyclic peptides isolated from marine sponges that bind cholesterol.
Another approach for imaging cholesterol uses biotinylated perfringolysin O[16], a secreted bacterial cytolitic protein that binds membranes in a cholesterol-dependent manner. Finally, (25R)-25-ethynyl-26-nor-3β-hydroxycholest-5-en (alkyne cholesterol), a recently described cholesterol analogue[17], can be visualized via copper(I)-catalyzed azide-alkyne cycloaddition (CuAAC)[18] with fluorescent azides. In alkyne cholesterol, an ethynyl group replaces the C-26 methyl in the isooctyl tail; since the tail of cholesterol projects in the interior of the membrane bilayer, it is unclear how a fluorescent azide might gain access to the ethynyl group of a membrane-embedded alkyne cholesterol molecule.
To develop an improved method to image sterols in cells, we first synthesized 19-ethynylcholesterol (eChol), a Chol analog containing an ethynyl group instead of the axial methyl group at the C-19 position of the Chol molecule. EChol can completely replace Chol in supporting the growth of Chol auxotrophic cells, demonstrating that eChol closely mimics the biological properties of Chol. Furthermore, eChol is an efficient substitute for Chol in the Hh pathway, both in processing and Chol modification of the Hh ligand, and in satisfying the Chol requirement for Hh signal transduction at the level of Smo. We extended our alkyne tagging strategy to oxysterols, by synthesizing the 19-ethynyl derivative of 25-hydroxycholesterol (25-OH-eChol), an oxysterol analog that we show recapitulates the potent stimulatory effects of oxysterols on the vertebrate Hh pathway. When added to cells, eChol and 25-OH-eChol partition efficiently into cellular membranes and can be imaged by high-resolution fluorescence microscopy following derivatization with a fluorescent azide via CuAAC. Our strategy for imaging Chol and oxysterols has several advantages over other available techniques, and should facilitate imaging studies of the role of sterols in various cellular processes, under both normal and pathological conditions.
Results and Discussion
To develop a chemical strategy for visualizing Chol in cells, we synthesized the alkyne analog 19-ethynylcholesterol (eChol) (Figure 1A). We chose to introduce the ethynyl group at the C-19 position of the Chol molecule for the following reasons: 1) synthetic accessibility: the C-19 position has been derivatized in many sterols and steroids[19]; 2) steric accessibility: to visualize the Chol analog by CuAAC reaction with fluorescent azides, the alkyne group should not be buried too deep in the membrane bilayer; and 3) to avoid perturbing structural features of the Chol molecule that are known to be critical for biological function, such as the isooctyl tail, the α face, the 3β-hydroxyl and the Δ5(6) double bond[20].
Figure 1. 19-ethynylcholesterol (eChol) is a functional bioorthogonal analog of cholesterol (Chol).
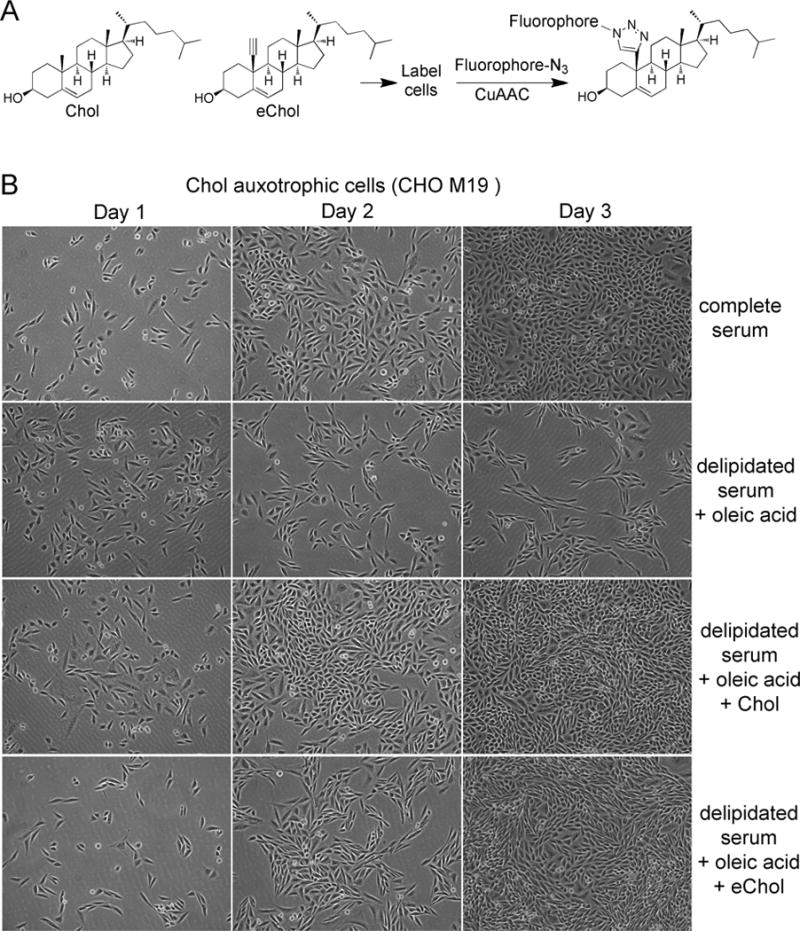
(A) Structures of cholesterol (Chol) and eChol, a Chol analog in which a terminal alkyne group replaces the axial methyl at position C-19 of the sterol molecule. After labeling cells, eChol can be imaged by fluorescence microscopy, following copper(I)-catalyzed azide-alkyne cycloaddition (CuAAC) with fluorescein-azide.
(B) Chol auxotrophic M19 CHO cells were grown for 4 days in media containing delipidated serum supplemented with oleic acid (35 μM), and in the presence or absence of Chol (10 μM) or eChol (35 μM), added as soluble methyl β-cyclodextrin (MCD) complexes. Representative fields of cells were photographed on days 1, 2 and 3 after plating. M19 CHO cells cannot proliferate in the absence of sterols; proliferation is completely rescued by eChol or Chol.
We first asked if eChol retains the biological properties of Chol in a stringent functional assay. M19 CHO cells are defective in Chol biosynthesis and require exogenous Chol for growth and proliferation[21]. Both Chol and eChol completely rescued the proliferation of M19 CHO cells grown in delipidated media (Figure 1B); this indicates that eChol mimics well the function of Chol in cells. We determined that a 2-hour labeling pulse with eChol (12.5 μM) results in a cellular concentration of eChol that is 27% that of endogenous Chol (Supplementary figure 1A); thus significant amounts of eChol can be rapidly delivered to cells.
We next asked if eChol is able to substitute for Chol in the Hh signaling pathway. Hh signaling is initiated by the secreted Hh ligand, which is synthesized as a precursor that undergoes Chol-dependent self-cleavage, resulting in an N-terminal fragment covalently attached to Chol (the Hh ligand) and a C-terminal fragment[4]. Chol modification of the Hh ligand is critical for normal Hh signaling[5]. In an in vitro Chol-modification reaction using purified Hh precursor, eChol supported Hh self-cleavage as efficiently as Chol (Supplementary figure 1B), generating an eChol-modified N-terminal fragment, which could be specifically detected by CuAAC with biotin-azide followed by anti-biotin blotting (Supplementary figure 1C). When cells expressing human Sonic hedgehog (hShh) are depleted of sterols, Chol-dependent self-cleavage is inhibited[22]; this inhibition is completely reversed by eChol and Chol, but not by epicholesterol (Supplementary figure 1D). These results show that eChol is an efficient Chol substitute in the Hh modification reaction both in vitro and in vivo.
Sterols are required for the activation of the seven-spanner membrane protein Smoothened (Smo), which, in turn, is required for Hh signal transduction[7]. When Hh-responsive cells are depleted of sterols, Hh signaling is blocked; this inhibition is reversed in a dose-dependent manner by added back Chol and eChol, but not by epicholesterol (Figure 2A). Interestingly, eChol rescues Hh signaling at significantly lower concentration than Chol (Figure 2A and experiments below); we speculate that the increased biological activity of eChol is due to increased solubility, which perhaps allows for more efficient delivery to cells. Hh stimulation leads to rapid recruitment of Smo to the primary cilium[23], a critical step in Smo activation. In sterol-depleted cells, Smo fails to be recruited to cilia in response to Hh stimulation (Figure 2B), which provides a sufficient explanation for why sterols are required for Hh signal transduction. Importantly, signal-dependent recruitment of Smo to cilia is rescued in sterol-depleted cells by addition of Chol and eChol, but not epicholesterol (Figure 2B–D). Thus eChol can completely replace Chol, to support signal-dependent recruitment of Smo to primary cilia and Hh signal transduction.
Figure 2. EChol supports efficient Hedgehog (Hh) signal transduction.
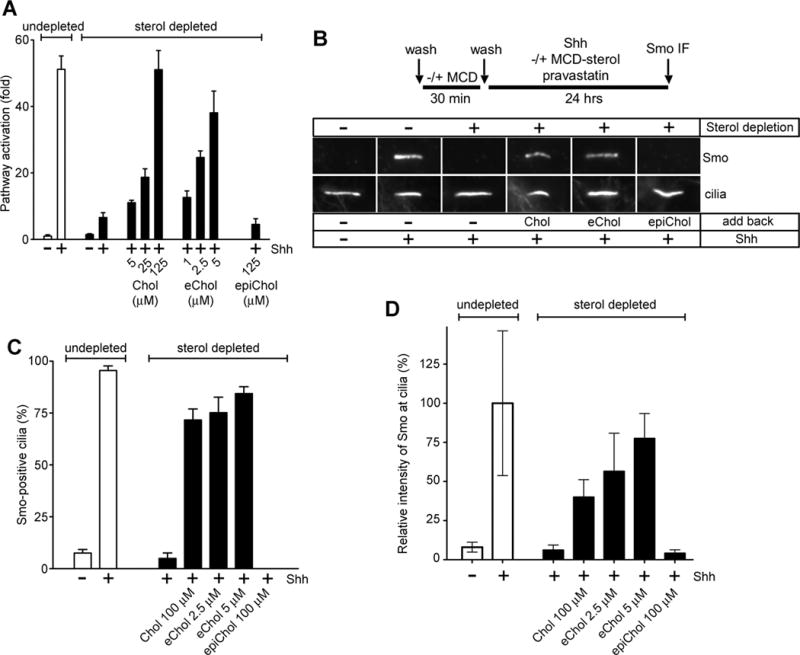
(A) Hh-responsive NIH-3T3 Shh-LightII cells[31] were sterol-depleted with MCD, followed by sterol add-back for 1 hour as sterol-MCD complexes. The cells were then incubated overnight with Shh and pravastatin (20 μM), followed by luciferase reporter assays. Relative luciferase counts were normalized to those of the undepleted and unstimulated cells. Error bars represent the standard deviation of the mean for 4 independent experiments. Hh pathway activity is inhibited by sterol depletion, which can be reversed in a dose-dependent manner by Chol or eChol, but not the diastereomer, epicholesterol.
(B) NIH-3T3 cells were depleted of sterols as in (A), and were incubated overnight with Shh and pravastatin (20 μM), in the absence or presence of MCD complexes of Chol, epicholesterol or eChol. Undepleted cells, stimulated or not with Shh, were used as controls. The cells were processed for immunofluorescence for Smoothened (Smo) and acetylated tubulin (primary cilia marker). Representative micrographs of Smo localization to cilia are shown. Sterol depletion blocks recruitment of Smo to cilia in response to Shh stimulation; this effect is reversed by Chol and eChol, but not by epicholesterol.
(C) Quantification of Smo-positive cilia for the experiment in (B). Error bars represent the standard deviation of the mean for 3 groups of at least 50 cilia each, scored visually for the presence or absence of Smo.
(D) Quantification of Smo fluorescence intensity at primary cilia for the experiment in (B), normalized to the fluorescence of Smo in cilia of undepleted, Shh-stimulated cells. Error bars represent the standard deviation of the mean relative Smo intensity (n>100 cilia per condition).
We next developed a method for imaging eChol in cells by CuAAC with a fluorescent azide. Surprisingly, several fluorescent azides (Supplementary figure 2) that strongly stain cells labeled with other alkyne probes (such as 5-ethynyl-2′-deoxyuridine which incorporates into DNA[24] or propargylcholine which incorporates into phospholipids[25]) failed to stain eChol-labeled cells. We found, however, that fluorescein-azide and tetramethylrhodamine-picolyl azide (TMR-picolyl azide, Supplementary figure 2) allow for robust and specific staining of eChol incorporated into cellular membranes (Figures 3A and 3B). Although we do not understand the basis for this differential reactivity, perhaps fluorescein-azide and TMR-picolyl azide, by virtue of their increased hydrophobicity, can access the ethynyl group of membrane-embedded eChol, while more the hydrophilic azides cannot. This interpretation is supported by the fact that azides that fail to stain eChol embedded in cellular membranes, readily react with eChol covalently attached to the Hh ligand (Supplementary figures 1C and 2).
Figure 3. Using eChol as an imaging probe for microscopic detection of Chol in cells.
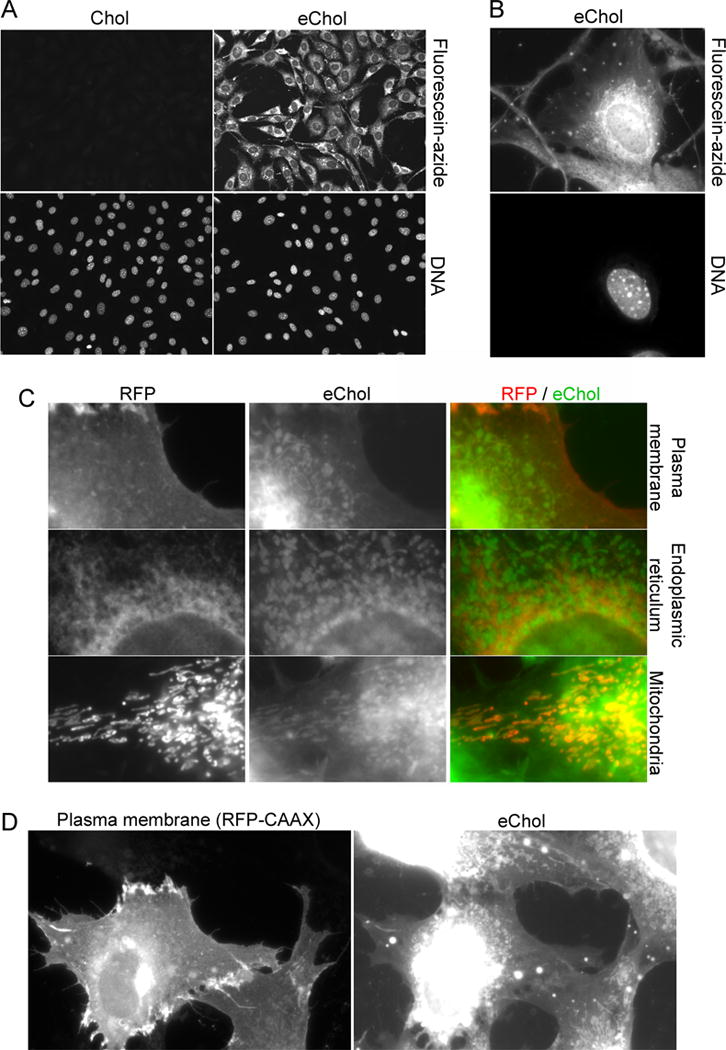
(A) NIH-3T3 cells incubated for 12 hours with or without eChol (20 μM from DMSO stock), were stained by CuAAC with fluorescein-azide and by Hoechst, and were then imaged by fluorescence microscopy. The eChol staining pattern is characteristic of incorporation into various cellular membranes.
(B) Higher magnification view of a cell labeled with eChol and stained with fluorescein-azide.
(C) Subcellular distribution of eChol. NIH-3T3 cells were transiently transfected with plasmids expressing red fluorescent protein (RFP) fusions targeted to various cellular membranes: plasma membrane (pmCherry-CAAX plasmid), endoplasmic reticulum (ER) (pmCherry-Sec61β plasmid) and mitochondria (pDsRed-Mito plasmid). The cells were then labeled with eChol and stained with fluorescein-azide as in (A). Left panels: RFP images; middle panels: eChol images; right panels: overlay of RFP (red) and eChol (green). EChol appears enriched in mitochondria relative to the ER (compare bottom and middle panels), consistent with the low levels of Chol normally found in ER. EChol also co-localizes with the plasma membrane marker (top panels).
(D) As in (C), but showing a high magnification view of eChol co-localization with the plasma membrane marker, mCherry-CAAX. Left panel: mCherry-CAAX image; right panel: eChol image. The two cells at the bottom of the micrographs express mCherry-CAAX, while the two top cells do not.
EChol staining is intense and uniform among cells, and its pattern is characteristic of Chol incorporation into cellular membranes (Figures 3A and 3B), including the plasma membrane and a large number of intracellular structures, both punctate and elongated in shape. Importantly, the eChol stain is excluded from inside the nucleus, which is devoid of membranes. EChol staining is sensitive to detergents (Supplementary figure 3), consistent with a non-covalent interaction between eChol and the membrane bilayer.
We examined in more detail the subcellular distribution of eChol, by co-localizing the eChol stain with red fluorescent protein (RFP) fusions that mark specific cellular membranes or organelles. Cultured cells were transiently transfected with plasmids encoding RFP fusions targeted to the plasma membrane, endoplasmic reticulum (ER) or mitochondria, and were then labeled with eChol, followed by staining with fluorescein-azide (Figure 3C). The highest eChol levels are found in mitochondria, with significantly lower eChol localization to the ER (compare bottom and middle panels in Figure 3C), consistent with the low levels of Chol normally found in ER membranes[26]. EChol also localizes to the plasma membrane (Figures 3C and 3D). Since cells maintain Chol at different levels in different cellular membranes, eChol will be a useful tool for imaging the subcellular distribution of Chol.
In some experiments, it would be desirable to image simultaneously both Chol and another lipid component of membranes. We exploited the differential reactivity of eChol towards fluorescent azides, to image the subcellular distribution of eChol and choline phospholipids, the most abundant lipids in cellular membranes (Figure 4). Choline phospholipids were metabolically labeled with propargylcholine (PCho), and were detected by CuAAC with a fluorescent azide (Alexa568-azide) that does not react with eChol in membranes, followed by detection of eChol with fluorescein-azide. The bioorthogonal detection of choline phospholipids and eChol is sensitive and specific, allowing imaging by high-resolution fluorescence microscopy of both these lipids in membranes. Thus successive use of the CuAAC reaction with different fluorescent azides can accomplish two-color imaging of two alkyne-tagged lipids in cells.
Figure 4. Double labeling and two-color imaging of Chol and phospholipids in cells.
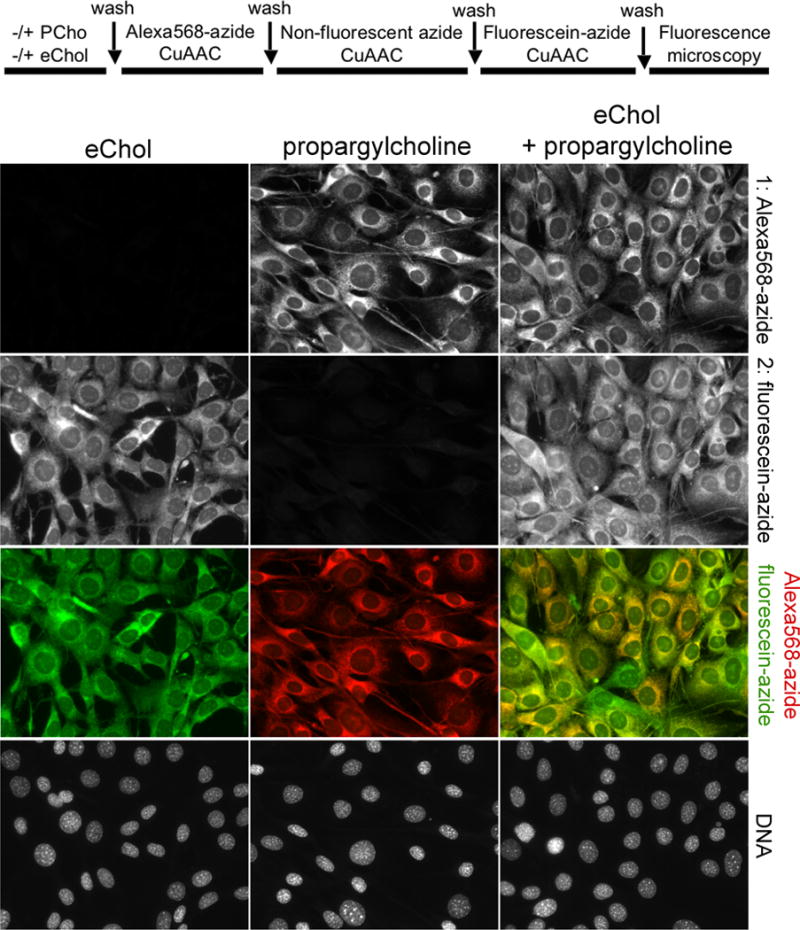
IH-3T3 cells were incubated overnight with propargylcholine (PCho, 100 μM), to label choline phospholipids, after which they were incubated overnight in the absence or presence of eChol (40 μM from DMSO stock). EChol in cellular membranes reacts with fluorescein-azide but not with Alexa568-azide (Supplementary figure 2); this differential reactivity was used to achieve two-color imaging of eChol and PCho-labeled phospholipids. The labeled cells were first stained with Alexa568-azide (to detect PCho), after which the unreacted PCho phospholipids were consumed by reaction with excess non-fluorescent azide. Finally, the cells were stained with fluorescein-azide (to detect eChol). Top row: PCho-labeled phospholipids; second row: eChol; third row: overlay of PCho (red) and eChol (green) images; bottom row: Hoechst staining of cell nuclei.
Since alkyne tagging the C-19 position proved a good choice for preserving the biological function of Chol, we extended this approach to oxysterols, a class of oxygenated Chol derivatives whose potent biological effects are still poorly understood. We focused on 25-hydroxycholesterol (25-OHC, figure 5A), as it is one of the most abundant oxysterols in vivo, and has been implicated in numerous biological processes[27]. We synthesized the alkyne analog 19-ethynyl-25-hydroxycholesterol (25-OH-eChol, figure 5A). Gratifyingly, 25-OH-eChol retains the potent stimulatory effect of oxysterols on the Hh pathway, as assayed by recruitment of Smo to primary cilia (Figure 5B), by activation of an Hh-responsive luciferase reporter (Figure 5C), and by transcription of endogenous target genes (Figure 5D). Importantly, Hh activation by 25-OH-eChol was blocked by the small molecule Smo inhibitor, SANT1 (Supplementary figure 4), indicating that 25-OH-eChol acts at the level of Smo, as expected for Hh-activating oxysterols[28]. Interestingly, 25-OH-eChol appears slightly more potent than 25-OHC (Figure 5D), similar to the higher biological activity of eChol compared to Chol (see above, Figure 2), perhaps due to increased solubility. Finally, using the CuAAC protocol developed for eChol allowed robust imaging of 25-OH-eChol in cells, revealing its localization to various cellular membranes (Figures 5E and 5F); thus 25-OH-eChol will be a useful probe for imaging 25-OHC distribution in cells and organelles, with high sensitivity and spatial resolution.
Figure 5. A bioorthogonal oxysterol probe.
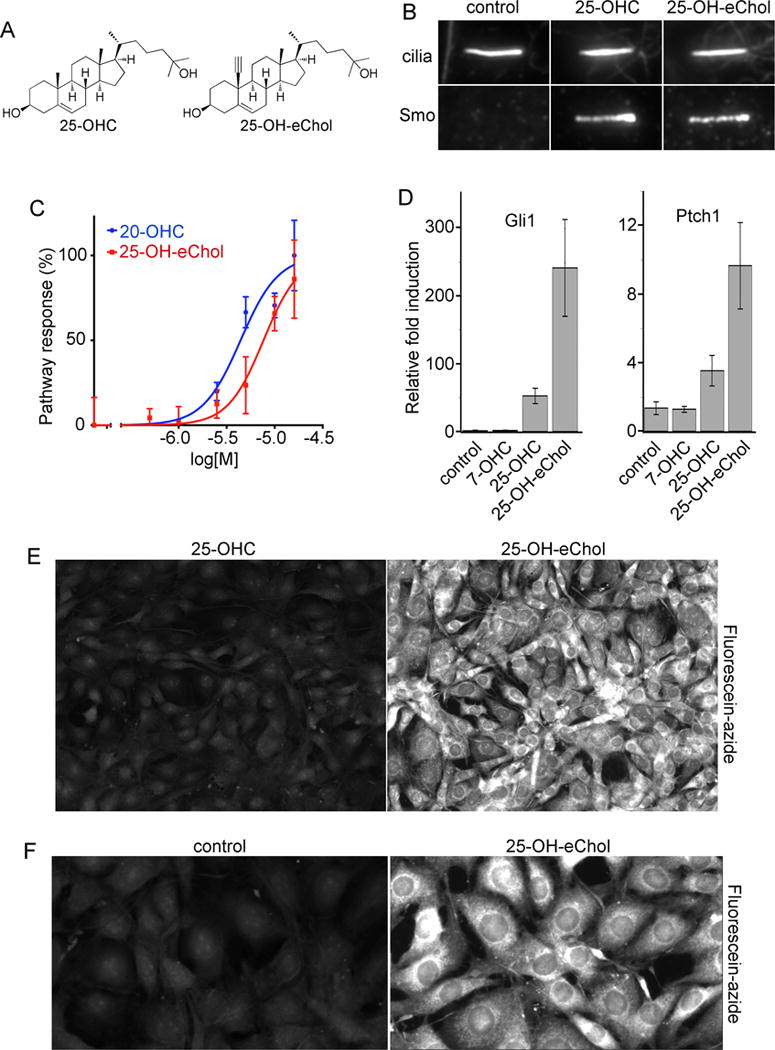
(A) Structure of the oxysterol, 25-hydroxycholesterol (25-OHC) and of the alkyne 25-OHC analog, 19-ethynyl-25-hydroxycholesterol (25-OH-eChol).
(B) NIH-3T3 cells were treated overnight with 25-OHC or 25-OH-eChol (each at 10 μM), and localization of endogenous Smo to primary cilia was determined by immunofluorescence. Primary cilia were labeled with antibodies against acetylated tubulin. Both 25-OHC and 25-OH-eChol cause Smo to accumulate at cilia, a hallmark of Hh pathway activation.
(C) Hh-responsive Shh-LightII cells were treated with varying concentrations of 25-OH-eChol or 20(S)-hydroxycholesterol (20-OHC, the most potent Hh-activating oxysterol), and activation of the Hh pathway was measured by luciferase assay. Error bars represent standard deviation (n=4 independent experiments). 25-OH-eChol activates Hh signaling, with an EC50 comparable to that of 20-OHC.
(D) Confluent cultures of NIH-3T3 cells were incubated overnight in serum-free media, in the absence or presence of the indicated oxysterols (10 μM each), and transcription of Gli1 and Ptch1, two targets of the Hh pathway, was measured by quantitative RT-PCR (qPCR). Error bars show standard deviation (n=3 independent experiments). The oxysterol, 7-hydroxycholesterol (7-OHC), is inactive in Hh signaling and was used as negative control. 25-OH-eChol potently activates transcription of Hh target genes.
(E) NIH-3T3 cells were incubated for 12 hours with 25-OHC or 25-OH-eChol (10 μM each), and were then stained with fluorescein-azide via CuAAC, followed by imaging by fluorescence microscopy. Cells labeled with 25-OH-eChol show strong, specific staining.
(F) As in (E), but showing a higher magnification image. 25-OH-eChol shows a staining pattern indicative of its broad distribution in cellular membranes.
Experimental Section
NIH-3T3 cells were labeled by incubation with eChol (added from stocks in DMSO, or as soluble MCD complexes) or 25-OH-eChol (added from stocks in DMSO) in DMEM. The cells were fixed with 3.7% formaldehyde in PBS, washed with Tris-buffered saline (TBS, 10 mM Tris-HCl, 150 mM NaCl, pH 7.5), reacted by CuAAC with fluorescein-azide (10 μM), as described[24], and then washed several times with NaCl (0.5 M) and TBS (to remove the unreacted azide). Cells were imaged by epi-fluorescence microscopy on a Nikon TE2000U microscope equipped with an OrcaER digital camera (Hammamatsu), and 20× PlanApo 0.75NA, 40× PlanApo 0.95NA or 100× PlanApo 1.4NA objectives (Nikon). For imaging subcellular localization of eChol, cells were transiently transfected using polyethyleneimine with plasmids encoding red fluorescent protein fusions targeted to mitochondria (pDsRed-Mito plasmid from Clontech Laboratories Inc), the endoplasmic reticulum (pmCherry-Sec61β, plasmid #49155 from Addgene), or the plasma membrane (pmCherry-CAAX plasmid[29]). After transfection, the cells were labeled with eChol, and stained and imaged as described above.
For double labeling experiments, cells were first labeled overnight with propargylcholine (PCho, 100 μM), and then overnight with eChol (40 μM, added from DMSO stock). The cells were stained first by CuAAC with Alexa568-azide (10 μM), to detect PCho-labeled phospholipids[25]. The PCho-labeled phospholipids left unreacted after reaction with Alexa568-azide were consumed by performing a subsequent CuAAC reaction with O-(2-aminoethyl)-O′-(2-azidoethyl)-pentaethylene glycol (5 mM), as described[25]. The cells were then washed and reacted with fluorescein-azide (10 μM), to detect eChol.
To test if eChol rescues proliferation of Chol auxotrophic CHO M19 cells, the cells were grown for 4 days in media supplemented with 10% delipidated serum and oleic acid (35 μM), in the absence or presence of eChol (10 μM) or Chol (35 μM), both added as soluble MCD complexes. Representative fields of cells were photographed at 24-hour intervals on days 1, 2, and 3 after plating, by phase contrast microscopy.
To deplete sterols from NIH-3T3 cells, cultures were starved overnight and were then incubated with MCD in DMEM (1% w/v) for 30 minutes. For rescue experiments, sterols were added back as sterol-MCD complexes in DMEM supplemented with pravastatin (20 μM). To assay the effect of sterol depletion on Hh stimulation, the Hh ligand was added to the depleted cells in DMEM with pravastatin, with or without sterol-MCD complexes. Undepleted cells, stimulated or not with Hh ligand served as positive and negative controls. The cells were processed for Smo immunofluorescence or for luciferase assays, as described above.
Activity assays for Hh signaling were performed in NIH-3T3 cells. Confluent cell cultures were starved for 24 hours in media without serum, and were then stimulated with Hh ligand. After the desired amount of time, the cultures were analyzed by either immunofluorescence (to assay recruitment of Smo to primary cilia), by luciferase reporter assays, or by quantitative PCR (qPCR) (to measure the transcriptional output of the Hh pathway).
Smo immunofluorescence was performed using rabbit anti-Smo antibodies, as described[30]. Primary cilia were stained with a mouse anti-acetylated tubulin monoclonal antibody (Sigma). For each condition, the presence or absence of Smo at cilia was scored visually for 150 cilia. Error bars represent the standard deviation of the mean for groups of 50 cilia counted on different visual fields, on the same coverslip. All experiments showing ciliary counts were repeated independently at least three times. To measure Smo fluorescence intensity, the primary cilium was outlined using acetylated tubulin images, and the integrated ciliary intensity for Smo was measured using Metamorph software (Applied Precision).
Luciferase reporter assays were performed in NIH-3T3 Shh-LightII cells, which express firefly luciferase under the control of an artificial Hh-responsive promoter and Renilla luciferase under the control of a constitutive promoter, as described[31]. The activity of the Hh pathway was calculated as the ratio between firefly and Renilla luciferase activities, after background subtraction. Error bars represent standard deviation of the mean for 4 independent experiments.
Hh-stimulated transcription of the target genes, Gli1 and Ptch1, was measured by qPCR in NIH-3T3 cells, as described[32]. Each qPCR experiment was performed in triplicate starting from three biological samples, and error bars represent standard deviation.
Supplementary Material
Acknowledgments
We thank T.Y. Chang (Dartmouth) for M19 CHO cells and Carlos Gartner for advice on sterol chemistry. CYJ was supported by an NSF fellowship. This work was supported in part by NIH grants RO1 GM092924 and GM110041.
Footnotes
Supporting Information
The Supporting information file includes detailed experimental procedures, synthetic methods, chemical compound information, and supplementary results. Supplementary figure S1 shows experiments that demonstrate that eChol is an efficient substitute in the Chol modification reaction of the Hh ligand, both in vitro and in cells. Supplementary figure S2 shows the chemical structures of the various azides used for eChol detection. Supplementary figure S3 shows an experiment that demonstrates detergent sensitivity of the cellular eChol stain. Supplementary figure S4 shows that 25-OH-eChol activates Hh signaling at the level of Smo.
The authors declare no competing financial interest.
References
- 1.Maxfield FR, van Meer G. Curr Opin Cell Biol. 2011;22:422–429. doi: 10.1016/j.ceb.2010.05.004. [DOI] [PMC free article] [PubMed] [Google Scholar]
- 2.a Chang TY, Chang CC, Ohgami N, Yamauchi Y. Annu Rev Cell Dev Biol. 2006 doi: 10.1146/annurev.cellbio.22.010305.104656. [DOI] [PubMed] [Google Scholar]; b Mesmin B, Maxfield FR. Biochimica et biophysica acta. 2009 doi: 10.1016/j.bbalip.2009.03.002. [DOI] [PMC free article] [PubMed] [Google Scholar]; c Goldstein JL, DeBose-Boyd RA, Brown MS. Cell. 2006;124:35–46. doi: 10.1016/j.cell.2005.12.022. [DOI] [PubMed] [Google Scholar]
- 3.a Taipale J, Beachy PA. Nature. 2001;411:349–354. doi: 10.1038/35077219. [DOI] [PubMed] [Google Scholar]; b Cohen MM., Jr American journal of medical genetics Part A. 2003;123:5–28. doi: 10.1002/ajmg.a.20495. [DOI] [PubMed] [Google Scholar]; c Lum L, Beachy PA. Science. 2004;304:1755–1759. doi: 10.1126/science.1098020. [DOI] [PubMed] [Google Scholar]
- 4.Porter JA, Young KE, Beachy PA. Science. 1996;274:255–259. doi: 10.1126/science.274.5285.255. [DOI] [PubMed] [Google Scholar]
- 5.a Maity T, Fuse N, Beachy PA. Proceedings of the National Academy of Sciences of the United States of America. 2005;102:17026–17031. doi: 10.1073/pnas.0507848102. [DOI] [PMC free article] [PubMed] [Google Scholar]; b Roessler E, El-Jaick KB, Dubourg C, Velez JI, Solomon BD, Pineda-Alvarez DE, Lacbawan F, Zhou N, Ouspenskaia M, Paulussen A, Smeets HJ, Hehr U, Bendavid C, Bale S, Odent S, David V, Muenke M. Human mutation. 2009;30:E921–935. doi: 10.1002/humu.21090. [DOI] [PMC free article] [PubMed] [Google Scholar]
- 6.a Alcedo J, Ayzenzon M, Von Ohlen T, Noll M, Hooper JE. Cell. 1996;86:221–232. doi: 10.1016/s0092-8674(00)80094-x. [DOI] [PubMed] [Google Scholar]; b van den Heuvel M, Ingham PW. Nature. 1996;382:547–551. doi: 10.1038/382547a0. [DOI] [PubMed] [Google Scholar]
- 7.Cooper MK, Wassif CA, Krakowiak PA, Taipale J, Gong R, Kelley RI, Porter FD, Beachy PA. Nat Genet. 2003;33:508–513. doi: 10.1038/ng1134. [DOI] [PubMed] [Google Scholar]
- 8.Nachtergaele S, Mydock LK, Krishnan K, Rammohan J, Schlesinger PH, Covey DF, Rohatgi R. Nature chemical biology. 2012;8:211–220. doi: 10.1038/nchembio.765. [DOI] [PMC free article] [PubMed] [Google Scholar]
- 9.a Nedelcu D, Liu J, Xu Y, Jao C, Salic A. Nature chemical biology. 2013;9:557–564. doi: 10.1038/nchembio.1290. [DOI] [PMC free article] [PubMed] [Google Scholar]; b Nachtergaele S, Whalen DM, Mydock LK, Zhao Z, Malinauskas T, Krishnan K, Ingham PW, Covey DF, Siebold C, Rohatgi R. eLife. 2013;2:e01340. doi: 10.7554/eLife.01340. [DOI] [PMC free article] [PubMed] [Google Scholar]; c Myers BR, Sever N, Chong YC, Kim J, Belani JD, Rychnovsky S, Bazan JF, Beachy PA. Developmental cell. 2013;26:346–357. doi: 10.1016/j.devcel.2013.07.015. [DOI] [PMC free article] [PubMed] [Google Scholar]
- 10.Chattopadhyay A, London E. Biochim Biophys Acta. 1988;938:24–34. doi: 10.1016/0005-2736(88)90118-6. [DOI] [PubMed] [Google Scholar]
- 11.Alecio MR, Golan DE, Veatch WR, Rando RR. Proc Natl Acad Sci U S A. 1982;79:5171–5174. doi: 10.1073/pnas.79.17.5171. [DOI] [PMC free article] [PubMed] [Google Scholar]
- 12.Mondal M, Mesmin B, Mukherjee S, Maxfield FR. Molecular biology of the cell. 2009;20:581–588. doi: 10.1091/mbc.E08-07-0785. [DOI] [PMC free article] [PubMed] [Google Scholar]
- 13.a Mukherjee S, Zha X, Tabas I, Maxfield FR. Biophysical journal. 1998;75:1915–1925. doi: 10.1016/S0006-3495(98)77632-5. [DOI] [PMC free article] [PubMed] [Google Scholar]; b McIntosh AL, Atshaves BP, Huang H, Gallegos AM, Kier AB, Schroeder F. Lipids. 2008;43:1185–1208. doi: 10.1007/s11745-008-3194-1. [DOI] [PMC free article] [PubMed] [Google Scholar]; c Wustner D. Chemistry and physics of lipids. 2007;146:1–25. doi: 10.1016/j.chemphyslip.2006.12.004. [DOI] [PubMed] [Google Scholar]
- 14.a Beknke O, Tranum-Jensen J, van Deurs B. Eur J Cell Biol. 1984;35:189–199. [PubMed] [Google Scholar]; b Behnke O, Tranum-Jensen J, van Deurs B. Eur J Cell Biol. 1984;35:200–215. [PubMed] [Google Scholar]
- 15.Nishimura S, Ishii K, Iwamoto K, Arita Y, Matsunaga S, Ohno-Iwashita Y, Sato SB, Kakeya H, Kobayashi T, Yoshida M. PloS one. 2013;8:e83716. doi: 10.1371/journal.pone.0083716. [DOI] [PMC free article] [PubMed] [Google Scholar]
- 16.Iwamoto M, Morita I, Fukuda M, Murota S, Ando S, Ohno-Iwashita Y. Biochimica et biophysica acta. 1997;1327:222–230. doi: 10.1016/s0005-2736(97)00061-8. [DOI] [PubMed] [Google Scholar]
- 17.Hofmann K, Thiele C, Schott HF, Gaebler A, Schoene M, Kiver Y, Friedrichs S, Lutjohann D, Kuerschner L. Journal of lipid research. 2014;55:583–591. doi: 10.1194/jlr.D044727. [DOI] [PMC free article] [PubMed] [Google Scholar]
- 18.a Tornoe CW, Christensen C, Meldal M. The Journal of organic chemistry. 2002;67:3057–3064. doi: 10.1021/jo011148j. [DOI] [PubMed] [Google Scholar]; b Rostovtsev VV, Green LG, Fokin VV, Sharpless KB. Angew Chem Int Ed Engl. 2002;41:2596–2599. doi: 10.1002/1521-3773(20020715)41:14<2596::AID-ANIE2596>3.0.CO;2-4. [DOI] [PubMed] [Google Scholar]
- 19.a Kalvoda J, Anner G. Helv Chim Acta. 1967;50:269–281. doi: 10.1002/hlca.19670500134. [DOI] [PubMed] [Google Scholar]; b Mathai MS, Pascal RA., Jr Steroids. 1994;59:244–247. doi: 10.1016/0039-128x(94)90108-2. [DOI] [PubMed] [Google Scholar]
- 20.Bloch K. Steroids. 1989;53:261–270. doi: 10.1016/0039-128x(89)90014-7. [DOI] [PubMed] [Google Scholar]
- 21.Limanek JS, Chin J, Chang TY. Proceedings of the National Academy of Sciences of the United States of America. 1978;75:5452–5456. doi: 10.1073/pnas.75.11.5452. [DOI] [PMC free article] [PubMed] [Google Scholar]
- 22.Guy RK. Proceedings of the National Academy of Sciences of the United States of America. 2000;97:7307–7312. doi: 10.1073/pnas.97.13.7307. [DOI] [PMC free article] [PubMed] [Google Scholar]
- 23.a Corbit KC, Aanstad P, Singla V, Norman AR, Stainier DY, Reiter JF. Nature. 2005;437:1018–1021. doi: 10.1038/nature04117. [DOI] [PubMed] [Google Scholar]; b Rohatgi R, Milenkovic L, Scott MP. Science. 2007;317:372–376. doi: 10.1126/science.1139740. [DOI] [PubMed] [Google Scholar]
- 24.Salic A, Mitchison TJ. Proceedings of the National Academy of Sciences of the United States of America. 2008;105:2415–2420. doi: 10.1073/pnas.0712168105. [DOI] [PMC free article] [PubMed] [Google Scholar]
- 25.Jao CY, Roth M, Welti R, Salic A. Proceedings of the National Academy of Sciences of the United States of America. 2009;106:15332–15337. doi: 10.1073/pnas.0907864106. [DOI] [PMC free article] [PubMed] [Google Scholar]
- 26.Radhakrishnan A, Goldstein JL, McDonald JG, Brown MS. Cell Metab. 2008;8:512–521. doi: 10.1016/j.cmet.2008.10.008. [DOI] [PMC free article] [PubMed] [Google Scholar]
- 27.Diczfalusy U. Biochimie. 2013;95:455–460. doi: 10.1016/j.biochi.2012.06.016. [DOI] [PubMed] [Google Scholar]
- 28.a Corcoran RB, Scott MP. Proceedings of the National Academy of Sciences of the United States of America. 2006;103:8408–8413. doi: 10.1073/pnas.0602852103. [DOI] [PMC free article] [PubMed] [Google Scholar]; b Dwyer JR, Sever N, Carlson M, Nelson SF, Beachy PA, Parhami F. The Journal of biological chemistry. 2007;282:8959–8968. doi: 10.1074/jbc.M611741200. [DOI] [PubMed] [Google Scholar]
- 29.Lu L, Ladinsky MS, Kirchhausen T. The Journal of cell biology. 2011;194:425–440. doi: 10.1083/jcb.201012063. [DOI] [PMC free article] [PubMed] [Google Scholar]
- 30.Tukachinsky H, Lopez L, Salic A. J Cell Biol. 2010;191 doi: 10.1083/jcb.201004108. [DOI] [PMC free article] [PubMed] [Google Scholar]
- 31.Taipale J, Chen JK, Cooper MK, Wang B, Mann RK, Milenkovic L, Scott MP, Beachy PA. Nature. 2000;406:1005–1009. doi: 10.1038/35023008. [DOI] [PubMed] [Google Scholar]
- 32.Tukachinsky H, Lopez LV, Salic A. The Journal of cell biology. 2010;191:415–428. doi: 10.1083/jcb.201004108. [DOI] [PMC free article] [PubMed] [Google Scholar]
Associated Data
This section collects any data citations, data availability statements, or supplementary materials included in this article.


