Abstract
Circulating cell-free DNA (cfDNA) has become a promising biomarker in prenatal diagnosis. However, despite extensive studies in different body fluids, cfDNA predictive value is uncertain owing to the confounding factors that can affect its levels, such as gestational age, maternal weight, smoking status, and medications. Residual fresh and archived amniotic fluid (AF) supernatants were obtained from gravid women (mean gestational age 17 wk) carrying euploid (N = 36) and aneuploid (N = 29) fetuses, to characterize cfDNA-fragmentation patterns with regard to aneuploidy and storage time (−80°C). AF cfDNA was characterized by the real-time quantitative polymerase chain reaction amplification of glyceraldehyde-3-phosphate dehydrogenase, gel electrophoresis, and pattern recognition of the DNA fragmentation. The distributions of cfDNA fragment lengths were compared using 6 measures that defined the locations and slopes for the first and last peaks, after elimination of the confounding variables. This method allowed for the unique classification of euploid and aneuploid cfDNA samples in AF, which had been matched for storage time. In addition, we showed that archived euploid AF samples gradually lose long cfDNA fragments: this loss accurately distinguishes them from the fresh samples. We present preliminary data using cfDNA-fragmentation patterns, to uniquely distinguish between AF samples of pregnant women with regard to aneuploidy and storage time, independent of gestational age and initial DNA amount. In addition to potential applications in prenatal diagnosis, these data suggest that archived AF samples consist of large amounts of short cfDNA fragments, which are undetectable using standard real-time polymerase chain reaction amplification.
Keywords: cell-free DNA, DNA fragmentation, storage, karyotype
During the last decade, circulating cell-free DNA (cfDNA) has become a promising biomarker. Elevated levels of cfDNA are a hallmark of different pathologies including inflammation,1 cardiac failure,2 autoimmune diseases,3 and cancer,4 as well as trauma and stroke (reviewed in Ref. 5). CfDNA is also potentially useful for prenatal diagnosis, as it is identifiable in the serum, plasma, urine, and amniotic fluid (AF) of pregnant women.6–8
Despite the extensive study of cfDNA in different body fluids, there is an urgent need for standardized methods that can make cfDNA quantification a routine biochemical laboratory tool. Moreover, the predictive value of this biomarker is uncertain, owing to potential factors that can reportedly affect cfDNA levels, including storage time.9,10
In this paper, using the AF of gravid women, we present a rapid and inexpensive technique that uses data on the distribution of lengths of DNA fragments. This technique can be used to characterize the effect of storage time and to uniquely classify samples by aneuploidy, independent of potential confounding factors. This tool can help shed light on underlying mechanisms associated with DNA degradation under normal and pathologic conditions and can be applied to various areas of research.
MATERIALS AND METHODS
Study Samples
Residual AF supernatant, taken for clinical indications, was obtained from 65 gravid women (mean gestational age, 17 wk; range: 15 to 34 wk) carrying fetuses with euploidy (N = 36), Turner syndrome (N = 4), triploidy (N = 4), trisomy 13 (N = 3), trisomy 18 (N = 8), and trisomy 21 (N = 10) (Table 1). Ten samples were processed fresh, whereas the other samples were kept frozen at −80°C for various periods of time ranging from 1 to 79 months. Among the euploid samples, 8 were fresh, 8 had been stored for 4 to 6 months, 6 had been stored for 11 to 12 months, 8 had been stored for 17 to 20 months, and 6 had been stored for 59 to 79 months. Approval for this study was obtained from the institutional review boards of Tufts-New England Medical Center, Boston, MA and of Women and Infants Hospital, Providence, RI.
TABLE 1.
Sample Size by Ploidy and Storage Time
| Samples/Storage Time | 0 mo (Fresh) | 1–6 mo | 7–12 mo | >12 mo |
|---|---|---|---|---|
| Euploidy | 8 | 8 | 6 | 14 |
| Aneuploidy | ||||
| Monosomy | 2 | — | 1 | — |
| Triploidy | — | 1 | 2 | 1 |
| Trisomy 13 | — | 3 | — | — |
| Trisomy 18 | — | 1 | 3 | 3 |
| Trisomy 21 | — | 5 | 2 | 3 |
DNA Extraction From AF
DNA was processed as described elsewhere.10 Briefly, DNA extraction was performed with the QIAamp DNA Maxi Kit (Qiagen, Valencia, CA), using 40 mL of AVL buffer (Qiagen), supplemented with nucleic acid carrier, and 40 mL of 100% ethanol, as previously described.11 Storage time was estimated in months. Amplification of the glyceraldehyde-3-phosphate dehydrogenase (GAPDH) locus, an autosomal, single-copy gene that is the default sequence for estimating total DNA, was performed as described previously.12 The results were calculated as the average of the 3 reactions and were expressed as genome equivalents per milliliter (GE/mL), using a conversion factor of 6.6 pg of DNA per cell.13
Gel Imaging and Data Analysis
Images were obtained while transilluminating the gel at 300 nm, saved as Tagged Image File Format (tiff), and transferred to GeneTools software (Syngene, Frederick, MD). The imported gels were calibrated using the 1-KB extension ladder and analyzed automatically. Data were created by measuring the sum of the pixel values within the curve, which were dependent on the track width (ie, raw volume). The gel running distance was expressed as retention factor (RF) distance, which is defined as the distance migrated by a band, divided by the distance migrated by the dye front. The RF values lie between 0 and 1 and are negatively correlated with the lengths of the DNA fragments. All laboratory procedures were performed by a single experienced investigator blinded to clinical and storage data. An independent reader confirmed the software readings of the gels.
Pattern Recognition
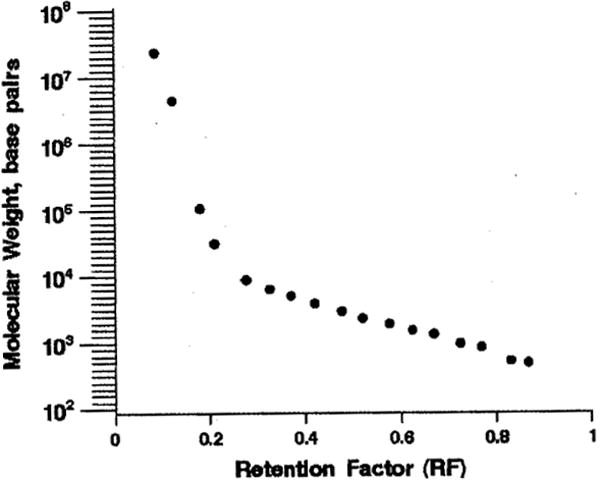
The relationship between DNA molecular weight and the migration of DNA fragments (RF) is plotted in Figure 1. Mean molecular weight and RF were plotted over intervals of RF for the 12 samples that had their molecular weights measured.
FIGURE 1.

Relationship between cfDNA molecular weight and RF distance.
The distribution of the distances traveled by the DNA fragments was plotted for each sample. The initial number of measurements for each sample depended on the changes in the gel intensities, and ranged between 481 and 562 (mean = 522); more readings were recorded for samples with multiple peaks. All curves were smoothed using kernel density estimation, to eliminate noise while retaining the basic features of the curve. In addition, to eliminate the potential confounding effects of the GAPDH genomic equivalent and of gestational age, the curves were normalized so that all the curves had the same area.
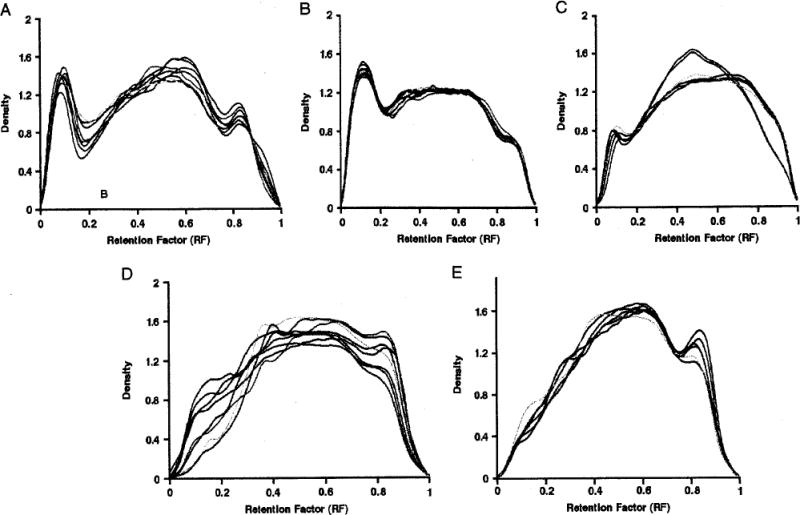
On the basis of the visual differences between the samples, 6 measures were developed, which characterize the locations and slopes for the first and last peaks for each curve (Fig. 2A). The measures are the following: (a) RF at the first local maximum (First Max), (b) RF-at the first local minimum (First Min), (c) percent drop on the vertical axis from First Max to First Min, (d) RF at the last local max (Last Max), (e) RF at the last local min (Last Min), and (f) percent increase on the vertical axis from Last Min to Last Max. Local extrema (min and max) were identified using calculus (0 derivative). However, because kernel density estimation did not always completely smooth the curve, we excluded extreme values that represented a change of less than 1 % on the Y-axis, on the supposition that such small changes were due to noise.
FIGURE 2.

cfDNA density for euploid stored samples. A, Fresh (N = 8); B, storage time of 4 to 6 months (N = 8); C, storage time of 11 to 12 months (N = 6); D, storage time of 17 to 20 months (N = 8), and E, storage time of 59 to 79 months (N = 6). First Max indicates first local maximum; First Min, first local minimum.
Euploid samples were compared by storage time, by checking whether each of the 6 measures on each stored euploid sample fell within 3 SDs of the fresh euploid means. Aneuploid samples were compared with euploid samples of similar storage time, by checking whether each of the 6 measures on each aneuploid sample fell within 3 SDs of the euploid means.
For the euploid samples, side-by-side boxplots were constructed for the 6 outcomes, by storage time. For euploid samples stored up to 12 months, RF at First Max and First Min and percent drop were regressed on storage time. Correlations were calculated for these 3 outcomes with the potential confounders—genome equivalent and gestational age. The last peak was not analyzed with regressions, because many stored euploid samples did not have a last peak. All statistical analyses were carried out using SAS/STAT software (SAS Institute Inc, Cary, NC).
RESULTS
Effect of Storage on Euploid Samples
No overall difference in mean gestational age was detected between the fresh and stored samples (17.7 ±1.2 and 17.0 ± 1.2 wk, respectively; t test P = 0.16). Correlations between gestational age and RF at First Max, RF at First Min, and percent drop were not significant (0.16, − 0.13, and 0.05, respectively). Correlations between log GAPDH genome equivalent and RF at First Max, RF at First Min, and percent drop were not significant (0.04, − 0.10, and 0.23, respectively).
Individual distributions of DNA fragments for euploid fresh and stored samples are shown in Figures 2A to E. Visually, little interindividual variation in DNA density was observed within each storage interval. As storage time increased, the first peak, representing the quantity of large-sized DNA pieces, decreased, became flatter, and ultimately disappeared, with a concomitant increase of medium-sized and short-sized pieces.
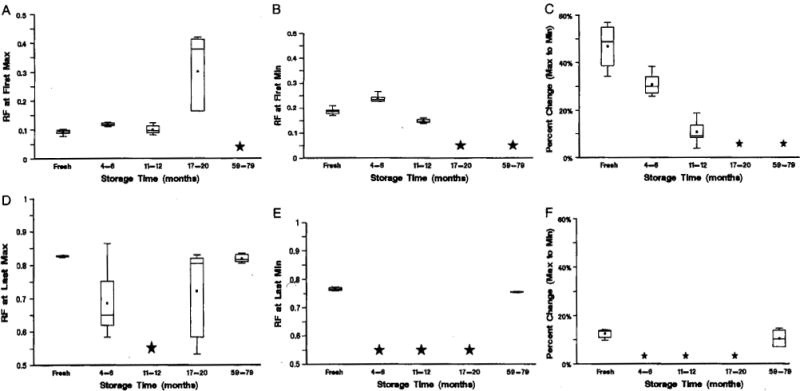
DNA-fragmentation distributions were compared between stored euploid samples and fresh euploid samples, using the 6 characteristics. RF at First Max was similar for the fresh samples and for samples stored for up to 12 months; however, samples stored for 4 to 6 months had a greater RF than fresh samples and those stored for 11 to 12 months (quadratic relationship, P = 0.0003), RF at First Max was much greater for those stored for 17 to 20 months; whereas, no First Max could be determined along the first half of the DNA migration distance for 4 of the 6 long-term stored samples (Fig. 3A). Similarly, RF at First Min was comparable for the fresh and slightly stored samples; however, samples stored for 4 to 6 months had greater RF than fresh samples and those stored for 11 to 12 months (quadratic relationship, P < 0.0001). No First Max could be determined along the first half of the DNA migration distance for 11 of the 14 samples that had been stored for more than 17 months (Fig. 3B). A clear linear decrease was detected in the percent drop from First Max to First Min with storage time, for samples archived for up to 12 months (R2 = 0.83; P < 0.0001). In contrast, the percent drop was undefined for 11 of the 14 samples that had been stored for more than 17 months, because of the absence of a First Min (Fig. 3C). Visually, there is no peak for these 11 samples, for RF, between 0 and 0.5 (Figs. 2D, E).
FIGURE 3.

Criteria established using fresh euploid samples as a function of storage time. A, Location of First Max; B, location of First Min; C, percent change from First Max to First Min; D, location of Last Max; E, location of Last Min, and F, percent change from Last Min to Last Max. A star indicates that there was no peak for more than half of the samples.
The last peak was apparent in the fresh and long-term-archived samples only (Figs. 2A, E, 3D–F). RF at Last Max, RF at Last Min, and percent increase were comparable in the fresh and long-term-stored samples only.
Effect of Aneuploidy on Samples Stored for Less Than 6 Months
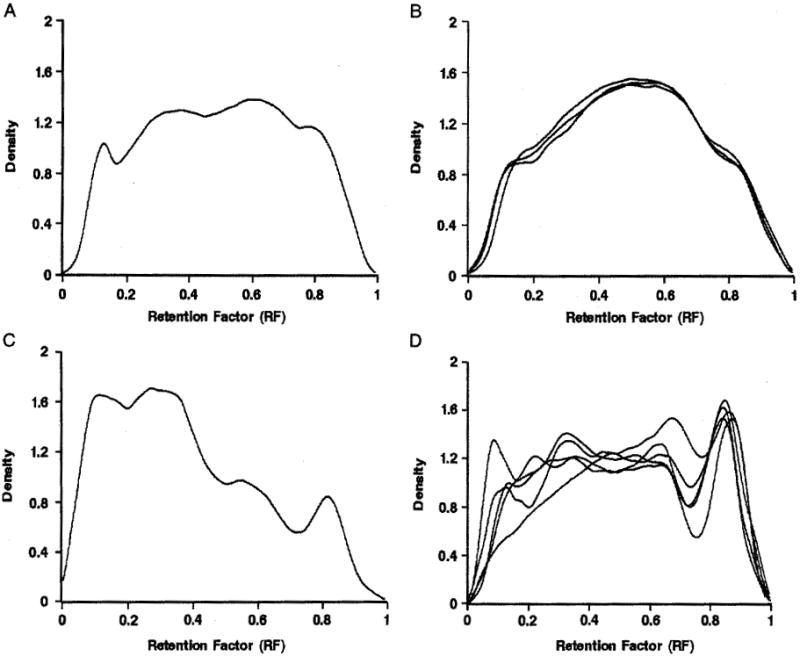
In our dataset, only 2 aneuploid samples were fresh. Therefore, to compare the fragmentation pattern between normal and abnormal pregnancies, given the substantial effect of storage on DNA fragmentation, 10 aneuploid samples with the storage time between 1 and 6 months (Figs. 4A–D) were compared with 8 euploid samples stored for 4 to 6 months (Fig. 2B). The data showed that none of the aneuploid samples met all the criteria for the first peak that had been defined using the stored euploid samples (Table 2); therefore, no further criteria were applied. Only 3 out of 10, 2 out of 10, and 1 out of 10 aneuploid samples met the criterion for First Max, First Min, and percent drop, respectively. Given the significant effect of storage on DNA integrity and the unlikely use of long-term–archived aneuploid samples for diagnostic applications, the DNA-fragmentation criteria were not applied to abnormal samples stored for 7 months or more.
FIGURE 4.

cfDNA density for aneuploid stored samples. A, Triploidy (N = 1); B, trisomy 13 (N = 3); C, trisomy 18 (N = 1), and D, trisomy 21 (N = 5).
TABLE 2.
List of Criteria Established for the First Peak and met by Euploid and Aneuploid Stored Samples
| First Peak Criteria
|
|||||
|---|---|---|---|---|---|
| Sample ID | Storage Time, mo | Karyotype | RF at First Max | RF at First Min | Percent Change From First Max to First Min |
| 661-05 | 4 | Euploidy | √ | √ | √ |
| 662-05 | 4 | Euploidy | √ | √ | √ |
| 521-05 | 5 | Euploidy | √ | √ | √ |
| 586-05 | 5 | Euploidy | √ | √ | √ |
| 613-05 | 5 | Euploidy | √ | √ | √ |
| 442-05 | 6 | Euploidy | √ | √ | √ |
| 448-05 | 6 | Euploidy | √ | √ | √ |
| 501-05 | 6 | Euploidy | √ | √ | √ |
| 564-05 | 1 | Triploidy | √ | — | — |
| 347 | 2 | Trisomy 13 | ● | ● | ● |
| 303 | 3 | Trisomy 13 | ● | ● | ● |
| 1799 | 5 | Trisomy 13 | — | ● | ● |
| 1530 | 6 | Trisomy 18 | √ | √ | — |
| 172 | 3 | Trisomy 21 | — | — | — |
| 54 | 4 | Trisomy 21 | √ | √ | — |
| 56 | 4 | Trisomy 21 | — | — | — |
| 1729 | 5 | Trisomy 21 | — | ● | ● |
| 1561 | 6 | Trisomy 21 | — | — | √ |
√ indicates feature present within 3 SDs of normal stored mean; —, feature present outside 3 SDs of normal stored mean; ●, feature missing.
DISCUSSION
We present a rapid and inexpensive method to uniquely distinguish between euploid and aneuploid cfDNA samples, extracted from the AF of gravid women, using differences in DNA fragmentation. We have also demonstrated that cfDNA size distribution in AF changes with storage time. Our previous report showed that gestational age, karyotype, and storage time affected the quantitative levels of AF cfDNA.10 Therefore, in this study, we eliminated the modifying effects of these and other factors that might affect cfDNA levels by normalizing the DNA fragment distribution curves: this procedure resulted in an identical area under the curve for all individual DNA-fragmentation signatures. We also designated 6 quantitative criteria that characterize the cfDNA curves, using the locations and slopes for the first and last peaks of each curve. Furthermore, we analyzed storage as an ordinal variable.
Our findings indicate that fresh samples consist of cfDNA fragments of distinct lengths that are represented by 3 major peaks, with the most prominent first peak depicting large DNA pieces. As storage time increases, peaks representing large DNA fragments disappear, resulting in a rolling effect toward small DNA fragments (Fig. 2). The observed cfDNA fragmentation in the fresh samples seems to be indicative of a highly controlled process of DNA degradation, or apoptosis, well known to occur in AF. However, the changes in DNA fragment size after storage are more consistent with gradual, random degradation. The last peak representing the smallest DNA fragment size likely correlates with the shortest fragment length that is detectable using the polymerase chain reaction method described here, with an amplicon length of approximately 75 bp.
The ability to use archived samples is an important advantage in laboratory settings in which samples cannot often be analyzed immediately. Several studies have detected significant effects of storage, as a binary or continuous variable, on circulating cfDNA levels in plasma and serum.14,15 Moreover, a suggestive gradient of −0.66 GE/mL per month of storage has been reported.9 However, this study shows that the effects of storage on DNA are complex and might not be properly controlled for by assuming a linear association with length of storage. It is possible that adjustment for DNA-fragmentation pattern, rather than for storage time, can provide more reliable information about the status of analyzed DNA samples.
To distinguish between euploid and aneuploid samples, we used samples frozen for 1 to 6 months to match for storage time, as only 2 fresh aneuploid samples were available for this study. Notably, the use of all 6 criteria was unnecessary, as none of the aneuploid samples met the first 3 criteria for the euploid stored samples, applied to the first peak (Table 2; Figs. 2, 4). Moreover, although no distinctive patterns of DNA fragmentation were observed for most of the aneuploid samples (Figs. 4A–C), 3 aneuploid samples that met 1 or 2 out of the 3 requested criteria represented the least severe abnormalities represented in this study, namely, trisomy 21 and trisomy 18 (Figs. 4C, D).
Although our findings are biologically plausible and are consistent with previous reports,9,14,15 we also considered the likelihood that the observed patterns could be related to technical issues, such as DNA fragmentation during centrifugation, DNA migration on the gel, and gel resolution. However, as we were blinded to chromosome abnormality and storage time in the DNA analyses, as well as to the replication of the gel readings by an independent investigator, it is unlikely that the biases introduced into this study were systematic.
In summary, these preliminary data suggest that the method described here has potentially both clinical and research applications in the study of cell-free nucleic acids. It holds significant promise in correlating entire DNA-fragmentation patterns, or single peaks, with clinical diagnosis and prognosis. On the basis of recent reports that the size distribution of cfDNA fragments in plasma can be used as a possible diagnostic marker in samples of patients with cancer16 and myocardial infarction,2 this tool can be applied to numerous areas of research. Moreover, it helps improve our understanding of different DNA-degradation pathways. Further prospective studies will be required to assess the clinical validity, such as sensitivity and specificity, of the performance of these predictive criteria. These studies should ideally use fresh samples from other less invasively obtained bodily fluids, such as plasma, serum, and urine, using conventional polymerase chain reaction with shorter amplicon lengths (eg, 50 bp).
Acknowledgments
Supported by NIH grant ROI HD42053 (to D.W.B.) and the Swiss National Fund (PBBSB-108590 to O.L.).
References
- 1.Fatouros IG, Destouni A, Margonis K, et al. Cell-free plasma DNA as a novel marker of aseptic inflammation severity related to exercise overtraining. Clin Chem. 2006;52:1820–1824. doi: 10.1373/clinchem.2006.070417. [DOI] [PubMed] [Google Scholar]
- 2.Chang CP, Chia RH, Wu TL, et al. Elevated cell-free serum DNA detected in patients with myocardial infarction. Clin Chim Acta. 2003;327:95–101. doi: 10.1016/s0009-8981(02)00337-6. [DOI] [PubMed] [Google Scholar]
- 3.Yan Z, Lambert NC, Ostensen M, et al. Prospective study of fetal DNA in serum and disease activity during pregnancy in women with inflammatory arthritis. Arthritis Rheum. 2006;54:2069–2073. doi: 10.1002/art.21966. [DOI] [PubMed] [Google Scholar]
- 4.Taback B, O’Day SJ, Hoon DS. Quantification of circulating DNA in the plasma and serum of cancer patients. Ann N Y Acad Sei. 2004;1022:17–24. doi: 10.1196/annals.1318.004. [DOI] [PubMed] [Google Scholar]
- 5.Tong YK, Lo YM. Diagnostic developments involving cell-free (circulating) nucleic acids. Clin Chim Acta. 2006;363:187–196. doi: 10.1016/j.cccn.2005.05.048. [DOI] [PubMed] [Google Scholar]
- 6.Lo YM, Corbetta N, Chamberlain PF, et al. Presence of fetal DNA in maternal plasma and serum. Lancet. 1997;350:485–487. doi: 10.1016/S0140-6736(97)02174-0. [DOI] [PubMed] [Google Scholar]
- 7.Koide K, Sekizawa A, Iwasaki M, et al. Fragmentation of cell-free fetal DNA in plasma and urine of pregnant women. Prenat Diagn. 2005;25:604–607. doi: 10.1002/pd.1213. [DOI] [PubMed] [Google Scholar]
- 8.Bianchi DW, LeShane ES, Cowan JM. Large amounts of cell-free fetal DNA are present in amniotic fluid. Clin Chem. 2001;47:1867–1869. [PubMed] [Google Scholar]
- 9.Lee T, LeShane ES, Messerlian GM, et al. Down syndrome and cell-free fetal DNA in archived maternal serum. Am J Obstet Gynecol. 2002;187:1217–1221. doi: 10.1067/mob.2002.127462. [DOI] [PubMed] [Google Scholar]
- 10.Lapaire O, Bianchi DW, Peter I, et al. Cell-free fetal DNA in amniotic fluid: unique fragmentation signatures in euploid and aneuploid fetuses. Clin Chem. 2007;53:405–411. doi: 10.1373/clinchem.2006.076083. [DOI] [PubMed] [Google Scholar]
- 11.Lapaire O, Stroh H, Peter I, et al. Larger columns and change of lysis buffer increase the yield of cell-free DNA extracted from amniotic fluid. Clin Chem. 2006;52:156–157. doi: 10.1373/clinchem.2005.058420. [DOI] [PubMed] [Google Scholar]
- 12.Johnson KL, Dukes KA, Vidaver J, et al. Interlaboratory comparison of fetal male DNA detection from common maternal plasma samples by real-time PCR. Clin Chem. 2004;50:516–521. doi: 10.1373/clinchem.2003.024380. [DOI] [PubMed] [Google Scholar]
- 13.Lo YM, Tein MS, Lau TK, et al. Quantitative analysis of fetal DNA in maternal plasma and serum: implications for noninvasive prenatal diagnosis. Am J Hum Genet. 1998;62:768–775. doi: 10.1086/301800. [DOI] [PMC free article] [PubMed] [Google Scholar]
- 14.Gerovassili A, Garner C, Nicolaides KH, et al. Free fetal DNA in maternal circulation: a potential prognostic marker for chromosomal abnormalities? Prenat Diagn. 2007;27:104–110. doi: 10.1002/pd.1607. [DOI] [PubMed] [Google Scholar]
- 15.Wataganara T, Peter I, Messerlian GM, et al. Inverse correlation between maternal weight and second trimester circulating cell-free fetal DNA levels. Obstet Gynecol. 2004;104:545–550. doi: 10.1097/01.AOG.0000137352.93110.15. [DOI] [PubMed] [Google Scholar]
- 16.Jahr S, Hentze H, Englisch S, et al. DNA fragments in the blood plasma of cancer patients: quantitations and evidence for their origin from apoptotic and necrotic cells. Cancer Res. 2001;61:1659–1665. [PubMed] [Google Scholar]


