Abstract
Material composition can be estimated from spectral information acquired using photon counting x-ray detectors with pulse height analysis. Non-ideal effects in photon counting x-ray detectors such as charge-sharing, k-escape, and pulse-pileup distort the detected spectrum, which can cause material decomposition errors. This work compared the performance of two empirical decomposition methods: a neural network estimator and a linearized maximum likelihood estimator with correction (A-table method). The two investigated methods differ in how they model the nonlinear relationship between the spectral measurements and material decomposition estimates. The bias and standard deviation of material decomposition estimates were compared for the two methods, using both simulations and experiments with a photon-counting x-ray detector. Both the neural network and A-table methods demonstrated similar performance for the simulated data. The neural network had lower standard deviation for nearly all thicknesses of the test materials in the collimated (low scatter) and uncollimated (higher scatter) experimental data. In the experimental study of Teflon thicknesses, non-ideal detector effects demonstrated a potential bias of 11–28%, which was reduced to 0.1–11% using the proposed empirical methods. Overall, the results demonstrated preliminary experimental feasibility of empirical material decomposition for spectral CT using photon-counting detectors.
I INTRODUCTION
Photon-counting x-ray detectors with pulse height analysis provide spectral information, which can be used to estimate material composition [1]. In the ideal case, the mathematical relationship between material composition and detected spectral data is known and can be inverted to estimate composition of an unknown material [2, 3]. Photon counting detectors exhibit non-ideal behaviors such as charge-sharing, k-escape, and pulse-pileup [4]. These detector effects distort the detected spectrum, which can cause material decomposition errors. In the presence of nonideal effects, additional information is needed to accurately decompose a material from the acquired spectral information. One approach is to explicitly model the individual non-ideal detector effects [5, 6, 7] and incorporate them into the decomposition methods such as maximum likelihood estimation (MLE). Model parameters may be determined from synchrotron or isotope measurements [1, 7]. An alternative approach uses system data to train or calibrate an empirical material decomposition estimator [8, 9, 10]. The estimator learns the behavior of the system-specific detector without explicitly modeling the individual detector effects.
This work compared the performance of two empirical material decomposition methods: a neural network estimator [11] and the A-table method (linearized MLE + correction) [9] through simulations and experiments. The empirical methods were previously investigated through simulations assuming ideal photon-counting detectors, without consideration of spectral degradations that occur in realistic photon-counting detectors [9, 11]. This study will compare the methods on an experimental photon-counting system. The two investigated methods differ in how they model the nonlinear relationship between the spectral measurements and material decomposition estimates. The neural network attempts to directly model the nonlinear relationship. The A-table method assumes a linear relationship, followed by an empirical correction. The purpose of this work was to compare the bias and standard deviation of two approaches for ideal simulated data and experimental data with a photon-counting detector. The nonlinearity in the relationship between spectral measurements and material decomposition estimates is expected to increase in the presence of non-ideal detector effects. The experimental study will investigate whether directly modeling the nonlinear relationship using neural networks improves material decomposition estimates in the presence of non-ideal detector effects.
II METHODS
II.A Theory
When an x-ray photon strikes a photon-counting detector, the photon is converted to electrical charge proportional to the energy of the incoming photon. The charge is converted to a voltage using charge-integrating amplifiers. Analog comparators increment a digital counter when the voltage of the accumulated charge exceeds a set threshold level. At the end of an acquisition, a counter measures the number of photons detected with energy above the threshold. Energy bin data corresponding to the number of photons detected between two threshold levels can be obtained by subtracting consecutive counter measurements.
We consider the case of an x-ray measurement through a material of thickness x and attenuation coefficient μ(E). The x-ray attenuation through this material is equivalent to the attenuation of a unique combination of any two other materials (in the absence of K-edges), as expressed in Equation 1, where μ1(E) and μ2(E) are the energy-dependent attenuation coefficients of each basis material and a1 and a2 are the path lengths of each basis material [2]. This decomposition is possible because there exist two primary attenuation phenomena in the diagnostic x-ray energy range: Compton scattering and photoelectric absorption.
| (1) |
Using the basis expansion in Equation 1, the number of photons detected in the ith energy bin, ni, of an ideal photon-counting detector can be calculated as,
| (2) |
where S(E) is the x-ray source spectrum and aj, the elements of A, are the thicknesses of M basis materials having attenuation coefficients functions, μj. The spectral measurements are represented as a vector of detected photon counts, N = [n1, n2,…, nK]T, where K is the number of energy measurements.
Material decomposition involves estimating the basis material thicknesses, A, from the acquired spectral data, N. One method of estimating the basis material thicknesses, A, from the number of detected photons, N is to numerically invert Equation 2, for example using statistical estimation algorithms such as MLE [3]. In the case of an ideal detector, MLE provides minimum variance, unbiased material decomposition estimates [3]. However, in the presence of realistic detector effects, such as pulse pileup and charge sharing, MLE will introduce decomposition errors unless the effects are accurately modeled in Equation 2 [1].
This work investigated two empirical material decomposition methods that were trained or fitted to approximate the relationship between the log-normalized energy-bin data vector, L = [l1, l2,…, lK]T, and the basis material thickness vector, A, which is expressed in Equation 3,
| (3) |
where 0 is the zero vector and ni(0) is the number of photon counts through air in energy bin, i.
II.A.1 Neural network estimator
One decomposition approach studied in this work used a neural network to approximate the functional relationship between the log-normalized energy-bin data, L, and the basis material thicknesses A, as illustrated in Figure 1. The motivation for using a neural network was to directly model the nonlinear relationship between the spectral measurements and basis material thicknesses. A feed-forward neural network using one hidden layer can approximate a continuous function arbitrarily well, according to the universal approximation theorem [12]. In this work, the neural network architecture consisted of an input layer, a hidden layer, and an output layer. The hidden processing elements used sigmoid activation functions and the output processing elements used linear activation functions. The outputs of the two output-layer processing elements were the basis material thickness estimates.
Figure 1.
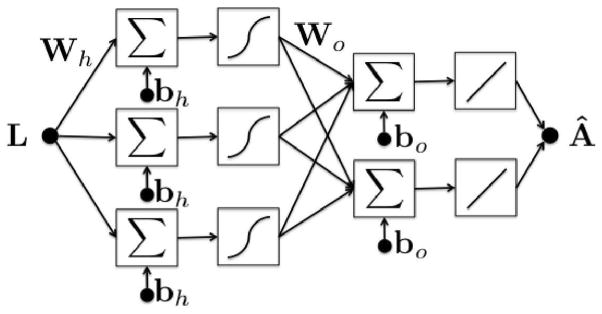
A two-layer neural network estimator diagram shown with three hidden processing elements. The neural network was trained by acquiring spectral projections of known basis material thicknesses. After training, material decomposition was performed by estimating basis material thicknesses from acquired spectral projections through an arbitrary object.
The neural network estimates the basis material thicknesses from the spectral measurements through non-iterative mathematical operations consisting of additions, multiplications, and function evaluations as described in Equation 4,
| (4) |
where flinear and fsigmoid are linear and sigmoidal functions, Wh and Wo are matrices of network weights for the hidden and output layers, and bh and bo are vectors of network biases for the hidden and output layers, respectively. The matrices and vectors, Wh, Wo, bh, and bo, are calculated during the training process in which the neural network is given log-normalized energy bin data from known thicknesses of the basis materials. During training, the Levenberg-Marquardt backpropogation algorithm iteratively calculates the network weights and biases (Wh, Wo, bh, and bo) that minimize the mean square error between the estimated basis material thicknesses and the known calibration thicknesses[13].
The complexity of the neural network model is parameterized by the number of processing elements in the hidden layer. As the number of hidden processing elements increases, the bias is expected to decrease while the variance in the estimates is expected to increase due to overfitting to the training data. This tradeoff and the selection of hidden processing elements will be investigated in Section II.C.
II.A.2 A-table estimator
The second decomposition method investigated in this work was the A-table method, which was previously found to have better noise performance than the well-known polynomial approximation [9]. The A-table method is based on a linear approximation to the relationship between the log-normalized energy-bin data and the basis material thicknesses (Equation 3). Using a first-order Taylor series expansion, the approximate linear relationship is:
| (5) |
where M is referred to as the effective linear attenuation coefficient matrix and w is multivariate white noise. In the A-table method, the M matrix is estimated through a calibration procedure that is similar to the neural network calibration, in which log-normalized energy-bin data is obtained from measurements through known basis material thicknesses. The effective linear attenuation coefficient matrix M is estimated as the least squares approximate linear solution relating the calibration vectors Lcalibration and Acalibration. Once the linear attenuation coefficient matrix M has been estimated from the calibration data, the basis material thicknesses of an unknown material can be estimated from log-normalized energy data using the linearized maximum likelihood estimate,
| (6) |
where ALMLE are the estimated basis material thicknesses, and is the inverse of covariance matrix between log-normalized energy bins. Both M and are estimated from calibration data.
The linear approximation expressed in Equation 5 introduces errors in the estimated basis material thicknesses. As part of the published A-table calibration, the estimated basis material thicknesses ALMLE are compared to the known true material thicknesses used for calibration. The errors in the estimated basis material thicknesses are stored in look-up tables, for each basis material. The error data are fit to a smooth surface over the entire calibration region. Using Equation 6, the log-normalized energy data, L, is used to calculate ALMLE. The errors, δ(ALMLE), in ALMLE are determined from the look up tables and used to correct ALMLE and produce the final basis material thickness estimates, Â.
| (7) |
II.B Calibration
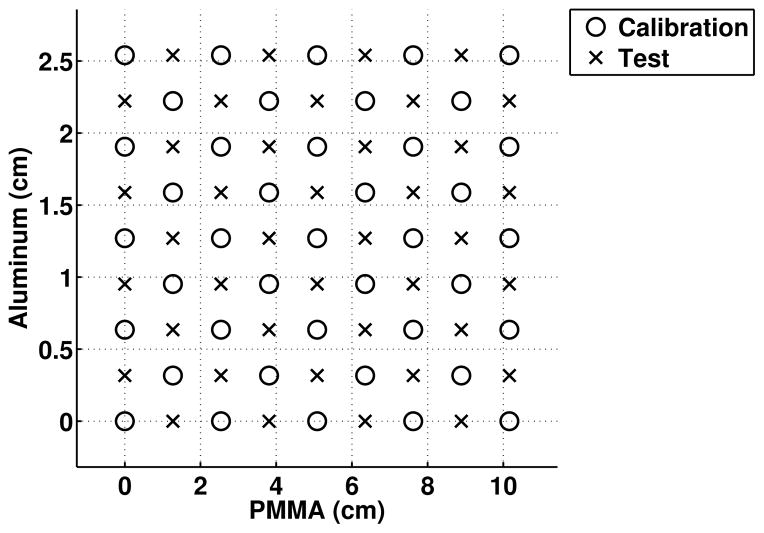
Both the neural network and A-table decomposition methods require calibration data that consist of varying combinations of known basis material thicknesses and their corresponding energy-bin measurements. The basis material thicknesses used for calibration should span the range of attenuation expected in the imaged object. Polymethyl methacrylate (PMMA) and aluminum were used as basis materials throughout this study because their chemical compositions span a large range of materials. These materials are also easily obtainable and machinable for experimental studies. For both the simulation and experimental studies, the calibration data consisted of projections through combinations of PMMA (0 to 4 bars; 2.54 cm each) and aluminum (0 to 4 bars; 1.27 cm each), as depicted by the circle markers in Figure 2. Calibration is required for each detector element, due to variations in energy responses across detector elements. For the A-table implementation, the calibration data generated an 133 × 529 look-up table for each detector element. For the neural network method, the calibration data was used to train a neural network for each detector element.
Figure 2.
This plot represents the decomposition space used throughout this study. The circles represent basis material thicknesses used for calibration. The X’s represent combinations of materials used to test the estimators and to determine the number of hidden processing elements.
II.C Determining the number of hidden processing elements
The number of hidden processing elements in the neural network, nH, is related to the number of free parameters used to fit the input/output relationship. Complex features and nonlinearities in the functional mapping can be fitted using a large number of hidden processing elements. An excessive number of hidden processing elements in the neural network has a potential to overfit the calibration data causing poor generalization in the estimates.
To select the number of hidden processing elements, the neural network was first trained using the calibration dataset. Training was performed with the number of hidden processing elements, nH, varied from 1 to 20. The neural network resulting from each nH setting was used to decompose projection measurements of different thickness combinations of the two basis materials. The test data consisted of projections through thicknesses of PMMA (1.27 cm to 8.89 cm in 2.54 cm increments) and aluminum (0.318 cm to 2.22 cm in 0.635 cm increments). The test data interlaced the calibration data, as plotted in Figure 2. For each number of hidden processing elements, the mean absolute error in the neural network basis material thickness estimates was calculated. The number of hidden processing elements, nH, was selected as the smallest number of hidden processing elements that minimized the mean absolute error of the two basis material estimates.
II.D Quantifying estimator performance
To evaluate the performance of the estimators, two different types of tests were performed. The first test quantified how well the methods estimated the thicknesses of the two basis materials for basis material combinations not seen during calibration. This test quantified the ability of the decomposition methods to approximate the functional relationship between the basis material thicknesses and the log-normalized energy bin data. The same test data was used as in the study for determining the number of hidden processing elements (Figure 2). For both the neural network and A-table estimators a total of 41 projection measurements were used as the calibration data and 40 projection measurements were used as the test data. For this test, the ground truth was the true basis material thicknesses used in the experiments.
The second test quantified how well the estimators decomposed new materials into basis material thicknesses. This test quantified the ability of an estimator to generalize to materials other than the basis materials. For both the simulation and experimental study, the test materials were Teflon (1 to 4 bars; 1.27 cm each), Delrin (1 to 4 bars; 1.27 cm each), and neoprene (2 to 5 bars; 0.635 cm each). These test material thicknesses were chosen because they spanned the PMMA / Aluminum calibration region. For this test, the ground truth basis material thicknesses of these test materials were the thicknesses estimated by MLE using noise-free simulations that assumed the material attenuation coefficients and densities from the NIST XCOM database.
Our goal was to compare the bias and standard deviation of the two estimators (neural network and A-table). The bias, relative to the ground truth, and standard deviation of the estimated basis material thicknesses could be used as evaluation metrics. However these evaluation metrics are problematic for both estimates of bias and standard deviation. The bias or percent bias does not take into account the relative contribution of the two basis materials. For example, if a test material is similar to one basis material (large contribution of one basis material), small bias in the estimated thickness of that material could introduce large error in how well the decomposition coefficients represent the attenuation of the test material. Conversely, a large bias in the basis material with smaller contribution may not impact the overall estimated attenuation function. Comparing the standard deviation of the estimated basis material thicknesses does not consider the covariance between the two basis material estimates [5]. To overcome these evaluation issues, a metric of total attenuation was used in this study, which was the bias and standard deviation of the linear attenuation coefficient at one energy as estimated using the basis material thicknesses. To calculate this metric, the estimated basis material thicknesses were first converted to basis coefficients c1 and c2 by dividing the estimated basis material thickness, Â, by the known thickness of the test material slabs (x in Equation 1). Using Equation 8, the linear attenuation coefficient at 70 keV was estimated for each test material using the estimated basis coefficients and the basis material attenuation curves from the NIST XCOM database [14].
| (8) |
The energy of 70 keV was selected because it was found to optimize monoenergetic image noise for smaller phantoms in a previous dual energy study [15]. The metrics used to compare the material decomposition methods were the bias relative to the ground-truth 70 keV attenuation coefficient obtained from the XCOM database, and the percent standard deviation, which were calculated as follows:
| (9) |
| (10) |
where m was the number of trials, c1,i and c2,i were the estimated basis material coefficients for each trial (Equation 8) and μPMMA, μAl, and μtest were the linear attenuation coefficient functions from the XCOM database.
II.E Simulation study
Simulations were performed to compare the neural network and A-table methods for a detector with an ideal energy response. The simulations modeled acquisitions with an ideal five-bin detector, 100 kV spectrum, Poisson noise, and 2 × 10⁶ photons per measurement, which is comparable to the number of photons detected through air in the experimental study. The detector energy thresholds were set to 25, 40, 50, 60, and 70 keV and measurements from adjacent thresholds were subtracted to create two-sided energy bins of [25–40], [40–50], [50–60], [60–70], and [70–100] keV. These energy thresholds were determined empirically and were not optimized. One hundred trials were simulated for each test condition.
II.F Experimental Study
The performance of the neural network and A-table estimators was also quantified by experiments using a photon counting detector with non-ideal energy response. The bench-top energy-resolved CT system consisted of a cadmium zinc telluride (CZT) detector (NEXIS, Nova R&D, Riverside, CA), with two rows of 128, 1x1 mm detector elements and a Hamamatsu L9181-02 x-ray source. The detector can sort detected photons into five bins at a maximum rate of 2 × 10⁶ counts/s/mm2. The methods were evaluated at 100kV and 40 μA for 11 seconds (3 × 10⁵ counts/s/mm2). For all studies, the detector energy thresholds were set to 25, 40, 50, 60, and 70 keV and measurements from adjacent thresholds were subtracted to create two-sided energy bins of [25–40], [40–50], [50–60], [60–70], and [70–100] keV.
The same thicknesses of PMMA, aluminum, Teflon, Delrin, and neoprene used in simulations were used experimentally. There were five trials of individual thicknesses of Telfon, Delrin and neoprene to assess the performance of the estimators. Another five trials of individual thicknesses of Teflon, Delrin, and neoprene were acquired after a duration of approximately one hour to evaluate the effect of system instability on the estimator performance. A representative detector element in the middle of the detector was used for the analysis of the estimators. The covariance matrix used in the A-table method, RL|A, was calculated from 100 trials measured at the center of the calibration grid (5.08 cm PMMA and 1.27 cm aluminum).
In order to investigate the effects of scatter on the material decomposition methods, calibration projections and test projections were acquired with the beam collimated to the two-row detector (low scatter) and without beam collimation (high scatter).
The spectral response of photon-counting detectors is degraded by effects such as pulse-pileup and charge sharing, which can introduce error in material decomposition estimates [4, 7]. To investigate how much the experimental measurements deviated from ideal measurements, the experimental Teflon measurements were also decomposed using a maximum likelihood estimator that assumed an ideal detector [3]. In practice, the non-ideal effects would be incorporated into the maximum likelihood estimator to reduce error [7, 1]. This work used a maximum likelihood estimator that assumed an ideal detector to quantify the potential error due to non-ideal effects, which was then compared to the performance of the neural network and A-table estimators.
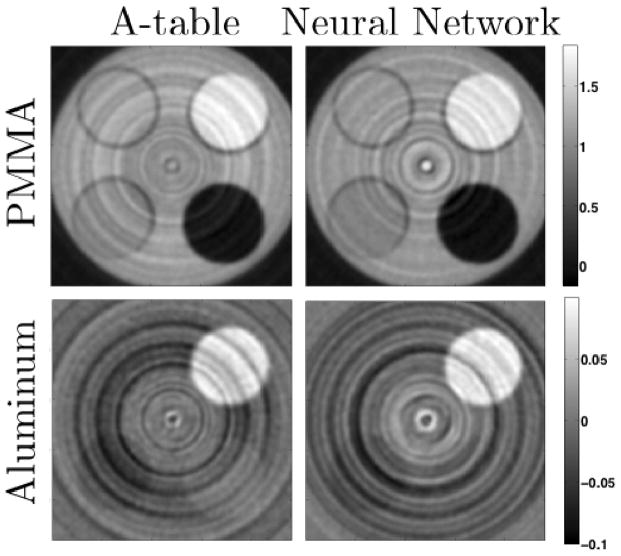
The neural network and A-table estimators were also compared with respect to decomposed basis material CT images. Analyzing the basis images and reconstructed 70 keV monoenergetic image provided a means for comparing the estimator across numerous detector elements. CT data were experimentally acquired of a 6.35-cm-diameter cylindrical phantom containing rods of PMMA, low-density polyethylene (LDPE), air, and Teflon, as seen in Figure 3. CT data were acquired with the 2-mm beam collimation. Two CT trials were performed, each with two hundred projections acquired over 360° with 0.019 mAs per projection angle. The five energy-bin sinograms were decomposed into basis sinograms using both the neural network and A-table estimators, where the basis sinogram values represented the estimated path length through the basis materials. The basis sinograms were reconstructed into basis material images using filtered backprojection, where the pixel values were the unit-less coefficients representing the contribution of the basis material to the overall linear attenuation (the c’s in Equation 8).
Figure 3.
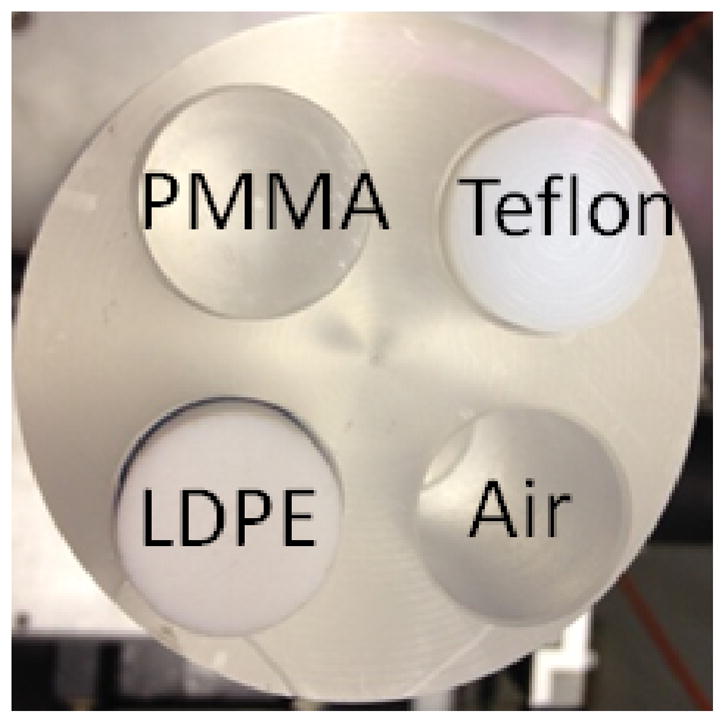
Cylindrical PMMA rod phantom (6.35-cm diameter) consisting of PMMA, LDPE, and Teflon inserts (1.9-cm-diameter) that was used in the experimental CT study.
A 70 keV equivalent image was calculated as a weighted sum of the basis material images, where each basis image was weighted by the linear attenuation coefficient of the respective basis material at 70 keV, as described in Equation 8.
A circular region of interest (ROI) was extracted from the Teflon, LDPE, and PMMA regions of the rod phantom. The bias of mean values estimated in each ROI was calculated relative to the true linear attenuation coefficient of the material at 70 keV, as expressed in Equation 11, where the true attenuation coefficient, μmaterial, was obtained from the NIST XCOM database [14].
| (11) |
In addition to the nonuniformities that cause ring artifacts in conventional CT, photon-counting spectral CT images contain increased ring artifacts due to detector element threshold variations and instability of the photon counting detector [16, 17]. To prevent the ring artifacts from affecting the estimation of noise standard deviation, the 70 keV images resulting from the two trials were subtracted to create noise-only images. The standard deviation in each ROI of the noise-only image was calculated and divided by to adjust for the increased standard deviation due to subtraction.
III RESULTS
III. A Number of hidden processing elements
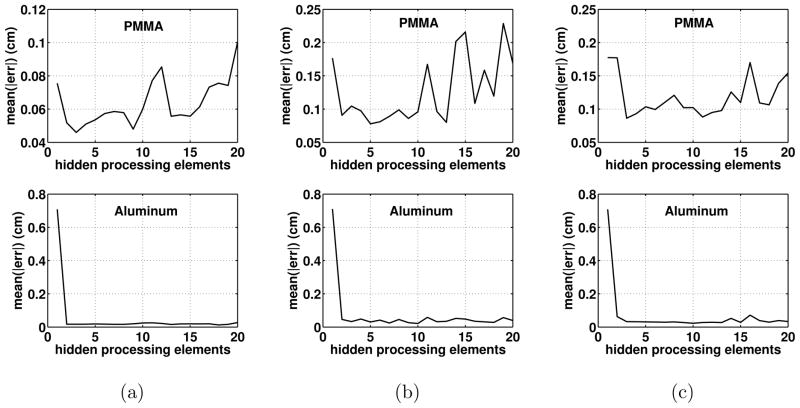
The absolute error in the neural network basis material thickness estimates using varying numbers of hidden processing elements is shown in Figure 4. The absolute error in both PMMA and aluminum reached a minimum at nH = 3 in simulations and, nH = 5 in collimated experiments, and nH = 3 in uncollimated experiments.
Figure 4.
The absolute error in the neural network basis material thickness estimates using varying numbers of hidden processing elements in (a) simulations, (b) collimated experiments, and (c) uncollimated experiments. The absolute errors reached their minimum when nH = 3 in simulations, nH = 5 in collimated experiments, and nH = 3 in uncollimated experiments.
III.B Estimator Performance
Figure 5 presents the performance of the estimators in decomposing previously unseen combinations of the two basis materials, PMMA and aluminum. Figure 5 displays the 2D space spanned by the basis material thicknesses used in this study, with each point in this space representing a unique combination of basis material thicknesses. Figure 5 plots the true thicknesses of the basis material test points as well as the thicknesses estimated by the neural network and A-table estimators. In the case of simulations assuming an ideal detector, both estimators demonstrated similar performance and good agreement to the true values. For the experimental data, the estimated thicknesses had greater deviation from the true thicknesses at thicker combinations of basis material. Figure 5c demonstrates the error between the estimated and true thicknesses increased for the high-scatter case, with greater error for the A-table method.
Figure 5.
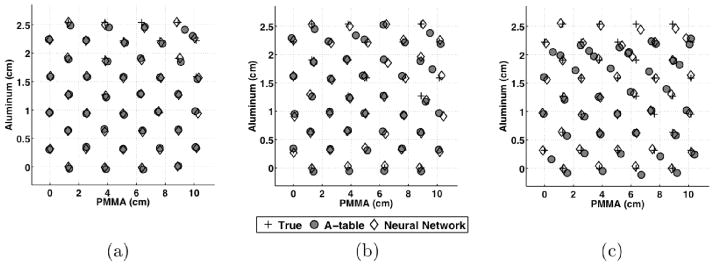
Estimated PMMA and aluminum thicknesses for test combinations of PMMA and aluminum for (a) simulations, (b) experiments with beam collimation, and (c) experiments without beam collimation. The depicted test data points were not used to calibrate the estimators.
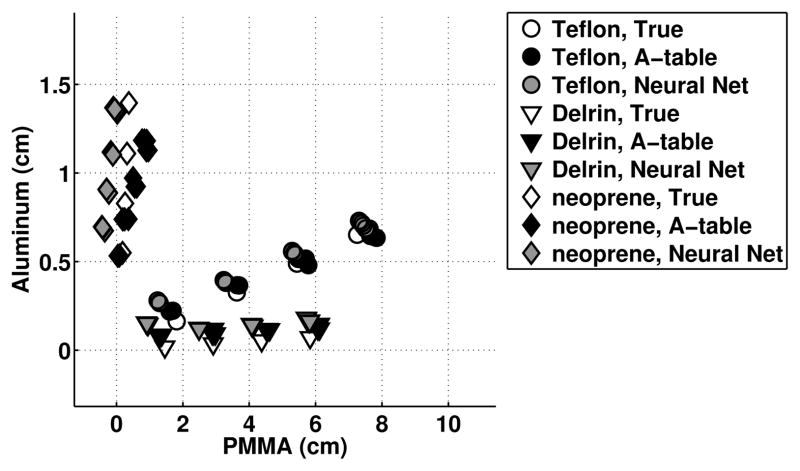
Figure 6 plots the performance of the estimators for decomposing thicknesses of Teflon, Delrin, and neoprene into equivalent PMMA and aluminum thicknesses. This experiment investigated how well the calibrated estimators generalized to new materials. The percent bias and standard deviation of the Delrin, Teflon, and neoprene material decomposition estimates are plotted in Figure 7 for both simulations and experiments. The bias and standard deviation were calculated for the metric of the estimated linear attenuation coefficient at 70 keV, as described in Section II.D. Both estimators demonstrated similar performance for the simulated data, with less than 3% bias and 2% standard deviation. The experimental results demonstrated larger error than the simulation results, likely due to numerous effects such as the non-ideal spectral response, system instability, and errors in the assumed true material composition and densities. In the 2mm collimated experimental data (low scatter), the neural network method demonstrated lower standard deviation (0.1% – 0.35%) compared to the A-table method (0.3% to 2.4%) In the uncollimated experimental data (high scatter), the neural network method demonstrated lower standard deviation (0.1% – 0.5%) compared to the A-table method (0.3% to 2.6%).
Figure 6.
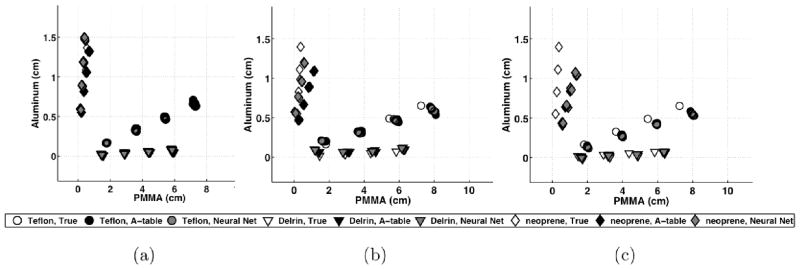
Estimated thicknesses of PMMA and aluminum basis materials for test thicknesses of Teflon, Delrin, and neoprene in (a) simulations (n = 100), (b) experiments with beam collimation (n = 5), and (c) experiments without beam collimation (n = 5). This data was not used for calibration of the estimator methods.
Figure 7.
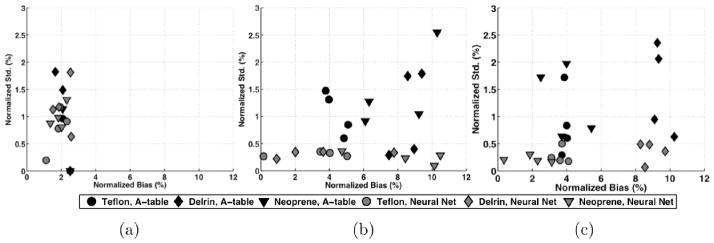
Percent bias and standard deviation of the estimated 70 keV linear attenuation coefficient calculated from basis material thickness estimates in (a) simulations, (b) experiments with beam collimation, and (c) experiments without beam collimation.
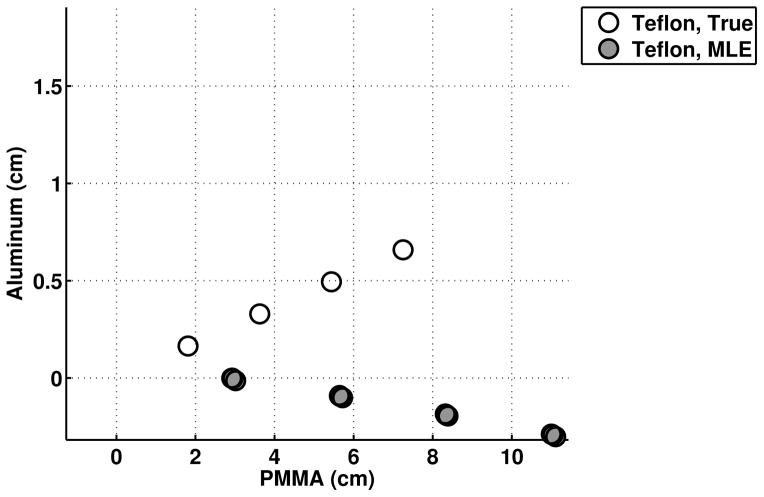
As described in Section II.F, additional experiments were performed to understand the potential sources of error in the experimental material decomposition estimates. Figure 8 plots the basis material thicknesses corresponding to various thicknesses of Teflon that were estimated from the experimental data using maximum likelihood estimation assuming an ideal detector. As seen in Figure 8, assuming an ideal detector caused increased error in the material decomposition estimates with bias ranging from 11–28%, suggesting that the experimental data were affected by non-ideal detector effects.
Figure 8.
Thicknesses of PMMA and aluminum basis materials estimated from the experimental Teflon data using a maximum likelihood algorithm that assumed an ideal detector.
Figure 9 plots the estimated basis material thicknesses of Teflon, Delrin, and neoprene for data acquired approximately 1 hour after calibration. The effects of system instability are evident when comparing the data acquired immediately after calibration (Figure 6b) with the data acquired after one hour (Figure 9).
Figure 9.
Estimated thicknesses of PMMA and aluminum basis materials for test thicknesses of Teflon, Delrin, and neoprene in experiments (n = 5), acquired approximately one hour after acquiring the projections in Figure 6.
III.C Rod phantom CT images
Figure 10 displays the PMMA and aluminum basis images reconstructed from the basis sinograms estimated using the neural network and A-table methods. Figure 11 displays the 70 keV equivalent image that was calculated as a weighted sum of the basis material images. Table 1 displays the percent bias and standard deviation measured in ROIs in the 70-keV image. The bias in the neural network reconstruction ranged from 0.3% to 7.6%, compared to bias of 1.3% to 16% for the A-table method. The neural network resulted in 2.5% noise standard deviation compared to 1.7% for the A-table method.
Figure 10.
PMMA and Aluminum basis material CT images reconstructed from basis sinograms decomposed using the A-table method (left) and the neural network method (right).
Figure 11.
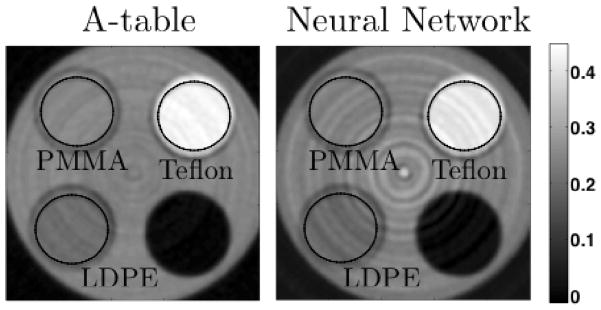
The 70-keV equivalent CT image calculated as a weighted sum of the PMMA and aluminum basis images estimated with the A-table (left) and neural network (right).
Table 1.
The percent bias and standard deviation of linear attenuation coefficient estimates of Teflon, LDPE, and PMMA regions in the 70-keV-equivalent CT image.
|
|
||||
|---|---|---|---|---|
| Neural Net | A-table | |||
|
| ||||
| Bias (%) | Std. Dev (%) | Bias (%) | Std. Dev (%) | |
| Teflon | 0.335 | 2.478 | 1.342 | 1.380 |
| LDPE | 7.603 | 2.044 | 16.43 | 1.656 |
| PMMA | 4.980 | 2.234 | 9.909 | 1.532 |
IV DISCUSSION
This work compared the performance of two empirical material decomposition methods, neural network and the A-table method, through simulations and experiments. In simulations which assumed an ideal detector, both methods demonstrated similar performance, with bias less than 3% and standard deviation below 2% for all cases. The bias and standard deviation was higher for the experimental measurements than simulations (bias 0.1%–11%, standard deviation <3%), which was expected due to non-ideal detector effects such as charge sharing, k-escape, and pulse pileup. In the experimental results, the neural network method demonstrated lower standard deviation (0.1%–0.5%) compared to the A-table method (0.3%–2.6%) and lower bias for some material test cases (Figure 7). For the CT experiments, the neural networks demonstrated reduced bias compared to the A-table method (0.3% – 7.6% compared to 1.3% – 16%, but increased noise (2.5% compared to 1.7%). While the results suggest potential benefits of the neural network method, additional studies with different detector configurations and detectors with improved temporal stability (Figure 9) are required to fully compare the two methods.
Figures 5 and 6 demonstrated increased material decomposition error under conditions of increased scatter. The bias and standard deviation of the estimated attenuation coefficient at 70 keV was generally unaffected by the increased scatter (Figure 7). This result may be due to the limitations of evaluating the material decomposition estimates at one energy. Overall, the results demonstrate that scatter can reduce material decomposition accuracy of the empirical methods. Future work is required to investigate potential scatter compensation techniques in conjunction with empirical decomposition.
When the experimental data of the Teflon bars was decomposed assuming an ideal detector, the bias ranged from 11–28%, demonstrating the potential error due to non-ideal effects. The empirical neural network and A-table methods reduced this error to <11%. The remaining error may be due to errors in the assumed composition and density of the test materials and limitations in how well the empirical methods account for non-ideal effects. The accuracy of the empirical methods could potentially be improved by using calibration materials with higher purity. Error in the estimates may also be due to system instability between the time the calibration projections and the test projections were acquired.
Alternative decomposition methods are currently under development that use statistical estimators, such as maximum likelihood, while modeling the incident spectrum, energy-bin thresholds, and flux-independent and flux-dependent spectral responses [6, 7]. The issues of detector instability demonstrated in this work may also be an issue for these methods. Future studies are required to compare the empirical estimators investigated in this work to the alternative approach of explicit modeling of non-ideal effects.
This work compared material decomposition methods for spectral CT with a photon-counting detector. Both methods could potentially be applied to dual-kV methods using a similar calibration procedure. This work focused on two-material decomposition. Decomposing into more than two materials is possible when imaging K-edge materials such iodine and gadolinium, where the additional basis materials represent attenuation of the K-edge materials [1]. The neural network method can be expanded to accommodate additional basis materials by adding an output processing element for each additional material. The number of input processing elements depends on the number of acquired energy-bin measurements. The optimal number of hidden processing elements would be calculated as presented in Section II.C and may increase with the number of basis materials. The required calibration data would increase to an N-dimensional grid consisting of combinations of the N basis materials (e.g., PMMA, aluminum, concentrations of iodine and/or gadolinium). The A-table method could also be expanded to more than two materials by storing an N-dimensional look-up table for each detector element.
V CONCLUSION
Material decomposition was performed using an artificial neural network method and a linearized maximum likelihood estimator method (A-table method) through simulations and experiments using a photon-counting x-ray detector. The neural network method estimated basis material thicknesses with standard deviation less than 0.5%, compared to standard deviations less than 2.5% for the A-table method. In the experimental study, non-ideal detector effects demonstrated a potential bias of 7–25%, which was reduced to 0.1–11% using the proposed empirical methods. Overall, the results demonstrated preliminary experimental feasibility of empirical material decomposition for photon-counting detectors.
Acknowledgments
This work was supported by NIH Grant number R21EB015094. The contents of this article are solely the responsibility of the authors and do not necessarily represent the official views of the National Institutes of Health. The authors acknowledge Steve Haworth, Medical College of Wisconsin, for assistance with the experimental system.
References
- 1.Schlomka JP, Roessl E, Dorscheid R, Dill S, Martens G, Istel T, Bäumer C, Herrmann C, Steadman R, Zeitler G, et al. Experimental feasibility of multi-energy photon-counting k-edge imaging in pre-clinical computed tomography. Physics in medicine and biology. 2008;53(15):4031. doi: 10.1088/0031-9155/53/15/002. [DOI] [PubMed] [Google Scholar]
- 2.Alvarez Robert E, Macovski Albert. Energy-selective reconstructions in x-ray computerised tomography. Physics in medicine and biology. 1976;21(5):733. doi: 10.1088/0031-9155/21/5/002. [DOI] [PubMed] [Google Scholar]
- 3.Roessl E, Proksa R. K-edge imaging in x-ray computed tomography using multi-bin photon counting detectors. Physics in medicine and biology. 2007;52(15):4679. doi: 10.1088/0031-9155/52/15/020. [DOI] [PubMed] [Google Scholar]
- 4.Taguchi Katsuyuki, Iwanczyk Jan S. Vision 20/20: Single photon counting x-ray detectors in medical imaging. Medical physics. 2013;40(10):100901. doi: 10.1118/1.4820371. [DOI] [PMC free article] [PubMed] [Google Scholar]
- 5.Wang Adam S, Harrison Daniel, Lobastov Vladimir, Tkaczyk J Eric. Pulse pileup statistics for energy discriminating photon counting x-ray detectors. Medical physics. 2011;38(7):4265–4275. doi: 10.1118/1.3592932. [DOI] [PubMed] [Google Scholar]
- 6.Taguchi Katsuyuki, Zhang Mengxi, Frey Eric C, Wang Xiaolan, Iwanczyk Jan S, Nygard Einar, Hartsough Neal E, Tsui Benjamin MW, Barber William C. Modeling the performance of a photon counting x-ray detector for CT: Energy response and pulse pileup effects. Medical physics. 2011;38(2):1089–1102. doi: 10.1118/1.3539602. [DOI] [PMC free article] [PubMed] [Google Scholar]
- 7.Cammin Jochen, Xu Jennifer, Barber William C, Iwanczyk Jan S, Hartsough Neal E, Taguchi Katsuyuki. A cascaded model of spectral distortions due to spectral response effects and pulse pileup effects in a photon-counting x-ray detector for CT. Medical physics. 2014;41(4) doi: 10.1118/1.4866890. [DOI] [PMC free article] [PubMed] [Google Scholar]
- 8.Stenner Philip, Berkus Timo, Kachelriess Marc. Empirical dual energy calibration (EDEC) for cone-beam computed tomography. Medical physics. 2007;34(9):3630–3641. doi: 10.1118/1.2769104. [DOI] [PubMed] [Google Scholar]
- 9.Alvarez Robert E. Estimator for photon counting energy selective x-ray imaging with multibin pulse height analysis. Medical physics. 2011;38(5):2324–2334. doi: 10.1118/1.3570658. [DOI] [PMC free article] [PubMed] [Google Scholar]
- 10.Maaß Clemens, Baer Matthias, Kachelrieß Marc. Image-based dual energy CT using optimized precorrection functions: A practical new approach of material decomposition in image domain. Medical physics. 2009;36(8):3818–3829. doi: 10.1118/1.3157235. [DOI] [PubMed] [Google Scholar]
- 11.Lee Woo-Jin, Kim Dae-Seung, Kang Sung-Won, Yi Won-Jin. Material depth reconstruction method of multi-energy x-ray images using neural network. IEEE EMBS. 2012 doi: 10.1109/EMBC.2012.6346229. [DOI] [PubMed] [Google Scholar]
- 12.Cybenko George. Approximation by superpositions of a sigmoidal function. Mathematics of control, signals and systems. 1989;2(4):303–314. [Google Scholar]
- 13.Hagan Martin T, Menhaj Mohammad B. Training feedforward networks with the Marquardt algorithm. Neural Networks, IEEE Transactions on. 1994;5(6):989–993. doi: 10.1109/72.329697. [DOI] [PubMed] [Google Scholar]
- 14.Berger MJ, Hubbell JH, Seltzer SM, Chang J, Coursey JS, Sukumar R, Zucker DS. XCOM: Photon cross sections database. NIST Standard Reference Database. 1998;8:87–3597. [Google Scholar]
- 15.Yu Lifeng, Christner Jodie A, Leng Shuai, Wang Jia, Fletcher Joel G, McCollough Cynthia H. Virtual monochromatic imaging in dual-source dual-energy CT: radiation dose and image quality. Medical physics. 2011;38(12):6371–6379. doi: 10.1118/1.3658568. [DOI] [PMC free article] [PubMed] [Google Scholar]
- 16.Wang X, Meier D, Mikkelsen S, Maehlum GE, Wagenaar DJ, Tsui BMW, Patt BE, Frey EC. Microct with energy-resolved photon-counting detectors. Physics in medicine and biology. 2011;56(9):2791. doi: 10.1088/0031-9155/56/9/011. [DOI] [PMC free article] [PubMed] [Google Scholar]
- 17.Persson Mats, Bornefalk Hans. A framework for evaluating threshold variation compensation methods in photon counting spectral CT. Medical Imaging, IEEE Transactions on. 2012;31(10):1861–1874. doi: 10.1109/TMI.2012.2204274. [DOI] [PubMed] [Google Scholar]


