

Abstract
Purpose
To describe the clinical and molecular characteristics of patients with childhood-onset Stargardt disease (STGD).
Design
Retrospective case series.
Participants
Forty-two patients who were diagnosed with STGD in childhood at a single institution between January 2001 and January 2012.
Methods
A detailed history and a comprehensive ophthalmic examination were undertaken, including color fundus photography, autofluorescence imaging, spectral-domain optical coherence tomography (SD-OCT), and pattern and full-field electroretinograms. The entire coding region and splice sites of ABCA4 were screened using a next-generation, sequencing-based strategy. The molecular genetic findings of childhood-onset STGD patients were compared with those of adult-onset patients.
Main Outcome Measures
Clinical, imaging, electrophysiologic, and molecular genetic findings.
Results
The median ages of onset and the median age at baseline examination were 8.5 (range, 3–16) and 12.0 years (range, 7-16), respectively. The median baseline logarithm of the minimum angle of resolution visual acuity was 0.74. At baseline, 26 of 39 patients (67%) with available photographs had macular atrophy with macular/peripheral flecks; 11 (28%) had macular atrophy without flecks; 1 (2.5%) had numerous flecks without macular atrophy; and 1 (2.5%) had a normal fundus appearance. Flecks were not identified at baseline in 12 patients (31%). SD-OCT detected foveal outer retinal disruption in all 21 patients with available images. Electrophysiologic assessment demonstrated retinal dysfunction confined to the macula in 9 patients (36%), macular and generalized cone dysfunction in 1 subject (4%), and macular and generalized cone and rod dysfunction in 15 individuals (60%). At least 1 disease-causing ABCA4 variant was identified in 38 patients (90%), including 13 novel variants; ≥2 variants were identified in 34 patients (81%). Patients with childhood-onset STGD more frequently harbored 2 deleterious variants (18% vs 5%) compared with patients with adult-onset STGD.
Conclusions
Childhood-onset STGD is associated with severe visual loss, early morphologic changes, and often generalized retinal dysfunction, despite often having less severe fundus abnormalities on examination. One third of children do not have flecks at presentation. The relatively high proportion of deleterious ABCA4 variants supports the hypothesis that earlier onset disease is often owing to more severe variants in ABCA4 than those found in adult-onset disease.
Stargardt macular dystrophy (STGD) is the most common form of juvenile-onset macular degeneration; it is inherited as an autosomal-recessive trait and caused by mutations in the ABCA4 gene.1–3 Most cases present with central visual loss in early teenage years and ophthalmoscopy classically reveals macular atrophy with yellowish-white flecks at the posterior pole at the level of the retinal pigment epithelium (RPE).1
A large number of studies have described wide phenotypic variability and variable severity in ABCA4-associated retinopathy. The various phenotypes encompass macular atrophy without flecks, bull's-eye maculopathy, fundus flavimaculatus (retinal flecks without macular atrophy), a foveal sparing phenotype, cone-rod dystrophy, and “retinitis pigmentosa.”1–20 There is also considerable allelic heterogeneity, with >700 variants in ABCA4 having been reported to date. 1,2,4–34
Patients with childhood-onset STGD tend to develop early severe visual acuity (VA) loss, markedly compromised retinal function on electroretinography with generalized rod and cone system dysfunction, and rapid enlargement of RPE atrophy and progressive loss of retinal function.5,10,13,35,36 Patients with adult-onset disease are more likely to retain useful VA for longer and show milder retinal dysfunction at diagnosis.7,11,13,15,35 There have been no previous studies specifically describing the clinical findings in a large cohort of molecularly confirmed STGD patients presenting and examined in childhood; the majority of previous reports relate to clinical features of patients examined in adulthood, some of whom may have had childhood-onset disease.
The purpose of this study was to describe the detailed clinical and molecular genetic findings of a large cohort of patients from a single center with childhood-onset STGD examined before 17 years of age.
Methods
Patients
Forty-two patients diagnosed with STGD at <17 years of age, between January 2001 and January 2012, were ascertained from the pediatric inherited retinal disease clinics at Moorfields Eye Hospital. Two subjects have been described in a previous case report.9 Blood samples were collected and genomic DNA extracted from peripheral blood leukocytes after obtaining informed consent. The protocol of the study adhered to the provisions of the Declaration of Helsinki and was approved by the local Ethics Committee of Moorfields Eye Hospital.
Clinical Evaluation and Electrophysiology
A detailed medical history was obtained and a full ophthalmologic examination performed. The age of onset was defined as either the age at which visual loss was first noted by the patient or, in the “asymptomatic” patients, when an abnormal retinal appearance was first detected. The duration of disease was calculated as the difference between age at onset and age at most recent examination in childhood. The follow-up data were obtained before the age of 17 years.
Clinical evaluation included best-corrected VA, dilated ophthalmoscopy, color fundus photography, fundus autofluorescence imaging (AF), spectral-domain optical coherence tomography (SD-OCT), and electrophysiologic assessment. Best-corrected Snellen VA was converted to equivalent logarithm of the minimum angle of resolution (logMAR) VA. Follow-up data of logMAR VA, color fundus photography, and AF imaging were compared with those at baseline.
Color fundus photography was performed with a TRC-50IA Retinal Fundus Camera (Topcon, Tokyo, Japan). Patients were divided into 1 of 6 fundus appearance groups based on the presence and location of central (macular) RPE atrophy and yellowish-white flecks (Table 1).
Table 1. Classification of Phenotype and Genotype in Stargardt Disease, Based on Fundus Appearance, Autofluorescence Pattern, Electrophysiologic Assessment, and ABCA4 Variants.
| Fundus Appearance | AF Pattern | ERG Group | Genotype Group Classification | ||||
|---|---|---|---|---|---|---|---|
| Grade 1 | Normal fundus | Type 1 | Localized low AF signal at the fovea surrounded by a homogeneous background with/without perifoveal foci of high or low signal | Group 1 | PERG abnormality with normal full-field ERGs | Genotype A | Two or more (likely) deleterious variants |
| Grade 2 | Macular and/or peripheral flecks without central atrophy | ||||||
| Grade 3a | Central atrophy without flecks | Type 2 | Localized low AF signal at the macula surrounded by a heterogeneous background and widespread foci of high or low AF signal extending anterior to the vascular arcades | Group 2 | PERG abnormality with additional generalized cone ERG abnormality | Genotype B | One deleterious variant and ≥1 missense or inframe insertion/deletion variant(s) |
| Grade 3b | Central atrophy with macular and/or peripheral flecks | ||||||
| Grade 3c | Paracentral atrophy with macular and/or peripheral flecks, without central atrophy | ||||||
| Grade 4 | Multiple extensive atrophic changes of the RPE, extending beyond the vascular arcades | Type 3 | Multiple areas of low AF signal at posterior pole with a heterogeneous background and/or foci of high or low signal | Group 3 | PERG abnormality with additional generalized cone and rod ERG abnormality | Genotype C | Two or more missense or in-frame insertion/deletion variants |
AF = autofluorescence; ERG = electroretinography; PERG = pattern electroretinography; RPE = retinal pigment epithelium.
Aligned grades/types/groups of 4 classifications do not correlate with each other.
Autofluorescence images before 2009 were obtained with an HRA 2 (Heidelberg Engineering, Heidelberg, Germany; excitation light, 488 nm, barrier filter, 500 nm; field of view, 30×30°); imaging after 2009 was undertaken using the Spectralis with viewing module version 5.1.2.0 (Heidelberg Engineering; excitation light, 488 nm; barrier filter, 500 nm; fields of view, 30×30° and 55×55°)37. Patients were classified into 1 of 3 AF patterns, as previously described (Table 1).6,36
Spectral domain OCT was undertaken with the Spectralis with viewing module version 5.1.2.0. The HEYEX software interface (version 1.6.2.0; Heidelberg Engineering) was used for retinal thickness measurements.6,37 Central foveal thickness was defined as the distance between the inner retinal surface and the inner border of the RPE.6
Electrophysiologic assessment included full-field electroretinogram (ERG), and pattern ERG, recorded with gold foil electrodes. Protocols incorporated the recommendations of the International Society for Clinical Electrophysiology of Vision.38,39 Full-field ERGs were used to assess generalized rod and cone system function and included (i) dark-adapted dim flash 0.01 cd·s·m−2 (DA 0.01), (ii) dark-adapted bright flash 11.0 cd·s·m−2 (DA 11.0), (iii) light-adapted 3.0 cd·s·m−2 30 Hz flicker ERG (LA 3.0 30 Hz), and (iv) light-adapted 3.0 cd·s·m−2 at 2 Hz (LA 3.0). The pattern ERG P50 component was used to assess macular function. All the components of the ERG and the pattern ERG P50 component were examined to classify patients into 1 of the 3 previously described electrophysiologic groups (Table 1).5,35
Mutation Screening
Blood samples were collected in EDTA tubes and DNA was extracted with a Nucleon Genomic DNA extraction kit (BACC2; Tepnel Life Sciences, West Lothian, UK).8 All 50 exons and exon–intron boundaries of the ABCA4 gene were amplified using Illumina Truseq Custom Amplicon protocol (Illumina, San Diego, CA), followed by sequencing on Illumina MiSeq platform.8,22 The next-generation sequencing reads were analyzed and compared with the reference genome GRCh37/hg19, using the variant discovery software NextGENe (SoftGenetics LLC, State College, PA). All detected possibly disease-associated variants were confirmed by Sanger sequencing.8,22
All the missense variants identified were analyzed using 2 software prediction programs: SIFT (Sorting Intolerant from Tolerant; available from www.sift.jcvi.org/; accessed November 1, 2013), and PolyPhen2 (available from www.genetics.bwh.harvard.edu/pph/index.html; accessed November 1, 2013). Predicted effects on splicing of all the missense and intronic variants were assessed with the Human Splicing finder program version 2.4.1 (available from www.umd.be/HSF/; accessed November 1, 2013). The allele frequency of all variants was estimated by reference to the Exome Variant Server (NHLBI Exome Sequencing Project, Seattle, WA; available from www.snp.gs.washington.edu/EVS/; accessed November 1, 2013).
Patients harboring ≥2 mutations were classified into 3 genotype groups based on mutation type: Group A included patients with ≥2 definitely or likely deleterious (severe) variants; group B included patients with 1 deleterious variant and ≥1 missense or in-frame insertion/deletion variants; and group C included individuals with ≥2 missense or in-frame insertion/deletion variants10 (Table 1). One disease-associated intronic change of unknown effect was treated as a deleterious allele owing to the associated severe clinical phenotype previously reported.5,22 It should be noted, however, that assigning severity (e.g., a deleterious effect) to a mutation was not always straightforward, especially for missense alleles and some variants in splice sites.
Comparison Between Childhood-Onset and Adult-Onset STGD
To investigate differences between the patients with childhood-onset STGD and those with adult-onset STGD, clinical and molecular genetic data of patients with adult-onset STGD ascertained at Moorfields Eye Hospital were reviewed. The comparison group consisted of all patients who had adult-onset STGD (older than 17 years), and who had ≥2 disease-causing ABCA4 variants.
Statistical analysis was performed using commercially available software: Excel Tokei 2010 (Social Survey Research Information Co., Ltd., Tokyo, Japan). The eye used for analysis was selected according to the Random Integer Generator (available from www.random.org/). The Mann–Whitney U test was applied to investigate the differences between the 2 groups (childhood-onset STGD vs adult-onset STGD) in terms of logMAR VA, and central foveal thickness. The chi square statistic was applied to investigate the association between selected categorical variables of childhood-onset and adult-onset disease, including fundus appearance, flecks (macular, peripheral, and no flecks), presence of pigmentation, AF pattern, electrophysiologic group, and genotype group. P <0.05 was considered to indicate statistical significance.
Results
Forty-two unrelated patients with childhood-onset STGD were ascertained; the clinical findings are summarized in Table 2 (available at www.aaojournal.org). There were 22 female and 20 male patients. Eight (19%) were from consanguineous families. The median age of onset was 8.5 years (range, 3-16), and the median age at baseline examination was 12.0 years (range, 7–16). The median logMAR VA at baseline in all 42 patients was 0.74 in the right eye and 0.74 in the left eye (range, 0.10–1.30 and 0.12–1.40, respectively). The mean duration of disease at baseline was 2.0 years (range, 0–9). Follow-up data were available for logMAR VA, fundus photography, and AF imaging, in 24, 14, and 11 patients, respectively. The detailed changes in these parameters during follow-up are presented in Table 3 (available at www.aaojournal.org).
Table 2. Summary of Clinical Findings at Baseline and Molecular Status of 42 patients with Childhood-onset Stargardt Disease.
| OCT | |||||||||||
|---|---|---|---|---|---|---|---|---|---|---|---|
| Pt | Onset (yrs) | Age at Baseline (yrs) | LogMAR VA | Fds type | AF type | CFT (μm) | ERG group | Genotype group | Mutation Status | ||
| R | L | R | L | ||||||||
| 1* | 4 | 6 | 1.00 | 0.78 | 3b | NA | NA | NA | 3 | NA | No variants |
| 2* | 6 | 7 | 0.48 | 0.48 | 1 | NA | NA | NA | 1 | B | p.[Arg653Cys];[Arg2030*] |
| 3* | 7 | 7 | 1.30 | 1.20 | 3b | 2 | 60 | 45 | 3 | A | c.[6479+1G>A];[6479+1G>A] |
| 4* | 3 | 7 | 0.10 | 0.20 | 3b | NA | NA | NA | 3 | NA | No variants |
| 5* | 5 | 8 | 1.00 | 1.00 | 3b | 2 | NA | NA | 3 | A | p.[Glu905fs];[Glu905fs] |
| 6 | 7 | 8 | 1.30 | 1.40 | 3b | 2 | 49 | 44 | NA | A | p.[Arg1097*];c.[5196+1G>A] |
| 7 | 7 | 8 | 0.48 | 0.40 | 3a | 1 | 46 | 38 | 1 | B | p.[Arg212Cys];c.[5461-10T>C] |
| 8* | 6 | 8 | 0.48 | 0.48 | 3a | 2 | NA | NA | 3 | A | p.[Tyr1027*];[Tyr1027*] |
| 9 | 7 | 9 | 0.60 | 0.20 | 3b | 2 | 61 | 67 | NA | B | p.[Cys1490Tyr];c.[5461-10T>C] |
| 10 | 8 | 9 | 0.70 | 0.70 | 3b | 2 | 69 | 65 | 3 | B | p.[Glu1087Lys];c.[5461-10T>C] |
| 11 | 9 | 9 | 0.48 | 0.48 | 3b | 2 | NA | NA | 3 | C | p.[Arg1108Cys];[Cys1490Tyr] |
| 12 | 8 | 9 | 1.00 | 1.00 | 3b | 2 | NA | NA | 1 | NA | p.Cys519* |
| 13 | 7 | 9 | 0.48 | 0.48 | 3a | 1 | 35 | 45 | NA | C | p.[Arg1108Cys];[Thr1526Met] |
| 14 | 8 | 9 | 0.60 | 0.48 | 3b | 2 | NA | NA | 1 | C | p.[His1406Tyr];[Trp1408Arg;Arg1640Trp] |
| 15 | 5 | 10 | 0.80 | 0.80 | 3a | 1 | 54 | 54 | 3 | NA | c.5461-10T>C |
| 16 | 8 | 10 | 1.00 | 1.00 | 3b | 2 | NA | NA | NA | B | p.[Tyr954Ser];c.[5461-10T>C] |
| 17*† | 5 | 10 | 0.30 | 0.30 | 3b | 2 | 72 | 81 | NA | B | c.[768G>T];p.[Cys1455Arg] |
| 18† | 9 | 11 | 0.50 | 0.40 | 3b | 2 | 94 | 107 | 3 | A | p.[Gln636*];c.[5461-10T>C] |
| 19 | 9 | 11 | 0.30 | 0.30 | 3a | NA | NA | NA | 3 | NA | No variants |
| 20 | 10 | 11 | 0.78 | 0.78 | 3b | 2 | 61 | 66 | 3 | A | p.[Gln8fs];c.[5461-10T>C] |
| 21 | 10 | 11 | 0.54 | 0.12 | 2 | 2 | 61 | 70 | 1 | B | p.[Trp439*];[Pro1380Leu] |
| 22 | 8 | 11 | 1.00 | 1.00 | 3b | 2 | NA | NA | NA | B | c.[5461-10T>C];p.[Leu2027Phe] |
| 23 | 12 | 12 | 0.18 | 0.18 | 3b | NA | NA | NA | 1 | NA | No variants |
| 24 | 11 | 12 | 1.00 | 0.90 | 3b | 2 | 37 | 41 | NA | B | p.[Cys1455Arg];c.[5714+5G>A] |
| 25 | 8 | 12 | 1.30 | 1.30 | 3b | 2 | 78 | 84 | NA | B | p.[Gly863Ala(;)Glu1122Lys(;)Arg2030*] |
| 26 | 3 | 12 | 1.00 | 1.00 | 3a | 2 | NA | NA | NA | C | p.[Gly550Arg];[Cys2150Tyr] |
| 27 | 9 | 13 | 0.50 | 0.60 | 3a | 1 | 138 | 140 | 1 | B | p.[Gly863Ala];[Thr1721fs] |
| 28* | 6 | 13 | 1.30 | 1.10 | 3b | 2 | 33 | 35 | 3 | C | p.[Glu1022Lys];[Glu1022Lys] |
| 29 | 8 | 13 | 1.00 | 1.18 | 3b | NA | NA | NA | NA | B | p.[Arg587Lys];[Trp855*] |
| 30 | 11 | 14 | 0.90 | 0.80 | 3b | 2 | 73 | 67 | NA | A | p.[Gln636*];c.[6817-2A>C] |
| 31 | 12 | 14 | 0.48 | 0.48 | 3a | 1 | NA | NA | 1 | C | p.[Thr1019Met];[Gly1961Glu] |
| 32 | 10 | 14 | 1.00 | 1.00 | NA | NA | NA | NA | 3 | B | c.[5018+2T>C];p.[Ser2072Asn] |
| 33 | 11 | 14 | 0.18 | 0.20 | 3a | 1 | 126 | 134 | 1 | B | p.[Gly1961Glu];c.[6729+4_6729+18del] |
| 34 | 12 | 15 | 1.00 | 1.00 | 3b | 2 | 48 | 49 | 3 | C | p.[Pro1380Leu]; [Tyr1770Asp] |
| 35 | 12 | 15 | 0.50 | 0.50 | 3a | 1 | 46 | 50 | 3 | NA | p.Gly1961Glu |
| 36 | 12 | 15 | 1.00 | 1.00 | 3b | 2 | 60 | 55 | 2 | C | p.[Arg653Cys];[Pro1380Leu] |
| 37 | 14 | 15 | 0.18 | 0.18 | 3b | 1 | 44 | 51 | NA | C | p.[Arg511Cys(;)Ala1739dup(;)Gly1961Glu] |
| 38 | 13 | 15 | 1.00 | 1.00 | 3b | NA | NA | NA | NA | C | p.[Met1066Arg];[Cys1490Tyr] |
| 39 | 12 | 15 | 0.80 | 0.80 | 3b | 1 | NA | NA | NA | C | p.[Asp586Gly];[Gly1961Glu] |
| 40 | 16 | 16 | 0.48 | 0.48 | NA | NA | NA | NA | NA | NA | p.Leu2027Phe |
| 41 | 13 | 16 | 1.00 | 1.00 | NA | NA | NA | NA | NA | B | c.[5461-10T>C];p.[Leu2027Phe] |
| 42 | 14 | 16 | 0.18 | 0.18 | 3a | 1 | NA | NA | NA | C | p.[Arg1129Cys];[Cys1490Tyr] |
AF type = autofluorescence type; CFT = central foveal thickness; ERG = electroretinogram; Fds type = fundus type; L = left; LogMAR VA = logarithm of the minimum angle of resolution visual acuity; NA = not available; OCT = optical coherence tomography; Pt = patient; R = right.
The age of onset was defined as either the age at which visual loss was first noted by the patient or in the asymptomatic patients when abnormal retinal appearance was first detected.
The CFT was defined as the distance between the inner retinal surface and inner border of the retinal pigment epithelium at the central fovea.
Eight patients were from consanguineous families.
Two patients have been partially described in a previous case report (patients 17 and 18).9
Variants shown in bold are putative novel.
Table 3. Detailed Changes of Visual Acuity, Fundus Appearance, Autofluorescence Pattern during the Follow-up Interval of 42 patients with Childhood-onset Stargardt Disease.
| LogMAR VA | Fds type | AF type | ||||||||||||||
|---|---|---|---|---|---|---|---|---|---|---|---|---|---|---|---|---|
| Pt | BL | FU | BL | FU | Type transision | BL | FU | Type transision | ||||||||
| Age (yrs) | R | L | Age (yrs) | R | L | Age (yrs) | Age (yrs) | Age (yrs) | Age (yrs) | |||||||
| 1 | 6 | 1.00 | 0.78 | NA | 6 | 3b | 13 | 3b | NA | NA | ||||||
| 2 | 7 | 0.48 | 0.48 | NA | 7 | 1 | NA | NA | NA | |||||||
| 3 | 7 | 1.30 | 1.20 | NA | 9 | 3b | 10 | 3b | 9 | 2 | 10 | 2 | ||||
| 4 | 7 | 0.10 | 0.20 | 12 | 0.05 | 0.20 | 10 | 3b | 12 | 3b | NA | NA | ||||
| 5 | 8 | 1.00 | 1.00 | NA | 9 | 3b | NA | 9 | 2 | NA | ||||||
| 6 | 8 | 1.30 | 1.40 | NA | 11 | 3b | NA | 11 | 2 | NA | ||||||
| 7 | 8 | 0.48 | 0.40 | 14 | 0.80 | 0.70 | 9 | 3a | 14 | 3b | ✓ | 9 | 1 | 14 | 1 | |
| 8 | 8 | 0.48 | 0.48 | 15 | 1.40 | 1.60 | 16 | 3a | NA | 16 | 2 | NA | ||||
| 9 | 9 | 0.60 | 0.20 | 13 | 1.10 | 1.00 | 9 | 3b | 12 | 3b | 9 | 2 | 13 | 2 | ||
| 10 | 9 | 0.70 | 0.70 | 13 | 1.10 | 1.20 | 9 | 3b | NA | 9 | 2 | 13 | 2 | |||
| 11 | 9 | 0.48 | 0.48 | 14 | 1.30 | 1.20 | 9 | 3b | 13 | 3b | 9 | 2 | 13 | 2 | ||
| 12 | 9 | 1.00 | 1.00 | 14 | 1.10 | 0.90 | 10 | 3b | 13 | 3b | 10 | 2 | 12 | 2 | ||
| 13 | 9 | 0.48 | 0.48 | 16 | 0.80 | 0.80 | 10 | 3a | 14 | 3b | ✓ | 10 | 1 | 16 | 1 | |
| 14 | 9 | 0.60 | 0.48 | 16 | 1.00 | 1.00 | 10 | 3b | NA | 10 | 2 | NA | ||||
| 15 | 10 | 0.80 | 0.80 | NA | 10 | 3a | NA | 10 | 1.00 | NA | ||||||
| 16 | 10 | 1.00 | 1.00 | 11 | 1.00 | 1.10 | 11 | 3b | NA | 11 | 2 | NA | ||||
| 17 | 10 | 0.30 | 0.30 | 14 | 0.30 | 0.30 | 10 | 3b | NA | 10 | 2 | NA | ||||
| 18 | 11 | 0.50 | 0.40 | NA | 11 | 3b | NA | 11 | 2 | NA | ||||||
| 19 | 11 | 0.30 | 0.30 | NA | 11 | 3a | NA | NA | NA | |||||||
| 20 | 11 | 0.78 | 0.78 | NA | 11 | 3b | 12 | 3b | 11 | 2 | 12 | 2 | ||||
| 21 | 11 | 0.54 | 0.12 | 13 | 0.80 | 0.30 | 13 | 2 | NA | 13 | 2 | NA | ||||
| 22 | 11 | 1.00 | 1.00 | 16 | 1.00 | NA | 13 | 3b | 15 | 3b | 15 | 2 | NA | |||
| 23 | 12 | 0.18 | 0.18 | NA | 16 | 3b | NA | NA | NA | |||||||
| 24 | 12 | 1.00 | 0.90 | 15 | 1.00 | 1.00 | 12 | 3b | 15 | 3b | 12 | 2 | 15 | 2 | ||
| 25 | 12 | 1.30 | 1.30 | 16 | 1.30 | 1.18 | 12 | 3b | 15 | 3b | 13 | 2 | 16 | 2 | ||
| 26 | 12 | 1.00 | 1.00 | 16 | 1.00 | 1.00 | 12 | 3a | 16 | 3b | ✓ | 16 | 2 | NA | ||
| 27 | 13 | 0.50 | 0.60 | NA | 13 | 3a | NA | 13 | 1 | NA | ||||||
| 28 | 13 | 1.30 | 1.10 | 15 | 1.10 | 0.88 | 14 | 3b | NA | 14 | 2 | 15 | 2 | |||
| 29 | 13 | 1.00 | 1.18 | 16 | 0.78 | 0.78 | 15 | 3b | NA | NA | NA | |||||
| 30 | 14 | 0.90 | 0.80 | NA | 15 | 3b | NA | 15 | 2 | NA | ||||||
| 31 | 14 | 0.48 | 0.48 | NA | 14 | 3a | NA | 14 | 1 | NA | ||||||
| 32 | 14 | 1.00 | 1.00 | 15 | 1.00 | 1.00 | NA | NA | NA | NA | ||||||
| 33 | 14 | 0.18 | 0.20 | 16 | 0.36 | 0.36 | 16 | 3a | NA | 16 | 1 | NA | ||||
| 34 | 15 | 1.00 | 1.00 | NA | 15 | 3b | NA | 15 | 2 | NA | ||||||
| 35 | 15 | 0.50 | 0.50 | NA | 15 | 3a | NA | 15 | 1 | NA | ||||||
| 36 | 15 | 1.00 | 1.00 | 16 | 1.00 | 1.00 | 16 | 3b | NA | 16 | 2 | NA | ||||
| 37 | 15 | 0.18 | 0.18 | 16 | 0.75 | 0.56 | 15 | 3b | 16 | 3b | 16 | 1 | NA | |||
| 38 | 15 | 1.00 | 1.00 | 16 | 1.08 | 1.00 | 16 | 3b | NA | NA | NA | |||||
| 39 | 15 | 0.80 | 0.80 | 16 | 0.80 | 0.80 | 15 | 3b | NA | 15 | 1 | NA | ||||
| 40 | 16 | 0.48 | 0.48 | NA | NA | NA | NA | NA | ||||||||
| 41 | 16 | 1.00 | 1.00 | NA | NA | NA | NA | NA | ||||||||
| 42 | 16 | 0.18 | 0.18 | NA | 16 | 3a | NA | 16 | 1 | NA | ||||||
AF type = autofluorescence type; BL = baseline; Fds type = fundus type; FU = follow-up; L = left; NA; LogMAR VA = logarithm of the minimum angle of resolution visual acuity; NA = not available; Pt = patient; R = right;
The median logMAR VA at baseline in the 24 patients that were monitored was 0.75 in the right eye and 0.75 in the left eye (range, 0.10–1.30 and 0.12–1.30, respectively); the median logMAR VA at follow-up was 1.00 in the right and 1.00 in the left eye (range, 0.05–1.40 and 0.20–1.60, respectively) at a median age of 15.0 years (range, 12–16). Fifteen patients (15/42; 36%) had logMAR or ≤1.0 VA in the better eye at baseline. Thirteen of 24 patients (54%) with available follow-up data had logMAR VA of ≤1.0 in the better eye at follow-up (range, 11–16). Follow-up data were available in 14 of 27 patients with VA better than logMAR 1.0 in the better eye at baseline; 6 (43%) had logMAR of ≤1.0 VA in the better eye at follow-up (range, 13–15).
Color fundus photographs, AF images, and SD-OCT images of 5 representative cases are shown in Figure 1. Baseline color fundus photographs were obtained in 39 patients (Table 2). Among the 39 patients, there was 1 (2.5%) with a grade 1 fundus appearance at baseline, 1 (2.5%) with grade 2, 11 (28%) with grade 3a, and 26 (67%) with grade 3b. There were no patients with a grade 3c or grade 4 fundus appearance. Central atrophy was present in 37 of the 39 patients (95%) at baseline; flecks were detected at the macula in 4 of the 39 patients (10%) and in the periphery in 23 (59%), with no visible flecks in 12 individuals (31%; Table 2). Retinal pigmentation was present in 2 of the 39 patients (5%; patients 24 and 34).
Figure 1.
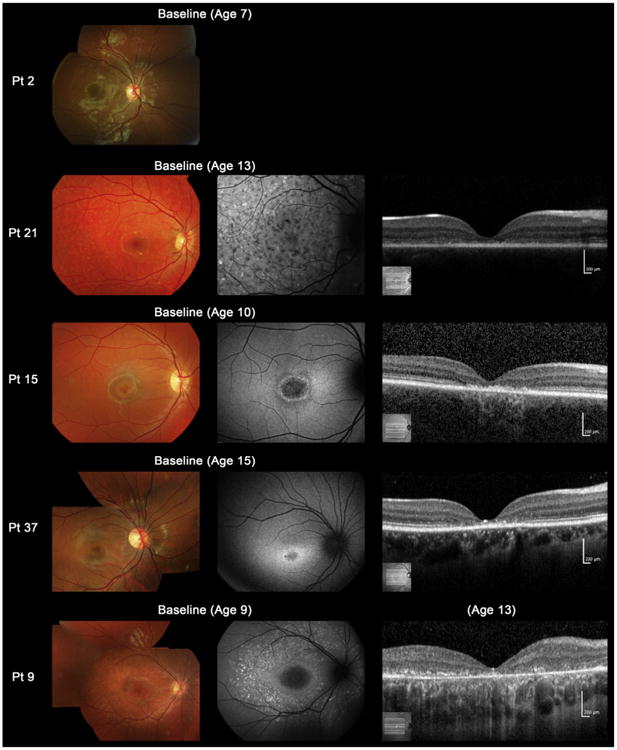
Color fundus photographs, autofluorescence, and spectral-domain optical coherence tomographic images of 5 representative cases with childhood-onset Stargardt Disease (patients 2, 21, 15, 37, and 9). Color fundus photographs of patient 2 shows normal findings at age 7 (fundus grade: 1). Patient 21 has numerous flecks at the posterior pole without central atrophy (fundus grade: 2) and autofluorescence (AF) imaging demonstrates widespread multiple foci of high and low AF signal at the posterior pole with a heterogeneous background (AF type 2). Spectral-domain optical coherence tomography (SD-OCT) identifies marked outer retinal loss at the central macula. Patient 15 has central atrophy without flecks (fundus grade: 3a) and AF imaging demonstrates a localized low AF signal at the fovea with a high signal edge surrounded by a homogeneous background (AF type: 1). SD-OCT detects marked outer retinal loss at the central macula. Patient 37 has central atrophy with macular flecks (fundus grade: 3b) and a localized low AF signal at the fovea surrounded by a homogeneous background with perifoveal foci of high signal (AF type: 1). SD-OCT shows outer retinal loss at the central macula. Patient 9 has central atrophy with peripheral flecks extending anterior to the vascular arcades (fundus grade: 3b) and a localized low AF signal at the macula surrounded by a heterogeneous background and widespread foci of high AF signal extending anterior to the vascular arcades (AF type: 2). SD-OCT reveals outer retinal disruption at the macula. Pt = patient.
Serial color fundus photographs were available in 14 patients (Table 3), 3 of whom showed a fundus grade transition. Macular flecks, which were not present at baseline, developed in 2 subjects (patients 7 and 13) and macular and peripheral flecks became visible in 1 individual (patient 26). Color fundus photographs and AF images of 4 representative cases who developed flecks during the follow-up interval are shown in Figure 2.
Figure 2.
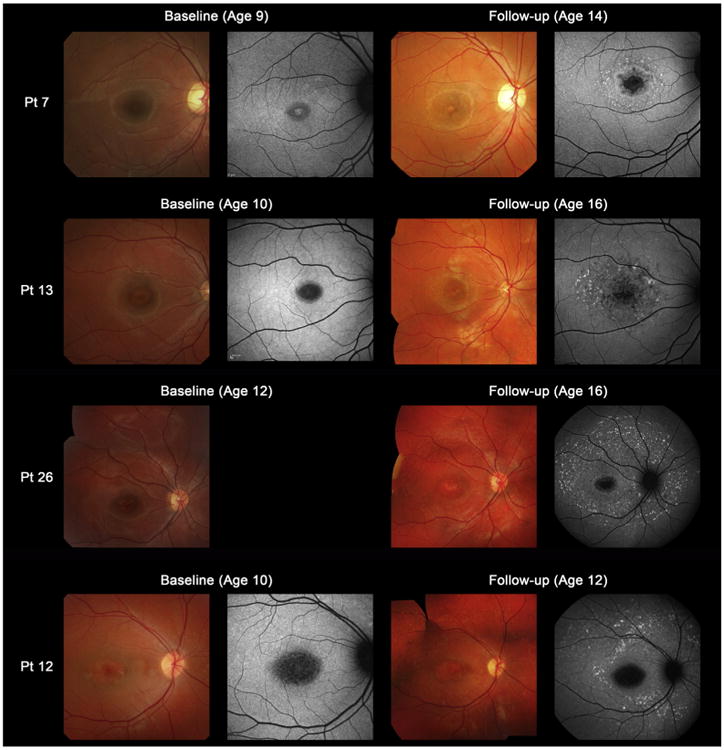
Color fundus photographs and autofluorescence (AF) images of 4 representative cases developing macular flecks during follow-up (patients 7, 13, 26, and 12). Color photograph of patient 7 at baseline shows subtle central atrophy without flecks (fundus grade 3a). At baseline, AF imaging demonstrates a localized low AF signal surrounded by an irregular high signal (AF type 1). Five years later, there is marked central atrophy with visible macular flecks (fundus grade 3b) and AF imaging demonstrates a localized low AF signal at the fovea with perifoveal foci of high signal (AF type 1). Patient 13 shows central atrophy with no visible flecks at baseline (fundus grade 3a), with AF imaging showing a localized low AF signal surrounded by subtle foci of high AF signal at the macula (AF type 1). Six years later, there are marked and increased macular flecks, also clearly seen on AF imaging (fundus grade 3b; AF type 1). Patient 26 has central atrophy with no visible flecks at baseline (fundus grade 3a), but marked flecks corresponding to foci of high signal on AF imaging are present 4 years later (fundus grade 3b; AF type 2). Patient 12 shows central atrophy with early subtle peripheral flecks at baseline (fundus grade 3b) and AF imaging demonstrates a localized low AF signal with subtle foci of high AF signal extending anterior to the vascular arcades (AF type 2). Two years later, there are marked and increased macular and peripheral flecks, which are also well-defined on AF imaging (fundus grade 3b; AF type 2). Pt = patient.
Patients 17 and 18 had fine dots at the central macula surrounded by numerous peripheral flecks, classified into fundus grade 3b (patient 17; Fig 3). Clinical and molecular genetic data of these 2 patients have been previously described.9 Only 1 patient had asymmetric fundus findings, with a central atrophic-appearing lesion with peripheral flecks extending anterior to the vascular arcades in the right eye, and macular atrophy with flecks, subretinal fibrosis, and hyperpigmentation at the level of RPE in the left eye (patient 29; Fig 3).
Figure 3.
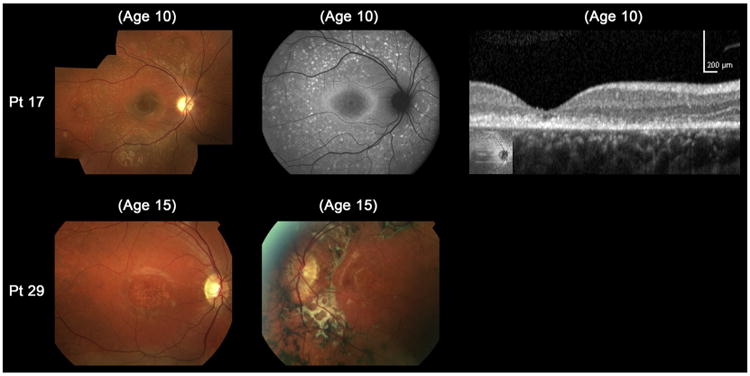
Color fundus photographs, autofluorescence (AF), and spectral-domain optical coherence tomographic images of 2 molecularly proven cases with “atypical” clinical features of childhood-onset Stargardt Disease (patients 17 and 29). Color photograph of patient 17 shows fine dots at the central macula surrounded by numerous peripheral flecks and AF imaging demonstrates well-defined dots associated with a high signal at the central macula surrounded by a ring of increased AF signal and numerous foci with high and low signal extending to the peripheral retina. Outer retinal loss at the macula is present on SD-OCT. Patient 29 has asymmetric fundus findings with central atrophy and peripheral flecks in the right eye and macular atrophy with flecks, subretinal fibrosis, and hyperpigmentation at the level of the retinal pigment epithelium in the left eye. Pt = patient.
We obtained AF images for 32 patients at baseline (Table 2). There were 10 of the 32 patients (31%) with type 1 AF pattern, 22 (69%) with type 2 AF, and no subjects with type 3 AF. Serial AF images were obtained in 11 patients during the follow-up interval (Table 3); no patient demonstrated an AF grouping transition.
We obtained SD-OCT images for 21 patients at baseline (Table 2). Outer retinal disruption at the fovea was present in all 21 patients. The median central foveal thickness of the right and left eyes was 60.0 and 55.0 μm, respectively (range, 33–138 and 35–140, respectively). Eighteen of the 21 patients (86%) had severe foveal thinning in both eyes (<100 μm).
Electrophysiologic assessment was performed in 25 patients at baseline (Table 2). Nine of the 25 patients (36%) were in ERG group 1 (isolated macular dysfunction),1 (4%) was in ERG group 2,and 15 (60%) were in ERG group 3 (generalized cone and rod dysfunction).
Molecular Genetics
Detailed molecular genetic results including in silico analysis to assist in the prediction of pathogenicity of the variants are shown in Table 4 (available at www.aaojournal.org). Forty-six ABCA4 variants were identified: 27 missense, 7 splice-site alterations, 7 nonsense, 3 frameshifts, 1 in-frame duplication, and 1 definitely disease-associated intronic variant for which the exact pathogenic mechanism is not known. Thirteen novel definitely or highly likely disease-causing variants were identified: p.Gln8fs, p.Cys519*, p.Asp586Gly, p.Arg587Lys, p.Glu905fs, p.Tyr1027*, p.Met1066-Arg, p.Arg1097*, p.Thr1721fs, p.Tyr1770Asp, p.Ala1739dup, p.Ser2072Asn, and c.6817-2A>C (Table 4). Four homozygous variants (p.Glu905fs, p.Glu1022Lys, p.Tyr1027*, and c.64719+1G>A) were identified in patients from consanguineous families and the other 42 variants were detected in heterozygous state. Four of 8 patients from consanguineous families had homozygous variants (patients 3, 5, 6, and 28), 2 had compound heterozygous variants (patients 2 and 17), and 2 had no variants identified (patients 1 and 4).
Table 4. Suggested Pathogenicity of the 46 ABCA4 Variants Identified in Childhood-onset Stargardt Disease.
| Exon/ IVS |
Nucleotide substitution |
Protein change/effect |
Number of alleles identified |
Pt | Reference | SIFT | Polyphen2 | HSF | Allelic frequency observed by EVS |
db SNP | |||
|---|---|---|---|---|---|---|---|---|---|---|---|---|---|
| Prediction | Prediction | Hum var score (0-1) |
Wild type CV |
Mutant CV |
effect | ||||||||
| 1 | c.21dupA | p.Gln8fs | 1 | 20 | This study | ND | |||||||
| 6 | c.634C>T | p.Arg212Cys | 1 | 7 | Simonelli F et al.30 | Not tolerated | PRD | 0.951 | 0.0116 | rs61750200 | |||
| 6 | c.768G>T | Splice | 1 | 17 | Klevering et al.28 | 91.6 | 80.7 | weakens the splice donor site by ∼12% | ND | ||||
| 10 | c.1317G>A | p.Trp439* | 1 | 21 | Fujinami et al.5 | ND | |||||||
| 11 | c.1531C>T | p.Arg511Cys | 1 | 37 | Zernant et al.22 | Not tolerated | PRD | 0.976 | ND | ||||
| 12 | c.1557C>A | p.Cys519* | 1 | 12 | This study | ND | |||||||
| 12 | c.1648G>A | p.Gly550Arg | 1 | 26 | Shroyer et al.27 | Not tolerated | POD | 0.882 | 0 | 81.58 | creates a new splice acceptor site | ND | |
| 12 | c.1757A>G | p.Asp586Gly | 1 | 39 | This study | Not tolerated | POD | 0.599 | ND | ||||
| 12 | c.1760G>A | p.Arg587Lys | 1 | 29 | This study | Not tolerated | POD | 0.749 | 84.6 | 74 | weakens the splice donor site by ∼13% | ND | |
| 13 | c.1906C>T | p.Gln636* | 3 | 2, 18, 30 | Zernant et al.22 | 0.0116 | rs145961131 | ||||||
| 14 | c.1957C>T | p.Arg653Cys | 1 | 36 | Rivera et al.25 | Not tolerated | PRD | 0.999 | ND | ||||
| 16 | c.2564G>A | p.Trp855* | 1 | 29 | Rivera et al.25 | rs61752406 | |||||||
| 17 | c.2588G>C | p.Gly863Ala/ p.Gly863del | 2 | 25, 27 | Lewis et al.24/Maugeri et al.34 | Not tolerated | POD | 0.864 | 0.6744 | rs76157638 | |||
| 18 | c.2712delG | p.Glu905fs | 2 | 5 | This study | ND | |||||||
| 19 | c.2861A>C | p.Tyr954Ser | 1 | 16 | Aguirre-Lamban et al.32 | Not tolerated | PRD | 0.959 | ND | ||||
| 21 | c.3056C>T | p.Thr1019Met | 1 | 31 | Rozet et al.23 | Not tolerated | PRD | 1.000 | ND | rs201855602 | |||
| 21 | c.3064G>A | p.Glu1022Lys | 2 | 28 | Webster et al.26 | Not tolerated | PRD | 1.000 | ND | rs61749459 | |||
| 21 | c.3081T>G | p.Tyr1027* | 2 | 8 | This study | ND | |||||||
| 22 | c.3197T>G | p.Met1066Arg | 1 | 38 | This study | Not tolerated | POD | 0.495 | ND | ||||
| 22 | c.3259G>A | p.Glu1087Lys | 1 | 10 | Lewis et al. 1999 | Not tolerated | PRD | 0.997 | ND | rs61751398 | |||
| 22 | c.3289A>T | p.Arg1097* | 1 | 6 | This study | ND | |||||||
| 22 | c.3322C>T | p.Arg1108Cys | 2 | 11, 13 | Rozet et al.23 | Not tolerated | PRD | 0.986 | 0.0116 | rs61750120 | |||
| 23 | c.3364G>A | p.Glu1122Lys | 1 | 25 | Lewis et al.24 | Not tolerated | PRD | 1.000 | ND | rs61751399 | |||
| 23 | c.3385C>T | p.Arg1129Cys | 1 | 42 | Zernant et al.22 | Not tolerated | PRD | 0.998 | ND | ||||
| 28 | c.4139C>T | p.Pro1380Leu | 3 | 21, 34, 36 | Lewis et al.24 | Not tolerated | PRD | 0.99 | 0.0233 | rs61750130 | |||
| 28 | c.4216C>T | p.His1406Tyr | 1 | 14 | Lewis et al.24 | Not tolerated | POD | 0.824 | ND | rs61750133 | |||
| 28 | c.4222T>C | p.Trp1408Arg | 1 | 14 | Lewis et al.24 | Not tolerated | PRD | 0.973 | ND | rs61750135 | |||
| 30 | c.4363T>C | p.Cys1455Arg | 2 | 17, 24 | Fujinami et al.5 | Not tolerated | PRD | 0.999 | ND | ||||
| 30 | c.4469G>A | p.Cys1490Tyr | 4 | 9, 11, 38, 42 | Lewis et al.24 | Not tolerated | PRD | 0.994 | ND | rs61751402 | |||
| 31 | c.4577C>T | p.Thr1526Met | 1 | 13 | Lewis et al.24 | Not tolerated | PRD | 0.999 | ND | rs61750152 | |||
| 36 | c.4918C>T | p.Arg1640Trp | 1 | 14 | Briggs et al.22 | Not tolerated | PRD | 0.999 | ND | ||||
| 36 | c.5160_5161delCA | p.Thr1721fs | 1 | 27 | This study | ND | rs61750566 | ||||||
| 37 | c.5308T>G | p.Tyr1770Asp | 1 | 34 | This study | Not tolerated | PRD | 1.000 | ND | ||||
| 37 | c.5213_5214insTGC | p.Ala1739dup | 1 | 37 | This study | ND | |||||||
| 42 | c.5882G>A | p.Gly1961Glu | 5 | 31, 33, 35, 37, 39 | Lewis et al.24 | Not tolerated | PRD | 1.000 | 0.4186 | rs1800553 | |||
| 44 | c.6079C>T | p.Leu2027Phe | 3 | 22, 40, 41 | Lewis et al.24 | Not tolerated | PRD | 1.000 | 0.0349 | rs61751408 | |||
| 44 | c.6088C>T | p.Arg2030* | 2 | 2, 25 | Lewis et al.24 | ND | rs61751383 | ||||||
| 45 | c.6215G>A | p.Ser2072Asn | 1 | 32 | This study | Not tolerated | PRD | 1.000 | ND | ||||
| 47 | c.6449G>A | p.Cys2150Tyr | 1 | 26 | Fishman et al.16 | Not tolerated | PRD | 1.000 | 0.0116 | rs61751384 | |||
| IVS35 | c.5018+2T>C | splice | 1 | 32 | Fujinami et al.8 | 81.15 | 0 | eliminates the splice donor site | ND | ||||
| IVS36 | c.5196+1G>A | splice | 1 | 6 | Shroyer et al.27 | 83.28 | 0 | eliminates the splice donor site | ND | ||||
| IVS38 | c.5461-10T>C | Uncertain | 9 | 7, 9, 10, 15, 16, 18, 20, 22, 41 | Briggs et al.20 | 0.0349 | rs1800728 | ||||||
| IVS40 | c.5714+5G>A | splice | 1 | 24 | Cremers et al.19 | 85.49 | 73.33 | weakens the splice donor site by ∼14% | 0.1512 | ||||
| IVS47 | c.6479+1G>A | splice | 2 | 3 | Zernant et al.22 | 87.25 | 0 | eliminates the splice donor site | ND | ||||
| IVS48 | c.6729+4_6729+18d elAGTTGGCCCTG GGGC | splice | 1 | 33 | Littink et al.31 | ND | |||||||
| IVS49 | c.6817-2A>C | splice | 1 | 30 | This study | 93.6 | 0 | eliminates the splice acceptor site | ND | ||||
CV = consensus value; EVS = Exon variant server; Het = heterozygous; Hom = homozygous; HSF = human splicing finder; Hum Var Score = human var score; IVS = intervening sequence; NA = not applicable; ND= not detected; POD = possibly damaging; PRD = probably damaging; Pt = patient; SIFT = Sorting Intolerant From Tolerant ; WT = wild type.
SIFT (version 4.0.4) results are reported to be tolerant if tolerance index ≥ 0.05 or intolerant if tolerance index < 0.05. [http://sift.bii.a-star.edu.sg/www/SIFT_BLink_submit.html/. Accessed February 1, 2013.] Polyphen 2 (vision 2.1) appraises mutations qualitatively as Benign, Possibly Damaging or Probably Damaging based on the model's false positive rate. [http://genetics.bwh.harvard.edu/pph2/. Accessed November 1, 2013.] HumanVar-trained model of Polyphen 2 was selected, since diagnostics of mendelian diseases requires distinguishing mutations with drastic effects from all the remaining human variation, including abundant mildly deleterious alleles. The cDNA is numbered according to Ensemble transcript ID ENST00000370225, in which +1 is the A of the translation start codon. Human Splicing Finder (HSF, version 2.4.1) reports the results from the HSF matrix: the higher the consensus value, the stronger the predicted splice site. The values for the wildtype and mutant sequences are shown; the larger the difference between these values, the greater the chance that the variant can affect splicing [http://www.umd.be/HSF/. Accessed November 1, 2013.]. EVS denotes the allele frequencies of variants on the Exome Variant Server, NHLBI Exome Sequencing Project, Seattle, WA, USA. [http://snp.gs.washington.edu/EVS/. Accessed Febrary 1, 2013.]
At least 1 disease-causing ABCA4 variant was detected in 38 of the 42 patients (90%); of these, ≥2 variants were identified in 34 (81%) and 1 variant in 4 (9.5%; Tables 2 and 4). Only 4 of the 42 individuals (9.5%) had no variants identified. The 34 patients harboring ≥2 disease-causing variants were classified based on the number and mutation type (with suggested severity) into 3 genotype subgroups: 7 patients (21%) in genotype group A, 15 (44%) in group B, and 12 (35%) in group C (Table 2).
Comparison Between Childhood-Onset and Adult-Onset STGD
Sixty-four patients with adult-onset STGD harboring ≥2 disease-causing ABCA4 variants were reviewed. The clinical and molecular genetic data were compared between 34 patients with childhood-onset STGD harboring ≥2 disease-causing ABCA4 variants and the aforementioned 64 patients with adult-onset STGD (Table 5, available at www.aaojournal.org; Fig 4).
Table 5. Comparison of Clinical Characteristics, Genotype, and Allele Frequency of the Prevalent Variants between Childhood-onset and Adult-onset Stargardt Disease with two or more disease-causing ABCA4 variants.
| Childhood-onset Stargardt disease (n=34) | Adult-onset Stargardt disease (n=64) | |||||||||||
|---|---|---|---|---|---|---|---|---|---|---|---|---|
| Median age of onset (yrs) | 8.5 (3-14) | 27.0 (17-65) | ||||||||||
| Median age at examination (yrs) | 11.5 (7-16) | 44.0 (21-71) | ||||||||||
| Median LogMAR VA of the right eye | 0.79 (0.18-1.30) | 1.00 (-0.08-2.00) | ||||||||||
|
| ||||||||||||
| Fundus Appearance | Total (n=32) | Total (n=64) | ||||||||||
| Grade 1 | Grade 2 | Grade 3a | Grade 3b | Grade 3c | Grade 4 | Grade 1 | Grade 2 | Grade 3a | Grade 3b | Grade 3c | Grade 4 | |
| 1 | 1 | 8 | 22 | 0 | 0 | 0 | 6 | 4 | 34 | 12 | 8 | |
| Flecks | No flecks | Flecks | No flecks | |||||||||
| Macular | Peripheral | Macular | Peripheral | |||||||||
| 2 | 21 | 9 | 14 | 39 | 11 | |||||||
| Pigmentation | No pigmentation | Pigmentation | No pigmentation | |||||||||
| 2 | 30 | 29 | 35 | |||||||||
|
| ||||||||||||
| Autofluorescence Pattern | Total (n=29) | Total (n=62) | ||||||||||
| Type 1 | Type 2 | Type 3 | Type 1 | Type 2 | Type 3 | |||||||
| 8 | 21 | 0 | 20 | 33 | 9 | |||||||
|
| ||||||||||||
| OCT, CFT (μm) of the right eye | Total (n=19) | Total (n=33) | ||||||||||
| 61.0 (33-138) | 81.0 (20-297) | |||||||||||
|
| ||||||||||||
| ERG group | Total (n=18) | Total (n=59) | ||||||||||
| Group 1 | Group 2 | Group 3 | Group 1 | Group 2 | Group 3 | |||||||
| 7 | 1 | 10 | 34 | 7 | 18 | |||||||
|
| ||||||||||||
| Genotype group classification | Total (n=34) | Total (n=64) | ||||||||||
| Group A | Group B | Group C | Group A | Group B | Group C | |||||||
| 7 | 15 | 12 | 3 | 26 | 35 | |||||||
|
| ||||||||||||
| Frequencies of the most prevalent variants | c.5461-10T>C | p.Gly1961Glu | p.Cys1490Tyr | p.Gly1961Glu | p.Gly863Ala | p.Leu2027Phe | ||||||
| 8 (11.8%) | 4 (5.9%) | 4 (5.9%) | 16 (12.5%) | 13 (10.1%) | 8 (6.3%) | |||||||
AF type = autofluorescence type; CFT = central foveal thickness; ERG = electroretinogram; LogMAR VA = logarithm of the minimum angle of resolution visual acuity; OCT = optical coherence tomography.
In order to investigate the differences between the patients with childhood-onset Stargardt Disease (STGD) and those with adult-onset STGD, clinical and molecular genetic data of patients with adult-onset STGD ascertained at Moorfields Eye Hospital were reviewed. The comparison group consisted of all patients who had adult-onset STGD (older than 17 years old), and two or more disease-causing ABCA4 variants. For the purpose of this comparison, 34 patients with childhood-onset STGD and two or more disease-causing ABCA4 variants were selected.
Figure 4.
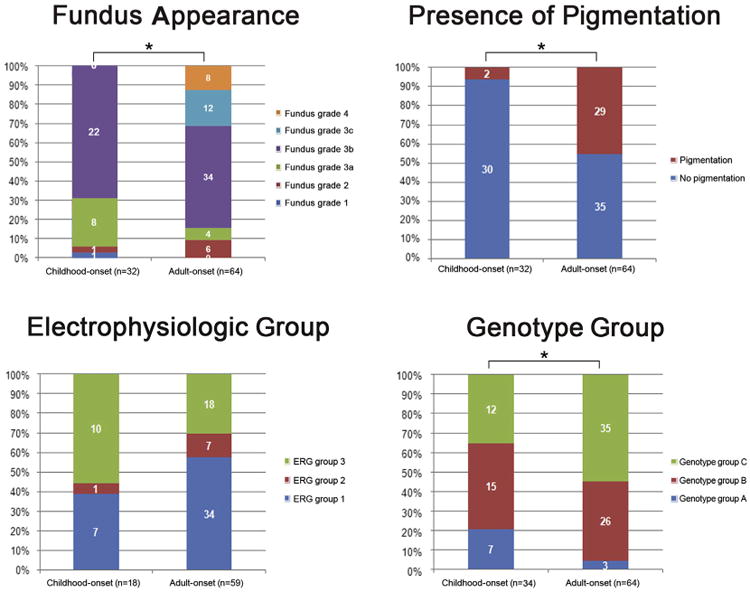
Comparison of the distribution of fundus appearances, presence of pigmentation, electrophysiologic group, and genotype group between a cohort with childhood-onset Stargardt disease and a group with adult-onset Stargardt disease. There are significant differences in terms of fundus appearance classification, presence of pigmentation, and genotype group classification (*P < 0.05). A higher proportion of patients with childhood-onset Stargardt disease are in electrophysiologic group 3 compared with adult-onset Stargardt disease, but this difference does not attain significance. ERG = electroretinography.
There were significant differences in terms of fundus appearance classification (chi-square = 23.2; P = 0.001), presence of pigmentation (chi-square = 14.9; P = 0.000), genotype group classification (chi-square = 7.3; P = 0.003), and central foveal thickness in the selected eye (P = 0.012; Table 5, available at www.aaojournal.org; Figs 4 and 5, available at www.aaojournal.org); with childhood-onset STGD being associated with less retinal pigmentation, a greater proportion of patients harboring deleterious alleles, and a thinner central fovea. No differences were identified in terms of location of flecks (chi-square = 4.0; P = 0.136), AF pattern (chi-square = 5.6; P = 0.061), electrophysiologic group (chi-square = 3.8; P = 0.148), or logMAR VA in the selected eye (P = 0.781). However, a greater proportion of patients with childhood-onset STGD were in ERG group 3 (10/18; 56%) compared with adult-onset STGD (18/59 [31%]; Table 5; Fig 4), but the difference, although showing a strong trend, did not attain significance (Fig 4).
Discussion
This manuscript reports a series of childhood-onset patients with molecularly confirmed STGD, and compares the genetic, clinical, and electrophysiologic data with those in an adult-onset group.
The classical phenotype of STGD is characterized by the presence of yellowish-white fundus flecks and macular atrophy, but the fundus appearance can be variable.1,3,12,13 Fishman described 4 groups based on fundus appearance and electrophysiologic findings3; the author did not distinguish between childhood-onset and adult-onset disease. In addition, the classification did not fully encompass the range of phenotypes present in childhood-onset disease and thus was modified for the present study (Table 1). Most children in this study had the classical fundus appearance of STGD with macular atrophy and macular and/or peripheral flecks, but one third of children had no visible flecks at presentation. Subsequent development of flecks was observed during the follow-up interval in 3 of these 12 patients (Fig 2). Similar development of macular/peripheral flecks over time have also been described in a young adult patient with STGD.18
There were no children with paracentral atrophy without central atrophy (observed in the foveal sparing phenotype, a milder phenotype seen in a minority of patients with STGD). 7,11,13,15 This observation is in keeping with previous reports that patients with a foveal sparing phenotype typically present in later adult life.7,15 The subset with a foveal-sparing phenotype show relatively preserved foveal structure, which results in a relatively wide CFT range in the adult-onset STGD group (Fig 5).
Marked disruption of foveal outer retinal structure was present on SD-OCT in all children imaged, indicating that changes in foveal structure occur early in the disease process. Visual loss may precede ophthalmoscopic abnormalities in childhood-onset STGD and this may lead to nonorganic visual loss being considered. In such cases, SD-OCT imaging and/or electrophysiologic assessment will avoid misdiagnosis.18 The early foveal involvement in STGD without flecks, or other AF imaging evidence of increased levels of lipofuscin in the RPE, lend support to the hypothesis that A2E, which is elevated in STGD, may be directly toxic to cone photoreceptors.40,41
Of the 24 patients, 9 (36%) were in ERG group 1, 1 (4%) in ERG group 2, and 15 (60%) in ERG group 3. A greater proportion of patients were in group 3 compared with the cohort with adult-onset disease, indicating that childhood-onset STGD is more likely to be associated with generalized retinal dysfunction. This is further evidence for childhood-onset STGD having a more severe retinal phenotype. 5,6,35
Twenty-two patients (58%) had ≥1 deleterious variant and 7 subjects (18%) had 2 deleterious variants, which was significantly higher than observed in the adult-onset cohort (45% and 5%, respectively). The 5 patients (71%) with available ERGs in genotype group A (harboring 2 deleterious variants) all had generalized rod and cone system dysfunction (ERG group 3). These findings when taken together suggest that patients harboring deleterious ABCA4 variants are more likely to have an earlier presentation (childhood) and a more severe functional phenotype.5
There are potential limitations of this study, including the definition of age of onset and choosing to classify childhood-onset as before the age of 17. The age of onset was defined as either the age at first symptom or the age when a retinal abnormality was first detected in “asymptomatic” patients. These 2 groups (symptomatic and asymptomatic) may have different clinical characteristics, including the symptomatic patients would be expected to have foveal involvement and thereby reduced VA. However, the vast majority of children were symptomatic in our cohort. It is also possible that dividing patients by age 17 may potentially introduce a selection bias.
This study specifically addresses, for the first time, the clinical features and molecular genetic findings of childhood-onset STGD in a substantial group of patients. Childhood-onset disease is associated with more severe VA loss from the early stages of disease. The classical flecks are not always present at diagnosis, but can appear later in the course of disease. Generalized cone and rod system dysfunction is more common than in adult-onset disease, in keeping with a more severe phenotype. Two or more disease-causing variants were detected in >80% of children and a higher proportion of definitely or possibly deleterious variants were demonstrated compared with adult-onset STGD, which is likely to underlie the earlier onset and more severe phenotype in childhood. The rapid deterioration of function in childhood-onset disease suggests that the investigation of novel therapies in this age group is more likely to lead to timely recognition of any treatment effect compared with adults with more slowly progressive disease.
Supplementary Material
Figure 5 Age of onset compared to logarithm of the minimum angle of resolution visual acuity and central foveal thickness for comparison between childhood-onset Stargardt disease and adult-onset Stargardt disease. Scatter plots for the following parameters are shown; age of onset and logarithm of the minimum angle of resolution (logMAR) visual acuity, and age of onset and central foveal thickness (CFT) measured by spectral-domain optical coherence tomography (SD-OCT). The data of the selected eye of childhood-onset Stargardt disease (STGD) group are shown in blue and those from adult-onset STGD group shown in red. There was a significant difference detected by the Mann-Whitney U test between childhood-onset STGD and adult-onset STGD in terms of CFT; no significant difference was revealed in logMAR visual acuity.
Acknowledgments
The authors thank Arundhati Dev Borman, Panagiotis I. Sergouniotis, Eva Lenassi, and Yozo Miyake for data collection and insightful comments.
Supported by grants from the National Institute for Health Research Biomedical Research Center at Moorfields Eye Hospital NHS Foundation Trust and UCL Institute of Ophthalmology (UK), Foundation Fighting Blindness (USA), Fight for Sight (UK), Moorfields Eye Hospital Special Trustees (UK), Macular Disease Society (UK), National Eye Institute EY021163, EY019861, and EY019007 (Core Support for Vision Research), unrestricted funds from Research to Prevent Blindness (New York, NY) to the Department of Ophthalmology, Columbia University, Suzuken Memorial Foundation (Japan), Mitsukoshi Health and Welfare Foundation (Japan), and Daiwa Anglo-Japanese Foundation (Japan), Grant-in-Aid for Young Scientists (B) of the Ministry of Education, Culture, Sports, Science and Technology (Japan). MM is supported by a Foundation Fighting Blindness Career Development Award (USA). ATM is the Chairman of the Data Safety and Management Committee of an Oxford Biomedica sponsored clinical trial of gene replacement therapy for Stargardt disease.
Footnotes
Supplemental material is available at www.aaojournal.org.
Financial Disclosure(s): The author have no proprietary or commercial interest in any materials discussed in this article. The sponsor or funding organization had no role in the design or conduct of this research.
References
- 1.Michaelides M, Hunt DM, Moore AT. The genetics of inherited macular dystrophies. J Med Genet. 2003;40:641–50. doi: 10.1136/jmg.40.9.641. [DOI] [PMC free article] [PubMed] [Google Scholar]
- 2.Allikmets R, Singh N, Sun H, et al. A photoreceptor cell-specific ATP-binding transporter gene (ABCR) is mutated in recessive Stargardt macular dystrophy. Nat Genet. 1997;15:236–46. doi: 10.1038/ng0397-236. [DOI] [PubMed] [Google Scholar]
- 3.Fishman GA. Fundus flavimaculatus. A clinical classification. Arch Ophthalmol. 1976;94:2061–7. doi: 10.1001/archopht.1976.03910040721003. [DOI] [PubMed] [Google Scholar]
- 4.Michaelides M, Chen LL, Brantley MA, Jr, et al. ABCA4 mutations and discordant ABCA4 alleles in patients and siblings with bull's-eye maculopathy. Br J Ophthalmol. 2007;91:1650–5. doi: 10.1136/bjo.2007.118356. [DOI] [PMC free article] [PubMed] [Google Scholar]
- 5.Fujinami K, Lois N, Davidson AE, et al. A longitudinal study of Stargardt disease: clinical and electrophysiologic assessment, progression, and genotype correlations. Am J Ophthalmol. 2013;155:1075–88. doi: 10.1016/j.ajo.2013.01.018. [DOI] [PubMed] [Google Scholar]
- 6.Fujinami K, Sergouniotis PI, Davidson AE, et al. The clinical effect of homozygous ABCA4 alleles in 18 patients. Ophthalmology. 2013;120:2324–31. doi: 10.1016/j.ophtha.2013.04.016. [DOI] [PubMed] [Google Scholar]
- 7.Fujinami K, Sergouniotis PI, Davidson AE, et al. Clinical and molecular analysis of Stargardt disease with preserved foveal structure and function. Am J Ophthalmol. 2013;156:487–501. doi: 10.1016/j.ajo.2013.05.003. [DOI] [PubMed] [Google Scholar]
- 8.Fujinami K, Zernant J, Chana RK, et al. ABCA4 gene screening by next-generation sequencing in a British cohort. Invest Ophthalmol Vis Sci. 2013;54:6662–74. doi: 10.1167/iovs.13-12570. [DOI] [PMC free article] [PubMed] [Google Scholar]
- 9.Fujinami K, Singh R, Carroll J, et al. Fine central macular dots associated with childhood-onset Stargardt Disease. Acta Ophthalmol. 2014;92:e157–9. doi: 10.1111/aos.12259. letter online. [DOI] [PubMed] [Google Scholar]
- 10.Fujianami K, Lois N, Mukherjee R, et al. A longitudinal study of Stargardt disease: quantitative assessment of fundus auto-fluorescence, progression and genotype correlations. Invest Ophthalmol Vis Sci. 2014;54:8181–90. doi: 10.1167/iovs.13-12104. [DOI] [PubMed] [Google Scholar]
- 11.Fujinami K, Akahori M, Fukui M, et al. Stargardt disease with preserved central vision: identification of a putative novel mutation in ATP-binding cassette transporter gene. Acta Ophthalmol. 2011;89:e297–8. doi: 10.1111/j.1755-3768.2009.01848.x. letter online. [DOI] [PubMed] [Google Scholar]
- 12.Burke TR, Tsang SH. Allelic and phenotypic heterogeneity in ABCA4 mutations. Ophthalmic Genet. 2011;32:165–74. doi: 10.3109/13816810.2011.565397. [DOI] [PMC free article] [PubMed] [Google Scholar]
- 13.Rotenstreich Y, Fishman GA, Anderson RJ. Visual acuity loss and clinical observations in a large series of patients with Stargardt disease. Ophthalmology. 2003;110:1151–8. doi: 10.1016/S0161-6420(03)00333-6. [DOI] [PubMed] [Google Scholar]
- 14.Wabbels B, Demmler A, Paunescu K, et al. Fundus auto-fluorescence in children and teenagers with hereditary retinal diseases. Graefes Arch Clin Exp Ophthalmol. 2006;244:36–45. doi: 10.1007/s00417-005-0043-2. [DOI] [PubMed] [Google Scholar]
- 15.Westeneng-van Haaften SC, Boon CJ, Cremers FP, et al. Clinical and genetic characteristics of late-onset Stargardt's disease. Ophthalmology. 2012;119:1199–210. doi: 10.1016/j.ophtha.2012.01.005. [DOI] [PubMed] [Google Scholar]
- 16.Fishman GA, Stone EM, Grover S, et al. Variation of clinical expression in patients with Stargardt dystrophy and sequence variations inthe ABCR gene. Arch Ophthalmol. 1999;117:504–10. doi: 10.1001/archopht.117.4.504. [DOI] [PubMed] [Google Scholar]
- 17.Fumagalli A, Ferrari M, Soriani N, et al. Mutational scanning of the ABCR gene with double-gradient denaturing-gradient gel electrophoresis (DG-DGGE) in Italian Stargardt disease patients. Hum Genet. 2001;109:326–38. doi: 10.1007/s004390100583. [DOI] [PubMed] [Google Scholar]
- 18.Jarc-Vidmar M, Perovsek D, Glavac D, et al. Morphology and function of the retina in children and young adults with Star-gardt dystrophy. Zdrav Vestn. 2012;81(suppl):I-51–60. [Google Scholar]
- 19.Cremers FP, van de Pol DJ, van Driel M, et al. Autosomal recessive retinitis pigmentosa and cone-rod dystrophy caused by splice site mutations in the Stargardt's disease gene ABCR. Hum Mol Genet. 1998;7:355–62. doi: 10.1093/hmg/7.3.355. [DOI] [PubMed] [Google Scholar]
- 20.Briggs CE, Rucinski D, Rosenfeld PJ, et al. Mutations in ABCR (ABCA4) in patients with Stargardt macular degeneration or cone-rod degeneration. Invest Ophthalmol Vis Sci. 2001;42:2229–36. [PubMed] [Google Scholar]
- 21.Allikmets R, Wasserman WW, Hutchinson A, et al. Organization of the ABCR gene: analysis of promoter and splice junction sequences. Gene. 1998;215:111–22. doi: 10.1016/s0378-1119(98)00269-8. [DOI] [PubMed] [Google Scholar]
- 22.Zernant J, Schubert C, Im KM, et al. Analysis of the ABCA4 gene by next-generation sequencing. Invest Ophthalmol Vis Sci. 2011;52:8479–87. doi: 10.1167/iovs.11-8182. [DOI] [PMC free article] [PubMed] [Google Scholar]
- 23.Rozet JM, Gerber S, Souied E, et al. Spectrum of ABCR gene mutations in autosomal recessive macular dystrophies. Eur J Hum Genet. 1998;6:291–5. doi: 10.1038/sj.ejhg.5200221. [DOI] [PubMed] [Google Scholar]
- 24.Lewis RA, Shroyer NF, Singh N, et al. Genotype/phenotype analysis of a photoreceptor-specific ATP-binding cassette transporter gene, ABCR, in Stargardt disease. Am J Hum Genet. 1999;64:422–34. doi: 10.1086/302251. [DOI] [PMC free article] [PubMed] [Google Scholar]
- 25.Rivera A, White K, Stohr H, et al. A comprehensive survey of sequence variation in the ABCA4 (ABCR) gene in Stargardt disease and age-related macular degeneration. Am J Hum Genet. 2000;67:800–13. doi: 10.1086/303090. [DOI] [PMC free article] [PubMed] [Google Scholar]
- 26.Webster AR, Heon E, Lotery AJ, et al. An analysis of allelic variation in the ABCA4 gene. Invest Ophthalmol Vis Sci. 2001;42:1179–89. [PubMed] [Google Scholar]
- 27.Shroyer NF, Lewis RA, Yatsenko AN, et al. Cosegregation and functional analysis of mutant ABCR (ABCA4) alleles in families that manifest both Stargardt disease and age-related macular degeneration. Hum Mol Genet. 2001;10:2671–8. doi: 10.1093/hmg/10.23.2671. [DOI] [PubMed] [Google Scholar]
- 28.Klevering BJ, Blankenagel A, Maugeri A, et al. Phenotypic spectrum of autosomal recessive cone-rod dystrophies caused by mutations in the ABCA4 (ABCR) gene. Invest Ophthalmol Vis Sci. 2002;43:1980–5. [PubMed] [Google Scholar]
- 29.Fishman GA, Stone EM, Eliason DA, et al. ABCA4 gene sequence variations in patients with autosomal recessive cone-rod dystrophy. Arch Ophthalmol. 2003;121:851–5. doi: 10.1001/archopht.121.6.851. [DOI] [PubMed] [Google Scholar]
- 30.Simonelli F, Testa F, Zernant J, et al. Genotype-phenotype correlation in Italian families with Stargardt disease. Ophthalmic Res. 2005;37:159–67. doi: 10.1159/000086073. [DOI] [PubMed] [Google Scholar]
- 31.Littink KW, Koenekoop RK, van den Born LI, et al. Homozygosity mapping in patients with cone-rod dystrophy: novel mutations and clinical characterizations. Invest Ophthalmol Vis Sci. 2010;51:5943–51. doi: 10.1167/iovs.10-5797. [DOI] [PMC free article] [PubMed] [Google Scholar]
- 32.Aguirre-Lamban J, Gonzalez-Aguilera JJ, Riveiro-Alvarez R, et al. Further associations between mutations and polymorphisms in the ABCA4 gene: clinical implication of allelic variants and their role as protector/risk factors. Invest Ophthalmol Vis Sci. 2011;52:6206–12. doi: 10.1167/iovs.10-5743. [DOI] [PubMed] [Google Scholar]
- 33.Riveiro-Alvarez R, Lopez-Martinez MA, Zernant J, et al. Outcome of ABCA4 disease-associated alleles in autosomal recessive retinal dystrophies: retrospective analysis in 420 Spanish families. Ophthalmology. 2013;120:2332–7. doi: 10.1016/j.ophtha.2013.04.002. [DOI] [PMC free article] [PubMed] [Google Scholar]
- 34.Maugeri A, van Driel MA, van de Pol DJ, et al. The 2588G–>C mutation in the ABCR gene is a mild frequent founder mutation in the Western European population and allows the classification of ABCR mutations in patients with Stargardt disease. Am J Hum Genet. 1999;64:1024–35. doi: 10.1086/302323. [DOI] [PMC free article] [PubMed] [Google Scholar]
- 35.Lois N, Holder GE, Bunce C, et al. Phenotypic subtypes of Stargardt macular dystrophy-fundus flavimaculatus. Arch Ophthalmol. 2001;119:359–69. doi: 10.1001/archopht.119.3.359. [DOI] [PubMed] [Google Scholar]
- 36.McBain VA, Townend J, Lois N. Progression of retinal pigment epithelial atrophy in Stargardt disease. Am J Ophthalmol. 2012;154:146–54. doi: 10.1016/j.ajo.2012.01.019. [DOI] [PubMed] [Google Scholar]
- 37.Sergouniotis PI, Davidson AE, Lenassi E, et al. Retinal structure, function, and molecular pathologic features in gyrate atrophy. Ophthalmology. 2012;119:596–605. doi: 10.1016/j.ophtha.2011.09.017. [DOI] [PubMed] [Google Scholar]
- 38.Marmor MF, Fulton AB, Holder GE, et al. International Society for Clinical Electrophysiology of Vision. ISCEV standard for full-field clinical electroretinography (2008 update) Doc Ophthalmol. 2009;118:69–77. doi: 10.1007/s10633-008-9155-4. [DOI] [PubMed] [Google Scholar]
- 39.Bach M, Brigell MG, Hawlina M, et al. ISCEV standard for clinical pattern electroretinography (PERG): 2012 update. Doc Ophthalmol. 2013;126:1–7. doi: 10.1007/s10633-012-9353-y. [DOI] [PubMed] [Google Scholar]
- 40.Mata NL, Weng J, Travis GH. Biosynthesis of a major lip-ofuscin fluorophore in mice and humans with ABCR-mediated retinal and macular degeneration. Proc Natl Acad Sci U S A. 2000;97:7154–9. doi: 10.1073/pnas.130110497. [DOI] [PMC free article] [PubMed] [Google Scholar]
- 41.Conley SM, Cai X, Makkia R, et al. Increased cone sensitivity to ABCA4 deficiency provides insight into macular vision loss in Stargardt's dystrophy. Biochim Biophys Acta. 2012;1822:1169–79. doi: 10.1016/j.bbadis.2011.10.007. [DOI] [PMC free article] [PubMed] [Google Scholar]
Associated Data
This section collects any data citations, data availability statements, or supplementary materials included in this article.
Supplementary Materials
Figure 5 Age of onset compared to logarithm of the minimum angle of resolution visual acuity and central foveal thickness for comparison between childhood-onset Stargardt disease and adult-onset Stargardt disease. Scatter plots for the following parameters are shown; age of onset and logarithm of the minimum angle of resolution (logMAR) visual acuity, and age of onset and central foveal thickness (CFT) measured by spectral-domain optical coherence tomography (SD-OCT). The data of the selected eye of childhood-onset Stargardt disease (STGD) group are shown in blue and those from adult-onset STGD group shown in red. There was a significant difference detected by the Mann-Whitney U test between childhood-onset STGD and adult-onset STGD in terms of CFT; no significant difference was revealed in logMAR visual acuity.