

Abstract
Introduction
Analysis of extracellular vesicles (EVs) derived from plasma or cerebrospinal fluid (CSF) has emerged as a promising biomarker platform for therapeutic monitoring in glioblastoma patients. However, the contents of the various subpopulations of EVs in these clinical specimens remain poorly defined. Here we characterize the relative abundance of miRNA species in EVs derived from the serum and cerebrospinal fluid of glioblastoma patients.
Methods
EVs were isolated from glioblastoma cell lines as well as the plasma and CSF of glioblastoma patients. The microvesicle subpopulation was isolated by pelleting at 10,000×g for 30 min after cellular debris was cleared by a 2,000×g (20 min) spin. The exosome subpopulation was isolated by pelleting the microvesicle supernatant at 120,000×g (120 min). qRT-PCR was performed to examine the distribution of miR-21, miR-103, miR-24, and miR-125. Global miRNA profiling was performed in select glioblastoma CSF samples.
Results
In plasma and cell line derived EVs, the relative abundance of miRNAs in exosome and microvesicles were highly variable. In some specimens, the majority of the miRNA species were found in exosomes while in other, they were found in microvesicles. In contrast, CSF exosomes were enriched for miRNAs relative to CSF microvesicles. In CSF, there is an average of one molecule of miRNA per 150-25,000 EVs.
Conclusion
Most EVs derived from clinical biofluids are devoid of miRNA content. The relative distribution of miRNA species in plasma exosomes or microvesicles is unpredictable. In contrast, CSF exosomes are the major EV compartment that harbor miRNAs.
Introduction
Glioblastoma is the most common form of primary brain neoplasm [1,2]. Despite aggressive surgical resection, chemotherapy, and radiation, median survival of afflicted patients remains approximately 14 months, with lethality for most patients within two years [3]. Lack of strategies for effective therapeutic monitoring remains a major barrier in the management of glioblastoma patients [4]. The current monitoring strategies involve serial clinical examination or Magnetic Resonance Imaging (MRIs). However, both MRIs and clinical examinations are insensitive proxies for glioblastoma disease status. For instance, the lowest MRI resolution ranges on the order of millimeters [5], whereas the dimensions of the tumor cell are in micrometers [6]. This difference in scale translates into significant delay in diagnosis or detection of therapeutic resistance [7]. Moreover, the radiographic findings of reactive changes to radiation, termed radiation necrosis, are often indistinguishable from those of disease progression [8]. While repeated brain biopsies represent an option, this practice is associated with significant morbidity [9,10]. In this context, minimally invasive biomarkers that reliably reflect glioblastoma disease status are sorely needed.
Recent studies suggest that glioblastoma cells secrete extracellular vesicles (EVs) containing genetic materials that mirror the intracellular tumor milieu, including tumor-specific microRNAs (miRNAs) [11-16]. EVs are membrane bound nano-sized particles secreted by cells as means of maintaining cellular homeostasis or inter-cellular communication [17]. These EVs are released into the local extracellular environment and transgress anatomic compartments into CSF and the systemic blood circulation [18,19]. Importantly, the lipid bi-layer of the EV protects the EV contents from an otherwise hostile biofluid environment replete with RNAses [20]. Sampling of these vesicles derived from biofluids including sera or CSF has been proposed as a means of “liquid biopsy” which affords opportunities for real-time monitoring of cancer burden and therapeutic response [21,22].
The nomenclature governing EVs remains an area of active debate. While defining EVs based on the mechanism of biogenesis is attractive [23,24], such a classification scheme cannot be easily applied to clinical biofluids due to limitations in isolating subpopulations of vesicles from individual biogenesis pathways. EVs derived from clinical biofluids have often been categorized based on their size. The term “exosomes” typically refers to EVs 50-200 nm in size while the term “microvesicles” is used to refer to EVs > 200 nm [25,26]. Undoubtedly, EVs defined by only size-based nomenclatures are likely to be heterogeneous in molecular composition [27]. Nevertheless, the size-based definition may afford a crude first step toward understanding the biological contents of differing EV populations.
The most frequently adopted method of EV isolation remains differential ultracentrifugation [28], where microvesicles are typically isolated by a 10,000×g spin after cell debris are cleared by a 2,000×g spin. Exosomes are then pelleted by a 120,000×g spin of the supernatant. However, due to the high heterogeneity of EVs, some smaller vesicles can also be pelleted at 10,000×g, leading to overlap in size profile between isolated microvesicles and exosomes. Here, we show that i) in CSF, there is an average of one molecule of miRNA per 150 to 25,000 EVs; ii) the relative distribution of miRNAs in plasma exosomes and microvesicles is highly variable; iii) in contrast, miRNAs are enriched in CSF exosomes relative to microvesicles; iv) we further demonstrate that CSF exosomal RNA isolated with the Qiagen exoRNeasy plasma/serum Maxi kit (EXO50) yielded miRNA contents highly comparable to those isolated by differential ultracentrifugation, suggesting an expedited method for CSF exosome miRNA analysis.
Methods
Clinical specimen collection
The plasma and CSF specimens were collected at the University of California San Diego Medical Center under IRB 120345X. The protocol was approved by the ethics committee and informed consent was signed by each patient. CSF was collected by ventricular/lumbar drain placement or cisternal aspiration at the time of craniotomy. Blood was collected using an 18 Gauge-needle venipuncture into clot-activating blood collection tubes with gel separator (BD Biosciences). The samples were processed by spinning at 1,100·g within 30 min of collection and stored at -80°C.
Cell lines and cell culture
Nine neurosphere lines (1123, 30, AC17, 84, AC20, CMK3, BT70, 83, and 326) [29,30] were cultured in DMEM:F12 supplemented with growth factors as described previously [12]. For EV collection, four Corning ultra low attachment T75 flasks were seeded with 1.5×10⁶ cells each. 60 ml of cell free supernatant from each cell line was collected three days after culturing for EV isolation.
EV Isolation
The EV fraction was isolated by differential centrifugation [31]. 60 ml of conditioned media, 1 ml of plasma, or 4 ml of CSF were used for vesicles isolation. Biofluids were diluted 1:1 with 1x PBS (Mediatech) prior to centrifugation. Samples were centrifuged at 2,000×g for 20 min to remove cellular debris. The supernatant was further centrifuged at 10,000×g for 30 min to pellet EVs. Pelleted EVs were resuspended in 200 μL PBS. The resultant supernatant was subjected to ultracentrifugation at 120,000×g for 2 h in a Type 70 Ti rotor (Beckman). The supernatant was discarded and the 120,000×g EV pellets were re-suspended in 200 μL PBS. All centrifugation steps were performed at 4°C. Both the 10,000×g and 120,000×g EV pellets were stored at -80°C prior to RNA isolation. Freeze thawing did not alter the vesicle's size for sera and cell-line derived EVs [32,33]. Further, we have recapitulated these results in our laboratory using CSF EVs (Supplementary Fig. 8).
EV Quantification and Assessment
The number of vesicles recovered was determined by Nanoparticle Tracking Analysis (NTA) on a Nanosight LM-10HS equipped with a 405 nm laser (Malvern) using the manufacturer's instructions. Resuspended vesicles were diluted 1:40 to 1:200 with PBS before analysis. The purity of the EV isolated were assessed using transmission electron microscopy (TEM) as previously described [31]. Qualitative assessment of TEM was used to gauge the abundance of protein aggregates.
Quantitative Reverse Transcriptase-Polymerase Chain Reaction (qRT-PCR)
RNA from the EV fraction was extracted using the miRCURY™ RNA Isolation Kit (Exiqon). RNA concentration and quality were determined using the NanoDrop ND-1000 Spectrophotometer (Thermo Scientific). 10 ng of RNA was used for cDNA synthesized using the miRCURY LNA™ Universal RT microRNA PCR system (Exiqon). The resultant cDNA were diluted 20x and four microliter was used for qRT-PCR as previously described [12].
Determination of mRNA and miRNA copy number
To determine copy number of miRNA (miR-21, miR-103, miR-24, miR-125), standard curves were generated by serial dilution of known quantities of miRNA mimic (Qiagen), followed by cDNA synthesis using the miRCURY LNA™ Universal RT microRNA PCR system [34]. The cDNAs were then used for the generation of standard curve (Supplementary Fig. 1).
miRNA Profiling
Four microliter of RNA extract was used as sample input for microRNA profiling on the OpenArray® Real-Time PCR System using the manufacturer's instructions (Life technologies). Megaplex™ RT Primers, Human Pool A v2.1 and Megaplex™ RT Primers, Human Pool B v3.0 were used for the reverse transcription step. Megaplex™ PreAmp Primers, Human Pool A v.2.1 and Megaplex™ PreAmp Primers, Human Pool B v3.0 were used for the PreAmp step. The TaqMan® OpenArray® Human MicroRNA Panel was used for the qPCR step.
Bioinformatics analysis
OpenArray® microRNA profiling data were processed and filtered using Perl and R scripts. Briefly, pre-filtering of data was performed to include only reliable Amp Scores (>1.15) and CTs in the range of 10-28. CTs above or below the range were considered unreliable, and hence “undetected”. Further analyses were done in R (http://www.R-project.org). In a group of samples, a miRNA was considered as detected only if it had a reliable CT value (10-28) in at least 70% of the samples. Only microRNA that passed this threshold was considered as detected in that group of samples.
Results
Distribution of select miRNAs in different fractions of glioblastoma cell line derived EVs
To study the relative distribution of miRNA within subpopulations of EVs, we fractionated the vesicles released by nine glioblastoma cell lines using a commonly used differential centrifugation protocol [31]. Consistent with published reports, the 10,000×g and 120,000×g EV preparations yield vesicles of varying size ranges as determined by Nanoparticle Tracking Analysis (Fig. 1a, Supplementary Fig. 2a). For the purpose of discussion, we adopted the commonly accepted nomenclature and referred to the 10,000×g and 120,000×g fractions as microvesicles and exosomes respectively. These results were verified by electron microscopy (Fig. 1b). In cell lines 30, AC17, 84, CMK, and 83, the 10,000×g preparations were enriched for vesicles in the 200-400 nm diameter ranges as determined by NTA. In contrast, smaller vesicles (50-200 nm) were observed in the 120,000×g pellets. Qualitative assessment of TEM demonstrated that the EVs were free from excessive protein aggregates. The relative abundance of microvesicles versus exosomes secreted by glioblastoma cells was variable across the nine lines tested (Fig. 1c, Supplementary Table 1). For 326 cells, microvesicles accounted for only 9% of the total vesicles recovered. While for 84 cells, up to 53% of the secreted EVs were recovered in the microvesicle fraction.
Fig. 1. Distribution of select miRNAs in different fractions of glioblastoma cell line derived EVs.
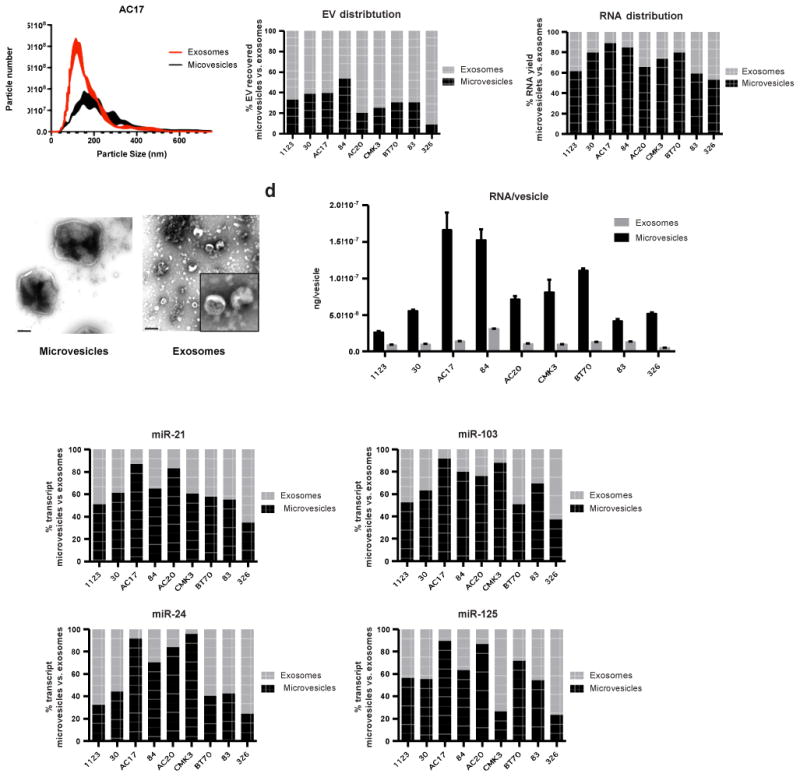
(a) Nanoparticle tracking analysis (NTA) of extracellular vesicles isolated from glioblastoma cell lines by differential centrifugation demonstrated distinct size profiles between microvesicles and exosomes. (b) Sizes of the isolated vesicles were confirmed by TEM. Scale bar represents 200 nm. Inset shows a magnified view of exosomes. (c) Contribution of microvesicle and exosome fractions to total EV and total RNA recovered. The relative abundance of microvesicles versus exosomes secreted by glioblastoma cells was variable across the nine lines. (d) Cell line-derived microvesicles contain more RNA per vesicle than the corresponding exosomes. Average RNA yield per vesicles was calculated by normalizing total RNA yield to vesicles number as determined by NTA. (e) The expression levels of miR-21, miR-103, miR-24, and miR-125 in microvesicles and exosomes were quantitatively assessed. qRT-PCR was performed in triplicate. All transcripts were detectable in both EV types, the distribution of each transcript among subpopulation of EVs were both transcript and cell line-dependent.
Next, vesicular RNA was extracted from the fractionated EVs for qRT-PCR analysis. Despite displaying variable distribution of 10,000×g versus 120,000×g EVs, each of the nine glioblastoma cell lines-derived microvesicles contained on average of 3.5 to 11.9 fold more RNA per vesicle than the corresponding exosomes (Fig. 1d). We quantitated the absolute copy number of miRNAs frequently used in EV analysis of clinical glioblastoma specimens [11,12,19,35], in microvesicles and exosomes, including miR-21, miR-103, miR-24, and miR-125. While all transcripts were detectable in both EV types, there is less than one miRNA molecule per 100 to 3,000 exosomes or microvesicles, on average (Supplementary Table 2). Depending on the cell line and the transcript, miRNA may be enriched in microvesicles or exosomes. (Fig. 1e, Supplementary Fig. 2b).
Distribution of select miRNAs in different fractions of glioblastoma patient plasma derived EVs
We next tested whether the selected transcripts also displayed differential distribution in EVs isolated from the plasma of nine glioblastoma patients. 1 ml of plasma from each patient was used to isolate microvesicles and exosomes by differential centrifugation. Similar to cell line derived EVs, plasma derived EVs also exhibited distinct size profiles. In aggregate, larger vesicles were enriched in the microvesicle fractions (26% of the vesicles were >200 nm in diameter, and vesicles <150 nm accounted for less than 49%). The opposite was true in the exosome fractions, where 65% of vesicles were in the 50-150 nm diameter range, and only 12% of vesicles were >200 nm (Fig. 2a, b, Supplementary Fig. 4a). Furthermore, the relative abundance of microvesicles and exosomes in plasma appeared to be highly variable across different clinical specimens (Fig. 2c, Supplementary Table 3).
Fig. 2. Distribution of select miRNAs in different fractions of glioblastoma patient plasma derived EVs.
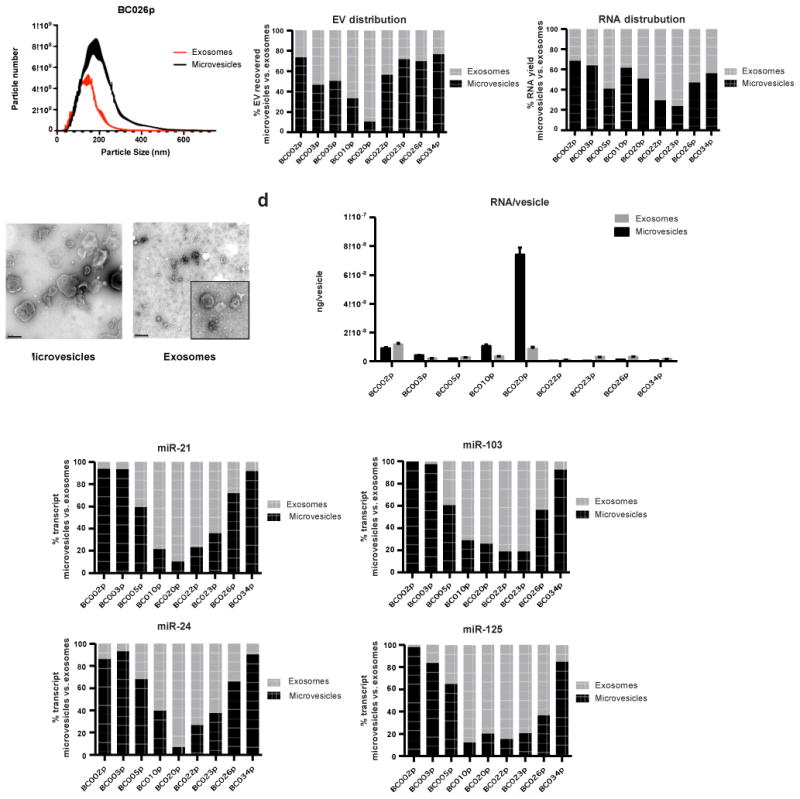
(a) Nanoparticle tracking analysis (NTA) of extracellular vesicles isolated from glioblastoma patient plasma by differential centrifugation. (b) Sizes of the isolated vesicles were confirmed by TEM. Scale bar represents 200 nm. Inset shows a magnified view of exosomes. (c) Contribution of microvesicle and exosome fractions to total EV and total RNA recovered. The relative abundance of microvesicles and exosomes in plasma also appeared to be highly variable across different clinical specimens. (d) Average RNA yield per vesicles isolated from plasma was calculated by normalizing total RNA yield to vesicles number as determined by NTA. In four out of nine patients' plasma, exosomes were found to contain higher RNA contents than microvesicles. (e) The expression levels miR-21, miR-103, miR-24, and miR-125 in microvesicles and exosomes were quantitatively assessed. qRT-PCR was performed in triplicate. All transcripts were detectable in both EV types, the distribution of each transcript among subpopulation of EVs were both transcript and specimen-dependent.
EV RNA analyses also revealed differences between the RNA contents of cell line- and plasma-derived EVs. The microvesicles secreted by glioblastoma cell lines contained more RNA per vesicle than their exosome counterparts. In contrast, microvesicles derived from patient plasma were more heterogeneous. In six out of nine patients' plasma, exosomes were found to contain higher RNA contents than microvesicles (Fig. 2d). In terms of the miRNA tested, there is less than an average of one miRNA molecule per 200 to 85,000 plasma exosomes or microvesicles (Supplementary Table 4). Depending on sample and transcript, miRNA may be enriched in microvesicles or exosomes. (Fig. 2e, Supplementary Fig. 4b).
Distribution of select miRNAs in different fractions of glioblastoma patient CSF derived EVs
We extended our study to include EVs isolated from CSF of nine glioblastoma patients. The 10,000×g-centrifugation step consistently pulled down vesicles that are larger than the vesicles isolated from 120,000×g spins as determined by NTA and electron microscopy (Fig. 3a, b, Supplementary Fig. 5a). The microvesicle fractions, on average, accounted only for 11% of the total number of CSF-derived EVs (Fig. 3c, Supplementary Table 5). However, due to the higher RNA content of microvesicles (Fig. 3d), ∼44.7% of total vesicular RNA recovered originated from these larger vesicles (Fig. 3c). In terms of the miRNA tested, there is less than an average of one miRNA molecule per 150 to 25,000 CSF exosomes or microvesicles (Supplementary Table 6). In contrast to other biofluids, nearly all miRNAs tested were found in CSF exosomes (70.9 to 100%) (Fig. 3e, Supplementary Fig. 5b).
Fig. 3. Distribution of select miRNAs in different fractions of glioblastoma patient cerebrospinal fluid (CSF) derived EVs.
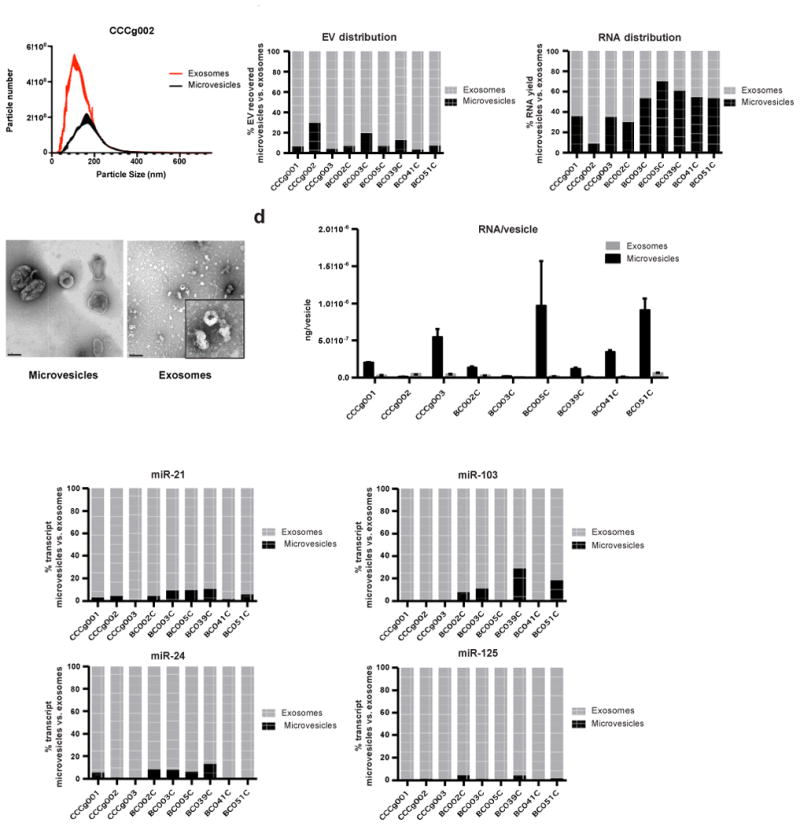
(a) Nanoparticle tracking analysis (NTA) of extracellular vesicles isolated from glioblastoma patient CSF by differential centrifugation. (b) Sizes of the isolated vesicles were confirmed by TEM. Scale bar represents 200 nm. Inset shows a magnified view of exosomes. (c) Contribution of microvesicle and exosome fractions to total EV and total RNA recovered in CSF. While the microvesicle fractions on average only accounted for 10.5% of the total number of CSF-derived EVs, due to the higher RNA content of microvesicles, ∼44.7% of total vesicular RNA recovered was extracted from these larger vesicles. (d) CSF derived microvesicles contain more RNA per vesicles than CSF derived exosomes. Average RNA yield per vesicles isolated from CSF was calculated by normalizing total RNA yield to vesicles number as determined by NTA. (e) The expression levels of miR-21, miR-103, miR-24, and miR-125 in microvesicles and exosomes were quantitatively assessed. qRT-PCR was performed in triplicate. In CSF, between 70.9 to 100% of the four miRNA transcripts assayed were found in the exosome fraction.
To ensure robust quantitative assessment of EV numbers, we performed parallel analysis of CSF EVs using NTA and tunable resistive pulse sensing (TRPS). NTA and TRPS showed excellent agreement in particle count for the 120,000×g exosome fraction. However, TRPS detected particles that were not detected by the NTA in the 10,000×g microvesicle fraction (Supplementary Table 7). Thus, TRPS analysis would indicate that there are more EVs in CSF relative to NTA method. This increased EV particle estimate would further decrease the number of miRNA molecules per EV. Furthermore, while it is possible that the ultracentrifugation process creates EV aggregates, the process of aggregating EVs would decrease the total EV count. If so, the EV count in our ultracentrifuged samples would be an under-estimate of the actual total EV number. This would imply that there are fewer molecules of miRNA per EV than our estimate. Irrespective of the method of quantitation, the results suggest that most csf EVs are devoid of miRNAs.
We wished to determine whether the enrichment of miRNA in CSF exosomes were particular to the set of miRNA examined or pertinent to miRNAs in general. RNAs were isolated from CSF microvesicles and exosomes and subjected to global miRNA profiling using the TaqMan OpenArray human microRNA panel [36]. This profiling platform included an array of 754 validated TaqMan-based miRNA assays. The analysis unveiled 46 miRNAs that were detected in the exosomes but not in the microvesicles, including miR-21, 103, 24, and 125 (Fig. 4a). Of the 6-8 miRNAs that were detected in both exosomes and the microvesicles, the relative abundance of these miRNAs were 3-150 fold higher in the exosomes relative to the microvesicles (Fig. 4b). On average, these miRNAs were detected at 5-7 CT values lower in the exosomes relative to the microvesicles (Fig. 4c). These results suggest that miRNAs, in general, are enriched in the CSF exosomal fractions.
Fig. 4. miRNA profiling of glioblastoma patient cerebrospinal fluid (CSF) derived EVs.
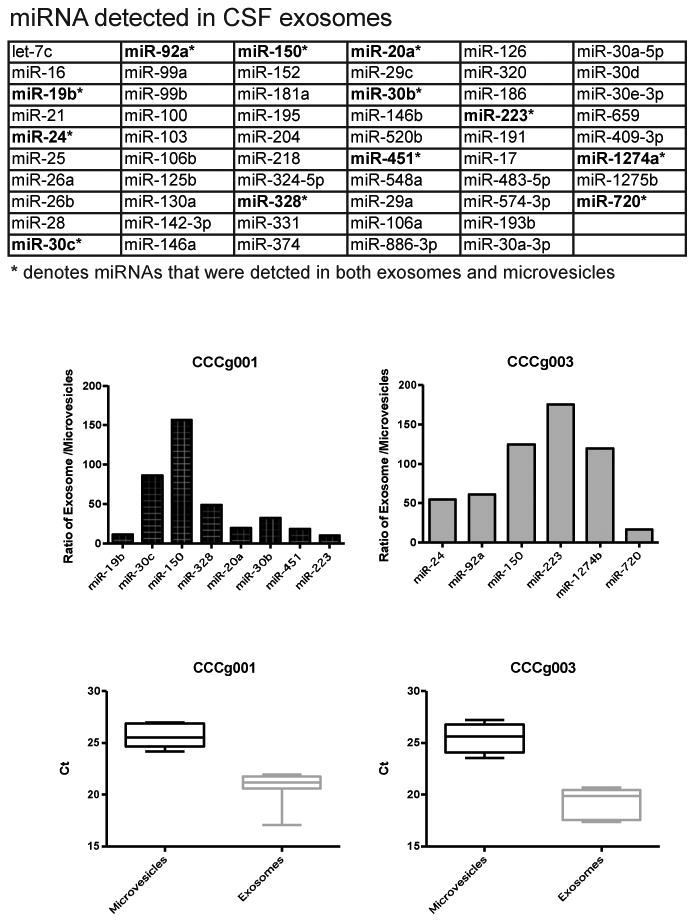
RNAs isolated from CSF microvesices and exosomes were subjected to global miRNA profiling using the TaqMan OpenArray human microRNA panel. (a) List of miRNA detected in CSF exosomes. Asterisk denotes miRNA that were detectable in both CSF microvesicles and exosomes. (b) Of the 6-8 miRNAs that were detected in both exosomes and microvesicles, the relative abundance of these miRNAs were 3-150 fold higher in the exosomes relative to the microvesicles. (c) On average, these miRNAs were detected 5-7 CT values lower in exosomes relative to microvesicles. These results suggest that miRNAs, in general, are enriched in the CSF exosomal fractions.
Streamlined method for CSF exosome isolation
Based on our observations that mRNA and miRNA transcripts were enriched in the CSF exosomal fraction, we hypothesized that we can streamline the EV isolation procedure for RNA analysis by eliminating the lower 10,000×g speed spin. To test this hypothesis, CSF EVs were isolated using differential centrifugation as described into microvesicle and exosome fractions or pelleted in a single 120,000×g spin (labeled as combined) after cellular debris had been cleared. For each of the four transcripts tested, similar levels of RNA were detected in both exosome pellet and the combined microvesicle+exosome pellet (Fig. 5a), demonstrating that a single centrifugation step would be sufficient to analyze EV miRNA content in CSF specimens.
Fig. 5. Streamlined method for CSF exosome isolation.
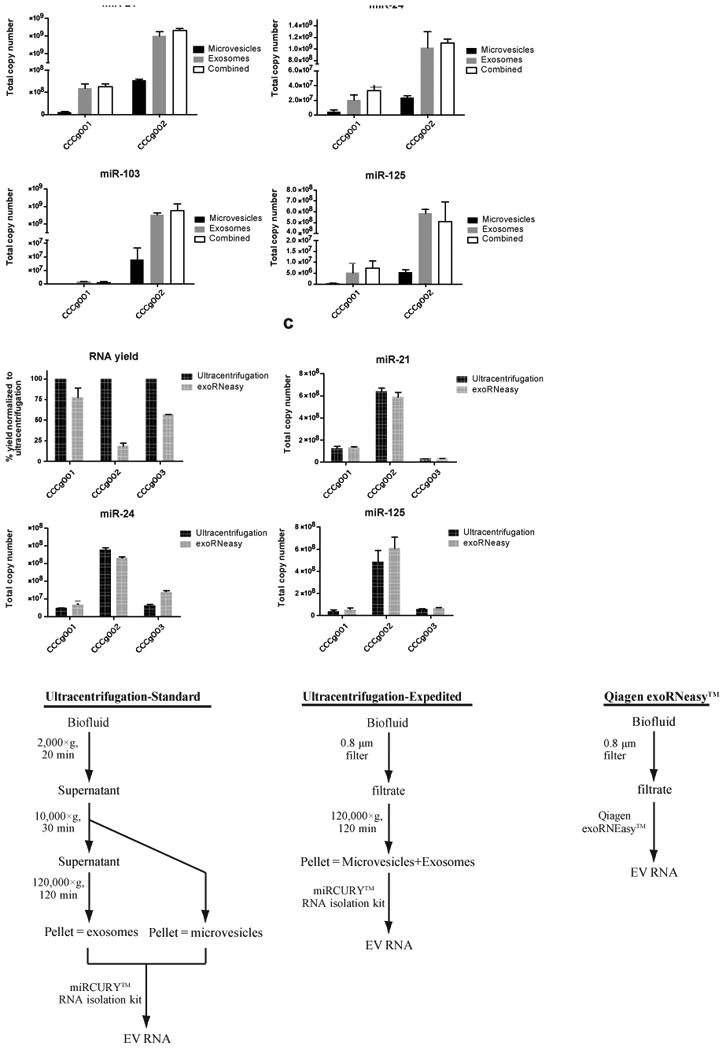
(a) CSF EVs were isolated using differential centrifugation as described into microvesicle and exosome fractions or pelleted in a single 120,000×g spin (labeled as combined. For each of the four transcripts tested, similar levels of RNA were detected in both exosome pellet and the combined microvesicle+exosome pellet. (b) Evaluation of exoRNeasy Maxi Kit by Qiagen for the isolation of RNA from CSF EVs. Comparing total RNA yield, ultracentrifugation followed by RNA extraction using the Exiqon miRCURY RNA isolation kit recovered 1.3 to 5.5-fold more nucleic acid than the exoRNeasy kit. (c) The total copy number of miR-21, miR-24, and miR-125 recovered by ultracentrifugation or exoRNeasy was quantitatively assessed. qRT-PCR was performed in triplicate. Similar amount of miRNAs were recovered by ultracentrifugation and exoRNeasy. (d) Schematic representation of protocol used for the isolation of CSF EV RNA.
We also evaluated the performance of the exoRNeasy Maxi Kit by Qiagen for the isolation of RNA from EVs. exoRNeasy utilizes a proprietary spin column for the capture of EVs without a need for specialized equipment such as ultracentrifuge. Captured vesicles are lysed directly on column with Qiazol and EV RNAs are isolated with the included Qiagen RNeasy MinElute column. For the comparison, 4 ml of 0.8 ∝m filtered CSF were used for EV isolation using exoRNeasy, or ultracentrifugation at 120,000×g as previously described. Comparing total RNA yield, ultracentrifugation followed by RNA extraction using the Exiqon miRCURY RNA isolation kit recovered 1.3 to 5.5-fold more nucleic acid than the exoRNeasy kit (Fig. 5b, Supplementary Fig. 6). Next, we quantified the total copy number of a selected panel of miRNA transcripts recovered by either method using qRT-PCR. Despite the difference in total RNA yield, similar amount of miRNAs were recovered by ultracentrifugation and exoRNeasy (Fig. 5C). Hence, exoRNeasy is a viable alternative to ultracentrifugation for the isolation and analysis of EV RNA in the context of small RNA species such miRNA.
Discussion
Though size-based fractionation of EVs remains crude as a methodology to define EV subpopulations, we demonstrate that the miRNA content of size-defined subpopulation differs. We previously demonstrated that glioblastoma-pertinent miRNAs, such as miR-21, are highly enriched in EVs derived from CSF of glioblastoma patients and are essentially undetectable in EV depleted CSF [12]. Here we extend this observation by demonstrating that miR-21, along with other miRNAs are enriched in the 120,000×g (or exosome) fraction of EVs. The clinical implication of this observation is that CSF-EV based diagnostic involving the miRNAs should be focused on the “exosome” fraction. Based on this principle, we were able to develop an expedited method for consistent and reliable CSF EV isolation in preparation for miRNA analysis (Fig. 5).
We were able to compare our expedited method to CSF EV isolation using the commercially available exoRNeasy Maxi Kit from Qiagen (Fig. 5d). The exoRNeasy kit recovered similar amounts of miRNA transcripts (miR-21, miR24, and miR-125) despite lower overall RNA yield. The available literature suggests that this observed difference may be due to the intrinsic recovery of different RNA species by the extraction methods [37]. Alternatively, the discrepancy may be related to DNA that co-purified with the RNA. Irrespective, if miRNA is the intended target, we believe that exoRNeasy offers rapid extraction of EV RNA from CSF without the need for specialized equipment such as an ultracentrifuge.
In contrast to CSF EVs, the distribution of miRNA species in plasma derived from glioblastoma patients is more complex and less predictable, despite the fact we collected the plasma under a strict Standard Of Procedure (SOP). In some plasma specimens, select miRNAs were enriched in the microvesicle fractions while others were enriched in the exosome fraction. It is likely that this complicated pattern reflects the well-recognized complexity of plasma relative to physiologic filtrates of plasma, such as urine and CSF [38,39]. The available data suggest that clinical variables such as a patient's dietary intake or blood pressure [40-42], (uncontrolled in our SOP) may modulate the EV contents of the plasma. Filtrates of plasma, such as CSF, are intrinsically regulated at a higher level of homeostasis [43]. The relative simplicity of the CSF EVs renders them attractive as a biomarker development platform, though more invasive procedures are required to obtain CSF. While blood remains attractive as a biomarker platform, and EV miRNA level from sera have been associated with advanced melanoma disease [44], the complexity of this biofluid yields inherent technical challenges.
The miRNA contents of EVs secreted by cell lines appear highly dependent on the cell of origin. In our study, a significant portion of the miRNA was found in the microvesicles secreted from glioblastoma cell lines. In contrast, Crescitell et al. previously reported that microvesicles secreted by human mast cell line (HMC-1), and a mouse microglia cell line (BV-2) do not contain considerable amounts of RNA [45]. The EVs isolated from clinical biofluids likely represent a mixture of EVs secreted by a variety of cell types that contact the biofluid. As such, it would be inappropriate to extrapolate cell culture results to clinical biofluids.
The rarity of miRNAs in EVs of cell line supernatants, plasma, and CSF warrant additional comment. EV mediated miRNA transfer has been proposed as a mechanism of inter cellular communication [46]. However, the stoichiometry of miRNA per EV (< 1 molecule per 150-85,000 EVs) and the number of miRNAs required for modulating intercellular physiology (>100) [47] suggest that efficient and selective cellular uptake of EV enriched in miRNA would be required for EV-mediated miRNA transfer to be biologically plausible. It is important to note that most experiments in support of EV mediated RNA transfer as means of intercellular communication were performed in vitro using supra-physiological amounts of EVs [48,49]. In this context, the biologic plausibility of the hypothesis will require further validation.
In sum, our study suggests that within the CSF EVs, miRNA are concentrated in the “exosome” fraction. Expedited methods of isolation, including the exoRNeasy column are robust and may facilitate future studies. The complexity of clinical plasma specimens pertaining to the relative distribution of RNA in EV subpopulations warrants judicious consideration in future biomarker discovery efforts.
Supplementary Material
Acknowledgments
The work is supported by NIH UH2 TR000931-0, NIH PO1 2P30CA023100-28 (BSC and CCC) and International S&T Cooperation Program of China, 2014DFA31470 (CCC and YM). CCC is supported by the Doris Duke Charitable Foundation Clinical Scientist Development Award, Sontag Foundation Distinguished Scientist Award, Burroughs Wellcome Fund Career Awards for Medical Scientists, the Kimmel Scholar Award, a Grant from Accelerated Brain Cancer Cure, and the William Guy Forbeck Research Foundation.
Footnotes
Conflict of interest: None.
References
- 1.Ostrom QT, Gittleman H, Farah P, Ondracek A, Chen Y, et al. CBTRUS statistical report: Primary brain and central nervous system tumors diagnosed in the United States in 2006-2010. Neuro Oncol. 2013;15(Suppl 2):ii1–56. doi: 10.1093/neuonc/not151. [DOI] [PMC free article] [PubMed] [Google Scholar]
- 2.Bartek J, Jr, Ng K, Bartek J, Fischer W, Carter B, et al. Key concepts in glioblastoma therapy. J Neurol Neurosurg Psychiatry. 2012;83:753–760. doi: 10.1136/jnnp-2011-300709. [DOI] [PubMed] [Google Scholar]
- 3.Stupp R, Hegi ME, Mason WP, van den Bent MJ, Taphoorn MJ, et al. Effects of radiotherapy with concomitant and adjuvant temozolomide versus radiotherapy alone on survival in glioblastoma in a randomised phase III study: 5-year analysis of the EORTC-NCIC trial. Lancet Oncol. 2009;10:459–466. doi: 10.1016/S1470-2045(09)70025-7. [DOI] [PubMed] [Google Scholar]
- 4.Clarke JL, Chang SM. Neuroimaging: diagnosis and response assessment in glioblastoma. Cancer J. 2012;18:26–31. doi: 10.1097/PPO.0b013e318244d7c8. [DOI] [PubMed] [Google Scholar]
- 5.Sorensen AG, Batchelor TT, Wen PY, Zhang WT, Jain RK. Response criteria for glioma. Nat Clin Pract Oncol. 2008;5:634–644. doi: 10.1038/ncponc1204. [DOI] [PMC free article] [PubMed] [Google Scholar]
- 6.Teodori L, Albertini MC, Uguccioni F, Falcieri E, Rocchi MB, et al. Static magnetic fields affect cell size, shape, orientation, and membrane surface of human glioblastoma cells, as demonstrated by electron, optic, and atomic force microscopy. Cytometry A. 2006;69:75–85. doi: 10.1002/cyto.a.20208. [DOI] [PubMed] [Google Scholar]
- 7.Chen CC, Motegi A, Hasegawa Y, Myung K, Kolodner R, et al. Genetic analysis of ionizing radiation-induced mutagenesis in Saccharomyces cerevisiae reveals TransLesion Synthesis (TLS) independent of PCNA K164 SUMOylation and ubiquitination. DNA Repair (Amst) 2006;5:1475–1488. doi: 10.1016/j.dnarep.2006.07.007. [DOI] [PubMed] [Google Scholar]
- 8.Verma N, Cowperthwaite MC, Burnett MG, Markey MK. Differentiating tumor recurrence from treatment necrosis: a review of neuro-oncologic imaging strategies. Neuro Oncol. 2013;15:515–534. doi: 10.1093/neuonc/nos307. [DOI] [PMC free article] [PubMed] [Google Scholar]
- 9.Air EL, Leach JL, Warnick RE, McPherson CM. Comparing the risks of frameless stereotactic biopsy in eloquent and noneloquent regions of the brain: a retrospective review of 284 cases. J Neurosurg. 2009;111:820–824. doi: 10.3171/2009.3.JNS081695. [DOI] [PubMed] [Google Scholar]
- 10.Chen CC, Hsu PW, Erich Wu TW, Lee ST, Chang CN, et al. Stereotactic brain biopsy: Single center retrospective analysis of complications. Clin Neurol Neurosurg. 2009;111:835–839. doi: 10.1016/j.clineuro.2009.08.013. [DOI] [PubMed] [Google Scholar]
- 11.Skog J, Wurdinger T, van Rijn S, Meijer DH, Gainche L, et al. Glioblastoma microvesicles transport RNA and proteins that promote tumour growth and provide diagnostic biomarkers. Nat Cell Biol. 2008;10:1470–1476. doi: 10.1038/ncb1800. [DOI] [PMC free article] [PubMed] [Google Scholar]
- 12.Akers JC, Ramakrishnan V, Kim R, Skog J, Nakano I, et al. MiR-21 in the extracellular vesicles (EVs) of cerebrospinal fluid (CSF): a platform for glioblastoma biomarker development. PLoS One. 2013;8:e78115. doi: 10.1371/journal.pone.0078115. [DOI] [PMC free article] [PubMed] [Google Scholar]
- 13.Chen WW, Balaj L, Liau LM, Samuels ML, Kotsopoulos SK, et al. BEAMing and Droplet Digital PCR Analysis of Mutant IDH1 mRNA in Glioma Patient Serum and Cerebrospinal Fluid Extracellular Vesicles. Mol Ther Nucleic Acids. 2013;2:e109. doi: 10.1038/mtna.2013.28. [DOI] [PMC free article] [PubMed] [Google Scholar]
- 14.Zhang W, Zhang J, Yan W, You G, Bao Z, et al. Whole-genome microRNA expression profiling identifies a 5-microRNA signature as a prognostic biomarker in Chinese patients with primary glioblastoma multiforme. Cancer. 2013;119:814–824. doi: 10.1002/cncr.27826. [DOI] [PubMed] [Google Scholar]
- 15.Zhang W, Zhang J, Hoadley K, Kushwaha D, Ramakrishnan V, et al. miR-181d: a predictive glioblastoma biomarker that downregulates MGMT expression. Neuro-Oncology. 2012;14:712–719. doi: 10.1093/neuonc/nos089. [DOI] [PMC free article] [PubMed] [Google Scholar]
- 16.Kushwaha D, Ramakrishnan V, Ng K, Steed T, Nguyen T, et al. A genome-wide miRNA screen revealed miR-603 as a MGMT-regulating miRNA in glioblastomas. Oncotarget. 2014;5:4026–4039. doi: 10.18632/oncotarget.1974. [DOI] [PMC free article] [PubMed] [Google Scholar]
- 17.Shifrin DA, Jr, Demory Beckler M, Coffey RJ, Tyska MJ. Extracellular vesicles: communication, coercion, and conditioning. Mol Biol Cell. 2013;24:1253–1259. doi: 10.1091/mbc.E12-08-0572. [DOI] [PMC free article] [PubMed] [Google Scholar]
- 18.Street J, Barran P, Mackay CL, Weidt S, Balmforth C, et al. Identification and proteomic profiling of exosomes in human cerebrospinal fluid. Journal of Translational Medicine. 2012;10:5. doi: 10.1186/1479-5876-10-5. [DOI] [PMC free article] [PubMed] [Google Scholar]
- 19.Noerholm M, Balaj L, Limperg T, Salehi A, Zhu LD, et al. RNA expression patterns in serum microvesicles from patients with glioblastoma multiforme and controls. BMC Cancer. 2012;12:22. doi: 10.1186/1471-2407-12-22. [DOI] [PMC free article] [PubMed] [Google Scholar]
- 20.Blank A, Dekker CA. Ribonucleases of human serum, urine, cerebrospinal fluid, and leukocytes. Activity staining following electrophoresis in sodium dodecyl sulfate-polyacrylamide gels. Biochemistry. 1981;20:2261–2267. doi: 10.1021/bi00511a030. [DOI] [PubMed] [Google Scholar]
- 21.Shao H, Chung J, Balaj L, Charest A, Bigner DD, et al. Protein typing of circulating microvesicles allows real-time monitoring of glioblastoma therapy. Nat Med. 2012;18:1835–1840. doi: 10.1038/nm.2994. [DOI] [PMC free article] [PubMed] [Google Scholar]
- 22.Taylor DD, Gercel-Taylor C. MicroRNA signatures of tumor-derived exosomes as diagnostic biomarkers of ovarian cancer. Gynecol Oncol. 2008;110:13–21. doi: 10.1016/j.ygyno.2008.04.033. [DOI] [PubMed] [Google Scholar]
- 23.Akers J, Gonda D, Kim R, Carter B, Chen C. Biogenesis of extracellular vesicles (EV): exosomes, microvesicles, retrovirus-like vesicles, and apoptotic bodies. Journal of Neuro-Oncology. 2013;113:1–11. doi: 10.1007/s11060-013-1084-8. [DOI] [PMC free article] [PubMed] [Google Scholar]
- 24.Bass DM, Baylor M, Chen C, Upadhyayula U. Dansylcadaverine and cytochalasin D enhance rotavirus infection of murine L cells. Virology. 1995;212:429–437. doi: 10.1006/viro.1995.1500. [DOI] [PubMed] [Google Scholar]
- 25.Camussi G, Deregibus MC, Bruno S, Grange C, Fonsato V, et al. Exosome/microvesicle-mediated epigenetic reprogramming of cells. Am J Cancer Res. 2011;1:98–110. [PMC free article] [PubMed] [Google Scholar]
- 26.Johnstone RM. Exosomes biological significance: A concise review. Blood Cells Mol Dis. 2006;36:315–321. doi: 10.1016/j.bcmd.2005.12.001. [DOI] [PubMed] [Google Scholar]
- 27.Booth AM, Fang Y, Fallon JK, Yang JM, Hildreth JE, et al. Exosomes and HIV Gag bud from endosome-like domains of the T cell plasma membrane. J Cell Biol. 2006;172:923–935. doi: 10.1083/jcb.200508014. [DOI] [PMC free article] [PubMed] [Google Scholar]
- 28.Gould SJ, Raposo G. As we wait: coping with an imperfect nomenclature for extracellular vesicles. J Extracell Vesicles. 2013;2 doi: 10.3402/jev.v2i0.20389. [DOI] [PMC free article] [PubMed] [Google Scholar]
- 29.Joshi K, Banasavadi-Siddegowda Y, Mo X, Kim SH, Mao P, et al. MELK-dependent FOXM1 Phosphorylation is Essential for Proliferation of Glioma Stem Cells. Stem Cells. 2013 doi: 10.1002/stem.1358. [DOI] [PMC free article] [PubMed] [Google Scholar]
- 30.Ng K, Nitta M, Hu L, Kesari S, Kung A, et al. A small interference RNA screen revealed proteasome inhibition as strategy for glioblastoma therapy. Clin Neurosurg. 2009;56:107–118. [PubMed] [Google Scholar]
- 31.Thery C, Amigorena S, Raposo G, Clayton A. Isolation and characterization of exosomes from cell culture supernatants and biological fluids. Curr Protoc Cell Biol. 2006;3(Unit 3):22. doi: 10.1002/0471143030.cb0322s30. [DOI] [PubMed] [Google Scholar]
- 32.Jayachandran M, Miller VM, Heit JA, Owen WG. Methodology for isolation, identification and characterization of microvesicles in peripheral blood. J Immunol Methods. 2012;375:207–214. doi: 10.1016/j.jim.2011.10.012. [DOI] [PMC free article] [PubMed] [Google Scholar]
- 33.Sokolova V, Ludwig AK, Hornung S, Rotan O, Horn PA, et al. Characterisation of exosomes derived from human cells by nanoparticle tracking analysis and scanning electron microscopy. Colloids Surf B Biointerfaces. 2011;87:146–150. doi: 10.1016/j.colsurfb.2011.05.013. [DOI] [PubMed] [Google Scholar]
- 34.Trang P, Wiggins JF, Daige CL, Cho C, Omotola M, et al. Systemic delivery of tumor suppressor microRNA mimics using a neutral lipid emulsion inhibits lung tumors in mice. Mol Ther. 2011;19:1116–1122. doi: 10.1038/mt.2011.48. [DOI] [PMC free article] [PubMed] [Google Scholar]
- 35.Teplyuk NM, Mollenhauer B, Gabriely G, Giese A, Kim E, et al. MicroRNAs in cerebrospinal fluid identify glioblastoma and metastatic brain cancers and reflect disease activity. Neuro-Oncology. 2012;14:689–700. doi: 10.1093/neuonc/nos074. [DOI] [PMC free article] [PubMed] [Google Scholar]
- 36.Grigorenko EV, Ortenberg E, Hurley J, Bond A, Munnelly K. miRNA profiling on high-throughput OpenArray system. Methods Mol Biol. 2011;676:101–110. doi: 10.1007/978-1-60761-863-8_8. [DOI] [PubMed] [Google Scholar]
- 37.Eldh M, Lotvall J, Malmhall C, Ekstrom K. Importance of RNA isolation methods for analysis of exosomal RNA: evaluation of different methods. Mol Immunol. 2012;50:278–286. doi: 10.1016/j.molimm.2012.02.001. [DOI] [PubMed] [Google Scholar]
- 38.Schutzer SE, Liu T, Natelson BH, Angel TE, Schepmoes AA, et al. Establishing the proteome of normal human cerebrospinal fluid. PLoS One. 2010;5:e10980. doi: 10.1371/journal.pone.0010980. [DOI] [PMC free article] [PubMed] [Google Scholar]
- 39.Hu S, Loo JA, Wong DT. Human body fluid proteome analysis. Proteomics. 2006;6:6326–6353. doi: 10.1002/pmic.200600284. [DOI] [PMC free article] [PubMed] [Google Scholar]
- 40.Mutungi G, Waters D, Ratliff J, Puglisi M, Clark RM, et al. Eggs distinctly modulate plasma carotenoid and lipoprotein subclasses in adult men following a carbohydrate-restricted diet. J Nutr Biochem. 2010;21:261–267. doi: 10.1016/j.jnutbio.2008.12.011. [DOI] [PubMed] [Google Scholar]
- 41.Lapointe A, Couillard C, Lemieux S. Effects of dietary factors on oxidation of low- density lipoprotein particles. J Nutr Biochem. 2006;17:645–658. doi: 10.1016/j.jnutbio.2006.01.001. [DOI] [PubMed] [Google Scholar]
- 42.Witwer KW, Buzas EI, Bemis LT, Bora A, Lasser C, et al. Standardization of sample collection, isolation and analysis methods in extracellular vesicle research. J Extracell Vesicles. 2013;2 doi: 10.3402/jev.v2i0.20360. [DOI] [PMC free article] [PubMed] [Google Scholar]
- 43.Parvas M, Parada C, Bueno D. A blood-CSF barrier function controls embryonic CSF protein composition and homeostasis during early CNS development. Dev Biol. 2008;321:51–63. doi: 10.1016/j.ydbio.2008.05.552. [DOI] [PubMed] [Google Scholar]
- 44.Alegre E, Sanmamed MF, Rodriguez C, Carranza O, Martin-Algarra S, et al. Study of circulating microRNA-125b levels in serum exosomes in advanced melanoma. Arch Pathol Lab Med. 2014;138:828–832. doi: 10.5858/arpa.2013-0134-OA. [DOI] [PubMed] [Google Scholar]
- 45.Crescitelli R, Lasser C, Szabo TG, Kittel A, Eldh M, et al. Distinct RNA profiles in subpopulations of extracellular vesicles: apoptotic bodies, microvesicles and exosomes. J Extracell Vesicles. 2013;2 doi: 10.3402/jev.v2i0.20677. [DOI] [PMC free article] [PubMed] [Google Scholar]
- 46.Salido-Guadarrama I, Romero-Cordoba S, Peralta-Zaragoza O, Hidalgo-Miranda A, Rodriguez-Dorantes M. MicroRNAs transported by exosomes in body fluids as mediators of intercellular communication in cancer. Onco Targets Ther. 2014;7:1327–1338. doi: 10.2147/OTT.S61562. [DOI] [PMC free article] [PubMed] [Google Scholar]
- 47.Pegtel DM, Cosmopoulos K, Thorley-Lawson DA, van Eijndhoven MA, Hopmans ES, et al. Functional delivery of viral miRNAs via exosomes. Proc Natl Acad Sci U S A. 2010;107:6328–6333. doi: 10.1073/pnas.0914843107. [DOI] [PMC free article] [PubMed] [Google Scholar]
- 48.Yuan A, Farber EL, Rapoport AL, Tejada D, Deniskin R, et al. Transfer of microRNAs by embryonic stem cell microvesicles. PLoS One. 2009;4:e4722. doi: 10.1371/journal.pone.0004722. [DOI] [PMC free article] [PubMed] [Google Scholar]
- 49.Valadi H, Ekstrom K, Bossios A, Sjostrand M, Lee JJ, et al. Exosome-mediated transfer of mRNAs and microRNAs is a novel mechanism of genetic exchange between cells. Nat Cell Biol. 2007;9:654–659. doi: 10.1038/ncb1596. [DOI] [PubMed] [Google Scholar]
Associated Data
This section collects any data citations, data availability statements, or supplementary materials included in this article.