Abstract
Objectives
To explore the intrinsic factors related to the pathogenesis of acute arterial thrombosis (AAT) and to elucidate the pathogenesis of AAT on the basis of differentially expressed genes.
Methods
Patients with acute myocardial infarction (AMI), stable angina (SA) and healthy controls (n = 20 per group) were recruited, and the whole human genome microarray analysis was performed to detect the differentially expressed genes among these subjects.
Results
Patients with AMI had disease-specific gene expression pattern. Biological functional analysis showed the function of T cells was significantly reduced, the mitochondrial metabolism significantly decreased, the ion metabolism was abnormal, the cell apoptosis and inflammatory reaction increased, the phagocytosis elevated, the neutrophil-mediated immunity increased and the post-traumatic repair of cells and tissues increased in AMI patients. The biological function in SA group and healthy controls remained stable and was comparable.
Conclusions
The reduced function of T cell gene models in AAT showed the dysfunction of the immune system. The pathogenesis of AAT may be related to the inflammatory reaction after arterial intima infection caused by potential pathogenic microorganisms.
Keywords: Acute arterial thrombosis, Gene expression pattern, Myocardial infarction, Stable angina
1. Introduction
Cardiovascular diseases (CVDs), with high morbidity, are prevalent worldwide. Atherosclerosis has been regarded as a major cause of acute arterial thrombosis (AAT). The pathogenesis of AAT has been ascribed to the injury of vascular endothelial cells, the change of blood flow and the increased blood coagulation.[1],[2] AAT is a result of rupture of soft plaque cap, adhesion and aggregation of platelets at the site of rupture and the subsequent cascade of thrombosis.[3] In the present study, human genome-wide expression microarray assay was performed to investigate the mRNA expression characteristics of genes related to peripheral blood mononuclear cells (PBMC) in acute myocardial infarction patients (AMI) patients, stable angina (SA) patients and healthy controls and to systematically analyze the differentially expressed genes among these subjects. We aimed to evaluate the intrinsic factors related to the pathogenesis of AAT according to the difference in the expression of functional genes.
2. Methods
2.1. Patients information
This prospective study included three groups of subjects, 20 with AMI, 20 with SA, and 20 healthy volunteers. The baseline demographic data were displayed in Table 1. The AMI patients were admitted <12 h from the onset of symptoms to our coronary care unit between January and June 2013, included 18 males and 2 females, with an average age of 58 ± 12 years. All the AMI subjects were diagnosed on the basis of following criteria:[4] detection of a rise of cardiac biomarker values (preferably cardiac troponin) with at least one value above the 99th percentile upper reference limit and with at least one of the following: (1) symptoms of ischemia; (2) new or presumed new significant ST-segment-T wave changes or new left bundle branch block; (3) development of pathological Q waves in the ECG; (4) imaging evidence of new loss of viable myocardium or new regional wall motion abnormality; and (5) identification of an intracoronary thrombus by angiography.
Table 1. Baseline demographic data in the different groups.
| AMI, n = 20 | SA, n = 20 | Control, n = 20 | P (all) | P (AMI vs. SA) | |
| Age, yr | 57.8 ± 11.9 | 63.6 ± 9.9 | 28.8 ± 3.3 | 0.000 | 0.251 |
| Sex, M/F | 18/2 | 18/2 | 17/3 | 0.853 | 1.0 |
| BMI, kg/m2 | 23.6 ± 2.6 | 22.8 ± 2.7 | 21.3 ± 1.8 | 0.102 | 0.56 |
| Smoke, No. per day | 13.6 ± 12.2 | 9.8 ± 10.3 | 0 | 0.00 | 0.648 |
| SBP, mmHg | 128.6 ± 15.3 | 123.0 ± 12.1 | 120.8 ± 7.2 | 0.115 | 0.501 |
| DBP, mmHg | 67.0 ± 8.0 | 73.0 ± 8.0 | 71.6 ± 3.2 | 0.017 | 0.064 |
| LDL-C, mmol/L | 2.5 ± 1.0 | 2.1 ± 0.8 | 2.9 ± 0.5 | 0.327 | 0.548 |
| Triglycerides, mmol/L | 1.6 ± 1.1 | 1.5 ± 1.4 | 1.2 ± 0.4 | 0.73 | 0.762 |
| HDL-C, mmol/L | 0.8 ± 0.7 | 0.9 ± 0.2 | 1.3 ± 0.2 | 0.000 | 0.803 |
| FPG, mmol/L | 5.4 ± 0.9 | 5.0 ± 0.8 | 4.9 ± 0.5 | 0.61 | 0.082 |
| Scr, µmol/L | 87.2 ± 19.6 | 76.9 ± 14.8 | 72.2 ± 6.4 | 0.327 | 0.138 |
AMI: acute myocardial infarction; BMI: body mass index; DBP: diastolic blood pressure; FPG: fasting plasma glucose; HDL-C: high-density lipoprotein cholesterol; LDL-C: low-density lipoprotein cholesterol; SA: stable angina; SBP: systolic blood pressure; Scr: serum creatinine.
As the SA group, we studied 20 patients (18 male, 2 female, mean age 64 ± 10 years) with exclusively effort-related angina, with a positive exercise stress test and at least one coronary stenosis detected at angiography (> 70% reduction of lumen diameter). There were no significant differences between AMI and SA patients in age, gender, smoking status, body mass index (BMI), systolic blood pressure, diastolic blood pressure, low-density lipoprotein cholesterol (LDL-C), high-density lipoprotein cholesterol (HDL-C), triglycerides, fasting glucose and creatinine (Table 1).
The control group included 20 volunteers (17 male, 3 female, mean age 29 ± 3 years) enrolled during the same period with similar male/female ratio. Histories, physical examination, ECG, chest radiography and routine chemical analysis showed the controls had no evidence of coronary heart diseases.
The exclusive criteria were as follows: venous thrombosis, history of severe renal or hepatic diseases, haematological disorders, acute or chronic inflammatory diseases and malignancy.
The study protocol was approved by the ethics committee of Tongji University and informed consent form was obtained.
2.2. Gene expression chip
Agilent G4112F Whole Human Genome Oligo Microarrays were purchased from Agilent (USA). A microarray is composed of more than 41000 genes or transcripts, including targeted 19,596 entrez gene RNAs. Sequence information used in the microarrays is derived from the latest databases of RefSeq, Goldenpath, Ensembl and Unigene. The functions of more than 70% of the genes in the microarray are already known. All patients were subjected to chip analyses. 21,910 probes which detected (with a flag ‘P’)[5] in each 20 samples of at least one condition were selected for further analysis.
2.3. Total RNA isolation
Five milliliter peripheral blood samples with PAXgene tube were drawn from patients of AMI and SA, immediately after admission. Leucocytes were obtained through density gradient centrifugation with Ficoll solution and the remaining red blood cells were destroyed by erythrocyte lysis buffer (Qiagen, Hilden, Germany). Total RNA was extracted and purified using PAXgeneTM Blood RNA kit (Cat# 762174, QIAGEN, GmBH, Germany), following the manufacturer's instructions. It was further checked for a RIN number to inspect RNA integration by an Agilent Bioanalyzer 2100 (Agilent technologies, Santa Clara, CA, US). The sample was considered qualified when 2100 RIN ≥ 7.0 as well as 28S/18S ≥ 0.7.
2.4. RNA amplification and labeling
Total RNA was amplified and labeled by Low Input Quick Amp Labeling Kit, One-Color (Cat#5190-2305, Agilent technologies, Santa Clara, CA, US), following manufacturer's instructions. Labeled cRNA were purified by RNeasy mini kit (Cat#74106, QIAGEN, GmBH, Germany).
2.5. Microarray hybridization
Each slide was hybridized with 1.65 µg Cy3-labeled cRNA using Gene Expression Hybridization Kit (Cat#5188-5242, Agilent technologies, Santa Clara, CA, US) in Hybridization Oven (Cat#G2545A, Agilent technologies, Santa Clara, CA, US), following the manufacturer's instructions. After 17 h of hybridization, slides were washed in staining dishes (Cat#121, Thermo Shandon, Waltham, MA, US) with Gene Expression Wash Buffer Kit (Cat#5188-5327, Agilent technologies, Santa Clara, CA, US), according to the manufacturer's operation manual.
2.6. Chip scan and data acquisition
Slides were scanned by Agilent Microarray Scanner (Cat#G2565CA, Agilent technologies, Santa Clara, CA, US) with default settings, Dye channel: Green, Scan resolution=3 µm, 20 bit. Data were extracted with Feature Extraction software 10.7 (Agilent technologies, Santa Clara, CA, US). Raw data were normalized by Quantile algorithm, Gene Spring Software 11.0 (Agilent technologies, Santa Clara, CA, US).
2.7. RT-PCR
The spots in the microarray were randomly selected and their expressions were confirmed by RT-PCR. Among genes with differential expressions, three genes were randomly selected, and these gens and the house keeping genes (GAPDH) were subjected to RT-PCR. The relative expressions were indicated as the expression of the target genes normalized to the expression of GAPDH (2-ΔΔCt). The melting curve and the 2-ΔΔCt-method were used to detect the differences in the expressions among the three groups. The results from RT-PCR were consistent with the microarray analysis.
2.8. Data analysis
R package “WGCNA” was used to construct the weighted gene co-expression network.[6] First, a matrix of signed Spearman correlations between all probe pairs was computed. Second, this correlation matrix was rising to a power β = 16 to calculate an adjacency matrix, i.e., the connection strength (adjacency) a(i,j) between gene expressions x(i) and x(j) is defined as a(i,j) = |0.5 + 0.5 × cor (x(i), x(j))|ˆ16. The power was determined in WGCNA by making use of the fact that gene expression networks exhibit an approximate scale free topology. Raising the power highlights the strong correlations and mitigates the confounding weak correlations on an exponential scale. To minimize the noise and spurious associations, the adjacency matrix was transformed to topological overlap matrix. The matrix 1-topological overlap matrix was used as the input of average linkage hierarchical clustering while genes with similar expression pattern were clustered together. We applied the Dynamic Tree Cut algorithm[7] with default parameters to cut the hierarchical tree since co-expression gene modules were defined as branches of the tree. The expression profile of a given module was represented by its first principal component (module eigengene, ME) which can explain the most variation of the module expression levels. Principal component analysis (PCA) is commonly used data reduction statistical procedure, which uses an orthogonal transformation to convert observations of correlated underlying variables into a small number of values of linearly uncorrelated variables. Modules with highly correlated module eigengenes (r > 0.85) were merged together to maximize the value of the first principal component and the explained variations. The correlation of sample conditions and MEs were calculated to represent the relevancy of modules and sample conditions. Functions of each module were analyzed via DAVID (Database for Annotation, Visualization and Integrated Discovery).[8]
3. Results
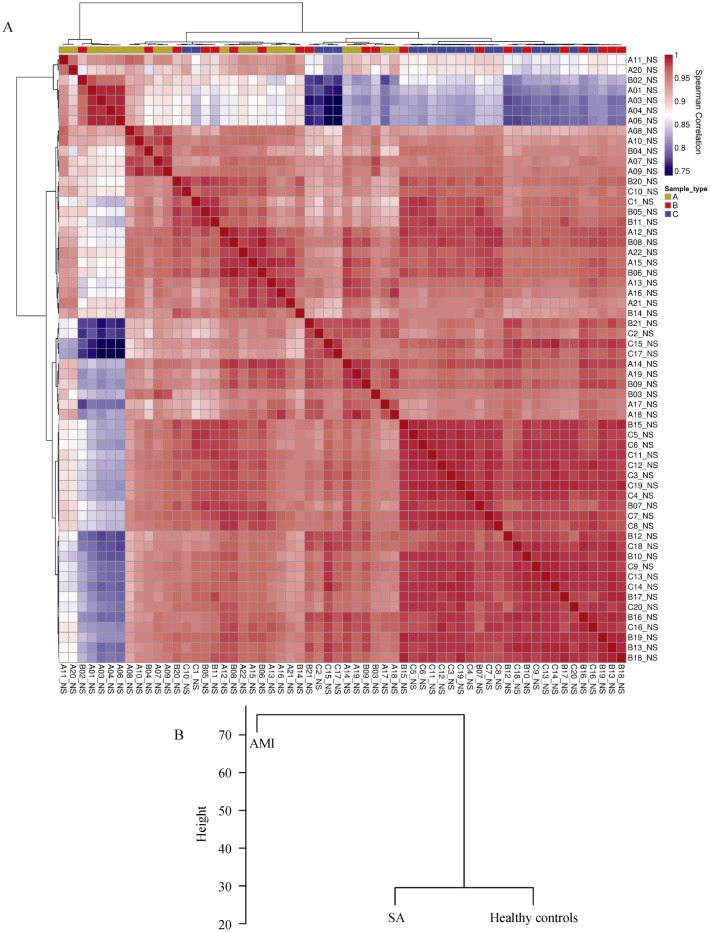
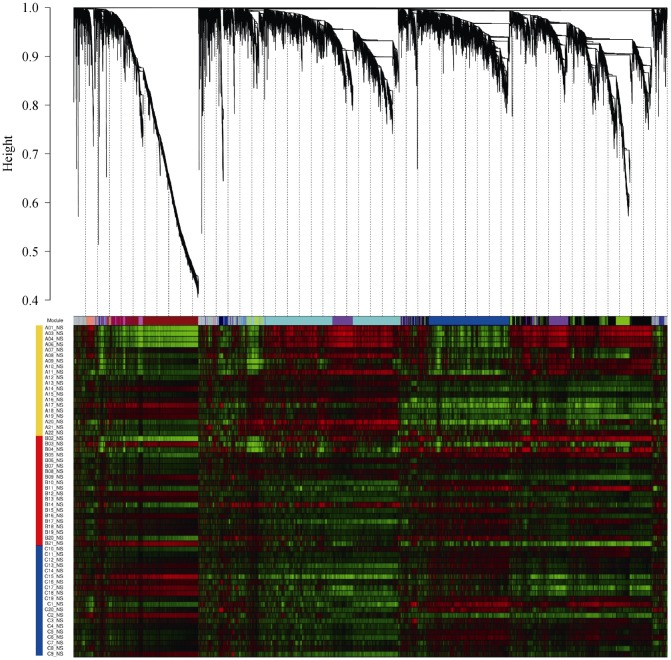
In the present study, we firstly did the sample clustering of 21,910 probes detected in every 20 subjects. The clustering of the three groups (Figure 1) suggested the disease-specific gene expression pattern in AAT. Sample cluster was based on the Spearman correlation of each subject. Dendrograms at the top and left of correlation matrix were hierarchical clustering of all samples (Figure 1A), while condition cluster was based on average signal intensity of each probe (Figure 1B). Then the Hierarchical cluster tree showed co-expression modules were identified using R package “WGCNA” (Figure 2). Modules corresponded to branches and were labeled by colors as indicated by the first color band underneath the tree. The second figure also showed the significant difference in co-expression between A and B/C, suggesting the disease-specific gene expression pattern in AAT.
Figure 1. Sample clustering for three groups, including AMI, SA and 20 healthy volunteers.
(A): Dendrograms at the top and left of correlation matrix were hierarchical clustering of samples; (B): condition cluster based on average signal intensity of each probe. The color of each cell symbolized the Spearman correlation of each sample pairs, from high (red) to low (blue). The color band above the correlation matrix is the symbols of sample condition: AMI (gold), SA (red), and healthy control (blue). AMI: acute myocardial infarction; SA: stable angina.
Figure 2. Hierarchical cluster tree showing co-expression modules identified using WGCNA.
Remaining color bands represented the high signal intensity (red) or the low signal intensity (green) probes for each sample. The color band on the left indicated conditions: A (gold), B (red) and C (blue).
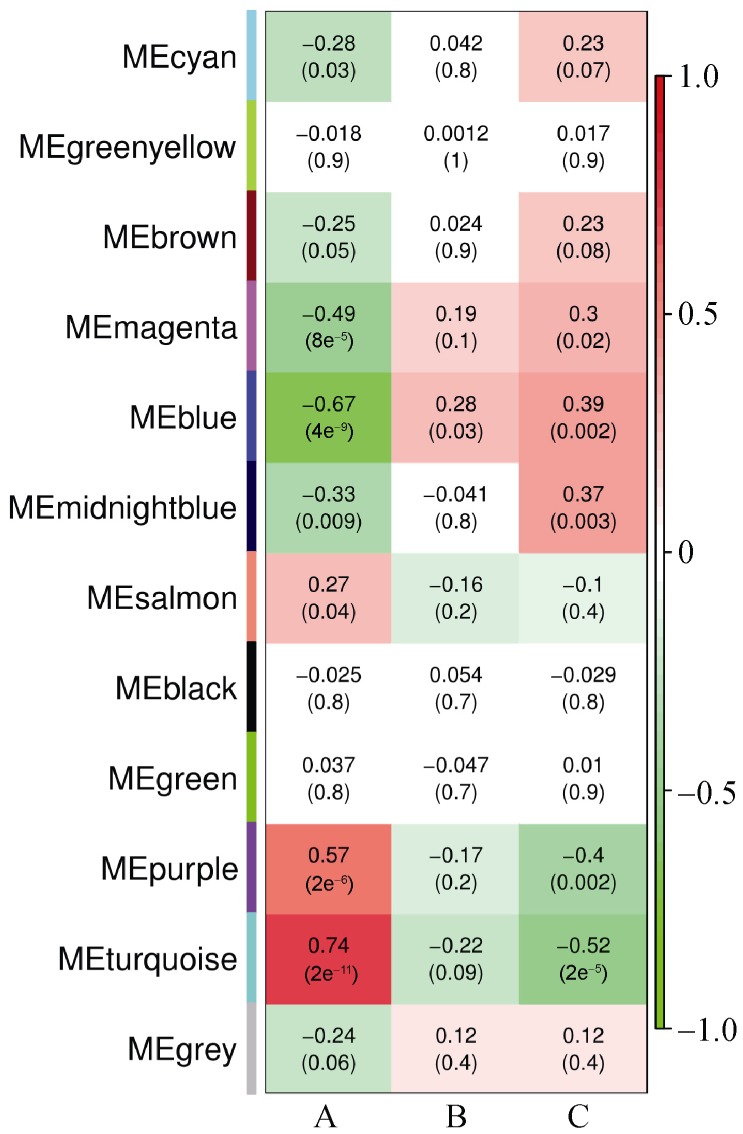
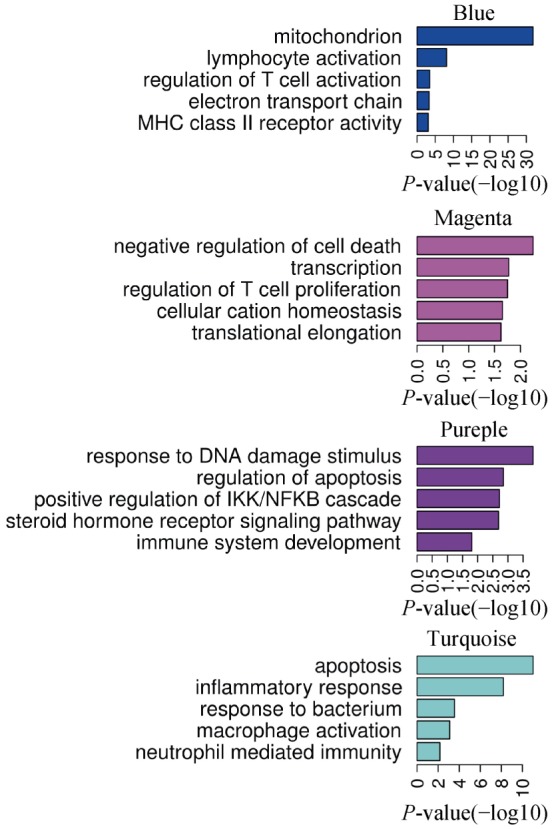
In order to show the detailed disease-specific gene expressions in AAT, Heat map of correlations and corresponding P-values between modules and conditions were estimated, as illustrated in Figure 3. Each module was represented by its module eigengene. Among distinct groups (columns), in group A, 3 modules are positively correlated while 4 were negatively correlated (all P < 0.05). Color of each cell indicated the level of correlation between gene co-expressions with condition specific expression. The turquoise module is highly positively correlated with r = 0.74 (P = 2e−11), while in purple module r = 0.57(P = 2e−6). The blue module is significantly negatively related with r = −0.67 (P = 4e−9), and in the magenta module r = −0.49 (P = 8e−5). We chose these four differentially expressed modules to show the genes functions, as displayed in Figure 4. We used the method of GO terms in the enriched functions. The blue and magenta modules included mitochondrion, negative regulation of cell death, lymphocyte activation, regulation of T cell activation and proliferation and so on. While the purple and turquoise modules contained response to DNA damage stimulus, apoptosis, inflammatory response, response to bacterium, macrophage activation and so on (Figure 4).
Figure 3. Heatmap of correlations and corresponding P-values between modules and conditions.

Each module is represented by its module eigengene. Number in each squar represents correlation (and P-value of correlation) between module and condition. The square color represents: positive correlation (red); negative correlation (green); or no correlation (white). Many modules reported modules (rows) are significantly (P < 0.05) positively-correlated (i.e., turquoise module) or negatively-correlated (i.e. blue module) with distinct conditions (columns).
Figure 4. Function enriched in four modules.

GO terms enriched in four modules were list on the right. Bargraph indicated the Benjamani-Hochberg adjusted P values (-log10 transferred).
4. Discussion
Sample clustering showed long distance between A and B/C, and short distance between B and C, suggesting the disease-specific gene expression pattern in AAT. Hierarchical cluster analysis was done to classify all the genes into several co-expression modules, and significant difference was observed in the co-expression modules between A and B/C. Co-expression modules analysis showed the expression of some genes was markedly different in group A from that in group B and group C. Genes with significantly down-regulated expression in group A were mainly related to mitochondrion, lymphocyte activation, regulation of T cell activation electron transport chain, MHC class II receptor activity, negative regulation of cell death, transcription, regulation of T cell proliferation, cellular cation homeostasis and translational elongation. Genes with significantly up-regulated expression in group A were mainly associated with response to DNA damage stimulus, regulation of apoptosis, positive regulation of IKK/NFKB cascade, steroid hormone receptor signaling pathway, immune system development, apoptosis, inflammatory response, response to bacterium, macrophage activation and neutrophil mediated immunity.
Biological function analysis of gene expression modules with significant difference showed the injury to cells and tissues, reduced mitochondrial metabolism, compromised ion balance, decreased T cells function, reduced short antigen presenting, declined activity of CD4 receptor, increased cell apoptosis, increased inflammation, elevated phagocytosis, elevated neutrophil-mediated immunity and increased post-traumatic repair of cells and tissues in group A.
Coronary arterial thrombosis causes acute myocardial ischemia and hypoxia, injury and necrosis of myocytes, disordered energy metabolism and ion metabolism, elevated repair of tissues and cells with DNA guided protein synthesis, increased inflammatory reaction and elevated activity of phagocytes, which are reflections of the pathophysiological changes after injury and necrosis of cells and tissues.
In group A, the biological functions of differentially expressed genes were associated to compromised immune function which was characterized by reduced T cells function, inhibited proliferation of T cells, and reduced activity of MHC class II receptor. CD3 positive cells refer to total T cells and play a central role in the immunity. CD3 positive T cells can differentiate into CD4+ T cells and CD8+ T cells. CD4+ T cells may accept signals after antigen presenting and secret different cytokines to combat with different pathogens and assist B cell activity. CD8+ T cells may directly kill the cells infected by virus or bacterium, allogeneic cells and cancer cells.[9],[10] NK cells are a participant of innate immunity, belong to T cells differentiated from primitive macrophages and have similar killing function to CD8+ T cells.[11]
In group A, the T cells function was significantly compromised, suggesting the collapse of immune defense. What is the consequence of collapse of immune defense? Under this condition, the human body fails to effectively and timely clear foreign pathogenic microorganisms and endogenous cancer cells. In the present study, cancers were excluded from these subjects. Thus, we speculated that the pathogenesis of AAT was related to the inflammatory reaction after arterial intima infection caused by potential pathogenic microorganisms in human body.
The pathogenesis of AAT is closely related to significantly compromised functions of T cells, an important participant of immunity in human body. Our findings provide new evidence on the pathogenesis of AAT.
Acknowledgments
The study was supported by Shanghai Traditional Chinese Medicine 3-year Development Program (2014–2016).
References
- 1.Kashyap VS, Reil TD, Moore WS, et al. Acute arterial thrombosis causes endothelial dysfunction: a new paradigm for thrombolytic therapy. J Vasc Surg. 2001;34:323–329. doi: 10.1067/mva.2001.115004. [DOI] [PubMed] [Google Scholar]
- 2.Rautou PE, Vion AC, Amabile N, et al. Microparticles, vascular function, and atherothrombosis. Circ Res. 2011;109:593–606. doi: 10.1161/CIRCRESAHA.110.233163. [DOI] [PubMed] [Google Scholar]
- 3.Siddiqui TI, Kumar K S A, Dikshit DK. Platelets and atherothrombosis: causes, targets and treatments for thrombosis. Curr Med Chem. 2013;20:2779–2797. doi: 10.2174/0929867311320220004. [DOI] [PubMed] [Google Scholar]
- 4.Thygesen K, Alpert JS, Jaffe AS, et al. Third universal definition of myocardial infarction. J Am Coll Cardiol. 2012;60:1581–1598. doi: 10.1016/j.jacc.2012.08.001. [DOI] [PubMed] [Google Scholar]
- 5.Pepper SD, Saunders EK, Edwards LE, et al. The utility of MAS5 expression summary and detection call algorithms. BMC bioinformatics. 2007;8:273. doi: 10.1186/1471-2105-8-273. [DOI] [PMC free article] [PubMed] [Google Scholar]
- 6.Langfelder P, Horvath S. WGCNA: an R package for weighted correlation network analysis. BMC bioinformatics. 2008;9:559. doi: 10.1186/1471-2105-9-559. [DOI] [PMC free article] [PubMed] [Google Scholar]
- 7.Langfelder P, Horvath S. Fast R functions for robust correlations and hierarchical clustering. J Stat Softw. 2012:46. [PMC free article] [PubMed] [Google Scholar]
- 8.Huang da W, Sherman BT, Lempicki RA. Systematic and integrative analysis of large gene lists using DAVID bioinformatics resources. Nat Protoc. 2009;4:44–57. doi: 10.1038/nprot.2008.211. [DOI] [PubMed] [Google Scholar]
- 9.McKinstry KK, Strutt TM, Swain SL. Regulation of CD4+ T-cell contraction during pathogen challenge. Immunol Rev. 2010;236:110–124. doi: 10.1111/j.1600-065X.2010.00921.x. [DOI] [PMC free article] [PubMed] [Google Scholar]
- 10.Gadhamsetty S, Marée AF, Beltman JB, et al. A general functionLal response of cytotoxic T lymphocyte-mediated killing of target cells. Biophys J. 2014;106:1780–1791. doi: 10.1016/j.bpj.2014.01.048. [DOI] [PMC free article] [PubMed] [Google Scholar]
- 11.Sun JC, Lanier LL. NK cell development, homeostasis and function: parallels with CD8+ T cells. Nat Rev Immunol. 2011;11:645–657. doi: 10.1038/nri3044. [DOI] [PMC free article] [PubMed] [Google Scholar]


