

Significance
Nervous systems contain vast numbers of neurons with diverse shapes and complex spatial relationships. We describe new genetic tools for the efficient visualization by light microscopy of individual neurons and their relative positions in Drosophila. The application of these methods to the visual system revealed an unexpected diversity of cell-type–specific arrangements of neuronal processes within a single brain region. This wide range of stereotyped cell arrangements provides distinct circuit elements for processing visual information and implies the existence of a surprisingly large number of genetic programs that produce these arrangements during development.
Keywords: neuroanatomy, Drosophila, interneuron diversity, light microscopy, recombinase
Abstract
We describe the development and application of methods for high-throughput neuroanatomy in Drosophila using light microscopy. These tools enable efficient multicolor stochastic labeling of neurons at both low and high densities. Expression of multiple membrane-targeted and distinct epitope-tagged proteins is controlled both by a transcriptional driver and by stochastic, recombinase-mediated excision of transcription-terminating cassettes. This MultiColor FlpOut (MCFO) approach can be used to reveal cell shapes and relative cell positions and to track the progeny of precursor cells through development. Using two different recombinases, the number of cells labeled and the number of color combinations observed in those cells can be controlled separately. We demonstrate the utility of MCFO in a detailed study of diversity and variability of Distal medulla (Dm) neurons, multicolumnar local interneurons in the adult visual system. Similar to many brain regions, the medulla has a repetitive columnar structure that supports parallel information processing together with orthogonal layers of cell processes that enable communication between columns. We find that, within a medulla layer, processes of the cells of a given Dm neuron type form distinct patterns that reflect both the morphology of individual cells and the relative positions of their arbors. These stereotyped cell arrangements differ between cell types and can even differ for the processes of the same cell type in different medulla layers. This unexpected diversity of coverage patterns provides multiple independent ways of integrating visual information across the retinotopic columns and implies the existence of multiple developmental mechanisms that generate these distinct patterns.
Nervous systems contain numerous and diverse cells displaying complex anatomical relationships. The specification and patterning of these cells must be generated by the execution of a much smaller set of instructions encoded in the genome. How many different genetic algorithms are needed? How precise are their outcomes? What types of rules do they follow? Answering such questions requires knowledge of the anatomy of neuronal processes for many different cell types, for numerous cells of the same type, and in multiple individuals. We describe here the development of a set of methods for collecting such data by light microscopy and their application in the adult visual system of Drosophila.
Neuronal morphology is often sufficiently stereotyped to identify cell types. For example, many cell populations in vertebrate and invertebrate visual systems can be reliably distinguished on the basis of cell shape (1–3). In at least some cases, these anatomical cell types have been shown to correlate well with classifications based on genetic marker expression or functional properties. Important anatomical features are not limited to cell shape, but also include the spatial relationships between cells. One critical type of cellular relationship is synaptic connections between cells. However, even neurons that do not synapse with each other often show distinct distributions relative to one another. Examples are the tiling of dendrites of certain sensory neurons in the body wall of larval Drosophila (4) and the nonrandom distribution of somata and arborizations of neurons of the same type in the vertebrate retina (1). Here we ask: how many distinguishable types of cell process arrangements can be observed within a group of related cell types in a single brain area? The optic lobes of the visual system are well suited for such an exploration of stereotypy and diversity of the morphology and relative arrangements of neuronal arbors both within and across cell types.
The overall organization of the optic lobes illustrates two widespread neuroanatomical themes: the distribution of neuronal arbors across a series of layers and repetitive columnar structures that support parallel information processing. Golgi impregnations have been used to describe layer-specific arborizations of over 100 morphologically distinct optic lobe cell types (3), extending earlier studies in other insect species (5–7) to Drosophila. Studies using genetic methods for single-cell labeling have confirmed many of these cell types and newly identified others (8, 9). For ∼60 cell types in two optic lobe subregions, the lamina and medulla, their synaptic connectivity has been revealed through serial-section electron microscopy (EM) (10–13). Cell types that have arbors that span only one or a few medulla columns have been the easiest to characterize. Much less is known about how the processes of neurons that span many columns are distributed within medulla layers, relative to both the array of medulla columns and to other cells of the same type in the same layer.
Systematic studies of arbor arrangements require methods to visualize the processes of multiple individual neurons from a defined cell population in the same brain. The requirement for reproducible experimental access to specific cell populations has been largely met by the development of large collections of genetic driver lines (14–16), many of which are sufficiently specific for most anatomical studies and which collectively are likely to include all of the neuronal cell types of the fly brain. In principle, dense reconstructions by EM can provide complete information about neuronal shapes and connections. However, this approach is currently too laborious to collect the large datasets required to answer the questions that we have posed. Although it has been possible to collect large datasets with single-color labeling (17), visualization of neuronal arrangements by light microscopy has been greatly enhanced by the development of methods for combinatorial multicolor stochastic labeling such as Brainbow (18, 19). Several adaptations of Brainbow are available in Drosophila (20, 21); however, precise control of labeling density and reliable visualization of fine neuronal arbors remains challenging.
In this study, we developed tools and methods for the efficient characterization of neuronal cell shapes, the discovery of complex cellular arrangements, and the tracking of cell lineages. These tools are based on a multicolor adaptation of the “flp-out” (22) approach that allows efficient stochastic labeling over a wide range of labeling frequencies. They also use recently developed protein reporters that improve the detection of fine neuronal processes (23). We applied these methods together with selective GAL4 drivers to characterize a family of multicolumnar local interneurons with processes in the outer half of the medulla. Each of these 18 Dm-neuron types, the majority of which had not been previously described, can be identified by a combination of stereotyped anatomical characteristics that distinguish each type from the other types; however, we also observed considerable within-type morphological variability. Stereotyped, cell-type–specific features included a surprising diversity of distributions of neuronal processes within single layers of the medulla; individual cell types, although covering the entire layer, appeared to obey different patterning rules: In some cases, individual cells overlapped, whereas in others they tiled. Arbors of cells of different cell types often had very different sizes and shapes, and in such cases, the individual cells of different cell types would collect input from widely different numbers and arrangements of retinotopic columns. This variety of aborization patterns provides a potential anatomical basis for integrating visual information from diverse subsets of medulla columns and points to the existence of developmental patterning mechanisms that ensure the stereotypy of these distinct types of subdivisions of the medulla array.
Results and Discussion
A Set of Optimized Reporter Constructs.
Resolving multiple neuronal processes in the same specimen requires a set of distinct reporters that can be used to label neurons in unique colors. As distinct labels, we used five different epitope tags; each individual reporter construct carried 10 copies of one of these tags inserted into the backbone of superfolder green fluorescent protein (sfGFP) (24) that had been rendered nonfluorescent by mutation (Fig. 1A). The resultant proteins, named smGFPs (for “spaghetti monster GFP”), are described in detail elsewhere (23). To improve labeling of fine neuronal processes, the smGFPs were targeted to the plasma membrane using an N-terminal myristoylation signal (Fig. 1A) (25).
Fig. 1.
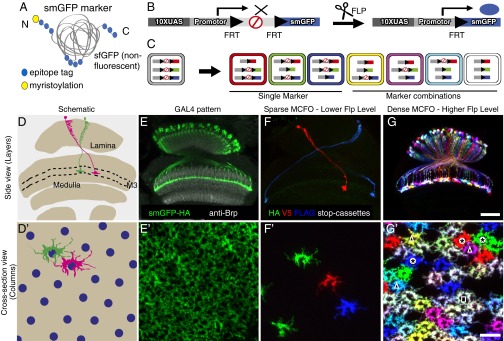
MCFO as a tool for visualization of neurons and neuronal arrangements. (A) Schematic of smGFP markers. Multiple copies of a single epitope tag (HA, FLAG, MYC, V5, or OLLAS; blue circles) are inserted in groups into a backbone of myristoylated (yellow circle) nonfluorescent superfolder GFP (gray). (B) Schematic of an individual MCFO reporter with 10 Upstream Activating Sequences (10XUAS) and a core promoter for GAL4-activated expression, a transcriptional terminator flanked by Flp Recombination Target (FRT) sites, and an smGFP marker. We also made similar constructs for use with the LexA/LexAop2 transcription control system (SI Appendix, Table S1). Flp-recombinase excision of the terminator permits marker expression. Flies with a combination of three stop cassettes were used for the experiments (F–G′). (C) Potential marker combinations with three MCFO stop cassettes with different smGFPs: unlabeled (gray), one marker (red, green, blue), or combinations of two (yellow, magenta, cyan) or three (white) labels. Additional intermediate colors are often observed in specimens, possibly due to differences in the timing of the removal of individual terminator cassettes. (D–G′) Sparse and dense MCFO labeling of L3 lamina neurons. Side (D–G) and cross-section views (D′–G′) show neuropil layers and columns, respectively. Cross-section views are at the level of the L3 terminals in layer M3 (D and D′). (D and D′) Diagram of lamina and medulla (D) or part of medulla layer M3 (D′) with two L3 neurons (of ∼750). Layer M3 (of layers M1–M10; area between dashed lines in D) and the array of photoreceptor neurons (blue circles in D′) are indicated. (E and E′) Overall GAL4 expression (green) with anti-Brp neuropil marker (gray, E). (F–G′) MCFO labeling with three stop-cassette reporters with HA, V5, and FLAG smGFPs, respectively. Flp recombinase (pBPhsFlp2::PEST) (SI Appendix) was induced in adult flies by a 12 min (F and F′) or 40 min (G and G′) shift from 25 °C to 37 °C for sparse (F and F′) or dense (G and G′) L3 labeling, respectively. Examples of cells showing the single (asterisks), double (triangles), and triple (square) marker combinations illustrated in C are indicated in G′. [Scale bars: 30 µm (E–G) or 10 µm (E′–G′).] For detailed genotypes used for this and other figures, see SI Appendix, Tables S2 and S3.
We constructed transgenic animals in which the smGFPs were expressed under the control of either GAL4 (26) or LexA (25, 27) binary systems. In addition to this transcription control, we engineered a second, orthogonal level of control by incorporating a transcriptional interruption cassette into the smGFP constructs (22, 28). In this way, expression of smGFPs could be made conditional on both the expression of the transcriptional activator and of a recombinase that removed the interruption cassette (Fig. 1B; for details, see SI Appendix). All constructs and fly strains are listed in SI Appendix, Table S1; this table also includes some transgenes described only in the SI Appendix. To support multicolor labeling experiments (see below), fly lines with combinations of three or four reporter constructs were constructed (SI Appendix, Table S2).
Combined Use of Multiple Interruption Cassette Reporters.
Multiple smGFP stop-cassette reporters with different epitope tags can be used in combination for multicolor stochastic labeling (Fig. 1 C–G). We refer to this approach as MultiColor FlpOut (MCFO; an extension of “flp-out,” an informal term for Flp-mediated stop-cassette excision). Similar to other multicolor labeling methods such as Brainbow (18, 20, 21), MCFO has the potential to increase label diversity through marker coexpression. For example, with three stop-cassette reporters, seven potential marker combinations (not counting unlabeled cells) are predicted (Fig. 1C).
To explore the suitability of the MCFO method for high signal-to-noise multicolor labeling at both low and high cell densities, we compared labeling of a cell type that is present in each of the ∼750 visual columns of the fly optic lobes (Fig. 1D′) when using two different expression levels of the Flp recombinase (Fig. 1 F–G′). Specifically, we used a GAL4 line with expression in L3 lamina neurons (R14B07) (Fig. 1 E and E′), three MCFO reporters, and a heat-inducible Flp source for conditional recombinase expression (for detailed genotypes see SI Appendix). Stop-cassette excision was triggered by temperature shifts in adult flies. With a short Flp induction period (Fig. 1 F and F′) few labeled cells were observed (<10% of total L3s), and most of these cells expressed just one smGFP. After a longer heat shock, more cells were labeled (>50%) and color combinations representing all expected marker combinations (Fig. 1C) were observed (Fig. 1 G and G′). Increasing the number of MCFO reporters expressing distinct epitopes increases the number of possible marker combinations; for example, with four reporters we were able to observe all 15 predicted label combinations (SI Appendix, Fig. S1). These examples show that the MCFO approach allows both sparse and dense multicolor stochastic labeling at high signal to noise.
MCFO Facilitates Visualization of Complex Arrangements of Neuronal Arbors.
Multicolor labeling can be particularly useful in interpreting 3D patterns of neuronal arrangements. To optimize image quality through the full depth of a fly brain, we adapted a clearing protocol in which dehydrated brains are cleared with xylene and embedded in DPX (29) (SI Appendix). MCFO-labeled cells in these samples can be imaged with minimal loss of signal without z-depth–dependent adjustments of microscope settings; this greatly simplifies the imaging setup and facilitates the maintenance of color constancy throughout a specimen.
As an example, we used MCFO to visualize the relative positions of T1 neurons, a cell type that connects the lamina and medulla (Fig. 2 A–C) (3, 30). The terminals of T1 cells are arranged as retinotopic arrays in both lamina and medulla (Fig. 2 B and C). Individual T1 axons could be easily followed (Fig. 2A), and color constancy was sufficient to directly compare patterns of cell arrangements in the lamina and medulla without tracing each cell (Fig. 2 B and C).
Fig. 2.

Visualization of neuronal arrangements and clonal developmental origins by MCFO. (A–C) MCFO for comparing relative positions of neurons in different brain regions. All images are resampled views of the same image stack generated computationally using Vaa3D (44). Side view (A) and cross-section views (B and C) of T1 neurons in lamina (A and B) and medulla (A and C). Relative positions of T1 terminals in the arrays in lamina (B) and medulla (C) are maintained except that axon cross-over in the first optic chiasm inverts positions along the anterior–posterior axis (see numbered cells for examples; only cell 4 can be fully traced between lamina and medulla in the image in A). Approximate levels of the cross-section views shown in B and C are indicated in A. (D and E) MCFO labeling as a tool to reveal common developmental origins. Labeling of C2 and C3 centrifugal medulla-lamina neurons after Flp-recombinase induction in first instar larvae (D) or adult flies (E). The clone labeled in green in D contains >100 C3 but no C2 cells. Both C2 and C3 are present in every medulla column. A split-GAL4 driver line (R20C11-p65ADZp; R48D11-ZpGdbd) that specifically labels both C2 and C3 neurons was used in both D and E. [Scale bars: 10 µm (A–C) and 20 µm (D and E).]
MCFO as a Tool for Subdividing Patterns by Developmental Origin.
In the preceding examples, stop-cassette excision was induced in postmitotic neurons, resulting in stochastic labeling of individual cells. By contrast, when an interruption cassette is excised in a dividing cell, the progeny of that cell will inherit the activated reporter and thus show shared marker expression later in development. Variations of this approach have been widely used for lineage tracing (31). The use of multiple stop-cassette reporters can greatly aid the interpretation of such experiments by revealing the relative positions of independent clones labeled with different colors. This can be particularly useful in the optic lobes where the large number of neuroblasts, as well as extensive cell migration during development, can make clonal patterns difficult to interpret (32, 33). To illustrate this approach, we studied the origins of C2 and C3, two related columnar medulla neurons that send centrifugal projections from the medulla to the lamina (3, 30) (Fig. 2 D and E). MCFO with weak Flp induction in first instar larvae resulted in large numbers of neurons labeled in the same color (Fig. 2D). These colabeled groups often contained only either C2 or C3 cells (Fig. 2D), whereas with stop-cassette excision in adult flies, individual C2 and C3 neurons were labeled without obvious grouping (Fig. 2E). These results indicate that C2 and C3 cells have distinct developmental origins, with cells of the same type in adjacent columns often descending from the same progenitor. In principle, the same experimental approach can be applied to any pair of cell types that can be colabeled with an appropriate driver line or combination of driver lines.
Allelic Series of Flp Recombinase Drivers.
In the MCFO experiments described above, we used temperature to control the timing and level of Flp-recombinase expression. As an alternative strategy, we constitutively expressed weakened Flp variants “pan-neuronally” in differentiated neurons using a DNA fragment containing the promoter and cis regulatory elements of the N-synaptobrevin gene (R57C10) (15, 34). We then repeated the experiment shown in Fig. 1 D–G using, instead of a heat-inducible source of Flp, R57C10 promoter-coding sequence fusions of the FlpL2, Flp2::PEST, Flp2, and FlpL variants (see SI Appendix for details). Expression of Flp2::PEST, Flp2, and FlpL generated stochastic MCFO cassette excision with the fraction of L3 cells labeled increasing with the strength of the Flp variant from about 1 in 100 to 1 in 10 (Fig. 3 A–D). The remaining recombinase, FlpL2, did not have sufficient activity to produce labeled cells when expressed in this way; however, 1XUAS-FlpL2 together with R57C10-GAL4 consistently produced very sparse MCFO labeling of approximately 10 cells per optic lobe, or ∼1 in 4,000 cells (Fig. 3E). These results demonstrate that constitutive low levels of Flp activity can be reliably used to sample small numbers of neurons from very broad expression patterns.
Fig. 3.
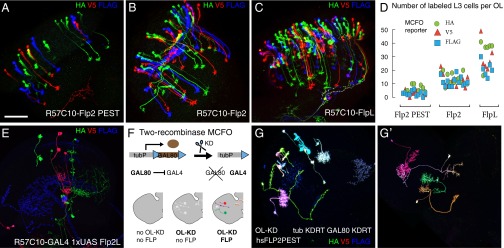
Additional recombinase drivers expand MCFO applications. (A–D) Broad expression of Flp variants in mature neurons enables heat-shock–independent MCFO labeling at different densities. (A–C) MCFO labeling of L3 neurons with R57C10-driven expression of Flp alleles. Experiments were as in Fig. 1 but no heat shock was applied. Images are maximum-intensity projections that show optic lobes including the lamina in rotated (dorsal more to the right) frontal views. L3 neuron cell bodies and dendrites in the lamina are located in the upper (C) or upper right (A and B) part of the images. L3 axons project to the medulla. (Scale bar: 50 µm.) (D) The number of labeled L3 cells (y axis in graph) was counted for each stop-cassette reporter (HA, V5, or FLAG) in 1- to 5-d-old female flies. Median number of total labeled cells per optic lobe was 10 for Flp2::PEST (n = 11 optic lobes), 38 for Flp2 (n = 13), and 83 for FlpL (n = 6). Labeling density increases with age, as R57C10 continues to be expressed in adult flies. FlpL2 MCFO did not label any cells in these experiments (no labeling; n = 20), suggesting an over 100-fold reduction in activity compared with Flp2::PEST. (E–G′) Approaches for sampling single cells from very broad GAL4 patterns. Images in E, G, and G′ show maximum-intensity projections through optic lobes (E and G) or through part of an optic lobe and the adjacent central brain (G′). (E) MCFO with R57C10-GAL4 driving both 1XUAS-FlpL2 and MCFO reporter expression. (F, G, and G′) Combined use of multiple recombinases for sparse labeling of optic lobe neurons. (F) Schematic. Ubiquitous expression (tubulin promoter, tubP) of GAL80 suppresses activity of broadly expressed (R57C10) GAL4. KD-recombinase (expressed in the developing optic lobe, OL-KD) drives excision of the GAL80 transgene via flanking KD-recombinase Target Recognition (KDRT) sites. In cells without GAL80, GAL4 becomes active; these cells (shown as white cells in OL-KD, no FLP diagram) can be labeled by MCFO, here induced with pBPhsFlp2::PEST. (G and G′) Two examples of two-recombinase MCFO labeling as described in F. Note that both patterns are sparse but consist of neurons labeled in a much broader range of colors than those in E.
Based on the broad R57C10 expression pattern, the R57C10-Flp driver lines are expected to permit MCFO labeling of most or all neuronal cell types; indeed, we have successfully used these reagents in the characterization of many GAL4 lines with diverse expression patterns (this study and ref. 35). However, as R57C10 expression is not completely uniform across cell types, overrepresentation of some neurons in such experiments may occur. Combining data from experiments with different Flp drivers (such as Hsp- and R57C0-based reagents) can be used to mitigate such labeling biases.
Combining MCFO with Other Recombinase-Based Genetic Methods.
We expect MCFO with the Hsp- and R57C10-Flp drivers described above to be suitable for most common stochastic labeling applications; to simplify the genetics, we built fly lines (SI Appendix, Table S2) that permit such experiments with a single fly cross. We have used those lines here and they have also been used in other brain regions (35, 36). However, the MCFO reagents can also be readily incorporated into more complex genetic schemes. An example is the following method for very sparse neuronal sampling that is targeted primarily to optic lobe neurons and offers increased frequencies of color combinations.
At very low labeling frequencies, only a small number of cells show combined expression of multiple MCFO markers; this is expected because both the number of labeled cells and the frequency of color combinations increase in parallel with recombinase activity. One approach to obtain very sparse labeling while maintaining the full spectrum of possible colors is to use a combination of two recombinases with orthogonal specificity: One recombinase preselects a small number of cells for potential labeling and the second controls the extent of MCFO cassette excision. A related approach has been used to obtain sparser labeling patterns with the FlyBow method (21).
To illustrate the two-recombinase MCFO method, we used a combination of the KD/KDRT (28) and FLP/FRT systems to visualize optic lobe neurons from the pan-neuronal R57C10 pattern (Fig. 3 F, G, and G′). Weak KD recombinase activity, expressed in the developing optic lobe from an R29C07-KD gene fusion (OL-KD) (SI Appendix), results in infrequent excision of a GAL80 repressor cassette driven from the ubiquitous tubulin promoter (37) (see SI Appendix, Table S1 for constructs); in cells where GAL80 is absent, GAL4 is functional. Heat-shock–induced expression of Flp recombinase in adult flies can then be used to label these GAL80-negative cells by MCFO. Note that although the number of labeled cells in these experiments was roughly similar to the sparse labeling with FlpL2 described above (Fig. 3E), many more color combinations were observed (compare Fig. 3 G and G′ and Fig. 3E). Furthermore, low-level GAL4-dependent background labeling, presumably due to transcriptional read-through of the stop cassettes, was undetectable in these experiments due to the presence of the GAL80 repressor in nearly all unlabeled cells.
This example also illustrates another MCFO application: Because some of the OL-KD–mediated excision events occur in progenitor cells of optic lobe neurons, repeated colabeling of specific cell types or groups of cells of the same type in these experiments suggests a common developmental origin (see SI Appendix, Fig. S2, for examples); such experiments can validate or extend emergent information on the origins of neuronal diversity in the optic lobe (33).
Many genetic approaches in Drosophila rely on the FLP/FRT system, including MARCM, recombinase-mediated genetic intersections, and lineage tracing (38, 39). To facilitate combining such methods with MCFO, for example, to reveal individual cells in a MARCM clone, we generated stop-cassette reporters in which the FRT sites were replaced by recognition sites for two Flp-related recombinases with orthogonal site specificity, B3 and KD (28) (SI Appendix, Table S1).
Identification of Local Interneurons in Medulla Layers M1–M5 Using MCFO Labeling and Gal4 Driver Lines.
We next applied MCFO to explore the diversity and variability of multicolumnar neurons and their arbor arrangements in the visual system. We focused on a subset of amacrine-like local interneurons in the medulla, specifically in layers M1–M5. These layers contain the terminals of lamina monopolar cells, which provide inputs critical for fly motion vision. Local neurons in these layers, as well as the adjacent M6 layer, belong to a general class previously named Dm cells (3).
For an initial assessment of Dm neuron diversity, we surveyed a collection of over 10,000 single MCFO-labeled optic lobe neurons generated using the sparse labeling approaches described above (Fig. 3 E, G, and G′). These images also include a reference marker that can be used to identify layer positions of arbors in the medulla (SI Appendix, Fig. S3). We have previously used images from this collection, which will be further described and made available elsewhere, to validate shapes of EM-reconstructed optic lobe neurons (10). This dataset revealed several Dm neurons with processes in layers M1–M5, including cells that did not readily match previously described cell types, suggesting considerable uncharacterized Dm neuron diversity or variability.
To obtain genetic markers for Dm neurons, we screened collections of over 7,000 imaged GAL4 lines (14–16). This initial screening relied on anatomical features that were recognizable at the population level, such as arborizations in specific layers or the number and distribution of cell bodies. We then used MCFO analysis to obtain images of individual cells labeled by selected lines (Fig. 4 A–C′; SI Appendix, Fig. S4) and compared these images to each other and to neurons from the single-cell dataset (Fig. 4 A′′, B′′, and C′′). As described below, this allowed us to establish anatomical criteria to distinguish different Dm cell types and to identify, for each type, a GAL4 line that predominantly labeled cells of this type. In this way, we identified 13 Dm cells with processes primarily in M1–M5, plus five cell types with arbors also extending into the deeper M6 layer.
Fig. 4.

Characterization of local interneurons in the outer medulla using MCFO. (A–C′′) Overall medulla pattern (A–C) and MCFO (A′, B′, and C′) labeling of selected GAL4 lines and examples of segmented single cells (SI Appendix) from sparse MCFO labeling of R57C10 (A′′–C′′) for three Dm cell types (Dm11, A–A′′; Dm4, B–B′′; Dm12, C–C′′). Anti-Brp reference pattern (45) is in gray. Images in A′–C′′ are reoriented substack projections. (Scale bars: 20 µm.) (D) Schematics showing the layer patterns of all Dm cell types examined in this study. Cell types were initially classified based primarily on layer innervation; for some cell populations with similar or overlapping layer position, we also carried out double-labeling experiments using LexA and GAL4 lines (SI Appendix, Fig. S5) to directly confirm their distinct identity and relative layer positions. All cells are shown in the same orientation (anterior left) and scale. The names of cell types not described in previous Golgi or EM studies are in boldface type. Dm neurons show diverse, cell-type–specific patterns that in combination included all layers of the outer medulla. The most similar layer positions were observed for a group of seven cell types with monostratified arbors in layer M2 or the adjacent proximal part of layer M1. These cell types (Dm1, Dm14, Dm15, Dm17, Dm18, and Dm19) with identical or near identical layer positions can be distinguished by other properties such as arbor size and shape, cell body distribution, or intracolumnar arbor position (SI Appendix, Table S4).
To classify Dm cell types, we initially focused on layer positions of arbors in the medulla; layer patterns were assessed by comparison with a reference marker (Fig. 4; SI Appendix, Figs. S3 and S4). In some cases, we also carried out double-labeling experiments, using LexA and GAL4 lines (see SI Appendix, Fig. S5) to further compare similar layer positions and to confirm the distinct identity of similar cell types. Layer patterns of Dm neurons are illustrated in Fig. 4D and summarized in SI Appendix, Table S4. This table also lists other key characteristics of each Dm cell type, many of which are discussed below.
Comparison of shapes (Fig. 5A) and layer patterns of the Dm cells with the Fischbach Golgi study (3) and other light microscopy (9, 40–42) or EM (10) analyses revealed that 10 of 18 types had not been previously identified (Fig. 4D). By contrast, we observed an almost complete concordance between the GAL4 line screening and single-cell sampling using the R57C10 driver; only Dm17, which has only about five cells per optic lobe, was found in a GAL4 line but not in the single-cell collection. This correspondence suggests that we have identified all, or nearly all, Dm cell types in layers M1–M5. Local interneurons with arbors primarily in layer ∼M6 (3, 9, 43) may include some additional Dm cells that await further characterization.
Fig. 5.

Diversity of arbor size, shape, and polarity. (A) Images of Dm cells segmented from MCFO images and reoriented to show cross-section view. Cells are shown in the same orientation (anterior up, dorsal left; approximate axes are indicated) and scale. Approximate size of “1 column” is indicated. (B–E) Stereotypy of arbor orientation and polarity. Reoriented views of the entire medulla with MCFO labeling of several cells of a type are shown for Dm3 (B), Dm16 (C), Dm15 (D), and Dm12 (E). For GAL4 lines used, see SI Appendix, Table S3. (Scale bars: 20 µm.)
Dm Neurons Show Diverse Patterns of Cell Body Distributions.
Overall GAL4 line expression patterns indicated that the processes of cells of each Dm neuron type were present across the entire array of medulla columns (SI Appendix, Figs. S4 and S6). By contrast, in the same GAL4 line images, the cell bodies of some Dm neurons occupied restricted subregions of the cell body rind of the medulla (SI Appendix, Fig. S6). Such regional cell body distributions were most easily observed when entire Dm cell populations were labeled, but also were seen after combining MCFO-labeled cells of the same type from multiple specimens (SI Appendix, Fig. S6). The distinct somata distributions (SI Appendix, Fig. S6 and Table S4) presumably reflect the developmental origins of these cells; knowledge of such patterns can help to distinguish cells with otherwise similar morphology.
Dm Neuron Arborizations Within the Plane of Medulla Layers Show Cell-Type–Specific Differences of Size, Shape, and Orientation.
How the processes of multicolumnar neurons, such as Dm cells, are distributed laterally across columns within medulla layers is largely unknown. Available Golgi drawings (3) primarily show side views, and EM reconstruction has so far been limited to volumes that are too small to reveal the full extent of most multicolumnar cells (10). Layer cross-section views of the arbors of individual cells of the different Dm cell types show a large diversity of size, orientation, and fine structure (Fig. 5A). Comparison of multiple cells of each type, using MCFO labeling with selective GAL4 driver lines, indicated that many aspects of these morphologies were stereotyped (Fig. 5 B–E; SI Appendix, Fig. S7): Cells of the same type, whether in the same optic lobe (Fig. 5 B–E; Figs. 6 and 7) or from different flies (SI Appendix, Fig. S7), could be readily distinguished from cells of most or all other types. For these comparisons, we examined at least five MCFO-labeled optic lobes for each cell type; the total number of labeled cells depended on the cell type (8 for Dm17 and Dm19; from 20 to over 200 for the others).
Fig. 6.
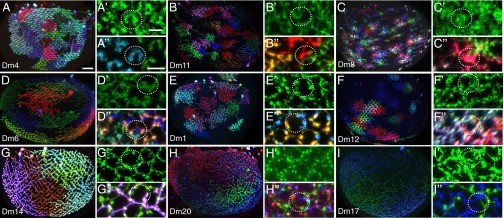
Diversity of arbor arrangements of local interneurons in the medulla. Distribution of MCFO-labeled cells over the entire medulla (A–I). Cross-section views of the full GAL4 line pattern in a few columns (A′–I′) showed distinct patterns for each cell type; however, these patterns were not sufficient to predict the arrangement of individual cells. MCFO-labeled cells in a few columns of each cell type (A′′–I′′). White dashed circles indicate the approximate size of a medulla column. Cell types are indicated. Reoriented substack projections are shown. [Scale bars: 20 µm (A–I) and 5 μm (the scale bar in A′ applies to all single prime panels and that in A′′ to all double prime panels).]
Fig. 7.

Position and distribution of processes of multistratified neurons in different layers. Cross-section views (reoriented substack projections) of MCFO-labeled processes are shown. Approximate layer positions are indicated in each panel. For each cell type, views of the same group of cells in two different layers are shown. Top panels (A–F) show a more distal layer position than lower panels (A′–F′). Dorsal is to the right in A and A′. (Scale bar: 10 µm.)
Closer inspection revealed some of the stereotyped characteristics of the arbors of different Dm cell types. One was approximate arbor size, which ranged from about two columns for Dm2 to around half of the medulla for Dm17 (see SI Appendix, Table S4 for other Dm neurons). The arbor sizes of multiple cells from the same cell type showed a fairly narrow distribution, as discussed in more detail below.
The outlines of the areas covered by individual Dm neurons were similar for cells of some types but highly variable for others. This is illustrated by the examples in SI Appendix, Fig. S7: All Dm12 cells had a roughly circular outline, whereas the shape of Dm1 and Dm17 cells was much more variable within each type. The most consistent arbor shapes were shown by seven smaller Dm types (Dm2, Dm3, Dm10, Dm12, Dm15, and to a lesser extent, Dm8 and Dm16). Some of these cell types also had distinct arbor orientations (Fig. 5 B–D). Dm3 cells are highly elongated and largely aligned with rows of medulla columns; they could be further subdivided into two groups that primarily extend in one of two orthogonal directions (posterior–dorsal and posterior–ventral) (Fig. 5B). Dm16 cells are oriented along the dorsal–ventral axis; their arborizations decrease in density in a dorsal-to-ventral direction (Fig. 5 A and C). The smaller Dm2 cells showed a similar polarization of arbor density in the opposite direction, with a short extension pointing dorsally from the column with the main Dm2 arbors (Fig. 5A; also see Fig. 7). The roughly ellipse-shaped Dm15 arbors (Fig. 5 A and D) did not show such planar polarity, but their long axis was preferentially oriented at a slight angle to the anterior–posterior axis. Dm12 arbors have approximately circular shapes and thus no preferential orientation (Fig. 5E). The distinct within-layer morphologies of different Dm cell types (Fig. 5A; summarized in SI Appendix, Table S4) are likely to reflect both cell intrinsic properties and interactions with other cells, as examined further below.
Dm Neuron Arbor Arrangements Are Cell-Type–Specific, Stereotyped, and Diverse.
Dense MCFO labeling of Dm cells of the same type revealed their relative positions, a cellular property difficult to infer with single-color data alone. The extent of overlap between the arbors of individual cells varied considerably between cell types (Fig. 6). By contrast, within a cell type, relative arbor arrangements such as tiling, the lack of overlap between cells of the same type (Fig. 6 A, A′′, B, and B′′), appeared to be uniform across a given layer of the medulla, suggesting that these patterns of arbor distribution are inherent properties of each cell type. Only two Dm cell types, Dm4 and Dm11, showed tiling of arbors in all layers. In the tiling pattern of Dm4 (Fig. 6 A, A′, and A′′) medulla columns were recognizable in both the overall GAL4 line pattern and the shape of individual cells; that is, the boundaries of Dm4 cells were aligned with column boundaries such that each column contained processes of only one cell. Dm11 cells also tiled (Fig. 6 B, B′, and B′′) but did not show an obvious alignment of cell and column boundaries in layer M6 (see Fig. 7 for Dm11 patterns in other layers).
In all other Dm cell types, we observed various degrees of overlap between cells. The distribution of Dm8 processes (Fig. 6 C, C′, and C′′; also see Fig. 7 C and C′) combined elements of tiling and overlapping patterns: Individual Dm8 cells have a unique star-shaped morphology with the highest arbor density in the center; these areas of high arbor density showed little overlap with each other and largely tiled the medulla. However, each cell also had less prominent lateral extensions into neighboring columns, an innervation pattern proposed to support pooling of inputs from several R7 photoreceptor neurons (8). As a population, Dm6 terminals formed a columnar pattern (Fig. 6D′) similar to that of Dm4; however, each column received processes of several Dm6 cells (Fig. 6 D and D′′).
Several cell types formed a dense network of overlapping neurites with gaps distributed in a regular columnar pattern, as if the cells were surrounding the central part of each column (Fig. 6 E′, F′, G′, and H′; SI Appendix, Fig. S9). Despite this overall similarity, differences in the size, amount of overlap, and detailed structure of the arbors of different Dm cells resulted in distinct coverage patterns for each type: Dm1 cells (Fig. 6 E–E′′) have prominent bouton-like terminals that form circles around the apparent center of each column; in some columns, all of these boutons appeared to belong to the same cell; in others, they came from two or more cells. Dm12 cells (Fig. 6 F–F′′) overlapped more consistently than Dm1 cells. The Dm12 cell number and regular shape (Fig. 5 A and E; SI Appendix, Fig. S7 and Table S4) suggest that each column contacts processes of at least three Dm12 cells, consistent with the MCFO results. Processes of Dm14 cells (Fig. 6 G–G′′) formed a regular grid-like pattern; in the area of overlap of two Dm14 neurons, some edges in this pattern were occupied by only one of the cells, and others by both. Dm20 cells, which are similar in size but much more numerous (SI Appendix, Table S4) than Dm14 cells, show a densely intermingled network with several cells contributing to each column (Fig. 6 H–H′′). Dm17 neurites show a less regular distribution (Fig. 6 I–I′′; SI Appendix, Fig. S7) than, for example, Dm1 and Dm14. The most prominent feature of the Dm17 coverage pattern is the very large size and, although variable, the often distinct shape of Dm17 cells (Fig. 6I; SI Appendix, Fig. S7).
Overall, these results revealed a striking diversity of coverage patterns in the medulla, providing a rich neuronal substrate for information processing that relies on different subdivisions of the visual field and implying a wide range of developmental patterning processes that specifiy these arbor arrangements. Such diverse process arrangements are not limited to the Dm neurons; another example are the arbor arrangements of the Proximal medulla interneurons Pm3 and Pm4, two inner-medulla cell types (SI Appendix, Fig. S8).
Multistratified Dm Neurons Can Have Different Arrangements of Arbors in Different Layers.
Several Dm cell types have arbors in multiple medulla layers. We compared different cross-section views of arbors of six Dm neuron types with prominent multilayer patterns (Fig. 7). In each case, morphological differences between layers were seen. Dm2 cells have asymmetric extensions in M6 but not M4 (Fig. 7 A and A′), Dm10 cell arbors differ in their detailed structure between layers (Fig. 7 B and B′), and Dm8 cells are less expanded in M4 than in M6 (Fig. 7 C and C′). Dm9 cells show a tiling pattern in layers M2–M5 (Fig. 7D; layer M3 is illustrated), but their arbors overlap in layer M6 (Fig. 7D′) and also in layer M1. By contrast, Dm4 and Dm11 processes differ in structure between layers (Fig. 7 E, E′, F, and F′) but tile in all layers. These results demonstrate that patterns of cell arrangements can differ between layers even for arbors of the same cell type. This suggests that distinct developmental patterning mechanisms were used in different parts of the same cell, perhaps via interactions with distinct sets of processes of other neurons or glia in each layer.
Different Dm Neuron Types Occupy Distinct Relative Positions Within Individual Medulla Columns.
To visualize relative positions of cells of different types within a layer, we used MCFO with GAL4 drivers that express in more than one cell type. We focused on the proximal M3 layer as an example. MCFO with a driver for Dm4, Dm9, and Dm12 produced many examples of columns in which two or more cells of these types were labeled with distinct colors (Fig. 8A). These images show that Dm9 cells have processes near the center of the Dm4 terminals (Fig. 8B), which in turn are surrounded by Dm12 processes (Fig. 8C). Similar experiments with a different driver line (Fig. 8 E–G) revealed relative positions of Dm4 and Dm11 (Fig. 8F) and of Dm4 and lamina neuron L3 (Fig. 8G). To complement the MCFO results, we used double- and triple-labeling experiments with specific markers (here LexA and GAL4 drivers for Dm cells) (Fig. 8 D and H). These revealed the close association of Dm9 and Dm11 with R-cell axons (Fig. 8H) and the similar intracolumnar position of Dm12 and Dm20 (Fig. 8D).
Fig. 8.
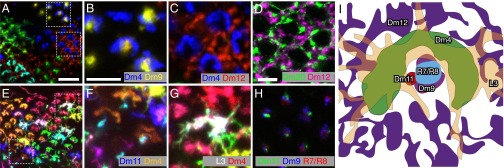
Precise intracolumnar positions of arbors of multicolumnar cells. (A–G) Relative positions of neurons of different cell types in medulla layer M3 revealed by MCFO or LexA/Gal4 double labeling. (A–C) Combined MCFO labeling of Dm4, Dm9, and Dm12 in the M3 layer. (B and C) Detailed views of Dm4/Dm9 (B) and Dm4/Dm12 (C). (E–G) MCFO of Dm4, L3, and Dm11. (F) Dm4 and Dm11. (G) L3 and Dm4. (D and H) LexA/Gal4 double labeling. (D) Dm20 (green) and Dm12 (magenta). (H) Dm11 (green), Dm9 (blue), and R7/R8 (red). R7 and R8 cells were labeled with mAb24B10. (I) Schematic diagram of column positions of cell types; several other cell types, not included in this diagram, are also present in M3. [Scale bars: 10 µm (A and E) and 5 µm (B–D and F–H).]
These examples (summarized in Fig. 8I) show that arbors of different multicolumnar cell types can occupy stereotyped relative positions within medulla columns. Distinct intracolumnar positions can distinguish similar cells in the same layer, such as Dm14 and Dm19 (SI Appendix, Fig. S9). Recent EM reconstructions (10) provide information on relative positions of medulla neurons at much higher spatial resolution than the above examples. However, available medulla EM data are currently largely limited to a single column and do not yet include many multicolumnar cell types; indeed, the details of intracolumnar positions, shapes, and arrangements of Dm cells described here should help to locate and identify these cells in future EM studies.
Although the intracolumnar patterns described above appeared generally similar in different parts of the medulla array, examination of columns at the medulla margin, which in adult flies lack R cells, revealed an exception. We found that, in these atypical columns, Dm4 arbors had a different shape and Dm9 and Dm11 processes were absent (SI Appendix, Fig. S10). This suggests that details of arbor structure can be determined on a column-by-column, rather than a cell-by-cell, basis, presumably via specific local interactions with other cell types in each column.
Cell Size Variation Shows Distinct Cell-Type–Specific Distributions.
Individual cells of one cell type rarely, if ever, look identical. We used MCFO labeling to explore such variation in a more quantitative fashion, focusing on the number of columns covered by cells of four cell types with tiling patterns in the medulla (Fig. 9). Because the arbors of these cells show a column pattern and do not overlap in the layers examined, this number can be directly obtained from MCFO images (Fig. 9 A–D). Although the column spreads of individual cells varied considerably, each cell type showed a distinct, largely unimodal distribution (Fig. 9E).
Fig. 9.

Arbor sizes of individual cells are variable but follow cell-type–specific distributions. (A–D) Outline of a cell with indicated column count for Dm9 (A), Dm11 (B), Pm4 (C), and Dm4 (D). Cross-section views of layers M3 (A, B, and D) and M9 (C) are shown. (Scale bar: 10 µm.) (E) Distribution of arbor sizes determined as illustrated in A–D. Median column coverage was 21 for Dm4 (n = 311 cells), 11 for Pm4 (n = 441), 9 for Dm11 (n = 277), and 7 for Dm9 (n = 224). We estimated the total number of cells of each type from these data by dividing the size of the medulla array (∼750 columns) by the average column spread; these estimates (Dm4, 36; Pm4, 67; Dm11, 78; and Dm9, 110) were similar to average cell body counts from GAL4 line images (Dm4, ∼40; Pm4, ∼60; Dm11, ∼70; and Dm9, ∼110).
In principle, this apparent cell size variation could be due to an unexpected precision in patterning; i.e., the size of each cell of a type could be determined by its position in the medulla and stereotyped from fly to fly. However, comparisons of different optic lobes with dense MCFO labeling of the same cell type indicate that this is not the case (illustrated in SI Appendix, Fig. S11, for Pm4). Thus, although the general coverage patterns are highly stereotyped and cell-type–specific, the precise pattern of lateral connections in the medulla is unique in each fly.
Concluding Remarks.
The MCFO approach provides an efficient method for both sparse and dense multicolor stochastic labeling. Although our examples focus on neurons in the adult visual system, the reagents and approaches presented here are generally useful for the visualization of cell shapes and cell arrangements (see refs. 35 and 36 for examples of MCFO application to neurons in the adult central brain) and for the study of developing rather than mature neurons. The MCFO reagents combine user-friendly genetics for common applications with considerable flexibility: Fly lines with both MCFO reporters and recombinase drivers (SI Appendix, Table S2) support MCFO analyses of GAL4 expression patterns in a single fly cross, and the availability of stop cassettes for use with recombinases other than Flp (B3 and KD) and with LexA instead of GAL4 drivers enables additional applications. For example, LexAop2 and UAS versions of the MCFO constructs could be readily combined for stochastic double-labeling experiments. We believe that the modular nature, excellent signal to noise, clear labeling of fine neuronal processes, and suitability for both sparse and dense labeling make MCFO the method of choice for light microscopic neuroanatomical studies in Drosophila. These methods could also prove useful in other animals.
In addition to methodological advances, our results provide new insights into the anatomy of the fly visual system and the diversity and variability of neurons and neuronal arrangements both within and between cell types in general. The identification of 10 previously unidentified Dm neuron types hints at the possibility of similar unreported cellular diversity in other groups of medulla neurons and illustrates strategies for the characterization of such diversity. The multicolumnar Dm neurons exhibit a strikingly wide range of cell sizes, arbor orientations, coverage patterns, and intracolumnar positions. Although individual cells are often highly variable in their detailed branching patterns, many general features such as tiling or nontiling of arbors, arbor orientation, and approximate cell size are highly stereotyped for each cell type. Although this stereotypy suggests biological importance, the functional significance of the striking anatomical diversity that we describe, as well as the developmental mechanisms that generate it, remain subjects for future investigation.
Materials and Methods
Molecular Biology and Drosophila Genetics.
Molecular constructs and transgenic flies were generated using standard methods as previously described (15, 25). See SI Appendix for a summary of transgene constructs and fly stocks (SI Appendix, Table S1) and details of their construction. Full genotypes of flies used for each experiment are described in SI Appendix.
Immunohistochemistry and Mounting of Fly Brains.
Fly brains were dissected in insect cell culture medium and fixed with 2% (wt/vol) paraformaldehyde in the same medium. Rat, mouse, or rabbit monoclonal antibodies against FLAG, OLLAS, V5, and HA epitope tags together with appropriate secondary antibodies were used to detect MCFO markers. For full labeling and mounting procedures, see SI Appendix.
Microscopy and Image Processing.
Images were acquired on a Zeiss LSM 710 confocal microscope. Image processing included adjustments of brightness and contrast of individual channels and resampling of 3D confocal stacks to generate specific views. Details are described in SI Appendix.
Supplementary Material
Acknowledgments
We thank S. Lawrence Zipursky for advice and encouragement throughout the course of this work; the Janelia Fly Light Project Team (especially Rebecca Johnston, Jennifer Jeter, and Nirmala Iyer) for help in preparation and imaging of fly brain samples and protocol refinement; Heather Dionne and Christine Murphy for molecular biology; the Janelia Scientific Computing Group and Eugene Myers for computational and data analysis tools; the Janelia Fly Facility for fly husbandry; James Truman for providing protocols for DPX clearing; and the Developmental Studies Hybridoma Bank for antibodies. The manuscript was improved by the comments of Yoshinori Aso, Stefanie Hampel, Adam Hantman, Rebecca Johnston, Teri Ngo, Michael Reiser, James Truman, and Tanya Wolff.
Footnotes
The authors declare no conflict of interest.
This article contains supporting information online at www.pnas.org/lookup/suppl/doi:10.1073/pnas.1506763112/-/DCSupplemental.
References
- 1.Sanes JR, Zipursky SL. Design principles of insect and vertebrate visual systems. Neuron. 2010;66(1):15–36. doi: 10.1016/j.neuron.2010.01.018. [DOI] [PMC free article] [PubMed] [Google Scholar]
- 2.Masland RH. Neuronal diversity in the retina. Curr Opin Neurobiol. 2001;11(4):431–436. doi: 10.1016/s0959-4388(00)00230-0. [DOI] [PubMed] [Google Scholar]
- 3.Fischbach KF, Dittrich APM. The optic lobe of Drosophila melanogaster. 1. A Golgi analysis of wild-type structure. Cell Tissue Res. 1989;258(3):441–475. [Google Scholar]
- 4.Grueber WB, Jan LY, Jan YN. Tiling of the Drosophila epidermis by multidendritic sensory neurons. Development. 2002;129(12):2867–2878. doi: 10.1242/dev.129.12.2867. [DOI] [PubMed] [Google Scholar]
- 5.Strausfeld NJ. Golgi studies on insects. 2. Optic lobes of Diptera. Philos T Roy Soc B. 1970;258(820):135. doi: 10.1098/rstb.1970.0033. [DOI] [PubMed] [Google Scholar]
- 6.Strausfeld NJ, Blest AD. Golgi studies on insects. 1. Optic lobes of Lepidoptera. Philos T Roy Soc B. 1970;258(820):81. doi: 10.1098/rstb.1970.0032. [DOI] [PubMed] [Google Scholar]
- 7.Cajal S, Sanchez D. 1915. Contribución al conocimiento de los centros nerviosos de los insectos. Trab Lab Inv Biol 13:1–68.
- 8.Gao S, et al. The neural substrate of spectral preference in Drosophila. Neuron. 2008;60(2):328–342. doi: 10.1016/j.neuron.2008.08.010. [DOI] [PMC free article] [PubMed] [Google Scholar]
- 9.Morante J, Desplan C. The color-vision circuit in the medulla of Drosophila. Curr Biol. 2008;18(8):553–565. doi: 10.1016/j.cub.2008.02.075. [DOI] [PMC free article] [PubMed] [Google Scholar]
- 10.Takemura SY, et al. A visual motion detection circuit suggested by Drosophila connectomics. Nature. 2013;500(7461):175–181. doi: 10.1038/nature12450. [DOI] [PMC free article] [PubMed] [Google Scholar]
- 11.Meinertzhagen IA, O’Neil SD. Synaptic organization of columnar elements in the lamina of the wild type in Drosophila melanogaster. J Comp Neurol. 1991;305(2):232–263. doi: 10.1002/cne.903050206. [DOI] [PubMed] [Google Scholar]
- 12.Rivera-Alba M, et al. Wiring economy and volume exclusion determine neuronal placement in the Drosophila brain. Curr Biol. 2011;21(23):2000–2005. doi: 10.1016/j.cub.2011.10.022. [DOI] [PMC free article] [PubMed] [Google Scholar]
- 13.Takemura SY, Lu Z, Meinertzhagen IA. Synaptic circuits of the Drosophila optic lobe: The input terminals to the medulla. J Comp Neurol. 2008;509(5):493–513. doi: 10.1002/cne.21757. [DOI] [PMC free article] [PubMed] [Google Scholar]
- 14.Jenett A, et al. A GAL4-driver line resource for Drosophila neurobiology. Cell Reports. 2012;2(4):991–1001. doi: 10.1016/j.celrep.2012.09.011. [DOI] [PMC free article] [PubMed] [Google Scholar]
- 15.Pfeiffer BD, et al. Tools for neuroanatomy and neurogenetics in Drosophila. Proc Natl Acad Sci USA. 2008;105(28):9715–9720. doi: 10.1073/pnas.0803697105. [DOI] [PMC free article] [PubMed] [Google Scholar]
- 16.Kvon EZ, et al. Genome-scale functional characterization of Drosophila developmental enhancers in vivo. Nature. 2014;512(7512):91–95. doi: 10.1038/nature13395. [DOI] [PubMed] [Google Scholar]
- 17.Chiang AS, et al. Three-dimensional reconstruction of brain-wide wiring networks in Drosophila at single-cell resolution. Curr Biol. 2011;21(1):1–11. doi: 10.1016/j.cub.2010.11.056. [DOI] [PubMed] [Google Scholar]
- 18.Livet J, et al. Transgenic strategies for combinatorial expression of fluorescent proteins in the nervous system. Nature. 2007;450(7166):56–62. doi: 10.1038/nature06293. [DOI] [PubMed] [Google Scholar]
- 19.Richier B, Salecker I. Versatile genetic paintbrushes: Brainbow technologies. Wiley Interdiscip Rev Dev Biol. 2015;4(2):161–180. doi: 10.1002/wdev.166. [DOI] [PMC free article] [PubMed] [Google Scholar]
- 20.Hampel S, et al. Drosophila Brainbow: A recombinase-based fluorescence labeling technique to subdivide neural expression patterns. Nat Methods. 2011;8(3):253–259. doi: 10.1038/nmeth.1566. [DOI] [PMC free article] [PubMed] [Google Scholar]
- 21.Hadjieconomou D, et al. Flybow: Genetic multicolor cell labeling for neural circuit analysis in Drosophila melanogaster. Nat Methods. 2011;8(3):260–266. doi: 10.1038/nmeth.1567. [DOI] [PubMed] [Google Scholar]
- 22.Struhl G, Basler K. Organizing activity of wingless protein in Drosophila. Cell. 1993;72(4):527–540. doi: 10.1016/0092-8674(93)90072-x. [DOI] [PubMed] [Google Scholar]
- 23.Viswanathan S, et al. 2015. High-performance probes for light and electron microscopy. Nat Methods, 10.1038/nmeth.3365.
- 24.Pédelacq JD, Cabantous S, Tran T, Terwilliger TC, Waldo GS. Engineering and characterization of a superfolder green fluorescent protein. Nat Biotechnol. 2006;24(1):79–88. doi: 10.1038/nbt1172. [DOI] [PubMed] [Google Scholar]
- 25.Pfeiffer BD, et al. Refinement of tools for targeted gene expression in Drosophila. Genetics. 2010;186(2):735–755. doi: 10.1534/genetics.110.119917. [DOI] [PMC free article] [PubMed] [Google Scholar]
- 26.Brand AH, Perrimon N. Targeted gene expression as a means of altering cell fates and generating dominant phenotypes. Development. 1993;118(2):401–415. doi: 10.1242/dev.118.2.401. [DOI] [PubMed] [Google Scholar]
- 27.Lai SL, Lee T. Genetic mosaic with dual binary transcriptional systems in Drosophila. Nat Neurosci. 2006;9(5):703–709. doi: 10.1038/nn1681. [DOI] [PubMed] [Google Scholar]
- 28.Nern A, Pfeiffer BD, Svoboda K, Rubin GM. Multiple new site-specific recombinases for use in manipulating animal genomes. Proc Natl Acad Sci USA. 2011;108(34):14198–14203. doi: 10.1073/pnas.1111704108. [DOI] [PMC free article] [PubMed] [Google Scholar]
- 29.Gibbs SM, Truman JW. Nitric oxide and cyclic GMP regulate retinal patterning in the optic lobe of Drosophila. Neuron. 1998;20(1):83–93. doi: 10.1016/s0896-6273(00)80436-5. [DOI] [PubMed] [Google Scholar]
- 30.Tuthill JC, Nern A, Holtz SL, Rubin GM, Reiser MB. Contributions of the 12 neuron classes in the fly lamina to motion vision. Neuron. 2013;79(1):128–140. doi: 10.1016/j.neuron.2013.05.024. [DOI] [PMC free article] [PubMed] [Google Scholar]
- 31.Kretzschmar K, Watt FM. Lineage tracing. Cell. 2012;148(1-2):33–45. doi: 10.1016/j.cell.2012.01.002. [DOI] [PubMed] [Google Scholar]
- 32.Hasegawa E, et al. Concentric zones, cell migration and neuronal circuits in the Drosophila visual center. Development. 2011;138(5):983–993. doi: 10.1242/dev.058370. [DOI] [PubMed] [Google Scholar]
- 33.Li X, et al. Temporal patterning of Drosophila medulla neuroblasts controls neural fates. Nature. 2013;498(7455):456–462. doi: 10.1038/nature12319. [DOI] [PMC free article] [PubMed] [Google Scholar]
- 34.Pfeiffer BD, Truman JW, Rubin GM. Using translational enhancers to increase transgene expression in Drosophila. Proc Natl Acad Sci USA. 2012;109(17):6626–6631. doi: 10.1073/pnas.1204520109. [DOI] [PMC free article] [PubMed] [Google Scholar]
- 35.Wolff T, Iyer NA, Rubin GM. 2015. Neuroarchitecture and neuroanatomy of the Drosophila central complex: A GAL4-based dissection of protocerebral bridge neurons and circuits. J Comp Neurol 523(7):997–1037.
- 36.Aso Y, et al. The neuronal architecture of the mushroom body provides a logic for associative learning. eLife. 2014;3:e04577. doi: 10.7554/eLife.04577. [DOI] [PMC free article] [PubMed] [Google Scholar]
- 37.Basler K, Struhl G. Compartment boundaries and the control of Drosophila limb pattern by hedgehog protein. Nature. 1994;368(6468):208–214. doi: 10.1038/368208a0. [DOI] [PubMed] [Google Scholar]
- 38.Lee T, Luo L. Mosaic analysis with a repressible cell marker for studies of gene function in neuronal morphogenesis. Neuron. 1999;22(3):451–461. doi: 10.1016/s0896-6273(00)80701-1. [DOI] [PubMed] [Google Scholar]
- 39.Venken KJ, Simpson JH, Bellen HJ. Genetic manipulation of genes and cells in the nervous system of the fruit fly. Neuron. 2011;72(2):202–230. doi: 10.1016/j.neuron.2011.09.021. [DOI] [PMC free article] [PubMed] [Google Scholar]
- 40.Raghu SV, Borst A. Candidate glutamatergic neurons in the visual system of Drosophila. PLoS ONE. 2011;6(5):e19472. doi: 10.1371/journal.pone.0019472. [DOI] [PMC free article] [PubMed] [Google Scholar]
- 41.Raghu SV, Claussen J, Borst A. Neurons with GABAergic phenotype in the visual system of Drosophila. J Comp Neurol. 2013;521(1):252–265. doi: 10.1002/cne.23208. [DOI] [PubMed] [Google Scholar]
- 42.Varija Raghu S, Reiff DF, Borst A. Neurons with cholinergic phenotype in the visual system of Drosophila. J Comp Neurol. 2011;519(1):162–176. doi: 10.1002/cne.22512. [DOI] [PubMed] [Google Scholar]
- 43.Chin AL, Lin CY, Fu TF, Dickson BJ, Chiang AS. Diversity and wiring variability of visual local neurons in the Drosophila medulla M6 stratum. J Comp Neurol. 2014;522(17):3795–3816. doi: 10.1002/cne.23622. [DOI] [PMC free article] [PubMed] [Google Scholar]
- 44.Peng H, Ruan Z, Long F, Simpson JH, Myers EW. V3D enables real-time 3D visualization and quantitative analysis of large-scale biological image data sets. Nat Biotechnol. 2010;28(4):348–353. doi: 10.1038/nbt.1612. [DOI] [PMC free article] [PubMed] [Google Scholar]
- 45.Wagh DA, et al. Bruchpilot, a protein with homology to ELKS/CAST, is required for structural integrity and function of synaptic active zones in Drosophila. Neuron. 2006;49(6):833–844. doi: 10.1016/j.neuron.2006.02.008. [DOI] [PubMed] [Google Scholar]
Associated Data
This section collects any data citations, data availability statements, or supplementary materials included in this article.