

Abstract
In recent years, demand for biological sensors which are capable of fast and accurate detection of minor amounts of pathogens in real-time form has been intensified. Acoustic wave (AW) devices whose performance is determined by mass sensitivity parameters and quality factor are used in biological sensors as platforms with high quality. Yet, current AW devices are facing many challenges such as the low value of their quality factor in practical applications and also their difficulty to use in liquids. The main focus of this article is to study on the magnetostrictive sensors which include milli/microcantilever (MSMC) type. In comparison with AW devices, MSMC has a lot of advantages; (1) its actuation and sensing unit is wirelessly controlled. (2) Its fabrication process is easy. (3) It works well in liquids. (4) It has a high-quality factor (in the air > 500). Simulation results demonstrate that the amount of quality factor depends on environment properties (density and viscosity), MSMC geometry, and its resonant behavior of harmonic modes.
Keywords: Biological sensors, cantilever, magnetostrictive
INTRODUCTION
Gradual evolution of fabrication processes in the dimensions of micro and nano has caused sensors with low weight, inexpensive, in very small dimensions and energy efficient to expand in recent years. These sensors are used in applications such as monitoring glucose levels,[1,2,3] lactate,[4] pH,[5] carbon dioxide (CO2),[6] and oxygen (O2). Fabrication technology integration of sensors with signal processing techniques leads to development of implantable sensors whose applications like visual prosthesis for the blind,[7] cochlear implants,[8] creating nerve stimulations in brain,[9] endoscopy by capsule,[10] and gastrointestinal micro systems[11] can be cited. In recent years, some electronic systems inspired by nature such as artificial ear and radio frequency (RF) cochlear are also proposed. These systems are able to calculate a range of about 1 GFLOPS and their control systems have 14 μW of power, and their batteries have a voltage about 150 mV.[12] On the other hand, micro electromechanical systems (MEMS) are widely used in medical applications. Its application that can be referred is transferring a powerful drug or a certain hormone into the nervous system.[13,14] Low power electronic devices[15] are very important in medical applications. These devices are used for diagnostic and therapeutic applications. Due to the increasing of data collection systems and sensing techniques, smart sensors have received considerable attention for surveillance applications.
In recent years, combination of two integrated circuits and sensor technologies with wireless networks has caused creating a sensor platform with low power called body wireless networks (WBAN).[16] This wireless monitoring system is used for early detection of disease and preventing its serious consequences. This system consists of some sensors that measures and records body physiological reactions at any moment. The recorded information is then wirelessly transformed through internet to a server which is connected to a data base. Figure 1 shows a view of this system.
Figure 1.
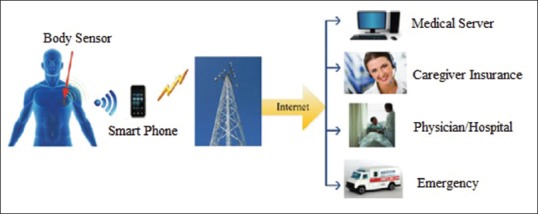
An overview of body wireless network[16]
In a general classification, biological sensors are divided into two physical and chemical categories. Physical sensors measures parameters such as muscle movement, blood pressure, body temperature, blood stream, and spinal blood pressure. Chemical sensors are used to measure the amount of certain chemicals in the body to determine concentrations of various chemicals and to display chemical activities in the body. Some chemical samples include gas sensor, electrochemical, photometric, and bio-analyte. Bio-analyte sensors are divided into a separate category due to the high importance and great diversity they have. This category of sensors is used by combining reactions of biological detection such as enzyme level, antibody/antigen, or Ligand acceptor for biochemical complex molecules detection.[17]
Depending on the interface between sensor-body (substrate), biological sensors can be classified as follows:
Noncontact sensors (nonoffensive): Sensors that are not in contact with the measured material.
Contact sensors (skin surface): Sensors that connect temporarily to the skin surface.
Minimally offensive sensors (inertial): Sensors that are in permanent contact with skin surface but are not planted in it
Implantable sensors (offensive): Sensors that are planted in a part of body such as under skin
Biological sensors in medical systems are used to care for patients in hospitals, homes, and even workplaces. Some applications of these devices include:[18]
Hospital wireless network: Inside the hospital, biological sensors are used to show the clinical behavior of patients. This category of sensors collects data in 24.7 and in cases of warning, puts it in the hands of medical staff for awareness
Display household behavior: In addition to displaying behavior of patients inside the hospital, biological sensors are employed to measure various physiological parameters throughout personal workouts at home. This is carried out to inform each person about health and personal management
Rehabilitation: Biological sensors can play an important role in improving lifestyle of heart patients, and people who have Alzheimer and diabetes. These patients need their vital signs to be shown continuously.
Combining sensing devices with remote sensing circuits and signal process has led to extension of smart sensors. In many cases, to display different physiological parameters, several sensors are placed on one single chip. These sensors are controlled by applying control signal. Hence, they can be used in laboratory devices on chip. These sensors allow the simultaneous use of sensor technology, micro fluidics, and also affordable complementary metal oxide semiconductor integrated circuits. Figure 2 shows a sample of laboratory devices on chip which is used for bacteria detection. This chip has different parts such as analysis in the location (in situ), deoxyribonucleic acid (DNA) isolation, and polymeric chain reaction.[19] Comprehensive discussion on DNA and its characteristics is available in our previous works.[20,21,22,23,24,25,26]
Figure 2.
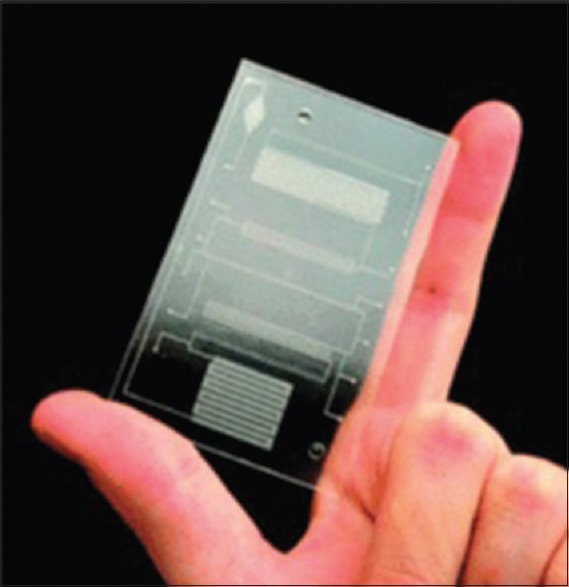
Laboratory on chip for bacteria detection[19]
BIOLOGICAL SENSORS BASED ON MICROCANTILEVER
In recent years, study on the cantilevers in micro and nano scale as sensor platforms using physical principles have escalated. Micro Cantilever (MCs) in two sensing and stimulus states work in three general modes; static, heat and dynamics.[27,28,29] First state (static deflection mode) [Figure 3a] [30,31,32] is based on the fact that fixing one end of the cantilever will cause unbalanced surface tension which the result is a measurable deflection (upward or downward). In this mode, target molecules should be placed only on one side of the cantilever (in other words, asymmetric biding of the upper level of molecules will lead to its general deflection). Extra tensions caused by opposite level are removed and consequently, no deflection is created in the cantilever. Results show that deflection level in these kinds of sensors for tensions about 10-3 N/m is about 10 nm[33]
Figure 3.
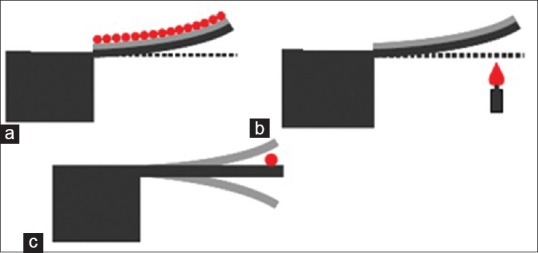
Sensor operating modes based on the cantilever. (a) Static mode, (b) heat mode, (c) dynamics mode[34]
In heat mode (bimetallic),[27,28,29] cantilever surface is covered by a thin layer of metal. Therefore, warming or cooling the metal/silicon structure leads to making a difference in the thermal coefficients of the two materials which will result in a deflection in cantilever, as it is seen in Figure 3b. Measurements demonstrate that if the temperature changes to 10-5 K cantilever deflection level is about a few nanometers.
Finally, in dynamics mode [Figure 3c],[35,36] cantilever becomes into oscillatory form. Target molecules connection to cantilever surface causes mass increase and thus resonant frequency's reduction. Experiments show that a change of 1 Hz in resonant frequency corresponds approximately to 1 pg change in mass.[36] Cantilevers which work in this operating mode have a lot of advantages compared to static operating mode; both surfaces of these kinds of devices can be used for sensing operation (in static mode, cantilever beam must be placed horizontally). Dynamic mode's MCs are divided into two passive and active categories.[37] Passive MCs like MCs based on silicones,[38] require a mechanical system for oscillatory simulation and also an optical system to measure its oscillatory level. While active MCs like piezoelectric MCs [39] are actuated easily by applying an electric field. Furthermore, oscillation of this category of MCs is easy to measure and display. Yet, MC sensors based on silicon are more investigated compared to active MCs due to the availability of fabrication techniques (Micro/Nano fabrication) of silicon material. Furthermore, results show that MCs based on silicon have bigger Q and also greater sensitivity (Sm) in comparison to MCs based on piezoelectric. Nevertheless, there is a main challenge in biological sensors based on MC and that is when these sensors work in liquids. Q's value for this category of cantilevers is rarely over 10 in liquid. Sensors based on cantilever, as multifunctional sensors, show unique performance with applying mechanical methods, optical, electrostatic, and electromagnetic, for sensing/simulation operation, and are used in many advanced applications (such as chemical, electronic noise, biological). Main advantage of this category of sensors is; being small, having fast response, high sensitivity, integration ability, and the need for a small volume of sample for their performance.
Regardless of MC operating mode, usually using several cantilevers in parallel so that they form an array, is proposed [Figure 4]. Results show that a lot of information can be achieved by performing experiment just once, by sensors array. Today, the main concern in biological detection is that biological systems are more complicated than physical systems and their properties depend on environment. As we know, cantilevers are sensitive to temperature. Furthermore, in addition to the target molecules, it is possible that a lot of other molecules in the sample react with sensor. Therefore, in order to signal noise cancellation, an array of cantilevers which include a number of same cantilevers, and are covered with different surfaces, is proposed. Note that physical identity of each cantilever should be examined before each test. This is done by measuring cantilevers thermal response by a thermal pulse, or by measuring their resonant frequency.
Figure 4.
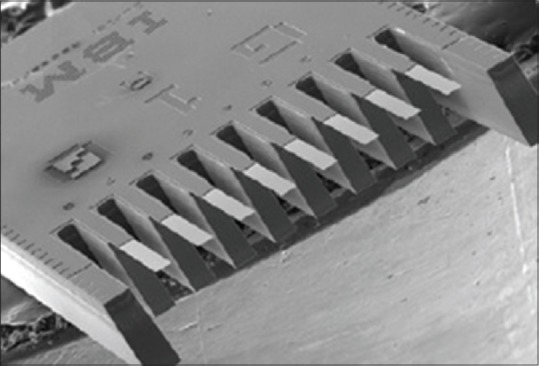
Scanning electron microscope image of an array of cantilever sensor[40]
MAGNETOSTRICTIVE MILLI/MICRO-CANTILEVER SENSORS
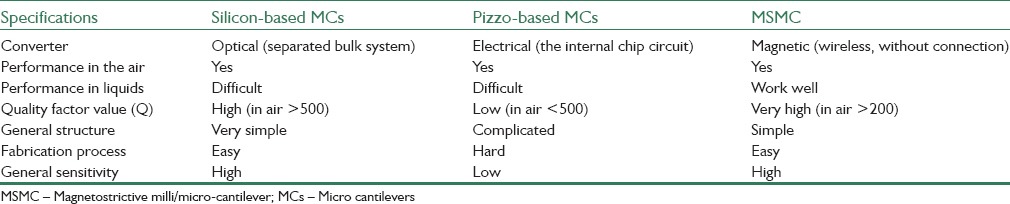
Magnetostrictive materials are widely used in sensors and stimulants due to their low cost and high strength. Using these materials, a new type of active cantilevers called magnetostrictive cantilever (MC) is introduced as biological sensor platform in recent years. Magnetostrictive milli/micro cantilevers sensors (MSMCs) are easily simulated and sensed by applying external or internal force. Furthermore, results show that this type of sensors have high quality factor (Q) (500 in air and 30 in water). In Table 1, the comparison between MSMCs and other MCs is shown. According to MSMC's advantages [Table 1], it can be used as sensor platform in biological detection applications.
Table 1.
Comparison of MSMC with common MCs
Magnetostrictive milli/micro-cantilever sensors reviewed in this article are unimorph type cantilevers. A cantilever beam is formed of two layers; active layer and inactive layer. MSMC structure is shown in Figure 5. Layer used in MSMC structure is amorphous magnetostrictive alloy, Metglas™ 2826, and inactive layer is of Cu thin film and is deposited on active layer by magnetic sputtering DC system.
Figure 5.
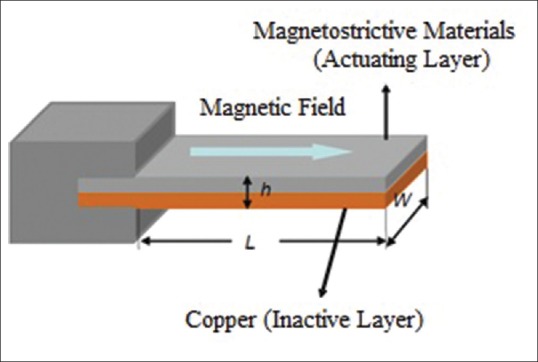
Magnetostrictive milli/micro-cantilever cantilever structure
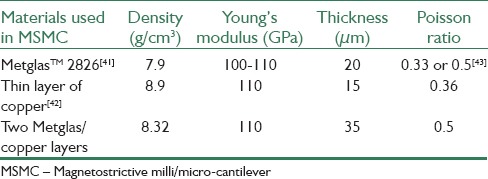
In Table 2, cantilever beam's physical properties like density, Young's modulus and Poisson distribution are shown. Active and inactive layers thickness is considered 20 μm and 15 μm, respectively. It must be noted that as long as their length and width are equal, these two layers mass depends only on their thickness. Hence, two active and inactive layers calculated average density (Metglas™ 2826 and Cu) can be considered as MSMC sensor density.
Table 2.
Properties of Metglas™ 2826 materials, a thin layer of copper and cantilever beam
Magnetostrictive milli/micro-cantilever's fabrication process is performed as follows: First, an strip of Metglas™ 2826MB with the thickness of 20 mm is polished using 2000 polished papers and then is cleaned in a solution containing acetone. And then a copper layer in an approximate thickness of 15 μm is deposited on a thin layer of Metglas. It is essential to note that to increase bonding surface between Metglas and copper layer, a thin layer of chrome in the thickness of 100 nm, before copper deposition, is deposited on Metglas. Then two copper/Metglas layers are cut into rectangles with different sizes. Created two layer strip is fixed on one side by a plastic container made of PMMA and cantilever structure or MSMC is formed. Created cantilever is then covered by a thin layer of gold in approximate thickness of 130 nm by coating magnetic sputtering.[37]
The reason for using gold layer is to prevent corrosion in cantilever and also to promote the stabilization level of biological detection unit. In this step, before sputtering operation of gold layer, a thin layer of chrome in the thickness of 100 nm is deposited on cantilever as bonding layer.
MAGNETOSTRICTIVE MILLI/MICRO-CANTILEVER SENSORS PERFORMANCE
Working principles of all sensors which work based on acoustic wave devices are similar; change in sensor's mass load will lead to change in its resonance frequency which can be measured and stored by a computer system. Sensing general principles of a MSMC are shown in Figure 6. As mentioned, a MSMC is formed of an active layer (magnetostrictive layer) and an inactive layer [Figure 6a]. Active layer's length can change under the influence of magnetic field. Because the variations of active layer are restricted by inactive layer connected to it and this result in MSMC's bending. In case of applying time varying magnetic field (AC) [Figure 6b] to MSMC, a wave of bending is induced in it. This induced wave has resulted from release of magnetic flux and can be measured by coil [Figure 6c]. Output oscillatory signal (phase signal) originating from the coil is shown in Figure 6d.
Figure 6.
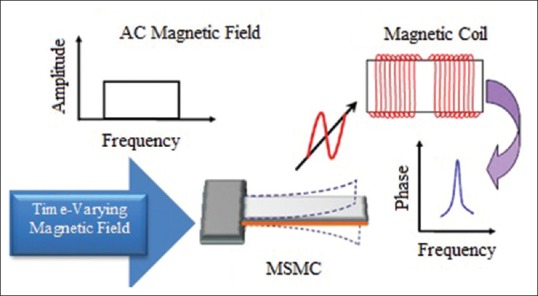
Magnetostrictive milli/micro-cantilever performance as a convertor for biological sensors[44]
If the time varying magnetic field is a sine wave, flexural wave created in MSMC will be a sinusoidal function of time. As shown in Figure 6, as long as strain response is in the form of even function of stimulus magnetic field, MSMC is stimulated by an AC signal with small amplitude imposed on dc bias with large amplitude. As shown in Figure 7, in case of applying ac signal with small amplitude, strain response of the material will be in the form of quadratic function of the magnetic field. As a result, strain response is at a frequency equal to twice the frequency of small ac stimulation field. On the other hand, if a small ac field is imposed on dc bias, a greater strain response is obtained at the same frequency and this response is also proportional to the excitation field. Thus, MSMC performance is usually considered as a small ac magnetic field imposition on the dc bias.
Figure 7.
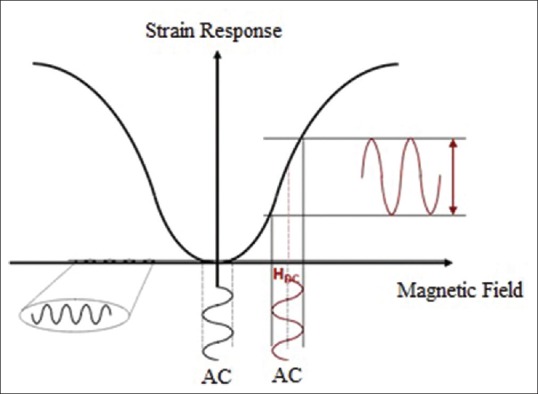
Magnetic material's magnetic response in magnetostrictive milli/micro-cantilever under the influence of external magnetic field
In Figure 8, MSMC principles are shown as biological sensor. In this type of sensors, MSMC level is covered by biological detection units (bacteria (phage) or antigen/antibody pair) and this (pairing bacteria/antigen on the surface of the sensor) leads to a decrease in resonant frequency. Change in the resonant frequency created by mass load can be noted as mass sensitivity and thus, binding bacteria can be achieved by frequency shift analysis based on mass sensitivity.
Figure 8.
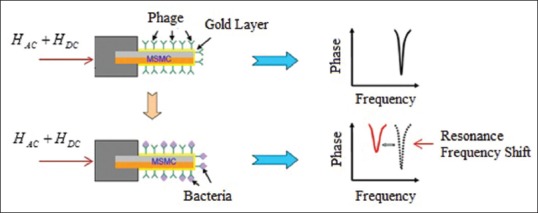
Magnetostrictive milli/micro-cantilever (MSMC) performance as biological sensor for bacteria detection. Bacteria connection is done on both sides of MSMC[44]
CANTILEVER BEAM THEORY
Wave equation for the flexural mode in a rectangular cantilever beam (with L length, W width, h thickness) is expressed as follows regardless of the damping effect:[45]
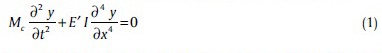
where y is the bending deformation at x point [Figure 5]. Assuming that we have W>>h in beam structure, effective Young's modulus (E’) is defined as follows:.
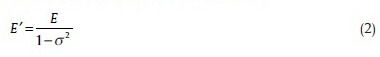
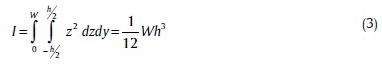
where σ and E are cantilever beam's Poisson ratio and Young module, respectively. The moment of Inertia for rectangular beam is defined as follows:
By defining Mc ρWh as cantilever beam's effective mass and substituting y=y0eiωt in Eq. 1 we have:
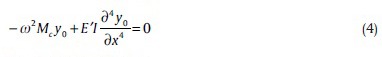
Eq. 4 can be written as:
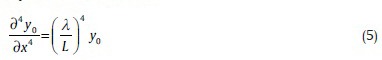
where 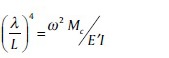
Eq. 5 is a fourth order wave equation, and its homogenous solution is expressed as total of four linearly independent equations as follows:
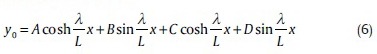
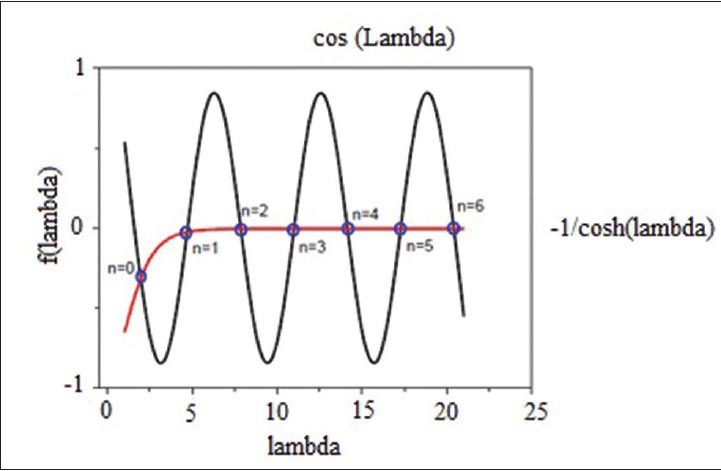
where, A, B, C, and D are constant. For a cantilever beam which (x = 0) is fixed in one end and free in other end (x = L) [Figure 9], boundary conditions are as below:
Figure 9.
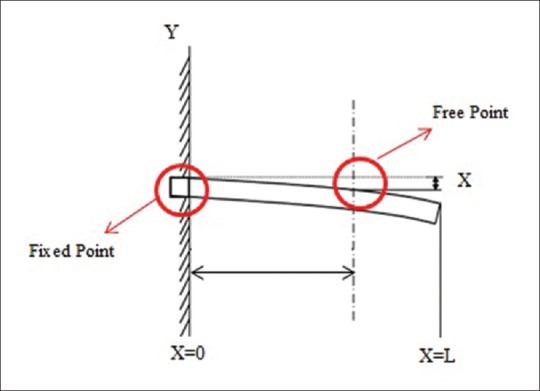
Deformation in Fixed-Free cantilever beam
The first two boundary conditions arise from the fact that one end of the beam is fixed. And third and fourth conditions arise from the fact that no shear force and also bending occurs. With putting boundary conditions (Eq. 7) into (6) and simplifying it, we have:[45]

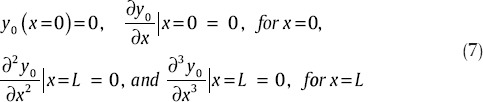
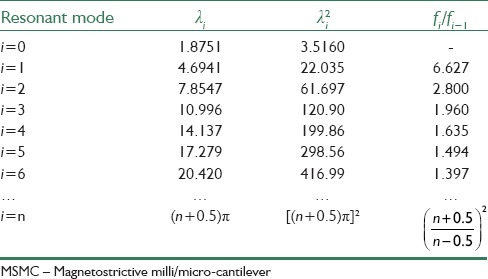
Eigen value λ can be obtained using approximate or graphical methods. For example, with graphically solving Eq. 8 [Figure 10], λ's different modes are determined. As it is seen from Figure 6, Eigen values for a cantilever beam having a fixed and a free end is obtained with subscribing from two curves. In Table 3 also, the first seven values of the Eigen values are shown. For higher order harmonic modes, Eigen values must be approximated by (n + 0.5) π.[46]
Figure 10.
Cos λ and  curves
Table 3.
Eigen values obtained for MSMC resonant modes
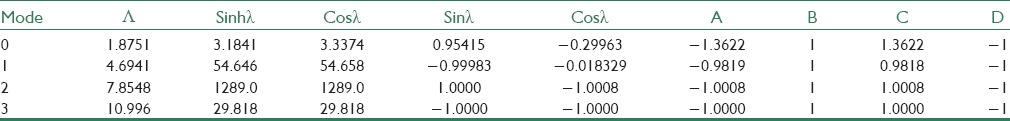
Based on obtained Eigen values of harmonic modes in the range of 0–3, constant coefficients of Equation 6 can be obtained (A, B, C, and D). Table 4 shows obtained results. Because B is proportional to the amplitude of Eq. 6, and it is independent of oscillation. Hence, its value is considered equal to = 1. So for example in the main mode, we have A=C=−1.3622 B.
Table 4.
A, B, C, and D amounts for the first four harmonics
In Figure 11, natural resonant movements related to the first four harmonic modes of cantilever beam are shown. In this Figure, there are certain areas of the cantilever (the nodes) which have no part in vibrating displacements and their location does not change with vibration mode. As an example, for zero harmonic mode, the node is placed at the fixed end of the cantilever. Hence, cantilever's sensitivity to added masses and, as a result, it's re-taking to these masses will be different in different vibration modes. Results achieved from a simulation of Equation 6 shows that the maximum amount of re-taking to the added mass in biological applications of MSMC sensor at the free end of cantilever and zero frequency mode.[47]
Figure 11.
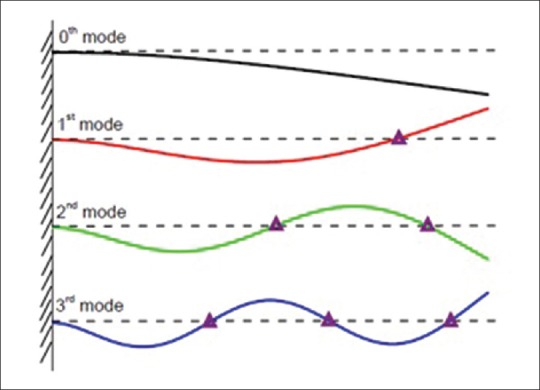
Natural vibration motions at zero to third harmonic modes and the nodes related to cantilever beam[47]
By combining relations (2) and (3) with 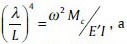 , a rectangular beam's angular frequency is achieved as follows:
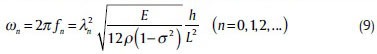
Hence, resonance natural frequency in nth mode for a rectangular cantilever with no attenuation is:
where σ =0.5
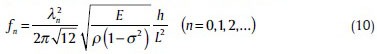
Figure 12 shows the full oscillation harmonics of fixed-free cantilever beam in six Eigen-resonance frequencies. The simulation has been done using COMSOL multiphysics software version 4.3.b. Note that the length of beam has been swept between 100 μm to 1000 μm and the material of the beam is silicon which has the young module of 131E9[Pa], the density of 2330[kg/m3] and the Poisson ratio of 0.27. As can be seen, the maximum deflection has been happened at the free side of the beam. In the first and second mode of resonance frequencies, the beam oscillates to the sides. In the third and fifth mode of frequencies, we have the torsional behavior of the beam. Finally, in the last harmonic mode, the flexure shape of the beam is observed (like a guitar string). Figure 13 shows the Eigen-frequency plot of the fixed-free cantilever beam versus the length of the beam. As can be seen, the longer beam length correspond, the lower Eigen-frequency, as we attained previously in Eq. 10.
Figure 12.

Different oscillation harmonics of fixed-free beam at six Eigen-frequencies
Figure 13.
Eigen-frequency plot versus the length in fixed-free beam
DETERMINE SOME IMPORTANT PARAMETERS IN MAGNETOSTRICTIVE MILLI/MICRO-CANTILEVER
The Characteristic Frequency
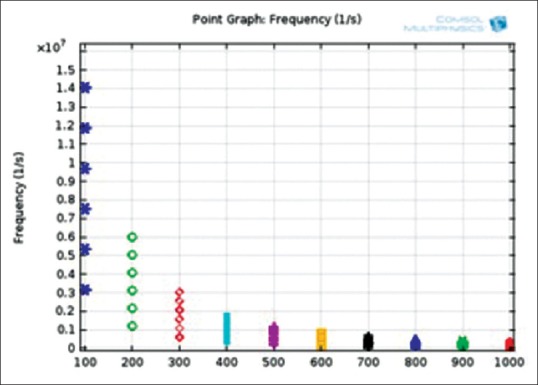
Figure 14 shows a sample of resonance spectrum of an MSMC obtained from magnetic coil external signals (amplitude signal and phase signal). Amplitude signal represents MSMC's flexural wave amplitude; while phase signal indicates the phase difference between flexural wave and ac magnetic field. In oscillation amplitude curve according to frequency, in resonant frequency, fr amplitude reaches its maximum amount and in anti-resonant frequency, far, it reaches its minimum amount. Furthermore, phase signal reaches its peakin f0 frequency, so that fr < f0 < far.[39]
Figure 14.
Resonant spectrum (curves of phase and amplitude signals according to frequency) for the main mode in magnetostrictive milli/micro-cantilever with the dimensions of 3.0 mm × 1.0 mm × 35 mm[39]
Phase signal is used to determine resonant behavior of a MSMC for biological sensor applications. In other words f0 is considered as MSMC's characteristic frequency. Based on results obtained from simulation, amounts of fr, far and f0 with dimensions of 3.0mm×1.0mm×35µm are obtained 2596 Hz, 2702 Hz and 2574 Hz, respectively [Figure 14]. Hence, characteristic frequency of designed MSMC is 2574 Hz. It is evident that this frequency amount is bigger than real resonant frequency and smaller than anti-resonant frequency. In order to an accurate determination of characteristic frequency amount (f0) from the practical results, the maximum amplitude of MSMC phase signal is fitted by different functions. Initially, before fitting operation, the main peak shown in Figure 15a needs to be taken from baseline which is arising from system phase delay. Then, phase signal's peak is fitted by Lorentz function. Lorentz function is defined as follows: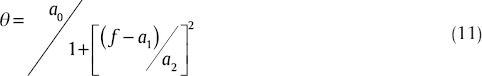
Figure 15.
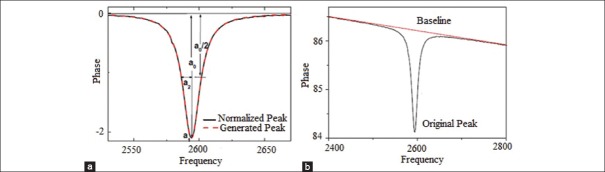
(a) phase signal spectrum according to the frequency at output signal. (b) Normalized spectrum (black lines) and produced spectrum (red lines)
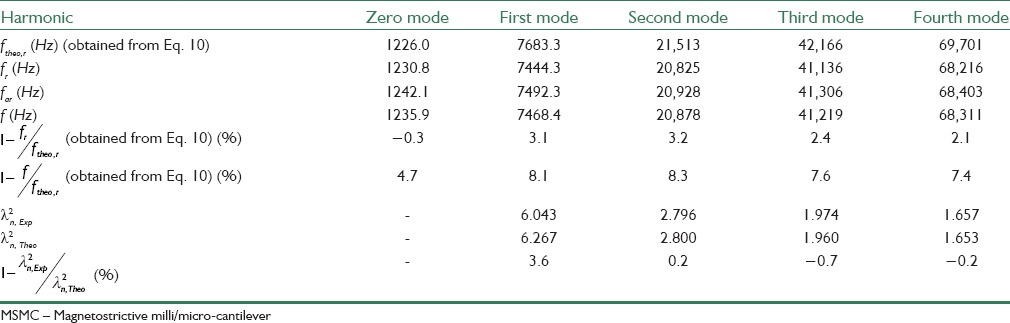
θ is the phase signal in frequency a0 and a1 and a2 are fitting constants. From Eq. 11 characteristic frequency can be obtained f0=a1. Curves resulted from practical data and also fitted data are shown in Figure 15b. As it is seen in this figure, fitting results show that error amount in f0 is smaller than 0.1 Hz. As mentioned in part III, resonant frequency was calculated from relation (10) theoretically. Furthermore, Eigen values are achieved graphically for nth harmonic modes and are shown in Table 5.
Table 5.
Resonant frequencies for the first five harmonics for MSMC with dimensions of 4.4 mm × 0.8 mm × 35 μm
Quality Factor
In general, improving performance of sensors is fulfilled through reducing noise when converting physical signal (mechanical signal) to electric/magnetic signal or controlling error sources (thermal jumps). In MSMC, thermal loss in cantilever leads to conversion of vibrational energy stored in it into heat. The more the amount of quality factor (Q) is, the less the energy losses rate, proportional to frequency oscillation, will be. Commonly Q is defined as follows:[48]
Q parameter is used to clarify the sharpness of resonant peak and is defined as peak/resonance frequency to peak width ratio [Figure 15a]. In MSMC, resonant frequency may be replaced with characteristic frequency amount. As a result, it can be written:

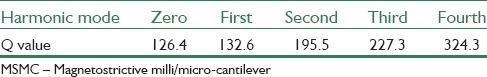
Q values for the first five frequency modes of MSMC are measured in this paper and shown in Table 6. As it is observed, higher order harmonies increase the value of Q. Also from Table 5, it can be concluded that the signal amplitude for higher frequency modes is smaller than lower frequency modes. Thus, for sensing applications in MSMC, the main harmony is used.
Table 6.
Q values for first five frequency modes of MSMC
Note that Q parameter can decrease influenced by various factors. For example, damping in viscous fluids leads to Q limitation and resonance expansion as a primary loss mechanism. This factor makes us optimize mass to Q ratio while designing cantilever for sensing applications and actuation.
Mass Sensitivity
Usually, sensors measure uniform changes of mass on their own surface.[49,50,51,52] If a small mass (Δm) distributes uniformly on a cantilever beam surface [Figure 16], mass sensitivity is defined as follows:[37]
Figure 16.
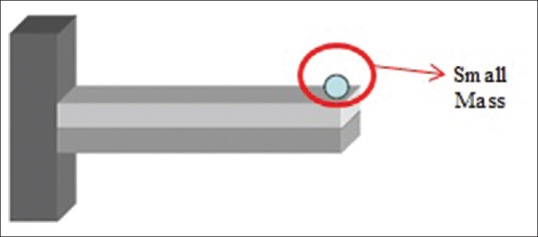
Point mass located at the free end of cantilever beam[45]
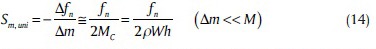
where Δfn is change in resonant frequency arising from Δm
To test the resonant frequency caused by a point mass at the end of cantilever, effective mass (MC) must be corrected as follows:[37]
Mc 0.236 ρwh (15)
Thus, by combining relations (14) and (15), we have:
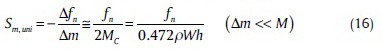
By placing relation (10) into relations (15) and (16), Sm for a rectangular cantilever is:
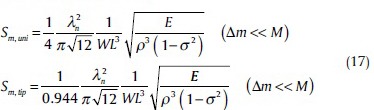
Eq. 17 shows that the mass sensitivity (Sm) is determined by four factors: (1) Mass load position, (2) resonant mode (λn), (3) geometry (W and L), and (4) properties of materials in cantilever beam  Results demonstrate that Sm depends in L. Also it can be getting that in the case that it places with a point mass at the end of cantilever, Sm is bigger than the case that mass is uniformly distributed on cantilever's surface.
CONCLUSION
Magnetostrictive milli/micro-cantilever as a new type of active cantilever is introduced in this paper as a high-performance device used in biosensors. The Q value of MSMCs in the air and the reduced air is pressure dependent and harmonic mode dependent. It is also found that the viscous damping effect of MSMCs is negligible while compared to the intrinsic damping and support loss of the holder, which is the obvious difference from Si-based MCs.
One of the main limitations of MSMS biosensors is that these sensors have less sensitivity in compare to other identical biosensor such as magnetostrictive particles (MSPs). This comparison is valid when all the features in these two sensors (like the material used in fabrication process and dimensions) are the same. For example, in the case which L = 5W and W = 10 h, an MSP has a sensitivity more than 150 times higher than the MSMC.
BIOGRAPHIES

Hamidreza Saberkari was born in Rasht, Iran. He received the B.Sc. degree in Electrical Engineering from Guilan University, Rasht, IRAN, in 2011. In 2013, he received his M.Sc. degree in Communication Engineering from Sahand University of Technology, Tabriz, IRAN. His research interests include optimization algorithms, genomic signal processing, Bioinformatics, pattern recognition, Bio-MEMS.
E-mail: h_saberkari@sut.ac.ir

Habib Badri Ghavifekr received the B.S. degree from Tabriz University, Iran, and continued his study in Germany and received the M.S. degree (Diploma Engineer) from Technical University of Berlin, in 1995, both in electrical engineering. Immediately after that, he joined the Institute for Microperipheric at the Technical University of Berlin (nowadays BeCAP: Berliner Center for Advanced Packaging) as a scientific assistant and in 1998 the Fraunhofer Institute for Reliability and Microintegration (FhG-IZM) as a research assistant. In 2003, he received his PhD in electrical engineering from Technical University of Berlin. Since 2005, he is an assistant professor at Sahand University of Technology, Tabriz, Iran. His research interests are microsystem technologies, microelectronic packaging, MEMS, and electronic measurement system for industrial applications.
E-mail: badri@sut.ac.ir

Mousa Shamsi received his B.Sc. degree in Electrical Engineering (major: Electronics) from Tabriz University, Tabriz, IRAN, in 1995. In 1996, he joined the University of Tehran, Tehran, IRAN. He received his M.Sc. degree in Electrical Engineering (major: Biomedical Engineering) from this university in 1999. From 1999 to 2002, he taught as a lecturer at Sahand University of Technology, Tabriz, Iran. From 2002 to 2008, he was a PhD student at the University of Tehran in Bioelectrical Engineering. In 2006, he was granted with the Iranian government scholarship as a visiting researcher at the Ryukyus University, Okinawa, Japan. From December 2006 to May 2008, he was a visiting researcher at this University. He received his PhD degree in Electrical Engineering (major: Biomedical Engineering) from University of Tehran in December 2008. From December 2008 to April 2013, he was an assistant professor at Faculty of Electrical Engineering, Sahand University of Technology, Tabriz, Iran.From April 2013, he is an associate professor at Faculty of Electrical Engineering, Sahand University of Technology, Tabriz, Iran. His research interests include medical image and signal processing, genomic signal processing, pattern recognition, adaptive networks, and facial surgical planning.
E-mail: shamsi@sut.ac.ir
Footnotes
Source of Support: Nil
Conflict of Interest: None declared
REFERENCES
- 1.Wang J. Electrochemical glucose biosensors. Chem Rev. 2008;108:814–25. doi: 10.1021/cr068123a. [DOI] [PubMed] [Google Scholar]
- 2.Islam AB, Islam SK, Rahman T. MD. College Park, MD, USA: 2009. Dec, A Vertically Aligned Carbon Nanofiber (VACNF) Based Amperometric Glucose Sensor, Proceedings of the International Semiconductor Device Research Symposium (ISDRS 2009) [Google Scholar]
- 3.Zhang M, Haider MR, Huque MA, Adeeb MA, Rahman S, Islam SK. A low-power sensor signal processing circuit for implantable biosensor applications. Smart Mater Struct. 2007;16:525–30. [Google Scholar]
- 4.Baker DA, Gough DA. A continuous, implantable lactate sensor. Anal Chem. 1995;67:1536–40. [Google Scholar]
- 5.Jeevarajan AS, Vani S, Taylor TD, Anderson MM. Continuous pH monitoring in a perfused bioreactor system using an optical pH sensor. Biotechnol Bioeng. 2002;78:467–72. doi: 10.1002/bit.10212. [DOI] [PubMed] [Google Scholar]
- 6.Star A, Han TR, Joshi V, Gabriel JC, Gruner G. Nanoelectronics carbon dioxide sensors. Adv Mater. 2004;16:2049–52. [Google Scholar]
- 7.Liu W, Vichienchom K, Clements M, DeMarco S, Hughes C, McGucken E, et al. A neuro-stimulus chip with telemetry unit for retinal prosthetic device. IEEE J Solid State Circuits. 2000;35:1487–97. [Google Scholar]
- 8.Zierhofer CM, Hochmair-Desoyer IJ, Hochmair ES. Electronic design of a cochlear implant for multichannel high-rate pulsatile stimulation strategies. IEEE Trans Rehabil Eng. 1995;3:112–6. [Google Scholar]
- 9.Heetderks WJ. RF powering of millimiter-and submillimeter-sized neural prosthetic implants. IEEE Trans Biomed Eng. 1988;35:323–7. doi: 10.1109/10.1388. [DOI] [PubMed] [Google Scholar]
- 10.Lenaerts B, Puers R. An inductive power link for a wireless endoscope. Biosens Bioelectron. 2007;22:1390–5. doi: 10.1016/j.bios.2006.06.015. [DOI] [PubMed] [Google Scholar]
- 11.Guanying M, Guozheng Y, Xiu H. Power transmission for gastrointestinal microsystems using inductive coupling. Physiol Meas. 2007;28:N9–18. doi: 10.1088/0967-3334/28/3/N01. [DOI] [PubMed] [Google Scholar]
- 12.Mandal S, Zhak S, Sarpeshkar R. A bio-inspired active radio-frequency silicon cochlea. IEEE J Solid State Circuits. 2009;44:1814–28. [Google Scholar]
- 13.Grayson AC, Shawgo RS, Johnson AM, Flynn NT, Yawen LI, Cima MJ, et al. A biomems review: MEMS technology for physiologically integrated devices. Proc IEEE. 2004;92:6–21. [Google Scholar]
- 14.Mostafa S, Lee I, Islam SK, Eliza SA, Shekhawat G, Dravid VP, et al. Tulip, integrated MOSFET-embedded cantilever based biosensor characteristic for detection of anthrax simulant. IEEE Electron Devices Lett. 2011;32:408–10. [Google Scholar]
- 15.Alireza S, Rasoul F, Hamidreza S. Design and analysis of a continuis-time common-mode feedback circuit based on differential-difference amplifier. Res J Appl Sci Eng Technol. 2012;4:452–7. [Google Scholar]
- 16.Milenkovic A, Otto C, Jovanov E. Wireless sensor networks for personal health monitoring: Issues and an implementation. Comput Commun. 2006;29:2521–33. [Google Scholar]
- 17.Ahmadi F, Saberkari M, Abiri R, Motlagh HM, Saberkari H. In vitro evaluation of Zn-norfloxacin complex as a potent cytotoxic and antibacterial agent, proposed model for DNA binding. Appl Biochem Biotechnol. 2013;170:988–1009. doi: 10.1007/s12010-013-0255-6. [DOI] [PubMed] [Google Scholar]
- 18.Top Targets for Wireless Health and mHealth. [Last accessed on 2014 Oct 10]. Available from: https://www.wirelesshealthstrategies.com .
- 19.Mark D, Haeberle S, Roth G, von Stetten F, Zengerle R. Microfluidic lab-on-a-chip platforms: Requirements, characteristics and applications. Chem Soc Rev. 2010;39:1153–82. doi: 10.1039/b820557b. [DOI] [PubMed] [Google Scholar]
- 20.Saberkari H, Shamsi M, Joroughi M, Golabi F, Sedaaghi MH. Cancer classification in microarray data using a hybrid selective independent component analysis (SICA) and υ-Support Vector Machine (υ-SVM) Algorithm. J Med Signals Sens. 2014;4:291–9. [PMC free article] [PubMed] [Google Scholar]
- 21.Saberkari H, Shamsi M, Sedaaghi MH. The hybrid anti-notch/goertzel algorithm for gene prediction in dna sequences. Appl Med Inform. 2014;34:13–22. [Google Scholar]
- 22.Joroughi M, Shamsi M, Saberkari H, Sedaaghi MH, Momennezhad A. Gene selection and cancer classification based on microarray data using combined BPSO and BLDA algorithm. Comput Intell Electr Eng. 2014;5:29–46. [Google Scholar]
- 23.Saberkari H, Shamsi M, Heravi H, Sedaaghi MH. A novel fast algorithm for gene prediction in eukaryotic genes using linear predictive coding model and goertzel algorithm based on Z-curve. Int J Comput Appl. 2013;67:25–38. [Google Scholar]
- 24.Saberkari H, Shamsi M, Sedaaghi MH. A punctual algorithm for small gene prediction in DNA sequences using a time-frequency approach based on the z-curve. GSTF Int J Eng Technol. 2013;2:1–9. [Google Scholar]
- 25.Saberkari H, Shamsi M, Heravi H, Sedaaghi MH. A fast algorithm for exonic regions prediction in DNA sequences. J Med Signals Sens. 2013;3:139–49. [PMC free article] [PubMed] [Google Scholar]
- 26.Saberkari H, Shamsi M, Sedaaghi MH, Golabi F. Bandung, Indonesia: 2012. Prediction of Protein Coding Regions in DNA Sequences Using Signal Processing Methods, IEEE Symposium of Industrial Electronics and Applications (ISIEA’2012) pp. 354–9. [Google Scholar]
- 27.Berger R, Gerber CH, Lang HP, Gimzewski JK. Micromechanics: A toolbox for femtoscale science: Towards a laboratory on a tip. Microelectron Eng. 1997;35:373–9. [Google Scholar]
- 28.Lang HP, Hegner M, Meyer E, Gerber CH. Nanomechanical from atomic resolution to molecular recognition based on atomic force microscopy technology. Nanotechnology. 2002;13:R29–36. [Google Scholar]
- 29.Berger R, Lang HP, Gerber CH, Gimzewski JK, Fabian JH, Scandella L, et al. Micromechanical thermogravimetry. Chem Phys Lett. 1998;294:363–9. [Google Scholar]
- 30.Berger R, Delamarche E, Lang HP, Gerber C, Gimzewski JK, Meyer E, et al. Surface stress in the self-assembly of alkanethiols on gold. Science. 1997;276:2021–4. [Google Scholar]
- 31.Fritz J, Baller MK, Lang HP, Rothuizen H, Vettiger P, Meyer E, et al. Translating biomolecular recognition into nanomechanics. Science. 2000;288:316–8. doi: 10.1126/science.288.5464.316. [DOI] [PubMed] [Google Scholar]
- 32.Fritz J, Baller MK, Lang HP, Strunz T, Meyer E, Güntherodt HJ, et al. Stress at the solid-liquid interface of self-assembled monolayers on gold investigated with a nanomechanical sensor. Langmuir. 2000;16:9694–6. [Google Scholar]
- 33.McKendry R, Zhang J, Arntz Y, Strunz T, Hegner M, Lang HP, et al. Multiple label-free biodetection and quantitative DNA-binding assays on a nanomechanical cantilever array. Proc Natl Acad Sci U S A. 2002;99:9783–8. doi: 10.1073/pnas.152330199. [DOI] [PMC free article] [PubMed] [Google Scholar]
- 34.Fritz J. Cantilever biosensors. Analyst. 2008;133:855–63. doi: 10.1039/b718174d. [DOI] [PubMed] [Google Scholar]
- 35.Thundat T, Warmack RJ, Chen GY, Allison DP. Thermal and ambient-induced deflections of scanning force microscope cantilevers. Appl Phys Lett. 1994;64:2894–6. [Google Scholar]
- 36.Battiston FM, Ramseyer JP, Lang HP, Baller MK, Gerber CH, Gimzewski JK, et al. A chemical sensor based on a microfabricated cantilever array with simultaneous resonance-frequency and bending readout. Sens Actuators B Chem. 2001;77:122–31. [Google Scholar]
- 37.Ziegler C. Cantilever-based biosensors. Anal Bioanal Chem. 2004;379:946–59. doi: 10.1007/s00216-004-2694-y. [DOI] [PubMed] [Google Scholar]
- 38.Ilic B, Craighead HG. Attogram detection using nanoelectromechanical oscillators. J Appl Phys. 2004;95:3694–703. [Google Scholar]
- 39.Yi JW, Shih WY, Shih WH. Effect of length, width, and mode on the mass detection sensitivity of piezoelectric unimorph cantilevers. J Appl Phys. 2002;91:1680–6. [Google Scholar]
- 40. [Last accessed on 2014 Oct 10]. Available from: http://www.nanoscience.ch/
- 41. [Last accessed on 2014 Oct 10]. Available from: http://www.metglas.com/products/magnetic_materials/2826mb.asp .
- 42.Read DT. Young's modulus of thin films by speckle interferometry. Meas Sci Technol. 1998;9:676–85. [Google Scholar]
- 43.Liang C, Morshe S, Prorok BC. Correction for longitudinal mode vibration in thin slender beams. Appl Phys Lett. 2007;90:221912. [Google Scholar]
- 44.Fu L, Li S, Zhang K, Chen IH, Petrenko VA, Cheng Z. Magnetostrivtive microcantilever as an advanced transduced for biosensors. Sensors. 2007;7:2929–41. doi: 10.3390/S7112929. [DOI] [PMC free article] [PubMed] [Google Scholar]
- 45.Merhaut J. New York, London: McGraw-Hill, International Book Co; 1981. Theory of Electroacoustics. [Google Scholar]
- 46.Kar AK, George MA. Improved detection of thermally induced higher resonance modes and harmonics of a microcantilever. J Appl Phys. 2003;94:4626–31. [Google Scholar]
- 47.Dohn S, Svendsen R, Svendsen W, Boisen A. Enhanced functionality of cantilever based mass sensors using higher modes. Appl Phys Lett. 2005;86:233501. [Google Scholar]
- 48. [Last accessed on 2014 Oct 10]. Available from: http://en.wikipedia.org/wiki/Quality_factor .
- 49.Ekinci KL, Huang XM, Roukes ML. Ultrasensitive nanoelectromechanical mass detection. Appl Phys Lett. 2004;84:4469–71. [Google Scholar]
- 50.Yang YT, Callegari C, Feng XL, Ekinci KL, Roukes ML. Zeptogram-scale nanomechanical mass sensing. Nano Lett. 2006;6:583–6. doi: 10.1021/nl052134m. [DOI] [PubMed] [Google Scholar]
- 51.Ilic B, Craighead HG, Krylo S, Senaratne W, Ober C, Neuzil P. Attogram detection using nanoelectromechanical oscillators. J Appl Phys. 2004;95:3694–703. [Google Scholar]
- 52.Ilic B, Yang Y, Aubin K, Reichenbach R, Krylov S, Craighead HG. Enumeration of DNA molecules bound to a nanomechanical oscillator. Nano Lett. 2005;5:925–9. doi: 10.1021/nl050456k. [DOI] [PubMed] [Google Scholar]