

Abstract
The community of microbes that inhabits the mammalian intestinal tract exists in a symbiosis with their host. The structure of this community represents the combined effects of selection pressure on the part of the host and on the part of the microbes themselves. Through recent advances in the field of microbial ecology we are beginning to understand the forces that shape this complex community. We will review what is known about the interaction between the host and the indigenous microbial community. Following this discussion we will introduce methods that have been used to study the structure, function and dynamics of this community.
Introduction
The mammalian gut is inhabited by a complex community of microbes, collectively referred to as the microbiota.1 Once thought of as a collection of freeloading “commensal” organisms that simply found a ready source of food, it is now appreciated that the relationship between the host and the microbiota is an intricate mutualistic symbiosis.1–3 In return for secure environmental niches, the microbiota provide a number of key functions that contribute to the proper functioning of the host gastrointestinal tract.
In this chapter the concept of the microbiota as a part of a complex ecosystem comprised of the microbiota and the host epithelium and immune system will be presented. We provide a broad overview of the composition of the gut microbiota, including descriptions of a variety of culture-independent techniques that have been used to examine the structure and function of this community of microorganisms. Some of these strategies are illustrated with examples from our own work examining the microbiota of humans with antibiotic-associated diarrhea. We suggest that a detailed understanding of the structure/function relationships of the intestinal microbiota will have ramifications in rationale design and use of probiotics, since only with an understanding of the “natural balance” of the microbiota of the gastrointestinal tract can we effectively manipulate this ecosystem in a beneficial manner.
Structure of the Intestinal Microbial Community
It has been estimated that each person is inhabited by a microbiota consisting of 1014 organisms, outnumbering the number of host cells by an order of magnitude. The gastrointestinal (GI) tract is the home for the majority of these organisms.1,4 Each segment of the GI tract appears to be populated with a distinct, stable community of microbes, with the highest density in the colon with an estimated density of 1 × 10¹² organisms per gram (dry weight) of feces. For the remainder of this chapter, we will focus on the bacterial microbiota, although it should be noted that Eukaria (e.g., yeasts), Archaea and viruses are also members of this ecosystem.
One aspect of the indigenous GI microbiota that was apparent early on was that the community was quite diverse. For the discussion here, we will define diversity simply as “the variety and abundance of species in a defined unit of study”.5 Although species concepts for microbes are frequently incongruous with those of plants and animals, diversity measures can still be used effectively to describe and compare microbial communities. Diversity is composed of two key components, richness and evenness. Richness refers to what is likely the most intuitive aspect of diversity, namely the total number of species in the unit of study. Evenness on the other hand describes relative differences in the abundance of various species in the community. We will return to these concepts when we introduce the measurement of ecologic variables to describes different microbial communities.
Early measurements of the diversity of the GI microbiota came from culture-based studies that used the techniques developed by Hungate to cultivate strictly anaerobic microbes. It is from such studies that the often-quoted number of 400–500 distinct species in the gut microbiota was derived.6 It is also from these early culture-based studies that it was estimated that the majority (up to 90%) of the different bacterial species present could be cultivated. More recent culture-independent studies of the intestinal microbiota suggest that these early studies largely underestimated the total species richness and overestimated the ability of current culture methods to cultivate the majority of organisms present.4
Data from culture-based and culture-independent analyses also suggest that there is significant individual-to-individual variation in the diversity of the gut microbiota, although the community within an individual appears to be relatively constant over time.4,6–9 Although this individual variation suggests that the study of such large, intrinsically and extrinsically diverse communities presents intractable problems, recent work also suggests that at higher levels (i.e., ecosystem) of organization, principles are operating that allow one to study structural and function aspects of the entire community.1,10,11
For example, when using analysis of 16S rRNA-encoding gene sequence data to examine similarities between bacterial communities, one common definition of an operational taxonomic unit (OTU—roughly, the sequence-based equivalent of the taxonomic classification “species”) is a group of organisms that share >97% sequence identity.12 With this definition of OTU set at 0.97 sequence identity, a comparison of almost any two microbial communities obtained from individuals, or even from different anatomic sites within one individual, indicates that the communities are distinct. However, if the analysis is repeated and instead the communities are compared at the level of bacterial phyla, most normal individuals have quite similar communities with the majority of organisms belong to two phyla, the Firmicutes and Bacteroidetes. In fact, among the roughly 80 bacterial divisions described based on 16S rRNA-encoding gene analysis, only eight have ever been identified within the gut community. Perhaps even more striking is the fact that this applies not only to the human gut, but similar deep taxonomic structure is also encountered in the mouse intestine, implying that extreme selection pressure is shaping the structure of the microbial community in most (if not all) mammalian intestinal tracts.10
Functional Aspects of the Intestinal Microbiota
What is the nature of the selection pressure on the community structure of the gut microbial community? Clues to the forces that shape the community can be found by examining some of the proposed roles that the microbiota play in the intestinal ecosystem and the specific interactions they have with the host. One obvious force that has direct correlation with macroecologic systems is that stable ecosystems are thought to have well-organized and stable trophic structures.13 The flow of nutrients between different members of a given ecosystem is influenced by and can in turn influence the members of the ecosystem. In the gut, it turns out that not only do the microbiota have access to a ready supply of nutrients (hence their common designation as “commensals”) but metabolic products produced by the microbiota are in turn utilized by the host. This indicates that for many members of the gut microbiota, their relationship with the host might best be considered to be mutualistic.11 For example, members of the Firmicutes ferment nondigestible starch into short chain fatty acids, in particular, butyrate. Butyrate in turn is the preferred energy source for colonic enterocytes and also is thought to contribute to gut homeostasis through modulation of cell function.14–18
Through an incompletely understood set of signals, the microbiota also contribute to the normal development of the gut. Mainly through studies on gnotobiotic mice, the role of the microbiota in driving aspects of postnatal gut maturation has been delineated. During the time of weaning, there is a shift in the intestinal glycoconjugate repertoire, from glycans that terminate with sialic acid to those that terminate with the sugar fucose. Interestingly, this shift does not occur in germ free mice, but it can be induced by the monoassociation of these mice with the bacterium Bacteroides thetaiotaomicron.19,20 It is noteworthy that the genome of B. thetaiotaomicron codes for an impressive array of mechanisms for the acquisition and utilization of dietary polysaccharides and that gene expression analysis reveals that the organism can shift its metabolism to utilize host mucus glycans when polysaccharides are absent.21–22 In response to colonization with B. thetaiotaomicron, germfree mice modulate the expression of host genes important in nutrient formation, mucosal barrier function and angiogenesis.23
Although trophic interactions within the gut are readily obvious and have the most direct correlation with macroecologic systems, another important interaction between the microbiota and the host involves the host immune system. As will be discussed in later chapters, it is clear that the microbiota have the ability to stimulate beneficial as well as deleterious host immune responses. Less is known about how the host immune system can shape the community structure of the indigenous microbiota. One recent study, using the culture-independent T-RFLP method (see below) to “fingerprint” the microbiota of the terminal ileum showed that the lack of secretory antibodies in adult pIgR−/− mice did not alter the composition of the microbiota compared to wild type animals.24 Conversely, another group using 16S clone library analysis showed that mice that lacked hypermutated IgA (due to a defect in activation-induced cytidine deaminase) had altered intestinal microbiota, most notably an expansion of the segmented filamentous bacteria.25
The influence of host genotype on the structure of the microbiota isn’t restricted to immunologic function. It was recently demonstrated that mice deficient in the leptin gene had altered diversity of their microbiota manifested as inversion of the relative abundance of Bacteroidetes to Fimicutes compared to wild type littermates.10 Interestingly this study also showed that while evenness was influenced by genotype, species composition reflected a maternal influence, demonstrating that the microbiota can be inherited vertically (particularly for mice raised in barrier facilities with sterilized food and water).
The effect of other host factors has been examined. In one study quantitative culture demonstrated that the status of the maternal adaptive immune system did influence the intestinal microbiota of suckling mice.26 Similarly, a study that used hybridization probes targeting Bifidobacterium and Lactobacillus species showed that the administration of probiotics and breastfeeding in infants had an effect on the composition of the fecal microbiota.27
Methods to Study the Structure and Function of the Gut Microbiota
Limitations imposed by culture-based surveys of the gut microbiota gut have been circumvented by the application of molecular methods based on the direct extraction and analysis of nucleic acids from the microbiota (Fig. 1). The first step in analyzing the structure of such communities is frequently a survey of PCR-amplified 16S ribosomal RNA (rRNA) genes. This is a particularly useful gene to assess the composition of a microbial community due to the presence of conserved regions in the gene that are conserved amongst microbes and serve as convenient targets for amplification primers, coupled to the availability of a large data set of rRNA sequences that are available for comparison; there are currently more than 250,000 aligned, bacterial rRNA gene sequences in the Ribosomal Database Project.28
Figure 1.

Molecular approaches for interrogating the structure and function of microbial communities. DNA-based approaches provide a cultivation independent assessment of community structure and metabolic potential, while RNA- or protein-based methods offer the opportunity to document expression of that potential under selected environmental condition.
While sequencing of rRNA genes provides the greatest resolution for phylogenetic identification of the resident microbes, high-throughput community fingerprinting approaches such as T-RFLP provide an overview of community structure that permits the simultaneous analysis of dozens of samples of the microbiota. In T-RFLP, one of the amplification primers is labeled with a fluorochrome; then following amplification, the pool of amplicons is digested with a restriction enzyme. The resulting mix of DNA fragments is separated based on size using a DNA sequencer, with only the fluor-containing terminal fragments subsequently detected due to their fluorescence. The resulting chromatogram (Fig. 2) reveals terminal restriction fragments (TRFs) from the more abundant members of the community. Upon inspection of a T-RFLP chromatogram, it is readily apparent that the method captures the ecologic diversity of the community. The number of TRFs is an indication of the number of different OTUs present in the community (i.e., richness) while the relative peak heights provide and indication of relative abundance (i.e., evenness).
Figure 2.
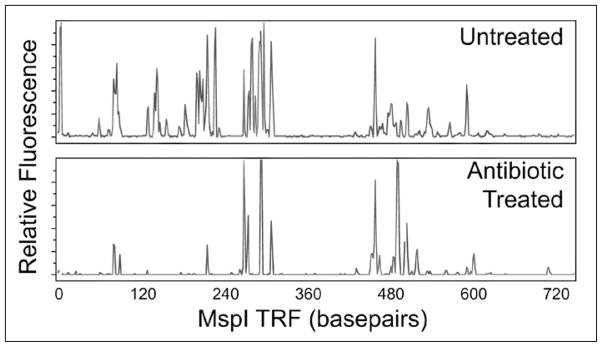
T-RFLP traces demonstrating the ability to provide a community fingerprint of the mucosa-associated microbiota from the cecum of a mouse. Compared to the T-RFLP profile from a control mouse (top), the T-RFLP profile from a mouse treated with antibiotics (metron-idazole, amoxicillin and bismuth) has decreased diversity, most notably due to the decrease in the total number of terminal restriction fragments (peaks).
While detailed methods for the construction and analyses of clone libraries and T-RFLP fingerprints of the colonic microbiota are readily available and these approaches are frequently used, 29–33 concerns about the interpretation of the results from these methods have been raised. There is documented potential for bias during PCR amplification as well as strategies, including decreased cycle number, to minimize bias.34–36 However due to the idiosyncratic nature of molecular surveys that employ different amplification primers and DNA of different purity that is extracted from communities with varying degrees of complexity, there is unlikely to be a single, bias free procedure that is broadly application. As with any survey method, replication is an essential component of reliable nucleic acid based measures of community structure.
With advances in DNA sequencing technology, it is now feasible to extend beyond single gene surveys and query the entire genetic diversity present in the microbiome through the construction of large insert clone libraries or shotgun libraries.37–38 These approaches do not include amplification before the construction of clone libraries and so avoid the potential bias of this initial step. More importantly, the libraries include information not only about the phylogenetic composition of a microbial community, but reveal the metabolic potential of the community as well. For instance, the genes involved in the formation of butyrate, an abundant short chain fatty acid in the gut, were enriched in clone libraries constructed from DNA extracted from the microbiome of the human GI tract.38 This finding is consistent with the proposed role of the micobiome in providing colonocytes with this favored carbon and energy source.
While knowing the composition and metabolic potential of the microbiome can be useful in determining factors that influence the diversity, linking the structure of microbial communities with its function has the potential to exert the most profound influence on our understanding and successful manipulation of the microbiota. Again, direct extraction of nucleic acids, this time with a focus on mRNA, provides a window to view the fraction of the metabolic potential that is being expressed at a particular time and location in the GI tract. A recent application of whole-genome transcriptional profiling combined with mass spectrometry revealed that the presence of a methanogenic archaeon altered gene expression of a gut bacterium and thus has the potential to influence the host’s energy harvest from dietary glycans.39 Such functional analyses, coupled with structural analyses of the gut microbiota enhance our capacity to understand the role of the gastrointestinal microbiota in health and disease.
The Microbiota in the Context of the Intestinal Ecosystem
The discussion to this point has advanced the concept that the microbiota of the intestinal tract is not merely a random collection of “commensal” organisms that take advantage of a readily supply of nutrients. Instead, the indigenous gut microbiota are part of an intricate ecosystem comprised of the indigenous microbiota, the host mucosal epithelium and elements of the host immune system. As a stable ecosystem, there are interdependencies between the various components that contribute to the survival of each individual element. As a corollary to this idea, each component has evolved in a manner to survive within this ecosystem. Therefore, study of one component can provide insight into the function of the entire ecosystem. To illustrate these concepts, we will provide examples from our laboratories examining changes in the gut microbiota in the setting of antibiotic-associated diarrhea (AAD).32
Many patients who are treated with antibiotics subsequently develop diarrhea. A proportion of patients with AAD (estimated at about 25%) develop disease secondary to the presence of the toxin-producing bacterium Clostridium difficile. Both patients with C. difficile-associated diarrhea (CDAD) and nonCDAD are thought to develop disease secondary to antibiotic-mediated alteration of the gut microbiota. It is this hypothesis that has prompted clinical trials of probiotics in both CDAD and nonCDAD. A recent meta-analysis of these trials concluded that probiotics can be used to treat CDAD and prevent nonCDAD.40
To investigate if study of the fecal microbiota could provide insight into the pathogenesis of nonCDAD, we examined the microbial ecology of fecal specimens from a patient who developed diarrhea while taking amoxicillin/clavulanic acid.32 Clone libraries of 16S rRNA-encoding genes were constructed from fecal DNA harvested from the first voided stool after antibiotics (which represents the baseline community), four days after initiation of therapy and 28 days after initiation (two weeks after the end of the 10-day course of antibiotics).
A total of 239 sequences were used in the final analysis, 84 from Day 0, 72 from Day 4 and 83 from Day 28. Given the relatively small number of sequences from three separate “communities” (i.e., the three sampling times), we could present the data in the form of a phylogenetic tree (Fig. 3). Examination of this tree shows that although this representation of the data can provide useful information, it also demonstrates that as the number of individual 16S continues to rise, the “tips” of the tree (i.e., individual clones) become increasingly crowded and difficult to discern. One solution to help reduce the complexity of the data is to group the data into phylogenetically coherent groups, as represented by the multiple bar graphs in the figure. In this case, the grouping of clones was based on observed clusters whose grouping was supported by bootstrap values. Bootstrap values provide nonparametric statistical analysis of the groupings that are encountered in a phylogenetic tree.41 In brief, the data are randomly resampled multiple times, each time reconstructing a phylogeny. In essence, the bootstrap values indicate the percentage of resulting phylogenies that produce the same exact grouping seen in the original.
Figure 3.

Phylogeny showing the distribution of 16S rRNA-encoding gene sequences from clone libraries constructed from stool DNA samples obtained from a patient prior to antibiotic therapy (Day 0-red), during therapy (Day 4-green) and two weeks after discontinuation of therapy (Day 24-blue). Brackets outline major clusters of organisms and the adjacent bar graphs document the distribution of clones in each cluster at each time point. Named species are representative type species downloaded from the Ribosomal Database Project and inserted into the tree to provide taxonomic reference points. These reference species do not contribute to the number of clones depicted in the bar graphs. The scale bar represents evolutionary distance (10 substitutions per 100 nucleotides). The tree was constructed using neighbor-joining analysis of a distance matrix obtained from a multiple-sequence alignment performed using the ARB suite of programs. Bootstrap values were calculated using the MEGA2 program.
Although phylogenetic representations of 16S clone library surveys are commonly used and can provide important insight into the data, scientists who are not trained in the interpretation of phylogenies can find such representations to be problematic.42 Additionally, as pointed out above, even with use of methods such as clustering and bootstrapping, it can be difficult to represent extremely large datasets. With the advances in DNA sequencing technology, extremely large datasets of 16S rRNA-encoding gene sequences are being assembled. Even when phylogenies are constructed using only “unique” phylotypes (defined based on a set percentage sequence similarity), when a large number of communities is being compared, visual examination of such representations can be daunting.4
As detailed above, the use of numerical methods to analyze ecological methods has been developed for the analysis of ecologic datasets, initially applied to macroecologic systems. One method that provides an alternative way to visualize the diversity present in a clone library is through the construction of rarefaction curves.43 Rarefaction analysis is a method that allows comparisons between communities primarily based on richness. In brief, the rarefaction process involves iterative resampling of a given population dataset consisting of N members. Sampling is done without replacement and this will generate an estimate (along with confidence intervals) of the expected number of OTUs encountered in a subset n of the entire population represented by N individuals. The curve is constructed by plotting the average number of OTUs represented by 1, 2, …N individuals. A strength of rarefaction analysis is that it allows comparison between libraries that have been sampled with differing intensity.44
We constructed rarefaction curves for each 16S clone library from the antibiotic-associated diarrhea patient using the program DOTUR.12 Examination of the curves (Fig. 4) reveals that antibiotic administration resulted in a decrease in the overall richness of the community, as the rarefaction curve from the Day 4 library lies below the Day 0 library. Once antibiotics were stopped, the rarefaction curve returned the original, implying that species richness was restored once the community was given a chance to recover. This conclusion is supported by the calculation of the estimated species richness for each library based on the method of Chao.45 As discussed above, this method provides an estimate of the lower-bound of the actual richness in a partially sampled community. Using an OTU definition based on 3% sequence divergence employing the DOTUR program, the Chao1 estimate of richness is 67 for the Day 0 library, 25 for the Day 4 library and 59 for the Day 28 library.
Figure 4.

Rarefaction analysis comparing OTU richness in the three 16S libraries constructed from the patient with antibiotic-associated diarrhea. Antibiotic administration was associated with a decrease in overall species richness and this resolved following the discontinuation of the antibiotic treatment. The curves represent the average number of OTUs encountered during iterative resampling of the original clone data with 95% confidence intervals depicted by the error bars.
Although comparisons of species richness can be useful, it is often informative to compare communities based on richness and evenness. Furthermore, comparison between communities based on rarefaction does not take into account as to whether specific OTUs are present in the different communities. It is possible that two communities can have the same overall structure and thus will have identical rarefaction curves, but there are no OTUs that are present in both communities. In the example we are discussing here, there are shared OTUs in all three libraries, but even in case of the Day 0 and the Day 28 library, there are differences that are not captured by rarefaction analysis. Bifidobacteria were identified in the Day 0 library, representing approximately 16% of the clones but were not encountered in the Day 28 library despite having overlapping rarefaction curves.
In order to compare populations not only based on richness, but also in terms of evenness and the presence of shared OTUs we can use one of a number of beta-diversity indices. An example of such a metric is the Bray-Curtis distance measure.46 Using such a distance metric, all pair-wise comparisons can be made between a set of communities and the results can then be displayed in a tabular format or in the form of a dendrogram. The latter representation of data can be useful in that it can provide visual evidence of clustering or grouping. When Bray-Curtis distances for the three clone libraries from the patient with AAD are depicted in dendrograms format, it is once again clear that antibiotic administration significantly changes the community structure of the fecal microbiota and that once antibiotics are discontinued, there is a return towards the baseline status (Fig. 5). However, as opposed to only looking at overall species richness, as was done with rarefaction analysis, this analysis shows that discontinuation of antibiotics resulted in a community structure that was more similar to the baseline community, but still distinct. Again, examination of the phylogeny constructed in Figure 1 supports this conclusion. For example, in addition to the lack of reappearance of Bifidobacteria, in the Day 28 library there was a proportionately greater amount of B. fragilis and Clostridial group XIVa organisms and an under representation of Clostridial group IV organisms compared to Day 0.
Figure 5.
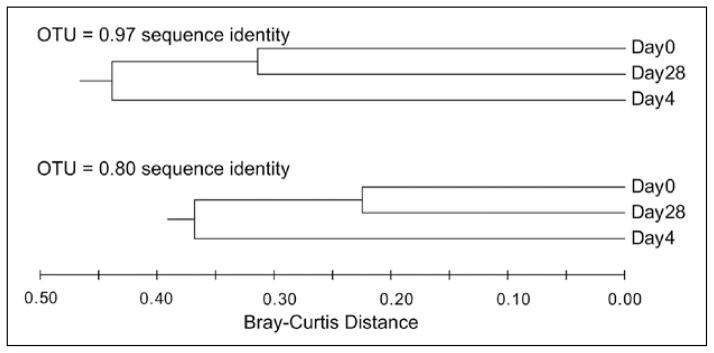
Dendrograms illustrating the relationships between the three 16S libraries from the antibiotic-associated diarrhea patient. Based on OTU assignment (at two levels, ≥97% and ≥80% sequence identity) the Bray-Curtis distance metric was calculated and then a UPGMA dendrogram constructed. For both OTU definitions, the Day 0 (pre-antibiotic) and Day 28 (2 weeks after antibiotic administration was stopped) communities were most similar.
In Figure 5, two dendrograms are shown, demonstrating the effect of changing OTU definitions on analysis. In the first analysis, all sequences that shared ≥97% sequence identity were considered to belong to a given OTU. In the second analysis, the OTU cutoff was decreased to ≥80% sequence identity. As stated before, this roughly corresponds to the conventional “species” and “family” taxonomic divisions. Although changing OTU definitions will alter the calculated Bray-Curtis distance, the relationship between the communities remains similar in that the Day 0 and Day 28 communities are most similar and divergent from the Day 4 community. Although when considering rRNA-encoding gene sequence alone, OTU definition may appear to be somewhat arbitrary, it can become important when considering ecosystem function. It has been noted that although there appears to be significant diversity among the gut microbiota at the level of species and strain, there is relatively little divergence at deep phylogenetic divisions.4,10 It has been hypothesized that this reflects selection pressure to occupy specific ecologic niches, which in turns requires conserved sets of metabolic functions.11
Ecologic Statistical Analysis as a Means to Reduce Data Complexity
Analysis that involves clustering of communities also serves to reduce the complexity of large datasets. Although in the current example only three communities were compared, we have successfully used this form of analysis to compare 12 or more independent communities profiled by 16S clone library construction (unpublished data). Other investigators have employed forms of data reduction and clustering analysis to examine large sets 16S rRNA-encoding gene sequence data. Methods such as principal component analysis and partial least-squared regression can also detect distinct patterns within large datasets.47 Eckburg and colleagues recently published a large 16S survey of human gut microbial diversity in which they used a method termed double principal coordinates analysis, to examine relationships between the colonic microbiota in different individuals and in different anatomic sites.4,48 Ley and colleagues employed yet another method that compares multiple phylogenies (and therefore does not directly sequence divergence between clones, not does it require the assignment of sequences into specific OTUs) to examine the relationships between the cecal microbiota of mice that differed in leptin genotype.10,49
The existence of multiple methods for the community analysis resulting from the retrieval of 16S rRNA-encoding gene sequence data may suggest to some that it is difficult to obtain reliable “answers” from such data. However, although some investigators might wish to argue as to which type of analysis might be the “best,” in our experience, the use of multiple methods of analysis provides complementary and (fortunately) noncontradictory information about the relationships between multiple microbial communities. In any case, it should be stressed that we view microbial community surveys in a manner analogous to exploratory microarray analysis. A great deal of data is generated, which needs to be simplified and once analyzed, the data generally do not provide a clear-cut answer, but allow the development of specific, testable hypotheses. The testing of such hypotheses may require additional non culture-based community analysis, but when it comes to testing hypotheses about microbial community function, culture-based analysis and biochemical analysis are likely to prove necessary. For example, our work on antibiotic-associated diarrhea has lead to a followup case-control study where we are attempting to correlate changes in the fecal microbial community with C. difficile-associated and nonC. difficile-associated AAD. In order to do this, characterization of the specific C. difficile strains responsible for disease and actual determination of fecal short-chain fatty acid levels will be complementary to microbial community analysis. A recent metagenomic analysis of human feces suggested that there was an abundance of bacterial genes involved in the production of short-chain fatty acids, especially butyrate kinase, further suggesting that it is important to conduct experiments to test the functional significance of this finding.38 It has been proposed that it is best to pursue a balanced approach, involving both large information-driven methods and classical microbial and biochemical methods to fully understand microbial community function.50
Summary
The complex community of microbes that inhabits the mammalian gut is part of an intricate ecosystem that involves the microbes, the host epithelium and the host immune system. The analysis of large, complex microbial communities has been revolutionized by the development of culture-independent methods that take advantage of the high throughput DNA sequence-driven techniques that made whole-genome analysis possible. The use of these techniques can provide a detailed determination of the structure of the gut microbial community and how this structure can be altered by disease states. An understanding of structure can lead to hypotheses about community function that can be tested by an integrated approach utilizing sequence-based techniques coupled with classical microbiologic, biochemical and immunologic analysis. It is likely that such studies will lead to a greater understanding of the relationship we have with the community of microbes that inhabits our bodies. Hopefully, this understanding will lead to novel methods for the prevention and treatment of diseases that result from disturbances in this mutualistic symbiosis.
References
- 1.Backhed F, Ley RE, Sonnenburg JL, et al. Host-bacterial mutualism in the human intestine. Science. 2005;307(5717):1915–20. doi: 10.1126/science.1104816. [DOI] [PubMed] [Google Scholar]
- 2.McCracken VJ, Lorenz RG. The gastrointestinal ecosystem: a precarious alliance among epithelium, immunity and microbiota. Cell Microbiol. 2001;3(1):1–11. doi: 10.1046/j.1462-5822.2001.00090.x. [DOI] [PubMed] [Google Scholar]
- 3.Lievin-Le Moal V, Servin AL. The Front Line of Enteric Host Defense against Unwelcome Intrusion of Harmful Microorganisms: Mucins, Antimicrobial Peptides and Microbiota. Clin Microbiol Rev. 2006;19(2):315–37. doi: 10.1128/CMR.19.2.315-337.2006. [DOI] [PMC free article] [PubMed] [Google Scholar]
- 4.Eckburg PB, Bik EM, Bernstein CN, et al. Diversity of the Human Intestinal Microbial Flora. Science. 2005;308:1635–8. doi: 10.1126/science.1110591. [DOI] [PMC free article] [PubMed] [Google Scholar]
- 5.Magurran AE. Measuring Biological Diversity. Oxford, UK: Blackwell Science Ltd; 2004. [Google Scholar]
- 6.Moore WE, Holdeman LV. Human fecal flora: the normal flora of 20 Japanese-Hawaiians. Appl Microbiol. 1974;27(5):961–79. doi: 10.1128/am.27.5.961-979.1974. [DOI] [PMC free article] [PubMed] [Google Scholar]
- 7.Zoetendal EG, von Wright A, Vilpponen-Salmela T, et al. Mucosa-associated bacteria in the human gastrointestinal tract are uniformly distributed along the colon and differ from the community recovered from feces. Appl Environ Microbiol. 2002;68(7):3401–7. doi: 10.1128/AEM.68.7.3401-3407.2002. [DOI] [PMC free article] [PubMed] [Google Scholar]
- 8.Delgado S, Suarez A, Mayo B. Identification of Dominant Bacteria in Feces and Colonic Mucosa from Healthy Spanish Adults by Culturing and by 16S rDNA Sequence Analysis. Dig Dis Sci. 2006;51(4):744–51. doi: 10.1007/s10620-006-3201-4. [DOI] [PubMed] [Google Scholar]
- 9.Delgado S, Ruas-Madiedo P, Suarez A, et al. Interindividual differences in microbial counts and biochemical-associated variables in the feces of healthy spanish adults. Dig Dis Sci. 2006;51(4):737–43. doi: 10.1007/s10620-006-3200-5. [DOI] [PubMed] [Google Scholar]
- 10.Ley RE, Backhed F, Turnbaugh P, et al. Obesity alters gut microbial ecology. Proc Natl Acad Sci USA. 2005;102(31):11070–5. doi: 10.1073/pnas.0504978102. [DOI] [PMC free article] [PubMed] [Google Scholar]
- 11.Ley RE, Peterson DA, Gordon JI. Ecological and evolutionary forces shaping microbial diversity in the human intestine. Cell. 2006;124(4):837–48. doi: 10.1016/j.cell.2006.02.017. [DOI] [PubMed] [Google Scholar]
- 12.Schloss PD, Handelsman J. Introducing DOTUR, a computer program for defining operational taxonomic units and estimating species richness. Appl Environ Microbiol. 2005;71(3):1501–6. doi: 10.1128/AEM.71.3.1501-1506.2005. [DOI] [PMC free article] [PubMed] [Google Scholar]
- 13.Tilman D. Niche tradeoffs, neutrality and community structure: a stochastic theory of resource competition, invasion and community assembly. Proc Natl Acad Sci USA. 2004;101(30):10854–61. doi: 10.1073/pnas.0403458101. [DOI] [PMC free article] [PubMed] [Google Scholar]
- 14.Cummings JH, Pomare EW, Branch WJ, et al. Short chain fatty acids in human large intestine, portal, hepatic and venous blood. Gut. 1987;28(10):1221–7. doi: 10.1136/gut.28.10.1221. [DOI] [PMC free article] [PubMed] [Google Scholar]
- 15.Topping DL, Clifton PM. Short-chain fatty acids and human colonic function: roles of resistant starch and nonstarch polysaccharides. Physiol Rev. 2001;81(3):1031–64. doi: 10.1152/physrev.2001.81.3.1031. [DOI] [PubMed] [Google Scholar]
- 16.Miller SJ. Cellular and physiological effects of short-chain fatty acids. Mini Rev Med Chem. 2004;4(8):839–45. doi: 10.2174/1389557043403288. [DOI] [PubMed] [Google Scholar]
- 17.Cuff MA, Shirazi-Beechey SP. The importance of butyrate transport to the regulation of gene expression in the colonic epithelium. Biochem Soc Trans. 2004;32(Pt 6):1100–2. doi: 10.1042/BST0321100. [DOI] [PubMed] [Google Scholar]
- 18.Daly K, Cuff MA, Fung F, et al. The importance of colonic butyrate transport to the regulation of genes associated with colonic tissue homoeostasis. Biochem Soc Trans. 2005;33(Pt 4):733–5. doi: 10.1042/BST0330733. [DOI] [PubMed] [Google Scholar]
- 19.Hooper LV, Xu J, Falk PG, et al. A molecular sensor that allows a gut commensal to control its nutrient foundation in a competitive ecosystem. Proc Natl Acad Sci USA. 1999;96(17):9833–8. doi: 10.1073/pnas.96.17.9833. [DOI] [PMC free article] [PubMed] [Google Scholar]
- 20.Bry L, Falk PG, Midtvedt T, et al. A model of host-microbial interactions in an open mammalian ecosystem. Science. 1996;273(5280):1380–3. doi: 10.1126/science.273.5280.1380. [DOI] [PubMed] [Google Scholar]
- 21.Xu J, Bjursell MK, Himrod J, et al. A genomic view of the human-Bacteroides thetaiotaomicron symbiosis. Science. 2003;299(5615):2074–6. doi: 10.1126/science.1080029. [DOI] [PubMed] [Google Scholar]
- 22.Sonnenburg JL, Xu J, Leip DD, et al. Glycan foraging in vivo by an intestine-adapted bacterial symbiont. Science. 2005;307(5717):1955–9. doi: 10.1126/science.1109051. [DOI] [PubMed] [Google Scholar]
- 23.Hooper LV, Wong MH, Thelin A, et al. Molecular analysis of commensal host-microbial relationships in the intestine. Science. 2001;291(5505):881–4. doi: 10.1126/science.291.5505.881. [DOI] [PubMed] [Google Scholar]
- 24.Sait L, Galic M, Strugnell RA, et al. Secretory antibodies do not affect the composition of the bacterial microbiota in the terminal ileum of 10-week-old mice. Appl Environ Microbiol. 2003;69(4):2100–9. doi: 10.1128/AEM.69.4.2100-2109.2003. [DOI] [PMC free article] [PubMed] [Google Scholar]
- 25.Suzuki K, Meek B, Doi Y, et al. Aberrant expansion of segmented filamentous bacteria in IgA-deficient gut. Proc Natl Acad Sci USA. 2004;101(7):1981–6. doi: 10.1073/pnas.0307317101. [DOI] [PMC free article] [PubMed] [Google Scholar]
- 26.Diaz RL, Hoang L, Wang J, et al. Maternal adaptive immunity influences the intestinal microflora of suckling mice. J Nutr. 2004;134(9):2359–64. doi: 10.1093/jn/134.9.2359. [DOI] [PubMed] [Google Scholar]
- 27.Rinne M, Kalliomaki M, Arvilommi H, et al. Effect of probiotics and breastfeeding on the bifidobacterium and lactobacillus/enterococcus microbiota and humoral immune responses. J Pediatr. 2005;147(2):186–91. doi: 10.1016/j.jpeds.2005.03.053. [DOI] [PubMed] [Google Scholar]
- 28.Cole JR, Chai B, Farris RJ, et al. The Ribosomal Database Project (RDP-II): sequences and tools for high-throughput rRNA analysis. Nucleic Acids Res. 2005;33(Database issue):D294–6. doi: 10.1093/nar/gki038. [DOI] [PMC free article] [PubMed] [Google Scholar]
- 29.Kuehl CJ, Wood HD, Marsh TL, et al. Colonization of the Cecal Mucosa by Helicobacter hepaticus Impacts the Diversity of the Indigenous Microbiota. Infect Immun. 2005;73(10):6952–61. doi: 10.1128/IAI.73.10.6852-6961.2005. [DOI] [PMC free article] [PubMed] [Google Scholar]
- 30.Matsumoto M, Sakamoto M, Hayashi H, et al. Novel phylogenetic assignment database for terminal restriction fragment length polymorphism analysis of human colonic microbiota. J Microbiol Methods. 2005;61(3):305–19. doi: 10.1016/j.mimet.2004.12.009. [DOI] [PubMed] [Google Scholar]
- 31.Sakamoto M, Hayashi H, Benno Y. Terminal restriction fragment length polymorphism analysis for human fecal microbiota and its application for analysis of complex bifidobacterial communities. Microbiol Immunol. 2003;47(2):133–42. doi: 10.1111/j.1348-0421.2003.tb02796.x. [DOI] [PubMed] [Google Scholar]
- 32.Young VB, Schmidt TM. Antibiotic-associated diarrhea accompanied by large-scale alterations in the composition of the fecal microbiota. J Clin Microbiol. 2004;42(3):1203–6. doi: 10.1128/JCM.42.3.1203-1206.2004. [DOI] [PMC free article] [PubMed] [Google Scholar]
- 33.Zoetendal EG, Collier CT, Koike S, et al. Molecular ecological analysis of the gastrointestinal microbiota: a review. J Nutr. 2004;134(2):465–72. doi: 10.1093/jn/134.2.465. [DOI] [PubMed] [Google Scholar]
- 34.Polz MF, Cavanaugh CM. Bias in template-to-product ratios in multitemplate PCR. Appl Environ Microbiol. 1998;64(10):3724–30. doi: 10.1128/aem.64.10.3724-3730.1998. [DOI] [PMC free article] [PubMed] [Google Scholar]
- 35.Qiu X, Wu L, Huang H, et al. Evaluation of PCR-generated chimeras, mutations and heteroduplexes with 16S rRNA gene-based cloning. Appl Environ Microbiol. 2001;67(2):880–7. doi: 10.1128/AEM.67.2.880-887.2001. [DOI] [PMC free article] [PubMed] [Google Scholar]
- 36.Suzuki MT, Giovannoni SJ. Bias caused by template annealing in the amplification of mixtures of 16S rRNA genes by PCR. Appl Environ Microbiol. 1996;62(2):625–30. doi: 10.1128/aem.62.2.625-630.1996. [DOI] [PMC free article] [PubMed] [Google Scholar]
- 37.Manichanh C, Rigottier-Gois L, Bonnaud E, et al. Reduced diversity of faecal microbiota in Crohn’s disease revealed by a metagenomic approach. Gut. 2006;55(2):205–11. doi: 10.1136/gut.2005.073817. [DOI] [PMC free article] [PubMed] [Google Scholar]
- 38.Gill SR, Pop M, Deboy RT, et al. Metagenomic analysis of the human distal gut microbiome. Science. 2006;312(5778):1355–9. doi: 10.1126/science.1124234. [DOI] [PMC free article] [PubMed] [Google Scholar]
- 39.Samuel BS, Gordon JI. A humanized gnotobiotic mouse model of host-archaeal-bacterial mutualism. Proc Natl Acad Sci USA. 2006;103(26):10011–6. doi: 10.1073/pnas.0602187103. [DOI] [PMC free article] [PubMed] [Google Scholar]
- 40.McFarland LV. Meta-analysis of probiotics for the prevention of antibiotic associated diarrhea and the treatment of Clostridium difficile disease. Am J Gastroenterol. 2006;101(4):812–22. doi: 10.1111/j.1572-0241.2006.00465.x. [DOI] [PubMed] [Google Scholar]
- 41.Henderson AR. The bootstrap: a technique for data-driven statistics. Using computer-intensive analyses to explore experimental data. Clin Chim Acta. 2005;359(1–2):1–26. doi: 10.1016/j.cccn.2005.04.002. [DOI] [PubMed] [Google Scholar]
- 42.Baum DA, Smith SD, Donovan SS. Evolution. The tree-thinking challenge. Science. 2005;310(5750):979–80. doi: 10.1126/science.1117727. [DOI] [PubMed] [Google Scholar]
- 43.Heck KJJ, Belle GV. Explicit calculation of the rarefaction diversity measurement and the determination of sufficient sample size. Ecology. 1975;56:1459–61. [Google Scholar]
- 44.Gotelli NJ, Colwell RK. Quantifying biodiversity: procedures and pitfalls in the measurement and comparison of species richness. Ecol Lett. 2001;4(4):379–91. [Google Scholar]
- 45.Chao A. Nonparametric estimation of the number of classes in a population. Scand J Stat. 1984;11:265–70. [Google Scholar]
- 46.Legendre P, Legendre L. Numerical Ecology. Amsterdam: Elsevier BV; 1998. [Google Scholar]
- 47.Rudi K, Maugesten T, Hannevik SE, et al. Explorative multivariate analyses of 16S rRNA gene data from microbial communities in modified-atmosphere-packed salmon and coalfish. Appl Environ Microbiol. 2004;70(8):5010–8. doi: 10.1128/AEM.70.8.5010-5018.2004. [DOI] [PMC free article] [PubMed] [Google Scholar]
- 48.Pavoine S, Dufour AB, Chessel D. From dissimilarities among species to dissimilarities among communities: a double principal coordinate analysis. J Theor Biol. 2004;228(4):523–37. doi: 10.1016/j.jtbi.2004.02.014. [DOI] [PubMed] [Google Scholar]
- 49.Martin AP. Phylogenetic approaches for describing and comparing the diversity of microbial communities. Appl Environ Microbiol. 2002;68(8):3673–82. doi: 10.1128/AEM.68.8.3673-3682.2002. [DOI] [PMC free article] [PubMed] [Google Scholar]
- 50.Oremland RS, Capone DG, Stolz JF, et al. Whither or wither geomicrobiology in the era of ‘community metagenomics’. Nat Rev Microbiol. 2005;3(7):572–8. doi: 10.1038/nrmicro1182. [DOI] [PubMed] [Google Scholar]