Abstract
The size and shape of the ocular lens must be controlled with precision if light is to be focused sharply on the retina. The lifelong growth of the lens depends on the production of cells in the anterior epithelium. At the lens equator, epithelial cells differentiate into fiber cells, which are added to the surface of the existing fiber cell mass, increasing its volume and area.
We developed a stochastic model relating the rates of cell proliferation and death in various regions of the lens epithelium to deposition of fiber cells and lens growth. Epithelial population dynamics were modeled as a branching process with emigration and immigration between various proliferative zones. Numerical simulations were in agreement with empirical measurements and demonstrated that, operating within the strict confines of lens geometry, a stochastic growth engine can produce the smooth and precise growth necessary for lens function.
Keywords: Epithelium, Proliferation, Mitosis, Immigration, Emigration, Branching process
INTRODUCTION
The mathematical relationships that determine the size and shape of tissues and organs are not well understood. The eye, and in particular the crystalline lens, appears to represent a promising model system with which to approach this difficult question. One can reason, a priori, that the dimensions of the image-forming tissues are likely to be regulated with particular precision. A lens that is too large or too small will not focus light sharply on the retina.
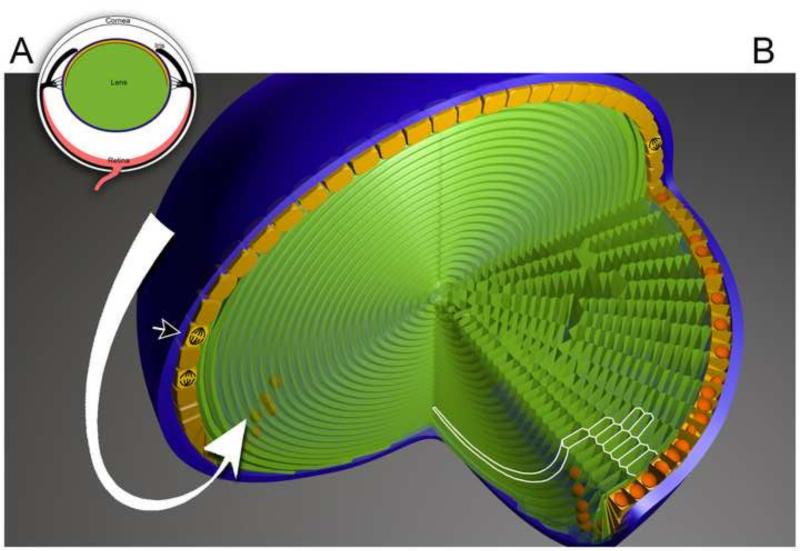
The vertebrate lens is a transparent, biconvex structure suspended in the eye behind the iris (Fig.1A). In conjunction with the cornea, the lens serves to focus light onto the retina. The lens is composed of only two cell types: epithelial cells and fiber cells (Fig.1B). The lens epithelium covers the anterior surface of the tissue and contains all of the mitotic cells (Hanna and O'Brien, 1961; Mikulicich and Young, 1963; Scullica et al., 1963). Epithelial cells differentiate into fiber cells at the edge of the epithelium, following exposure to growth factors in the vitreous humor (Lovicu et al., 2011). Newly differentiated fiber cells are added to the surface of the preexisting fiber cell mass. Fiber cell differentiation represents a profound biochemical and morphological transformation. For example, fiber cells withdraw from the cell cycle and undergo an enormous (102 - to 103 - fold) increase in length. They also express a distinct set of proteins, crystallins, which accumulate to extraordinary concentrations in the fiber cell cytoplasm and account for its high refractive index. The rate of cell death in the fiber population is undetectably low (Shi et al., 2015; Zandy et al., 2005). As a consequence, each lens retains a complete cellular history. Fiber cells that differentiated early in life are situated in the center of the lens, whereas newly-formed fibers are located near the surface. Thus, fiber cells at all stages of differentiation are perpetually present, arranged along the lens radius in the order formed.
Figure 1.
Cellular arrangements of the vertebrate lens. A. Schematic showing the location and orientation of the lens in the eye. B. Three-dimensional cut-away model of the mouse lens. The anterior lens surface is shown uppermost. A thick basement membrane, the capsule (blue), envelops the lens. A mono-layered epithelium (yellow) runs beneath the anterior portion of the capsule. Proliferating epithelial cells (arrowhead) are numerous near the equatorial border of the epithelium but rare in the central epithelium. At the equator, epithelial cells differentiate into fiber cells (green) and are deposited on the surface of the existing fiber cell mass. Fiber cell differentiation involves a marked increase in cell length. The processes of proliferation and differentiation are continuous and together result in the collective flow of epithelial cells towards the lens equator (in the direction shown by the white arrow). There is no cell turnover in the fiber compartment. As a result, the addition of new fiber cells causes the lens to increase in volume and surface area. Fiber cells have an elongated, prismatic shape. Their intersection with the equatorial plane (highlighted in white) is hexagonal.
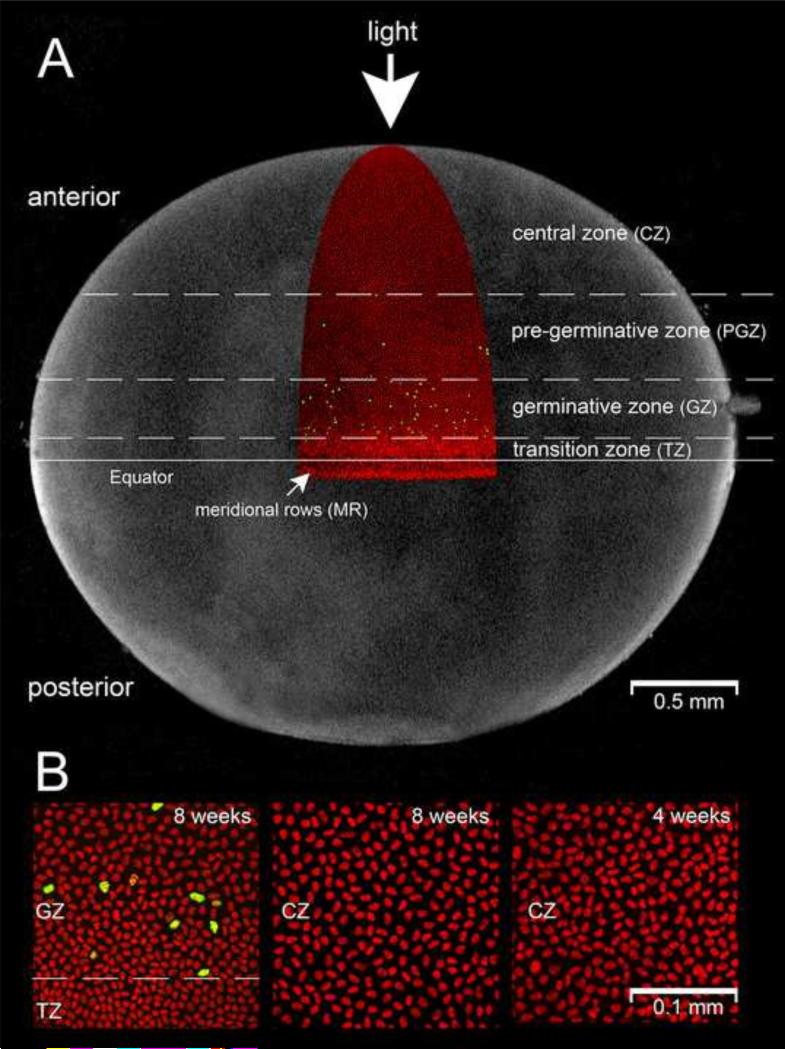
Unlike most tissues in the body, the lens grows throughout life (albeit at a slower rate in later years (Augusteyn, 2010)). Lens growth depends on the continuous production of new cells in the epithelial cell layer but the relationship between epithelial cell proliferation, fiber cell deposition and radial growth is unclear. In a companion study, we measured the proliferative index at various latitudinal positions in the mouse lens epithelium (Shi et al., 2015). On the basis of that analysis four distinct proliferative zones were identified. The highest concentration of S-phase cells was observed in a 300 μrn-wide swath of cells encircling the lens above the equator (see Fig. 2A). In accordance with previous nomenclature (Harding et al., 1960) this region was called the germinative zone (GZ). At the equator, the reorganization of cell nuclei into meridional rows (MR) signified the onset of fiber cell differentiation, thus delineating the edge of the epithelium. Interposed between the GZ and the MR was a narrow strip of epithelium within which S-phase cells were not observed. This post-mitotic region was referred to as the transition zone (TZ). Our studies confirmed the existence of a pre-germinative zone (PGZ), a region extending approximately 400 μm from the anterior border of the GZ towards the apical pole. The proliferative index in the PGZ was several-fold lower than in the GZ. Proliferative cells were rare or absent in the central zone (CZ) of the epithelium. The size of individual cells was also found to vary significantly with latitude. Cells nearer to the equator (for example, those in the TZ) covered a much smaller area of the lens capsule than those in more anterior regions (Fig.2B and (Shi et al., 2015)). The area of cells at all locations was also found to increase markedly with time (see Fig. 2B and (Shi et al., 2015)).
Figure 2.
Zonal organization of the lens epithelium. A. The distribution of S-phase cells (yellow) is shown in an 8-week-old mouse lens (nuclei are counterstained red). Proliferating cells are most numerous in the germinative zone (GZ), although S-phase cells are also present, at lower frequency, in the pre-germinative zone (PGZ). S-phase cells are not detected in the central zone (CZ) or the transition zone (TZ). At the equator, fiber cell differentiation commences and nuclei become aligned in meridional rows (MR). Thus, the boundary between the TZ and MR marks the edge of the epithelium. B. Cell size varies with age and latitudinal location. In 8-week-old mice, for example, cell area is smaller in the TZ and GZ compared to the CZ. The surface area of cells within the various zones increases with time (compare CZ cells at 4 weeks and 8 weeks, for example).
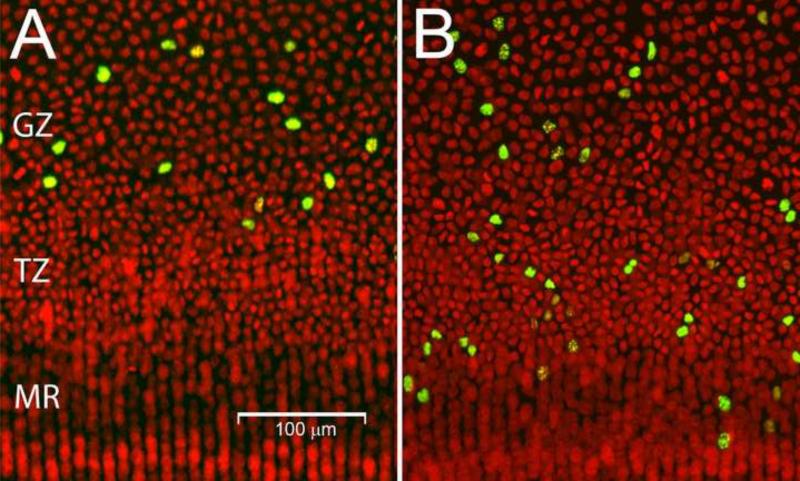
The migration of epithelial cells through the various zones can be visualized using a pulse-chase approach (Fig. 3 and (Shi et al., 2015)). If lenses are labeled with EdU (a thymidine analog incorporated into the DNA of S-phase cells) and examined immediately, proliferating cells are detected exclusively in the GZ and the PGZ (Fig. 2A and Fig. 3A). However, if lenses are examined 1 week after EdU incorporation, labeled cells are detected in the PGZ, GZ, TZ and MR (Fig. 3B). These observations support the notion that lens growth is characterized by cell division in the PGZ and GZ, migration of daughter cells through the TZ and MR and, ultimately, deposition of newly-differentiated fiber cells in the body of the lens.
Figure 3.
Epithelial cell migration. A. Immediately after EdU incorporation, S-phase cells (green) are detected in the GZ (and PGZ, not shown) but not in the TZ or MR. B. 1 week after EdU incorporation, labeled nuclei are detected in the GZ, TZ and MR, indicating that cells migrated from the GZ in the intervening period. Nuclei (red) are counterstained with Draq5.
The lifelong growth of the lens was first noted more than a century ago (Smith, 1883) but has yet to be modeled in detail. The growth process is of particular interest because unchecked lens growth has been implicated in the development of both presbyopia (Strenk et al., 2005) and cataract (Klein et al., 1998, 2000). A comprehensive model would necessarily incorporate the material properties of the tissue and cell biological parameters such as signaling networks or adhesive interactions. The goals of the current work were rather more modest. From a cursory inspection, it seems likely that the geometry of the lens (Figure 1) will impose strong constraints on the growth of the system. Here we formulate and mathematically validate a simple and testable model of lens growth rooted in the unique geometry of the tissue. The model relates the production and migration of cells in the epithelial layer to the rate of fiber cell deposition and the resulting radial growth of the lens. The model derives from our own recently published measurements of lens growth kinetics (Shi et al., 2015). One might conclude from its evident precision that lens growth is a deterministic process. Here, however, growth is modeled as a stochastic process. Numerical simulations obtained from the model are in good agreement with published data sets and provide insights into the subtleties of the growth process. Perhaps surprisingly, we show that a stochastic growth engine can deliver the smooth and reproducible growth necessary for the lens to fulfill its optical function. Furthermore, the precision of the growth process appears to derive at least in part from the singular geometry of the tissue.
MODEL FORMULATION
A listing of Model Variables and Parameter values is provided in Appendix A.
1. Basic Assumptions
Randomness
Over a given time period we cannot predict if a randomly selected epithelial cell will die, remain alive (and unchanged), or divide at least once. The main object of interest is thus a stochastic process (X(t): t ≥ 0), dependent on time t, where X(t) denotes the number of cells in the lens epithelium at time t. In principle, each X(t) is a random variable. Other stochastic processes are of interest; for example, (V(t): t ≥ 0), where V(t) denotes the volume of the lens at time t.
Time
The stochastic process could run continuously (i.e., t runs through non-negative real numbers) or discretely (, where denotes the set of natural numbers). Because the biological processes underlying lens growth are not instantaneous, we elect to use the discrete time parameter . The initial time is denoted as t = 0. We assume that the time that passes between consecutive values, t and t + 1, is a fixed interval, denoted by Δt > 0. The relatively slow time course of the growth process prevents us from considering that At tends to zero (Δt ↛ 0). We assume that observations are performed at time intervals ΔT and that (for example, we could take Δt = 1 day and ΔT = 1 week, i.e., ΔT/Δt = 7).
Shape
We assume that the lens has the shape of a regular, three-dimensional object with several axes of symmetry. The lines of division within the object are well defined. For example, the equatorial plane divides the lens sharply into anterior and posterior segments. Depending on the required precision, we choose the simplest geometric shape as an approximation of the actual shape of the lens. We assume that the shape of the lens does not change over time.
Surface Area
We assume that the anterior surface is covered by a monolayer of cells, the epithelium (Fig. 1B). Epithelial cells are irregular in shape (Bassnett, 2005) and separated by narrow gaps but we assume that cell packing is tight.
From the above assumptions the surface area of the epithelium is described via a stochastic process . If we denote the surface area covered by the ith cell as a(i), our assumptions lead to
| (1.1) |
The model would be unnecessarily complicated if we allow a different a(i) for each cell. Hence, we make the following assumption. Consider an epithelial cell located at a particular latitude. The latitude is given by an angle α, with 0 ≥ α ≥ π/2, to the equatorial plane; α = 0 means that the cell is at the equator, while α = π/2 means that the cell is located at the midpoint of the anterior surface. We assume that the surface area covered by cells with the same a remains the same. Hence, the surface area covered by epithelial cells is described via the family of stochastic processes . The simplest assumption would be that there is a constant α > 0 such that every random variable a(t; α) is identically equal to a. In fact, empirical measurements suggest that the surface area a(t; α) varies with time and position on the lens surface (Shi et al., 2015).
Lens Interior
The core of the lens contains fiber cells that differentiated before t = 0. We assume that this region remains unchanged and we do not consider its structure further. In some species, fiber cells become compacted (Kuszak and Costello, 2004) but we assume that, in the mouse lens, over the short time frame of our model, compaction does not occur.
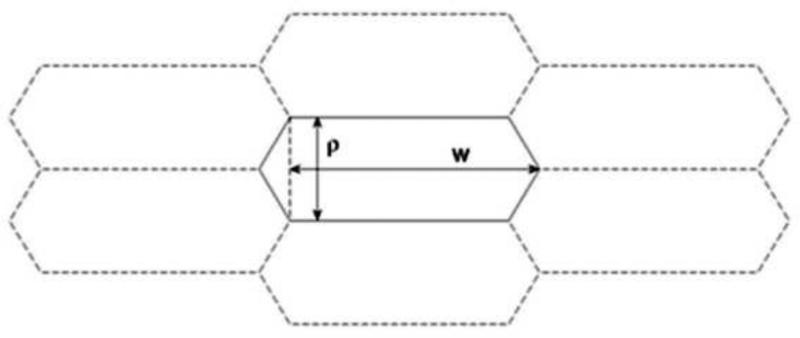
The lens cortex contains fully-elongated fiber cells. The intersection of a fiber cell with the equatorial plane is a flattened hexagon of more-or-less regular dimensions (see Fig. 1B). The long sides of the hexagon are oriented parallel to the lens surface. Following the intersection from the core toward the surface, the corresponding radius increases and occasional pentagonal intersections are observed. These constitute forking points in the columns of hexagonal cells (Kuszak et al., 2004). Here, we neglect the pentagonal intersections and consider simply the number of hexagonal cell cross-sections required to cover a circle of a given radius.
The superficial layers of the lens (constituting ≈ 10% of the radius) contain fiber cells that are actively elongating. These cells also have a hexagonal intersection with the equatorial plane. If we denote the surface area of the intersection of the lens with the equatorial plane by I(t), we will be interested in the change of this area, i.e., I(t + Δt) – I(t). This increment will be covered by the number, say XE∞(t), of hexagonal shapes of the form shown in Fig. 4.
Figure 4.
Cross sectional profiles of lens fiber cells (see Fig. 1B for orientation).
XE∞(t) denotes the number of cells leaving the epithelium and entering the fiber compartment (hence the notation E → ∞) in the interval [t, t + Δt]. Simple geometry shows that
| (1.2) |
From these assumptions we monitor the increment V(t + Δt) – V(t) of the 3-dimensional volume in terms of the 2-dimensional I(t + Δt) – I(t).
Cell Division and Death
For a given epithelial cell, Z is the number of offspring produced in the time interval [t, t + Δt] that are alive at the end of that interval. Hence, Z is a random variable with values in . We introduce the notation for corresponding probabilities as P(Z = k) = pk, where . If Δt is long enough to accommodate multiple rounds of cell division, then k = 0 may represent a cell that died without producing offspring within [t, t + Δt] or, alternatively, a cell that produced offspring, but all of them, including the original cell, died by t + Δt . Similar interpretations are possible for other values of k. As k increases, the process is difficult to follow. The distribution of Z depends, in principle, on time t and the cell itself. Because cell division is not instantaneous we make some simplifying assumptions. We assume that Δt is small enough so that the probability of dividing more than once within [t, t + Δt] is negligible. For practical purposes this means pk = 0, for k ≥ 3. The distribution of Z is given by
| (1.3) |
where p0 + p1 + p2 = 1. The following formulas give the expectation and the variance of Z
| (1.4) |
Under our assumptions, k = 2 implies that the cell divides once within [t, t + Δt] and at the end of the interval both daughter cells are alive. k = 1 means either that the cell survived through [t, t + Δt] or that it divided once and one of the daughter cells died. Pulse-chase experiments (such as shown in Fig. 3) suggest that the former is more likely. The likelihood of a cell dividing and both daughters dying independently within [t, t + Δt], is low. Hence, we interpret k = 0 as meaning that the cell died.
Independence
We assume that Δt is large enough so that were a cell were to divide at time t, the resulting daughter cells would be as competent to divide by t + Δt as any other cell of the same type (the notion of “type” being clarified later). If we denote various cells by x, y, z..., and corresponding offspring distributions for time periods [t, t + 1〉 by Zx,t, Zy,t, Zz,t,..., our assumption is that the family of random variables
| (1.5) |
is independent. The validity of this assumption is difficult to test directly but the spatial distribution of proliferating cells on the surface of the lens follows the expected Poisson distribution (see Appendix B) and is, therefore, consistent with the independence assumption. The above assumptions indicate that our main process will be a Markov process of a branching process type (Athreya and Ney, 2004; Kimmel and Axelrod, 2002).
2. Technical Assumptions
The lens consists of two unequal ellipsoidal segments (anterior and posterior). We are concerned with the number of epithelial cells rather than the intricacies of their packing. We, therefore, simplify our geometric (G) assumptions considerably.
(Gl) The lens is the shape of a ball.
There is a small numerical consequence to this assumption, since the mouse lens is actually an ellipsoid (see Fig. 2A). This will not change the essential behavior of our model.
An important consequence of (G1) is that the geometric aspects of the lens are described in terms of the stochastic process , where R(t) denotes the radius of the lens at time t. The initial size of the lens is determined empirically; more precisely, R(0) ≡ R > 0, where R is obtained empirically. R(t) is measured in μm. Hence, (G1) implies:
| (2.1) |
Δ(t) and I(t) are measured in μm2 and V(t) in μm3.
We turn next to the zonal organization of the epithelium (E) and assumptions concerning the distribution of dividing cells. Extrinsic factors play important roles in specifying the polarity, size and shape of the lens. For example, if the lens is surgically reversed in the eye, epithelial cells differentiate into fibers and equatorial epithelial cells repopulate the new anterior face, restoring polarity (Coulombre and Coulombre, 1963). Similarly, if a supernumerary lens is implanted, the growth of the lens pair is adjusted such that the new bipartite structure matches the size and shape of the original (Coulombre and Coulombre, 1969). These and other observations support the notion that the shape of the lens is not an autonomous property. Gradients of mitogens in the aqueous humor have been invoked to explain latitudinal variation in proliferative activity in the lens epithelium (McAvoy and Chamberlain, 1989). Although the molecular identities of the mitogens are currently unknown, we assume that they act within discrete zones associated with the lens surface. Based on our recent measurements (Shi et al., 2015), four such zones (CZ, PGZ, GZ and TZ) can be discerned (see also Fig. 2A). We assume that as the lens grows, the area of each zone increases proportionately.
(El) The epithelium is divided into four zones: Zone 1 = CZ, Zone 2 = PGZ, Zone 3 = GZ, and Zone 4 = TZ.
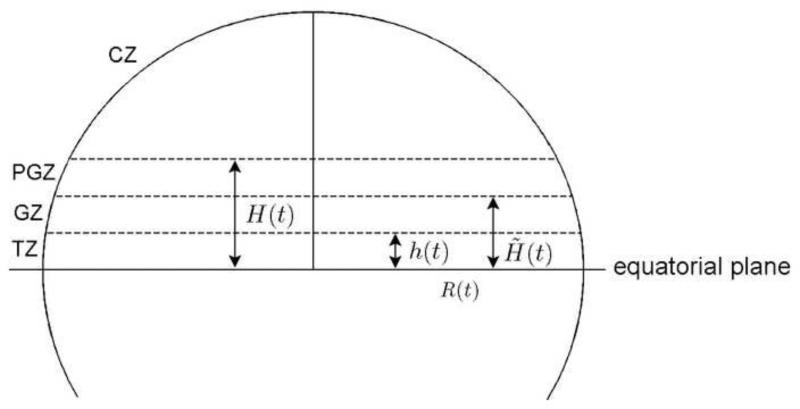
(E2) The TZ (or Zone 4) is the spherical zone between the equator and the height h(t) (see Fig. 5).
Figure 5.
Spherical zones in the lens.
(E3) The height is a stochastic process which is a fixed fraction of the radius, i.e., there exists a number 0 < η4 < 1 such that h(t) = η4R(t).
If we denote by A4(t) the surface area of the TZ, then we obtain
| (2.2) |
(E4) The GZ (or Zone 3) is a spherical zone between heights h(t) and H̃(t). The PGZ (or Zone 2) is a spherical zone between heights H̃(t) and H(t).
(E5) The height is a stochastic process which is a fixed fraction of the radius. The height is a stochastic process which is a fixed fraction of the radius.
There exist fractions η3 and η2 such that 0 < η4 + η3 + η2 < 1, η2, η3, η4 are all positive and determine the surface areas of corresponding zones. If we denote by A3 (t) the surface area of GZ and by A2(t) the surface area of PGZ, we obtain
| (2.3) |
(E6) The central zone (or Zone 1) is a spherical segment determined by height H(t).
Let us denote 1 – (η2+ η3 + η4) by η1. If we denote the surface area of the CZ by A1(t), we obtain
| (2.4) |
and ηl > 0,η2 > 0,η3 > 0,η4 > 0
| (2.5) |
We now turn to epithelial cell (C) assumptions.
(Cl) There are four types of epithelial cells. The “type” of a cell is determined by the identity of the zone in which it resides. Thus, Type 1 cells are located in Zone 1, etc. This assumption implies that were we to transfer a cell from Zone 1 to Zone 2, the transplanted cell would behave as a Zone 2 cell. An alternative view is that distinct and immutable cell types populate the various zones but we are not aware of any data that invalidate (C1).
(C2) The area of the lens surface covered by a cell depends on time and the type of cell.
Hence, if follows from (C1) and (C2) that random variables a(t, α) have a specific dependence on α, based only on the location within four zones. We follow four (in principle stochastic) processes , i = 1,2,3,4, where ai(t) is the surface area of the lens covered by a single cell at time t within Zone i. It is useful to count the number of cells within Zone i at time t; we denote it by X(t), i = 1,2,3,4. This gives us
| (2.6) |
and,
| (2.7) |
A consequence of the zonal structure of our model is that migratory cells change size instantaneously when they move from one zone to another. Clearly this is not realistic, although the change in cell size may sometimes be surprisingly abrupt at zonal boundaries (see Fig.2B). We considered allowing the cells to change size gradually, more closely resembling actual cell behavior. However, since our values are averages over the entire zone, the migratory numbers will not be affected significantly if cells undergo sudden transitions at zonal borders and this simplifies the calculations considerably.
Let us now consider branching assumptions (B).
(Bl) Type 1 cells and their offspring remain in the CZ (Zone 1).
Other cells are not precluded from entering the CZ. Based on Section 1 and (B1), it follows that (X1(t)) is a simple branching process with (possible) immigration.
(B2) Type 2 cells produce offspring that can, in any time period, stay within the PGZ (and remain Type 2 cells), move to the CZ (and become Type 1 cells), or move to GZ (and become Type 3 cells).
Lens growth will produce an increase in the area of the CZ. If, in response, individual CZ cells (which have a low proliferative capacity) are unable to increase their surface sufficiently quickly, then additional cells will be required to cover the expanding CZ surface. According to (B2), should additional cells be necessary, they will be recruited from among the offspring of PGZ cells. This process can be pictured as a shift in the position of the CZ/PGZ border, such that cells that were originally located within the PGZ become incorporated into the CZ. In terms of the process (X1(t)), (B2) implies that the immigration of that process will consist of offspring cells produced in the PGZ. It follows from (C1) and (B2) that a type change for a PGZ cell will occur solely based on its position within the epithelium (due to the overall growth of the epithelium, the relative position of the cell may, and in some cases will, change); similar argument holds for cells in other zones. As a consequence, for processes X_i (t),i=1,2,3,4, we therefore choose branching processes with immigration/emigration; rather than multitype branching processes.
(B3) Type 3 cells produce offspring cells, which can, at the end of a single time period, either stay within GZ (and remain Type 3 cells) or move to TZ (and become Type 4 cells).
Remark 2.8 The parameters could be arranged such that cells would move “backwards”, i.e., from the GZ into the PGZ (for example, PGZ could be made very narrow and GZ very wide). In (B3) we axiomatically disallow such behavior. The argument comes from empirical evidence (Shi et al., 2015) showing a relatively wide PGZ with modest proliferative activity and a somewhat narrower GZ with greater proliferative activity. This arrangement serves to “push” GZ cells toward the TZ and eventually out of the epithelium entirely, into the fiber cell compartment.
(B4) Type 4 cells do not proliferate. They either remain in TZ (remaining Type 4 cells) or leave the epithelium altogether, to become fiber cells.
We pause to summarize the branching properties implied by (B1)-(B4). During a single time period, there is a branching activity within CZ, PGZ, and GZ. There are three probability distributions, given by
| (2.9) |
that govern these processes; the branching in Zone i is governed by Zi, i = 1,2,3.
Remark 2.10 Previously, we analyzed what happens when modest proliferative activity is allowed in the CZ. Coupled with a growth of individual cells in CZ it implies the growth of the expectation function t↦E(X(t)). However, empirical measurements (Shi et al., 2015) suggest that the converse is true and, also, that there is no proliferative activity in CZ. Based on this realization, we add the following distribution (D) assumption: .
Cell death rates in the CZ are undetectably low (Shi et al., 2015). Consequently, as a practical estimate, we use . In future, we may obtain evidence that and are strictly positive (our model accepts such a possibility). At this stage, experimental data are consistent with (D1).
Regarding Z2 and Z3, we keep them general, although one would expect that and are large compared to , , , . Our evidence (Shi et al., 2015) also shows (and hence the assumption):
At this point we have a basic outline of the model. The process is a branching process with immigration (from PGZ) and offspring distribution
| (2.11) |
The initial number of cells in CZ is another parameter, . Hence X1(0) = N1.
The process is a branching process with emigration (into CZ and into GZ), offspring distribution Z2, and an initial value . The process is a branching process with both immigration (from PGZ) and emigration (into TZ), offspring distribution Z3, and initial value .
We also consider as a branching process with immigration (from GZ) and emigration (into the fiber cell compartment), where the initial value is and we have a degenerate case of the corresponding offspring distribution, i.e.,
| (2.12) |
Thus, our initial position is that we have X(0) = N = N1 + N2 + N3 + N4 epithelial cells, distributed into four corresponding zones. We can also describe what happens in a single time interval [t, t + Δt). The epithelial cells in CZ, PGZ, and GZ act independently and either die, persist, or multiply, each accordingly to its own type distribution Z1, Z2, Z3. We obtain random numbers of offspring cells, denoted by Oi(t), i = 1,2,3. The main growth engine is GZ, which produces a large number of new cells, some of which are “pushed” into the TZ, which, in turn, causes a number of TZ cells to enter the fiber cell compartment. These numbers are random, and we denote them by X34(t) = the number of cells that emigrate from GZ into TZ within [t, t + Δt), and XE∞(t) = the number of cells that emigrate from the epithelium into the fiber compartment within [t, t + Δt). Observe that a delicate balance must be maintained. The epithelial cells that differentiate into fiber cells cause lens volume to increase which, in turn, will increase the size of the epithelium. In particular, the size of CZ will increase, causing it to envelop parts of what used to be the PGZ, which we recognize as an emigration of a certain number of cells, denoted by X21(t), from PGZ into CZ. To maintain balance, PGZ produces enough cells to support its own growth and allow for some emigration, denoted by X23 (t), into GZ.
Another process that influences the outcome at the end of the time period [t, t + Δt) is the increase in area covered by individual cells. The growth processes , i = 1,2,3,4; describe the area of the surface covered by single epithelial cells of the corresponding type.
Remark 2.13. Measurements (Shi et al., 2015) suggest the following:
-
(i)
Moving from CZ to TZ, the area of individual cells decreases significantly (by a factor of two or three in a 4-week-old lens mouse lens);
-
(ii)
The surface area of individual cells is relatively stable within each zone (standard deviation of measurements does not exceed 10% of the value of the mean);
-
(iii)
Within a zone, the surface area of individual cells increases with time (for example, in the GZ the increase is approximately two-fold from postnatal week 4 to week 12).
We use the simplest assumption, that growth of individual cell area is linear and deterministic.
We propose the following growth assumptions.
(Grl) For every i = 1,2,3,4, the growth process of individual cell areas is linear in t.
We define a single constant a < 0, with respect to which other cells are measured. More precisely, there are constants
| (2.14) |
such that, for every i = 1,2,3,4,
| (2.15) |
Let us denote the linear function αit + βi by , where i = 1,2,3,4.
The following assumptions are based on Remark 2.13. They represent “state-of-the-art” based on the current literature.
(Gr2) We assume:
-
(i)
α2 > α1, α3 > α1;
-
(ii)
α2 > α4, α3 > α4
-
(iii)
β1 > β2 > β3 > β4;
We expect to test assumption (Gr2) in the future and modify it if necessary.
3. Model Construction
We will show that a model satisfying our assumptions can be constructed mathematically. The proof is algorithmic and can be implemented as a computer program and used for numerical simulations.
We start with a probability space together with a family of independent random variables , such that, for every ,
| (3.1) |
The existence of such a space follows from the Kolmogorov existence theorem.
We define processes inductively. Given N1, N2, N3, N4 we start with
| (3.2) |
For every , assuming that Xi(t), i = 1,2,3,4, are known, we define Xi(t + 1) via the following procedure. First, we define the total number of offspring cells produced within CZ, PGZ, and GZ. More precisely,
| (3.3) |
This is a standard branching mechanism based on offspring distributions Zl,Z2,Z3. To calculate the desired quantities, we introduce the following parameters
| (3.4) |
and
| (3.5) |
Using (3.3), (3.4), (3.5), we calculate the following technical quantities to simplify the notation. We define
| (3.6) |
and
| (3.7) |
Ci(t) describes the coupling between surface growth within the ith zone and interior growth of the lens. Similarly, Di(t) is the relative expansion rate of individual cells within the ith zone.
We use “the largest integer” function |·| to calculate:
| (3.8) |
| (3.9) |
| (3.10) |
| (3.11) |
Observe that XE∞(t) needs to be calculated first, since it appears in all other quantities. We complete the inductive step by
| (3.12) |
With this step our algorithm is described. It is straightforward to calculate other desired quantities; for example, the radius of the lens
| (3.13) |
If we can justify formulas (3.8)-(3.11), then the process will satisfy all requirements and can be simulated on the computer. The proof of (3.8)-(3.11) is a consequence of our “balancing requirements” and is a somewhat lengthy calculation. A quick sketch is provided from which the entire calculation can be reconstructed.
Let us denote the desired qualities as unknowns (suppressing for a moment the dependence on t):
Recall that
and, for i = 1,2,3,4,
We obtain four equations
i = 1,2,3,4 ; with four unknowns u, x,y, z. Dividing by , we obtain
i = 1,2,3,4 . Notice that, for i = 1,2,3,4,
| (3.14) |
which provides us with the system of equations
| (3.15) |
i = 1,2,3,4 . For i = 1 we have
| (3.16) |
and this obviously leads to (3.9). For i = 2 we have
which together with (3.16) leads to
| (3.17) |
For i = 3 we obtain in a similar way
| (3.18) |
and for i = 4, we obtain
| (3.19) |
Observe that (3.18) and (3.19) leads to (3.8), while (3.19) provides (3.11). By adjusting the right hand side of (3.17) with ±u(1 + C3(t) + C4(t)), we obtain (3.10). This concludes the proof.
4. Model Calculations
Our branching processes include emigrations and immigrations. Since in each time interval we have both, we apply recursive methods to calculate various quantities. Observe that values Ci(t) and Di(t), i = 1,2,3,4, which appear in our formulas, are deterministic.
We introduce the following notation for the expected values of our processes
| (4.1) |
Obviously
| (4.2) |
and
| (4.3) |
In order to calculate mi(t + 1) in terms of mi(t), we apply Wald's equation to obtain
| (4.4) |
Observe that we have the following formulas for (Zi):
| (4.5) |
| (4.6) |
| (4.7) |
| (4.8) |
| (4.9) |
Using (3.12) we then obtain
Hence, we obtain a general formula
| (4.10) |
for i = 1,2,3,4. It follows that
| (4.11) |
which has an intuitive interpretation, i.e., on average the new number of cells equals the average of all offspring cells minus the average of cells that left the epithelium.
5. Parameter Values
We begin our model with the 4-week-old mouse lens. By that age, the lens has its mature form and the four epithelial zones (CZ, PGZ, GZ and TZ) shown in Fig. 2A are well defined. We chose Δt = 1 day and the model runs for 60 iterations. Thus, by the end of our process the lens is about 12-weeks-old. By restricting the model to this particular phase of development, certain time-dependent parameters can be held constant.
The following parameter set includes all the ratios
| (5.1) |
(with η1+η2 + η3 + η4 = 1 and all ηi positive); they determine the relative sizes of our zones. Based on empirical observations we selected the following values
| (5.2) |
In selecting parameters that best describe the dimensions of individual fiber cells and epithelial cells we examined published data sets (Shi et al., 2009; Shi et al., 2015). Measurements for ρ average 9.67 μm and 1.87 μm for w. For our simulation we used the following values
| (5.3) |
In the 4-week-old mouse lens we estimated CZ cell size as close to
| (5.4) |
Based on our axioms/assumptions and direct comparison of cell sizes at 4, 8, and 12 weeks (Shi et al., 2015), the following parameters for linear growth were selected
| (5.5) |
The remaining parameters include the probabilities that describe the three offspring distributions Z1,Z2, and Z3, as well as initial values Ni, i = 1,2,3,4, of the corresponding processes (Xi(t)), i = 1,2,3,4. Regarding the initial values, we can determine, via actual measurements,
| (5.6) |
which provided us with A(0),V(0),I(0). Using (5.1) we obtain directly A1(0),A2(0),A3(0), and A4(0). Using (5.4) and (5.5), we then obtain estimates for N1, N2, N3, N4. Alternatively, we could estimate N1, N2, N3, N4 using the direct counting procedure (on particular samples), and then use (5.6) in order to estimate parameters α and β1,β2,β3,β4.
The most challenging task is to find estimates for the probabilities in Z1,Z2,Z3. We have little information about the probabilities of cell death, i.e., , , . In preliminary simulations we used ad hoc values, usually between 0 and 0.01. Finally, we opted for zeroes in all zones, consistent with recent empirical data (Shi et al., 2015). Regarding the probabilities of cell division, i.e., , , , we have systematic information (observe that the values of , , are determined when we decide on , , and , , ). Axiomatically, we state that , while our measurements suggest that is between 1% and 3%, and between 5% and 10%. Rates of cell division were determined from S-phase labeling experiments (Shi et al., 2015). Average values for each zone were multiplied by the factor of 23/12 (on the assumption that S-phase lasts 12 h (Rafferty and Smith, 1976), that the EdU labeling period was 1h, and our basic time increment is 1 day).
6. Simulations
A copy of the Matlab program used for the simulations is provided in Appendix C.
We performed computer simulations using the listed parameters. By varying ,, , we obtained a range of numerical results, but the general behavior of the model was consistent. In the simulations shown, the following specific values were used
These values provide results that are close to experimentally observed values (Shi et al., 2015). We used the following values for N1,N2,N3,N4:
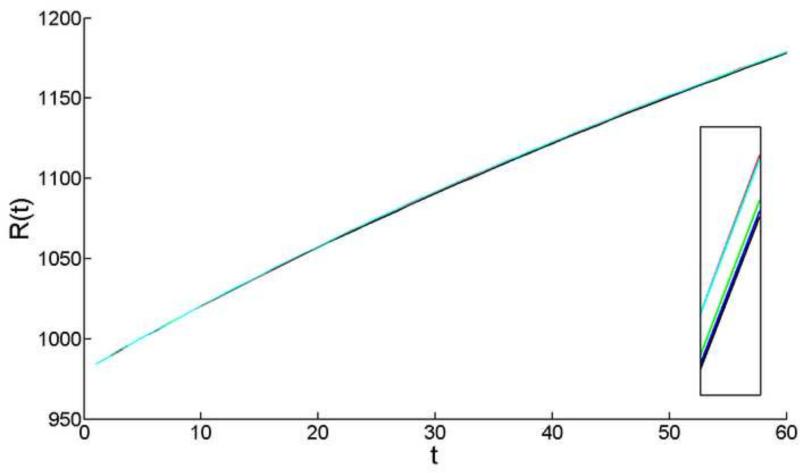
Over the eight week model interval the production of cells in the proliferative zones of the epithelium resulted in the deposition of fibers in the body of the lens and a smooth increase in lens radius (Fig. 6). Thus, the simulated lens grew. Over the course of the simulation, the radius increased approximately 20% (from 980 μm to 1175 μm). The growth function was concave, with the rate of growth slowing over the simulation period. For geometric reasons, diminishing rates of radial growth are expected, even if the rate at which fiber cells are deposited was constant. However, as shown below, the absolute rate of fiber cell formation also declined over the course of the simulation. Growth curves comparable to those shown in Fig. 6 are observed in living lenses across the same age range (Shi et al., 2012; Shi et al., 2015).
Figure 6.
Change in mouse lens radius modeled over the sixty-day interval between 4- and 12-weeks-of-age. Results of five independent model simulations are shown. Note that growth is smooth and that, even at the end of the 60-day period, fluctuations between runs are negligible. In the inset, the y-axis scale has been expanded so that individual simulation curves can be discriminated.
The underlying stochastic nature of cell proliferation within individual zones was not reflected in the overall growth of the lens which, as shown in Fig. 6, was surprisingly smooth. Even when the y-axis scaling was adjusted (inset Fig. 6) there was little evidence of stochastic noise in the growth curves. Similarly, the curves generated by five independent simulations were almost indistinguishable (Fig. 6), despite the fact that, at a cellular level, the behavior of the lens growth engine (cell proliferation in the PGZ and GZ) was stochastic.
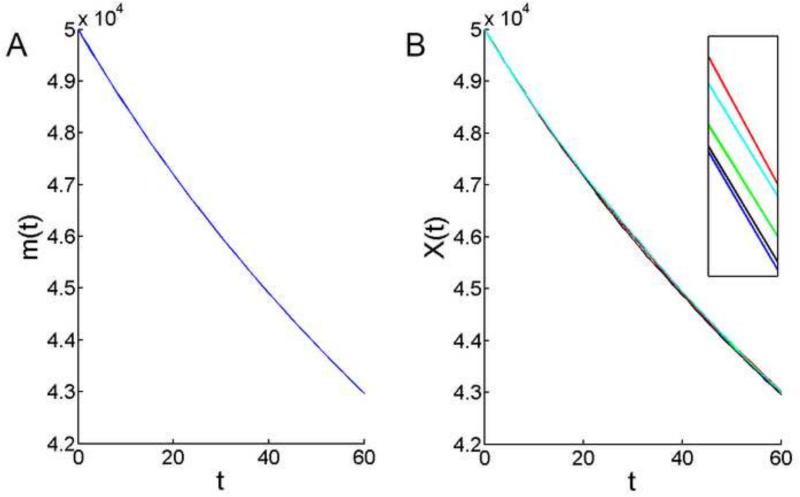
For a spherical lens, a 20% increase in radius (Fig. 6) will produce >40% increase in anterior surface area. Perhaps counter-intuitively, expansion of the surface area did not lead to an increase in the overall number of epithelial cells (Fig. 7). In fact, the total epithelial cell population X(t) declined markedly over the 8-week simulation, from an initial value of 50,000 cells to ≈ 43,000 cells (Fig. 7B). A census in living lenses has identified a decrease of similar magnitude in the epithelial cell population over a comparable time frame (Shi et al., 2015). A reduction in the number of epithelial cells implies that, in the aggregate, cells must stretch to cover the expanding surface if the integrity of the monolayer is to be preserved.
Figure 7.
Change in the total number of cells in the mouse lens epithelium, modeled over the sixty day period between 4- and 12-weeks-of-age. A. The theoretical mean based on (4.11). B. Results of five independent model simulations. Note the smooth decline in the epithelial cell population. The simulations lie close to the theoretical mean and the results of independent model runs are almost indistinguishable. In the inset, the y-axis scaling has been expanded so that the results of individual simulations can be discerned.
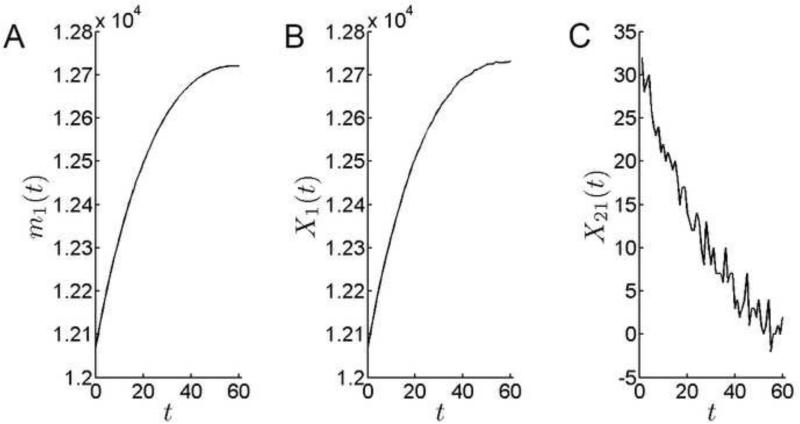
It is informative to examine how cell populations in the epithelial zones vary over time, comparing this to the aggregate behavior of cells in the monolayer. Recall that lens zones are modeled as proliferative fields that are associated with the anterior surface and assumed to expand in direct proportion to the growth of the lens. For the mitotically quiescent CZ cells, an increase in the area of the CZ cannot be accommodated by production of cells within the zone. Instead, the surface covered by individual cells must increase and/or cells must be recruited from the adjacent PGZ. The linear increase in surface area of individual cells suggested by empirical measurements, and used here as a model parameter, was insufficient to support the rapid initial expansion of the CZ. This necessitated the immigration of cells from the PGZ into the CZ (alternatively, this can be visualized as a shift in the border between the two zones, such that cells that originally resided in the PGZ became incorporated into the expanded CZ). The modest influx of cells increased the CZ population by approximately 600 cells over the course of the simulation (Fig. 8). Most of this increase occurred early in the simulation period and, after about 40 days, the CZ population stabilized at ≈ 12,750 cells. X21(t), the number of cells per day emigrating from the PGZ into the GZ, fell from 30 cells per day at the start of the simulation to near zero values by day 60 (Fig. 8C).
Figure 8.
Cell population dynamics in the CZ. A. The theoretical mean of the number of cells in CZ. The number of cells in the CZ increases over time. B. Simulation results for the number of cells in CZ. C. The rate at which cells emigrate from the PGZ into the CZ shows marked stochastic fluctuations but, in general, declines over the model period.
Unlike the CZ, which showed a modest (≈5%) increase in cell population (Figs. 8A and B), the populations of the other three zones declined significantly over the 8-week model interval. At the beginning of the simulation, the combined populations of the PGZ, GZ and TZ accounted for >75% of the total number of epithelial cells. Population declines in these zones, therefore, collectively outweighed the small increase in CZ population and accounted for the marked reduction observed in overall cell number X(t) (Fig. 7B).
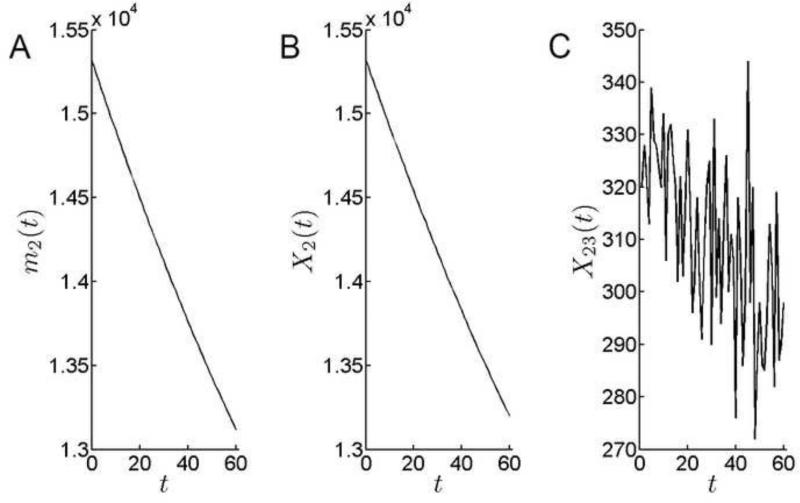
Cell production in PGZ is required to support its own expansion, while at the same time (potentially) supplying cells to the adjacent zones (CZ and GZ). The number of cells in the PGZ fell by 14% (from 15,400 to 13,200 cells) over the course of the simulation (Fig. 9). At ≈300 cells per day, the daily emigration rate from the PGZ into the GZ, X23(t), was more than 10-fold higher than into the CZ, although emigration into the GZ declined by about 10% over the model time interval.
Figure 9.
Cell population dynamics in the PGZ. A. The theoretical mean of the number of cells in PGZ. The number of cells in the PGZ decreases over time. B. Simulation results for the number of cells in PGZ. C. The rate of emigration from the PGZ into the GZ shows large stochastic fluctuations but, overall, declines slightly during the 60-day simulation period.
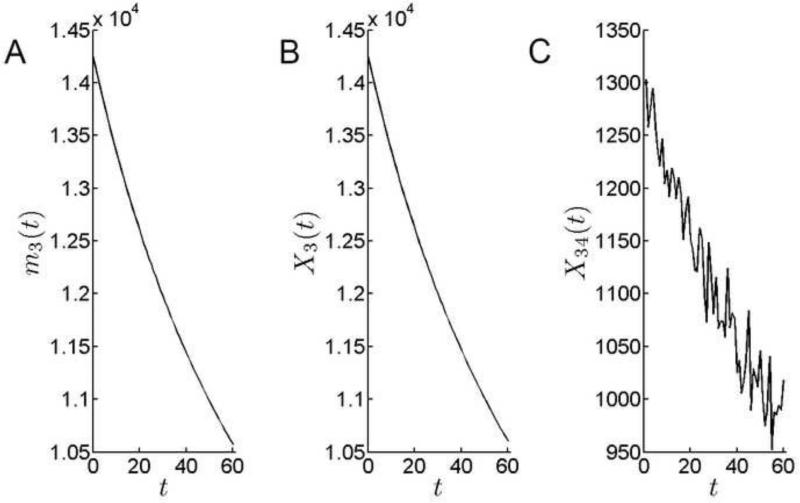
At 14,250, the number of cells in the GZ was comparable to the PGZ population at the beginning of the simulation. However, there was a >25% decrease in the GZ cell population over the model run (Fig.10). This was the largest fractional decline for any zone. Depletion of the GZ cell population has a disproportionate impact on lens growth because this region, with its relatively large cell population and high intrinsic rate of mitosis, constitutes the principal growth engine of the lens.
Figure 10.
Cell population dynamics in the GZ. A. The theoretical mean of the number of cells in GZ. The number of cells in the GZ declines sharply over time. B. Simulation results for the number of cells in GZ. C. Emigration from the GZ, X34(t), declines =30% over the course of the simulation.
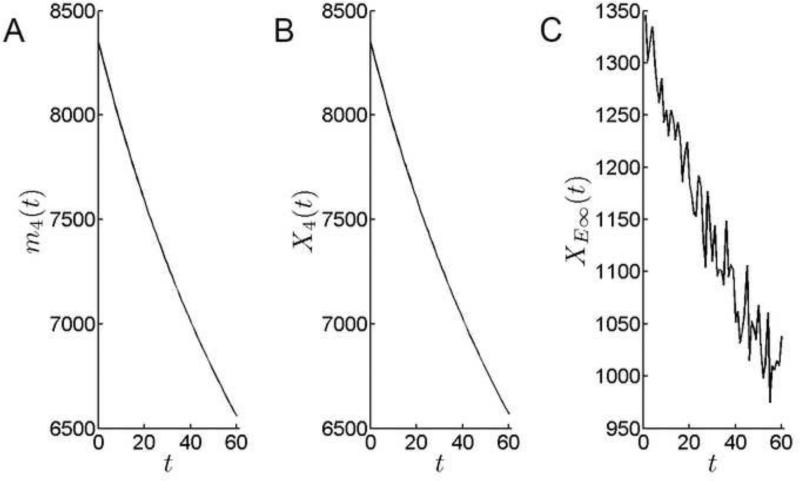
The TZ is a ≈10 cell-wide, post-mitotic cell population at the margin of the epithelium. The cellular influx into the TZ reflects the combined proliferative activity of more anterior zones. The output of the TZ, XE∞(t), is equal to the rate of fiber cell production. Over the course of the simulation, fiber cell production fell from approximately 1300 cells per day to <1000 cells per day (Fig. 11). Together with geometric constraints, the diminished rate of cells transiting the TZ is responsible for the slowing in the radial growth rate observed over the model interval (Fig. 6).
Figure 11.
Cell population dynamics in the TZ. A. The theoretical mean of the number of cells in TZ. The number of cells in the TZ declines over the simulation period. B. Simulation results for the number of cells in TZ. C. The rate at which cells emigrate from the TZ into the fiber compartment falls over the simulation period.
The small difference between the input and the output of the TZ (compare Figs. 10C and 11C) is due to the additional loss of cells from the TZ caused by expansion in the surface area of individual cells.
We have explored the effect on lens growth and epithelial cell number of adjusting various parametric values. The additional simulations are provided in Appendix D and, in each case, contrasted with the results (summarized in Figs. 6-11) obtained using parameters (summarized in Appendix A) derived from empirical measurements. Increasing the proportion of the lens surface covered by the CZ at the expense of the GZ and PGZ regions inhibited lens growth (Appendix D). Increasing the proliferative rates in the GZ (D2) or the PGZ (D3) had no effect on growth kinetics, providing that the difference between the birth and death rates in each zone was held constant. Not unexpectedly, lens growth was very sensitive to changes in the cross-sectional area of individual fiber cells (D4, D5). Larger fibers resulted in a bigger lens with more epithelial cells while smaller fibers had the opposite effect. Elevated proliferative rates in the GZ (D6, D8) or PGZ (D7, D9) resulted in larger lenses with increased epithelial cell populations. We also examined the effect of modulating cell stretching behavior. When the surface area of individual cells located in all zones was held constant (ie. cells were prevented from stretching), the number of cells in the epithelium increased rapidly (D10) but, surprisingly, the radial growth was similar to that observed using the original parameter set. In that case however, the growth rate increased during the model run in contrast to the declining rates (Fig. 6) observed with the original parameters. Similarly, when the cell stretching rate was doubled at all locations (D11) or in the CZ only (D12) there was a marked decrease in epithelial cell population, but a relatively modest effect on lens radial growth.
7. Model Analysis and Implications
It has long been recognized that, unlike most tissues, the lens grows throughout life (Smith, 1883). However, the cellular dynamics underpinning lens growth are unclear. Here we modeled growth as a stochastic process driven by cell proliferation in the mitotically active PGZ and GZ regions of the epithelium. Our model captured both the concave growth function and the asymptotic decrease in epithelial cell population, two key features observed in vivo (Shi et al., 2015). Somewhat surprisingly, the simulated growth curves were smooth. Moreover, the results of independent model runs were almost indistinguishable (Fig. 6). Recall that the growth-of-radius function was not specified directly (following instead a course that depended entirely on the model run) and that the radius process was stochastic. Nevertheless, for practical purposes, radial growth was as precise as any imaginable deterministic process. Acting together, two effects served to minimize the stochastic fluctuations inherent in the growth model: 1. the relatively large (104) size of the epithelial cell population and 2. the zonal organization of the epithelium. With regard to the former, the law of large numbers suggests that as the epithelial cell population increases, its aggregate behavior will approach the theoretical mean. There is clear evidence of this in our model; where, in all cases, the simulated values were close to the theoretical means (compare for example Fig. 7A and 7B). However, the zonal organization of the epithelium also appears to play an important and independent role. The zonal effect is a consequence of the spatial arrangement of the various zones. Because the mitotically active zones (GZ and PGZ) are flanked by quiescent areas (CZ and TZ), supernumerary cells produced by stochastic behavior in the proliferative regions can spill into neighboring non-proliferative zones and become inactivated. This prevents the formation of destabilizing positive feedback loops. Using a simplified version of our model (containing a proliferative zone bordered by a single quiescent zone), we have calculated the relative contributions of population size and zonal organization (see Appendix E) to minimization of the variance. This calculation suggests that zonal organization causes a reduction in variance beyond that attributable simply to the large epithelial cell population. In the context to 104 cells, the zonal effect is responsible for an additional three-fold reduction in variance. Proportionately, the zonal effect will be even more significant at earlier time points (for example, during embryonic development) when the epithelial population will naturally be smaller.
The stochastic nature of the growth process may have other advantages. Suppose, for example, that not all cells successfully complete mitosis. If the failure rate were 1/10, the probability of a malfunction occurring simultaneously in n cells on any given day is 10-n. The model implies that even if a relatively large number of cells (eg. 20 cells) failed simultaneously, the effect on the system would be negligible, while the probability of such an event is, for practical purposes, indistinguishable from zero (10−20). Thus, a stochastic growth engine is likely to be robust with respect to component failure.
The growth-of-radius function is a stochastic process whose trajectories are increasing and concave. In contrast, the stochastic process , which counts the epithelial cells, exhibits decreasing and convex trajectories. For these phenomena to occur simultaneously, the surface area covered by individual cells must increase, the lens growth rate must decrease, and the epithelial cell population must approach a limiting value. To understand why this should be so, it is necessary to consider the overall growth behavior and the interplay between proliferative zones.
In the future we expect to extend the model to different time periods, as well as to different species (with the ultimate goal of modeling the human lens). It is important, therefore, to fully understand the parameter relationships that the model can tolerate when required to behave as observed in nature. We start with the number of cells in the epithelium and its various zones.
Zonal Properties: the Number of Epithelial Cells
If the area of the lens capsule covered by an individual epithelial cell remained constant, the number of epithelial cells would increase with time, paralleling the expansion of the anterior lens surface. However, empirical data (Shi et al., 2015) indicate that, overall, the epithelial cell population declines with time. Our model suggests that the decline in epithelial cell numbers reflects the redistribution of cells between zones. With time there is an increase in the proportion and absolute number of cells located in the CZ. We can examine the necessary conditions for this to occur. Formula (4.11) shows the population of the entire epithelium while (4.10) follows the population in each zone. Employing formula (4.10) and the parameter values used in the simulations (i = 1 and C1(t) ≈ 0.064 and D1(t) ≈ 0.005), we obtain
which shows that in Zone 1 m1(t + 1) > m1(t), i.e., the number of cells in the CZ increases with time. The increase is not robust with respect to some parameters, however. For example, if the expansion rate of the CZ cells were to double (e.g. from 1/200 to 2/200), then the population of this zone would actually decrease.
In the other zones the situation is different. Again, using (4.10) and Di(t) > 0, for i = 2,3,4, we obtain
for i = 2,3,4. Hence, for every i = 2,3,4, mi(t + 1) < mi(t) is equivalent to
| (7.1) |
In order to analyze (7.1) observe that
| (7.2) |
in particular Ci(t)/Di(t) does not depend on t.
Since for our values of parameters we obtain
| (7.3) |
and E[XE∞(t)] does not exceed 1500 for t = 0, and similar estimates hold for other values of t (say for t = 30, E[XE∞(t)] does not exceed 1200), it is easy to see that (7.1) holds for i = 2,3,4 . Therefore, for any choice of parameter values compatible with empirical measurements (Shi et al., 2015) we have
From these formulae we infer that condition (7.1) is more robust with respect to changes of the corresponding parameter values than was the case for CZ. It also shows that, whereas the population increase in the CZ could be reversed by a modest change in the cell expansion parameter, the decline in the PGZ, GZ and TZ populations over time is more difficult to reverse.
Let us examine the conditions under which the aggregate behavior of populations within the various zones recapitulates the population decline observed in vivo.
Using (4.11) we obtain
| (7.4) |
It follows that m(t + 1) < m(t) if and only if
| (7.5) |
Condition (7.5) is both necessary and sufficient for the overall population of the epithelium to decrease. The condition contains almost all of the parameters, making a thorough analysis somewhat complicated. However, the condition can be simplified considerably. Since empirical data suggest that the death rates in the CZ, PGZ and GZ are close to zero, we can focus on the birth rates in the PGZ and GZ. Intuitively, one would expect that the decrease in the overall number of cells is unlikely to hold if birth rates become very high. We can simplify the analysis of (7.5) in order to obtain the upper bounds for the sum of the birth rates. For our choice of parameters, the following decreasing functions have the indicated range of values
and these inequalities imply that the right hand side of (7.5) is positive as long as the birth rate in the PGZ is smaller than 1/30 (our choice of parameter value was 1/50). Hence, under these conditions (7.5) holds as long as its left hand side is a negative number. Unfortunately, even for a realistic choice of birth rate in the GZ the left hand side of (7.5) could be a positive number. If this happens, since m3(t) ≤ m2(t) (within any reasonable choice of parameters), it is not difficult to see that the following condition implies (7.5)
| (7.6) |
For all choices of parameter values compatible with empirical data (Shi et al., 2015) (7.6) is true, i.e., we will have a decrease in the average number of epithelial cells. Notice that (7.6) is much simpler than (7.5), provides the upper bound to the sum of birth rates in PGZ and GZ, and the upper bound is given in terms of the elements of the individual growth rates of the epithelial cells.
Remark 7.7. Our model works such that the epithelium drives lens growth by dispatching cells into the fiber compartment (thereby increasing lens volume). At the same time, the number of epithelial cells decreases so, to compensate for the volume-driven increase in surface area, the epithelial cells stretch. Observe that this has another interesting implication. Since the number of epithelial cells decreases, in the next step we can expect a slightly smaller increase in the size of the lens. Therefore, although the lens will grow continuously, the growth rate will slow down. Our model accounts for this slowing of the growth engine. Note that the slow-down in growth is in part due to cell stretching and, therefore, cannot continue indefinitely. There is an indication in the current data that, towards the end of our observed period, a new, asymptotic, growth phase is beginning (see Fig. 8A, B). Furthermore, the analysis of the theoretical condition (7.5) necessary and sufficient for the number of epithelial cells to decrease on average shows that toward the end of our observed period this decrease slows down. Recall that cells in CZ are the most stretched, and are the first (time-wise) to reach a particular level of stretched area.
Zonal Properties: Immigration and Emigration
Lens growth is characterized by the migration of epithelial cells between proliferative zones (see Fig.3). Here we identify the conditions necessary and sufficient to preserve the observed patterns of immigration and emigration. We expect
were any of these not to be fulfilled, some degree of lens pathology would result. This could range from the physiologically plausible (e.g., a slowing of lens growth) to the biologically infeasible (dedifferentiation of fibers into epithelial cells). Unlike the borders between other cell compartments, the border between the PGZ and the GZ separates two mitotically active cell populations. While the expectation in the model is that
| (7.8) |
in principle, the lens could grow even if the inequality in (7.8) were reversed. This might happen if, for example, there was a high death rate in the CZ . To analyze the parameter range over which the migratory behavior of the cells is supported we developed the following condition
| (7.9) |
Since D2(t) > 0 and for any reasonable choice of model we need (otherwise the PGZ would eventually disappear), it is obvious that (7.9) is fulfilled if is (practically) zero. If , then (7.9) is still required. Observe that the ratio between the number of cells in CZ and the number of cells in PGZ is highest when, for some t, α1(t) ≈ α2(t). In such a case we would have
Assuming that , which is realistic (there are no data suggesting significant levels of cell death in the PGZ), it would be sufficient to have
| (7.10) |
in order to get (7.9). For example, if then (7.10) requires the birth rate in the PGZ to be greater than the death rate in the CZ, suggesting that (7.9) is a realistic condition. This brief analysis shows that condition (7.9) will hold under a wide range of parameters. Although (7.9) contains parameters pertaining to CZ and PGZ only, it plays a role in migratory behavior involving all zones. Condition (7.9) also suggests a role for CZ cell death and this will be explored in detail later. Let us examine each individual zone.
Central Zone
We expect a modest flow of cells from the PGZ into the CZ because the rate of increase in the CZ surface (which reflects the rate of increase of the entire lens) is faster than the CZ cell stretching rate. There are not enough cells within the CZ to cover its expanded surface. As a result, the border between the CZ and PGZ moves into the former PGZ, in the process converting some PGZ cells into CZ cells; that number being equal to X21(t). Let us describe the constraints on parameter values necessary to ensure that cells flow from the PGZ into the CZ.
Theorem 7.11. If , , and , then
.
Proof. Using (4.6) and (4.7) we obtain
Since we know that Ci(t) > 0, Di(t) ≥ 0 for all i = 1,2,3,4, it follows that E[X21(t)] > 0 .
We can always expect conditions and to be fulfilled; otherwise PGZ and GZ would eventually disappear. The last condition is likely to hold when the cells in CZ stop increasing in size (empirical measurements suggest that this happens at later time points). For the stage modeled here we look into the case (notice that this also implies (7.9)). We obtain in this case that E[X21(t)] > 0 is equivalent to
For our parameter values the inequality is satisfied, but toward the end of our time period the difference is small. This is a consequence of the slowing of lens growth and, therefore, of the CZ growth rate. By the end of the time period the growth rates closely matches the stretching rate of cells within CZ. Observe also that if (7.9) holds, then E[X21(t)] > 0 holds irrespective of whether the death rate in CZ is equal to zero or not.
We can only speculate as to why it might be advantageous for cells to flow into rather than out of the CZ (recall that for the other zones the flow is in the opposite direction, i.e. toward the lens equator). The CZ is located in the pupil space and subject to lifelong light exposure, whereas, the other zones are located in the shadow of the iris. Exposure of CZ cells to UV light has been shown to result in potentially mutagenic DNA damage (Mesa and Bassnett, 2013). If somatic mutations indeed accrue in the CZ, the number of mutant cells would be amplified during transit through the mitotically active PGZ and GZ regions. Eventually a group of mutant fiber cells (all descended from an original mutant CZ cell) would be incorporated into the fiber cell mass. If the mutation was in a gene necessary for fiber cell transparency (Shiels et al., 2010), a cuneiform opacity could result. By ensuring that immigration rather than emigration occurs in the CZ, cataractogenic mutations would be safely corralled in the polar epithelium.
Death rate in the Central Zone
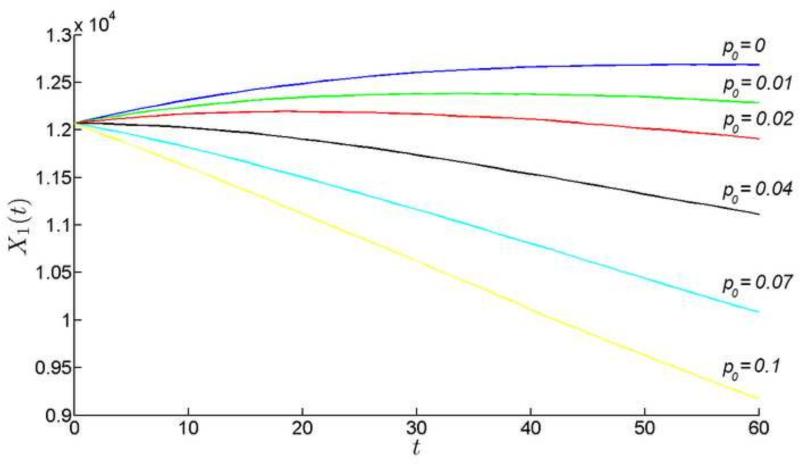
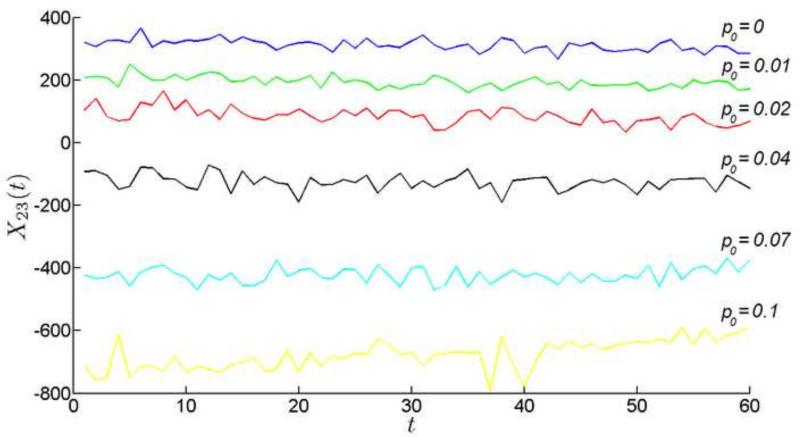
Our model suggests that lens growth might be particularly sensitive to the rate of cell death in the CZ. Let us observe what happens, if other parameters are fixed and only is allowed to vary. Recall that when , the cell population in CZ increases before stabilizing at later time points (Fig. 8). As the cell death rate is increased modestly (say to 1%), the initial population increase is preserved but, at later time points, the population declines (Fig. 12). At moderate cell deaths rates (>4%) the population declines from the start of the simulation. Cell death in the CZ has a ripple effect throughout the epithelium, as cells that were earmarked to fuel lens growth become redirected to supplement the depleted CZ population. To observe this phenomenon directly, we can monitor, for example, the flow of cells from the PGZ into the GZ (Fig. 13). Normally, the PGZ provides the GZ with ≈350 cells per day. However, as cell death rates are increased in the CZ, the PGZ-to-GZ flow is decreased. At cell death rates between 2% and 4%, the flow of cells reverses direction (ie., from the GZ into the PGZ). Thus, at moderate cell death rates, the entire cellular output of the PGZ is insufficient to offset the loss of cells in the CZ and additional cells must be recruited from the GZ to meet the difference.
Figure 12.
The number of cells in CZ during the observation period as a function of CZ cell death rate (p_0).
Figure 13.
The flow of cells from PGZ to GZ with respect to the change of death rate in CZ.
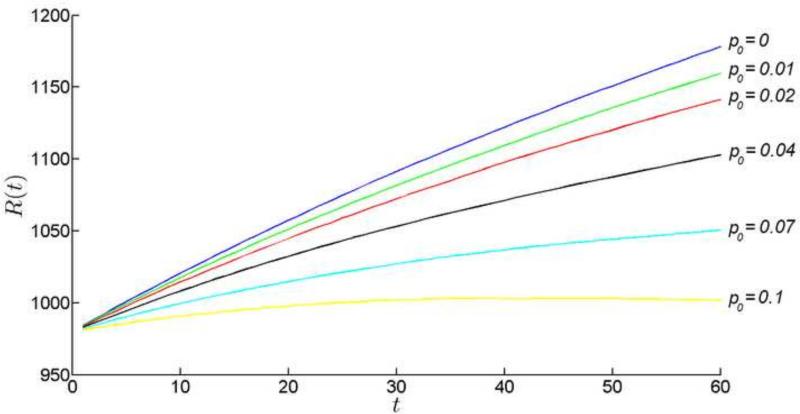
The lens continues to grow (Fig. 14), in spite of the diminished or even reversed cellular flows in the PGZ. Radial growth continues because the robust production of cells in the GZ compensates for cell losses in the CZ. However, the rate of radial lens growth is sensitive to CZ cell death rates. Even at 1% cell death, lens growth is significantly impaired. Our model does not include an optical module, but it is clear that even small changes in lens radius would have significant effects on the focal length of the lens. Thus, minor perturbations in the CZ death rate would directly impact lens optical performance leading to myopia. At higher cell death rates, growth is further inhibited and, at the extremes (>10% cell death rate), the lens begins to shrink because fiber cells are recalled into the epithelium. The latter is biologically unrealistic (fiber cells cannot dedifferentiate into epithelial cells) but we could envisage other forms of frank pathology (such as the appearance of gaps between cells) as the monolayer was systematically depleted of cells. Thus, our model suggests that the lens would not well tolerate significant levels of cell death in the central epithelium. We can only speculate whether this is the explanation for the apparent absence of CZ cell death observed in vivo (Shi et al., 2015). In any case, the simulations illustrate the delicate balance between cell production and ultimate cell fate that must be preserved if radial growth is to be regulated with precision.
Figure 14.
The growth of the radius of the lens for various values of cell death rate in CZ.
Transition Zone
We skip the PGZ and GZ for the moment, since other immigration and emigration processes are expressed in terms of XE∞(t). The biological nature of the process is such that XE∞(t) has to be positive (cells cannot flow backwards from the fiber compartment into the epithelium). Let us establish the necessary and sufficient conditions (in terms of parameter values) for XE∞(t) to be positive in the mean.
Lemma 7.12. E[XE∞(t)] > 0 if and only if
| (7.13) |
Proof. Directly from (4.6).
Condition (7.13) is rather complicated. Instead, let us present a sufficient condition that is easier to analyze. We have already discussed condition (7.9), which appears in many of our estimates of various parametric conditions. In the case of , condition (7.13) is fulfilled as long as the birth rates in the PGZ and the GZ exceed the death rates.
Theorem 7.14. If and (7.9) is valid, then
.
Proof. The claim follows from Lm. 7.12., since (7.9) and imply (7.13).
Pre-germinative Zone and Germinative Zone
The PGZ and GZ are crucial for lens growth, each having a specific role in the process. The GZ is the principal growth engine, producing by far the greatest number of new cells (on average ≈ 800 cells every day, compared to ≈ 250 by the PGZ). Note however, that for both GZ and PGZ the number of cells leaving the zone (1100 cells per day and 350 cells per day, respectively) exceeds the number of cells produced. This, in combination with the stretching of individual cells acts to slow the “growth engine” and reduce the number of cells in the epithelium.
Let us describe the necessary and sufficient conditions for the two flows of cells to hold on average. Simple calculation proves the following.
Lemma 7.15. (i) E[X23(t)] > 0 if and only if
| (7.16) |
(ii)E[X34(t)] > 0 if and only if
| (7.17) |
Observe that again (7.9) and are necessary for (7.16) and (7.17) to have a reasonable chance to be valid. In the case of (7.17) the numbers are such that for practical purposes (7.9) and are also sufficient. Our estimates show that for all reasonable choices we will have
which implies . Since D3(t)m3(t) > D4(t)m4(t), it follows that (7.9) and imply (7.17).
We conclude this section with the analysis of the parametric conditions required to satisfy the remaining migratory property (flow of cells between PGZ and GZ), i.e., the analysis of (7.16). When we choose realistic parameter values, the following estimate holds
| (7.18) |
Since 4D2(t)m2(t) ≥ D3(t)m3(t) and D2(t)m2(t) ≥ D4(t)m4(t), it is easy to see that (7.9) and , together with (7.18), would imply (7.16) as long as
| (7.19) |
The condition (7.19) is close to our measurements, which show to be somewhere around up to . For the parameter values we used in simulations .
It is only recently that the PGZ has been recognized as a distinct proliferative region and earlier versions of our model included only three zones (CZ, GZ, and TZ). However, with only three zones it proved difficult to control the border between the mitotically quiescent CZ and the volatile and stochastic GZ. The interposition of a moderate zone (PGZ) between the CZ and the GZ served to stabilize the border. Note also that the PGZ serves as a “watershed” for two distinct cellular fates. Some of the cells produced by the PGZ (≈ 20 cells per day on average) flow “north” to maintain the strict border of the CZ (without which flow the border would fluctuate in a random fashion), while the remainder (≈ 300 cells per day) flows “south” into the GZ, helping that zone maintain enough cells for the next stage of production. Within the PGZ, therefore, there exists a virtual dividing line separating cells that may ultimately become fibers from cells that will not. As discussed above, this cellular watershed may have implications for the development, later in life, of cortical cataracts.
8. Concluding Remarks
The lens has an unusual ontogeny, arising from an invagination of the embryonic head ectoderm (Cvekl and Ashery-Padan, 2014). As a result, the apical surface of the epithelial cells faces inwards. Consequently, unlike other ectodermally-derived tissues (such as skin), terminally differentiated lens fiber cells are not sloughed from the surface of the tissue but are instead deposited in the lens interior. Lens growth is, thus, strongly influenced by simple surface to volume relationships, because proliferation in the surface layer indirectly causes its own expansion by increasing the volume of the underling cell mass.
The growth of the living lens is modulated throughout life so that its optical power is appropriate for the axial length of the eye (Iribarren, 2015), but how exactly is growth regulated? Our model cannot answer this question directly, but may be helpful in identifying nodes in the growth algorithm that could be subject to regulation. Modest changes in any such parameters are expected to have significant impacts on growth. Some control nodes are obvious. Adjusting the mitotic index in the GZ and/or PGZ, for example, will directly affect the growth rate. Empirical measurements in animal models (Shi et al., 2015; Shui and Beebe, 2008) suggest that the index declines with time, presumably contributing directly to the slowed lens growth observed later in life. Numerical simulations suggest that small changes in cell death rate (especially in the CZ) would be similarly effective (see Fig. 14), a notion supported by the microphthalmic phenotypes of several lines of transgenic/knockout mice that exhibit elevated levels of epithelial cell death (Hettmann et al., 2000; Pontoriero et al., 2009; Xi et al., 2003). A less obvious mechanism concerns the footprint of individual cells on the lens capsule. Lens growth is most strongly influenced by cell production in the GZ which, in turn, is determined by the size of the GZ population. Smaller, more densely packed cells will maximize the GZ population and result in enhanced rates of radial growth. During the time window modeled here, expansion in the area of individual GZ cells served as a powerful governor, constraining the lens growth engine. If GZ cell spreading had not occurred during this period, lens growth would have accelerated with time rather than slowed. Empirical data (Shi et al., 2015) indicate that GZ cell expansion does not continue indefinitely, suggesting that at later stages in the lifespan a new mode of growth must emerge.
Evidence from both human and animal studies suggests that the well-ordered lens growth process may sometimes be disturbed. Microspherophakia (a small, overly-spherical lens), for example, is a feature of Marfan syndrome (Maumenee, 1981) and Weill-Marchesani syndrome (Faivre et al., 2003). Non-syndromic microspherophakia has also been described (Kumar et al., 2010). Likewise, knockout of genes such as Epha2 result in a small lens phenotype (Shi et al., 2012). The availability of biological models should allow us to determine which of the potential regulatory nodes are utilized in vivo. In this regard, a promising model system may be the connexin50 knockout mouse, in which the lens is approximately half the normal size (Rong et al., 2002; White, 2002). Our growth model, in conjunction with a cell biological analysis of Cx50-null lenses, may thus help define the specific growth defects that underlie microspherophakia.
In the current study, we modeled mouse lens growth over a relatively short time frame (the period between 4-and 12 weeks-of-age). This enabled us to hold certain time-dependent parameters constant. However, it is clear that lens growth kinetics vary significantly during development and aging. We are currently modeling the explosive growth of the embryonic lens and the slow, asymptotic behavior of the aged lens. Fusion of such models should allow the quantitative analysis of lens growth across the lifespan. The same general approach should be applicable to the human lens, which has a similar cellular architecture to the mouse lens. This will be a challenging endeavor, however; because the human lens contains 102-103-fold more cells than the mouse. In humans, dysregulated lens growth is potentially linked to a number of pathological states. It has been suggested, for example, that lens growth may contribute to the development of presbyopia, the age-related loss of accommodative ability (Strenk et al., 2005). Epidemiological studies have also identified lens size as a significant independent risk factor for cataract formation. Large lenses are prone to nuclear cataract; small lenses to cortical cataract (Klein et al., 1998, 2000). Thus, a deeper understanding of the processes that regulate growth of the human lens may provide insights into mechanisms underlying the physiological optics of the normal eye and pathological processes implicated in aging or disease.
Supplementary Material
Highlights.
A stochastic model of lens growth is presented Lens cell division is determined by proliferative fields associated with the lens surface Numerical simulations are in accordance with empirical data sets Surface areas of individual cells constrain the proliferative population and limit lens growth rate. Precise and reproducible radial growth can be generated using a stochastic growth engine.
ACKNOWLEDGEMENTS
Supported by National Institutes of Health Grant R01 EY09852 and R01 EY024607 (SB), Core Grant for Vision Research P30EY02687, and an unrestricted grant to the Department of Ophthalmology and Visual Sciences from Research to Prevent Blindness. This research was supported by a Marie Curie International Outgoing Fellowship within the 7 th European Community Framework Programme, FP7-PEOPLE-2013-IOF-622890-MoLeGro. This work has been supported in part by Croatian Science Foundation under the project 3526.
Footnotes
Publisher's Disclaimer: This is a PDF file of an unedited manuscript that has been accepted for publication. As a service to our customers we are providing this early version of the manuscript. The manuscript will undergo copyediting, typesetting, and review of the resulting proof before it is published in its final citable form. Please note that during the production process errors may be discovered which could affect the content, and all legal disclaimers that apply to the journal pertain.
REFERENCES
- Athreya KB, Ney PE. Branching Processes. Springer-Verlag; New York: 2004. [Google Scholar]
- Augusteyn RC. On the growth and internal structure of the human lens. Exp Eye Res. 2010;90:643–654. doi: 10.1016/j.exer.2010.01.013. [DOI] [PMC free article] [PubMed] [Google Scholar]
- Bassnett S. Three-dimensional reconstruction of cells in the living lens: the relationship between cell length and volume. Exp Eye Res. 2005;81:716–723. doi: 10.1016/j.exer.2005.04.009. [DOI] [PubMed] [Google Scholar]
- Coulombre JL, Coulombre AJ. Lens Development: Fiber Elongation and Lens Orientation. Science. 1963;142:1489–1490. doi: 10.1126/science.142.3598.1489. [DOI] [PubMed] [Google Scholar]
- Coulombre JL, Coulombre AJ. Lens development. IV. Size, shape, and orientation. Invest Ophthalmol. 1969;8:251–257. [PubMed] [Google Scholar]
- Cvekl A, Ashery-Padan R. The cellular and molecular mechanisms of vertebrate lens development. Development. 2014;141:4432–4447. doi: 10.1242/dev.107953. [DOI] [PMC free article] [PubMed] [Google Scholar]
- Faivre L, Gorlin RJ, Wirtz MX, Godfrey M, Dagoneau N, Samples JR, Le Merrer M, Collod-Beroud G, Boileau C, Munnich A, Cormier-Daire V. In frame fibrillin-1 gene deletion in autosomal dominant Weill-Marchesani syndrome. J Med Genet. 2003;40:34–36. doi: 10.1136/jmg.40.1.34. [DOI] [PMC free article] [PubMed] [Google Scholar]
- Hanna C, O'Brien JE. Cell production and migration in the epithelial layer of the lens. Arch Ophthalmol. 1961;66:103–107. doi: 10.1001/archopht.1961.00960010105023. [DOI] [PubMed] [Google Scholar]
- Harding CV, Hughes WL, Bond VP, Schork P. Autoradiographic localization of tritiated thymidine in wholemount preparations of lens epithelium. Arch Ophthalmol. 1960;63:58–65. doi: 10.1001/archopht.1960.00950020060009. [DOI] [PubMed] [Google Scholar]
- Hettmann T, Barton K, Leiden JM. Microphthalmia due to p53-mediated apoptosis of anterior lens epithelial cells in mice lacking the CREB-2 transcription factor. Dev Biol. 2000;222:110–123. doi: 10.1006/dbio.2000.9699. [DOI] [PubMed] [Google Scholar]
- Iribarren R. Crystalline lens and refractive development. Prog Retin Eye Res. 2015 doi: 10.1016/j.preteyeres.2015.02.002. [DOI] [PubMed] [Google Scholar]
- Kimmel M, Axelrod DE. Branching Processes in Biology. Springer Science and Business Media; New York: 2002. [Google Scholar]
- Klein BE, Klein R, Moss SE. Correlates of lens thickness: the Beaver Dam Eye Study. Invest Ophthalmol Vis Sci. 1998;39:1507–1510. [PubMed] [Google Scholar]
- Klein BE, Klein R, Moss SE. Lens thickness and five-year cumulative incidence of cataracts: The Beaver Dam Eye Study. Ophthalmic Epidemiol. 2000;7:243–248. doi: 10.1076/opep.7.4.243.4176. [DOI] [PubMed] [Google Scholar]
- Kumar A, Duvvari MR, Prabhakaran VC, Shetty JS, Murthy GJ, Blanton SH. A homozygous mutation in LTBP2 causes isolated microspherophakia. Hum Genet. 2010;128:365–371. doi: 10.1007/s00439-010-0858-8. [DOI] [PubMed] [Google Scholar]
- Kuszak JR, Costello MJ. The structure of the vertebrate lens. In: Lovicu FJ, Robinson ML, editors. Development of the Vertebrate Lens. Cambridge University Press; Cambridge: 2004. pp. 71–118. [Google Scholar]
- Kuszak JR, Zoltoski RK, Tiedemann CE. Development of lens sutures. Int J Dev Biol. 2004;48:889–902. doi: 10.1387/ijdb.041880jk. [DOI] [PubMed] [Google Scholar]
- Lovicu FJ, McAvoy JW, de Iongh RU. Understanding the role of growth factors in embryonic development: insights from the lens. Philos Trans R Soc Lond B Biol Sci. 2011;366:1204–1218. doi: 10.1098/rstb.2010.0339. [DOI] [PMC free article] [PubMed] [Google Scholar]
- Maumenee IH. The eye in the Marfan syndrome. Trans Am Ophthalmol Soc. 1981;79:684–733. [PMC free article] [PubMed] [Google Scholar]
- McAvoy JW, Chamberlain CG. Fibroblast growth factor (FGF) induces different responses in lens epithelial cells depending on its concentration. Development. 1989;107:221–228. doi: 10.1242/dev.107.2.221. [DOI] [PubMed] [Google Scholar]
- Mesa R, Bassnett S. UV-B-induced DNA damage and repair in the mouse lens. Invest Ophthalmol Vis Sci. 2013;54:6789–6797. doi: 10.1167/iovs.13-12644. [DOI] [PMC free article] [PubMed] [Google Scholar]
- Mikulicich AG, Young RW. Cell Proliferation and Displacement in the Lens Epithelium of Young Rats Injected with Tritiated Thymidine. Invest Ophthalmol. 1963;2:344–354. [PubMed] [Google Scholar]
- Pontoriero GF, Smith AN, Miller LA, Radice GL, West-Mays JA, Lang RA. Co-operative roles for E-cadherin and N-cadherin during lens vesicle separation and lens epithelial cell survival. Dev Biol. 2009;326:403417. doi: 10.1016/j.ydbio.2008.10.011. [DOI] [PMC free article] [PubMed] [Google Scholar]
- Rafferty NS, Smith R. Analysis of cell populations of normal and injured mouse lens epithelium. I cell cycle. Anatomical Record. 1976;186:105–114. [Google Scholar]
- Rong P, Wang X, Niesman I, Wu Y, Benedetti LE, Dunia I, Levy E, Gong X. Disruption of Gja8 (alpha8 connexin) in mice leads to microphthalmia associated with retardation of lens growth and lens fiber maturation. Development. 2002;129:167–174. doi: 10.1242/dev.129.1.167. [DOI] [PubMed] [Google Scholar]
- Scullica L, Grimes P, McElvain N. Further Autoradiographic Studies of the Lens Epithelium. Normal and X-Irradiated Rat Eyes. Arch Ophthalmol. 1963;70:659–665. doi: 10.1001/archopht.1963.00960050661015. [DOI] [PubMed] [Google Scholar]
- Shi Y, Barton K, De Maria A, Petrash JM, Shiels A, Bassnett S. The stratified syncytium of the vertebrate lens. J Cell Sci. 2009;122:1607–1615. doi: 10.1242/jcs.045203. [DOI] [PMC free article] [PubMed] [Google Scholar]
- Shi Y, De Maria A, Bennett T, Shiels A, Bassnett S. A role for epha2 in cell migration and refractive organization of the ocular lens. Invest Ophthalmol Vis Sci. 2012;53:551–559. doi: 10.1167/iovs.11-8568. [DOI] [PMC free article] [PubMed] [Google Scholar]
- Shi Y, De Maria A, Lubura S, Sikic H, Bassnett S. The Penny Pusher: a cellular model of lens growth. Invest Ophthalmol Vis Sci. 2015;56:799–809. doi: 10.1167/iovs.14-16028. [DOI] [PMC free article] [PubMed] [Google Scholar]
- Shiels A, Bennett TM, Hejtmancik JF. Cat-Map: putting cataract on the map. Mol Vis. 2010;16:2007–2015. [PMC free article] [PubMed] [Google Scholar]
- Shui YB, Beebe DC. Age-dependent control of lens growth by hypoxia. Invest Ophthalmol Vis Sci. 2008;49:1023–1029. doi: 10.1167/iovs.07-1164. [DOI] [PMC free article] [PubMed] [Google Scholar]
- Smith P. Diseases of crystalline lens and capsule. 1. On the growth of the crystalline lens. Trans. Ophthalmol. Soc. U.K. 1883;3:79–99. [Google Scholar]
- Strenk SA, Strenk LM, Koretz JF. The mechanism of presbyopia. Prog Retin Eye Res. 2005;24:379–393. doi: 10.1016/j.preteyeres.2004.11.001. [DOI] [PubMed] [Google Scholar]
- White TW. Unique and redundant connexin contributions to lens development. Science. 2002;295:319–320. doi: 10.1126/science.1067582. [DOI] [PubMed] [Google Scholar]
- Xi JH, Bai F, Andley UP. Reduced survival of lens epithelial cells in the alphaA-crystallin-knockout mouse. J Cell Sci. 2003;116:1073–1085. doi: 10.1242/jcs.00325. [DOI] [PubMed] [Google Scholar]
- Zandy AJ, Lakhani S, Zheng T, Flavell RA, Bassnett S. Role of the executioner caspases during lens development. J Biol Chem. 2005;280:30263–30272. doi: 10.1074/jbc.M504007200. [DOI] [PubMed] [Google Scholar]
Associated Data
This section collects any data citations, data availability statements, or supplementary materials included in this article.


