Abstract
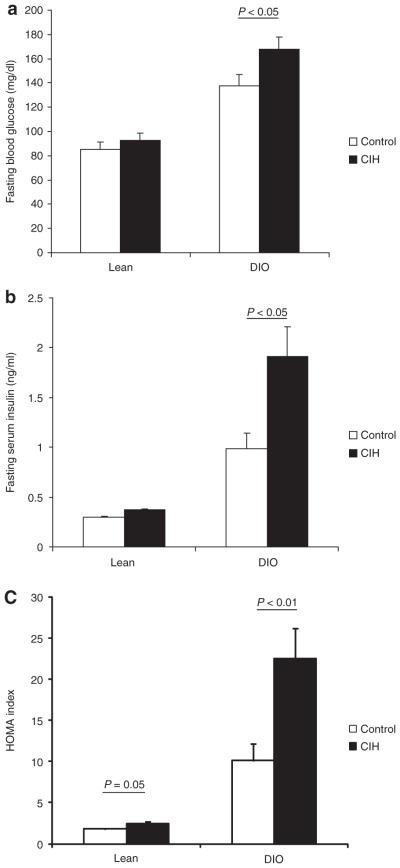
Obesity causes insulin resistance (IR) and nonalcoholic fatty liver disease (NAFLD), but the relative contribution of sleep apnea is debatable. The main aim of this study is to evaluate the effects of chronic intermittent hypoxia (CIH), a hallmark of sleep apnea, on IR and NAFLD in lean mice and mice with diet-induced obesity (DIO). Mice (C57BL/6J), 6–8 weeks of age were fed a high fat (n = 18) or regular (n = 16) diet for 12 weeks and then exposed to CIH or control conditions (room air) for 4 weeks. At the end of the exposure, fasting (5 h) blood glucose, insulin, homeostasis model assessment (HOMA) index, liver enzymes, and intraperitoneal glucose tolerance test (1 g/kg) were measured. In DIO mice, body weight remained stable during CIH and did not differ from control conditions. Lean mice under CIH were significantly lighter than control mice by day 28 (P = 0.002). Compared to lean mice, DIO mice had higher fasting levels of blood glucose, plasma insulin, the HOMA index, and had glucose intolerance and hepatic steatosis at baseline. In lean mice, CIH slightly increased HOMA index (from 1.79 ± 0.13 in control to 2.41 ± 0.26 in CIH; P = 0.05), whereas glucose tolerance was not affected. In contrast, in DIO mice, CIH doubled HOMA index (from 10.1 ± 2.1 in control to 22.5 ± 3.6 in CIH; P < 0.01), and induced severe glucose intolerance. In DIO mice, CIH induced NAFLD, inflammation, and oxidative stress, which was not observed in lean mice. In conclusion, CIH exacerbates IR and induces steatohepatitis in DIO mice, suggesting that CIH may account for metabolic dysfunction in obesity.
INTRODUCTION
Obesity is a growing public health problem (1). Obesity significantly increases morbidity and mortality, which has been attributed to the development of metabolic dysfunction, including insulin resistance (IR), type 2 diabetes, and nonalcoholic fatty liver disease (NAFLD) leading to systemic inflammation, oxidative stress, and cardiovascular complications (2). Obesity is also a major risk factor for obstructive sleep apnea (OSA) with an estimated prevalence of OSA of 30–64% in obese individuals (3,4) reaching 80–90% in morbidly obese (5,6).
OSA has been implicated in the development and progression of IR and type 2 diabetes (7,8). However, it is not clear whether underlying obesity modifies metabolic responses. Indeed, a majority of the studies include predominantly over-weight, obese or even severely obese subjects (7,9). Harsch et al. examined the effect of the continuous positive airway pressure treatment for 2 days and 3 months on IR in obese and lean patients using a hyperinsulinemic euglycemic clamp and found that continuous positive airway pressure dramatically improved IR in lean subjects, but not in obese subjects (10). In contrast, Gozal et al. examined metabolic changes in children with OSA before and after tonsillectomy and adenoidectomy, a treatment of choice in the pediatric population, and found that treatment of OSA decreased IR in obese, but not in lean children (11). OSA has also been associated with the progression of NAFLD from hepatic steatosis to steatohepatitis (9,12,13). Several studies suggest that OSA exacerbates detrimental effects of obesity on NAFLD (9,12), whereas others question the independent role of OSA (13). Thus, it remains debatable, whether OSA may have an additive effect on IR and NAFLD in obesity.
OSA is characterized by chronic intermittent hypoxia (CIH) during sleep. We have developed a mouse model of intermittent hypoxia, which mimics the oxygen profile in human OSA (14,15), and have shown that CIH exacerbates IR (16) and hepatic steatosis (17) in a genetic mouse model of extreme obesity, the leptin-deficient ob/ob mouse. We have linked CIH-induced IR, dyslipidemia, and hepatic steatosis to activation of a lipogenic transcription factor sterol regulatory element binding protein 1 (SREBP-1) and a SREBP-1 regulated enzyme stearoyl-coenzyme A desaturase 1, (SCD-1) (18). Finally, we have shown that CIH causes mild liver injury in lean C57BL/6J mice without evidence of steatohepatitis (19) and increases epatic inflammation in nonobese mice with hepatic steatosis (20). However, it remains unknown whether CIH may exacerbate IR in diet-induced obesity (DIO) and covert hepatic steatosis of obesity to steatohepatitis. In this study, we exposed DIO and lean C57BL/6J mice to CIH for 4 weeks and examined IR, glucose tolerance, expression of hepatic steatosis, inflammation, and oxidative stress.
METHODS AND PROCEDURES
Experimental animals
Eighteen adult male C57BL/6J mice, 6–8 weeks of age were fed a high fat diet (TD 03584, 5.4 kcal/g, 35.2% fat, 58.4% of kcal from fat; Harlan Teklad, Madison, WI) for 12 weeks and then exposed to CIH or control conditions (room air) for 4 weeks (see below). Sixteen age-matched male C57BL/6J mice were fed a regular chow diet for 12 weeks and then exposed to CIH also for 4 weeks. The study was approved by the Johns Hopkins University Animal Use and Care Committee and complied with the American Physiological Society Guidelines for Animal Studies.
Mouse model of intermittent hypoxia
Briefly, a gas control delivery system was designed employing programmable solenoids and flow regulators, which controlled the flow of air, nitrogen, and oxygen into cages. During each cycle of intermittent hypoxia, the FiO2 decreased from ~21% to ~6–7% over a 30-s period, followed by a rapid return to ~21% over the subsequent 30 s period. This regimen of intermittent hypoxia induces oxyhemoglobin desaturations from 99% to ~65%, 60 times/h (14). CIH was administered during the light phase (9 am–9 pm) to coincide with the mouse sleep cycle and the duration of exposure was 4 weeks. A control group was exposed to room air for the same period and fed ad libitum.
Upon completion of the exposure, mice were bled and then sacrificed under 1–2% isoflurane anesthesia after a 5 h fast. All blood draws, testing, and tissue harvesting were performed between 12 pm and 1 pm. The liver was surgically removed, weighed, and cut into several pieces. Liver tissue was either frozen in liquid nitrogen and kept at −80 °C for further biochemical studies or fixed in buffered 10% formalin for histological examination.
Assays
Fasting (5 h) blood glucose, insulin testing, and intraperitoneal glucose tolerance test (1 g/kg) were performed in unanesthetized mice immediately upon cessation of the exposure by tail bleeding. Blood glucose was tested with Accu-Chek Comfort Curve kit from (Roche Diagnostics, Indianapolis, IN) and plasma insulin was measured with an ELISA kit from (Millipore, Billerica, MA). The homeostasis model assessment (HOMA) index was calculated as fasting serum insulin (µU/ml) × fasting blood glucose (mmol/l)/22.5.
Fasting plasma total cholesterol, free-fatty acids (FFAs), and triglycerides were measured with kits from (Wako Diagnostics, Richmond, VA). Corticosterone was determined by ELISA kit from (R&D Systems, Minneapolis, MN). Serum liver tests including alanine aminotransferase (ALT), aspartate aminotransferase (AST), and alkaline phosphatase (AP), were performed in the Johns Hopkins Bayview Medical Center Clinical Laboratory. Lipids were extracted from the liver with chloroformmethanol, according to Bligh–Dyer procedure (21) and measured using kits from (Wako Diagnostics). Lipid peroxidation in liver tissue was assessed by malondialdehyde assay with a kit from (OxisResearch, Portland, OR).
Proinflammatory cytokines, tumor necrosis factor-α, and macrophage inflammatory protein 2 protein levels were measured in the liver lysate by ELISA using kits from (R&D Systems). SCD-1 protein levels in the liver were assessed by western blot using goat polyclonal antibodies and bovine anti-goat-HRP from (Santa Cruz Biotechnology, Santa Cruz, CA); actin was detected with mouse monoclonal antibodies from Sigma and goat anti-mouse-HRP (Bio-Rad, Hercules, CA).
Total RNA was isolated using Trizol Reagent (Life Technologies, Rockville, MD) with additional RNA clean-up using the RNAeasy (Qiagen, Valencia, CA) purification kit. cDNA was produced from total RNA using Advantage RT for PCR kit from (Clontech, Palo Alto, CA). cDNA was amplified in real time reverse transcriptase PCR with primers from (Invitrogen, Carlsbad, CA) and Taqman probes from (Applied Biosystems, Foster City, CA). The threshold cycle (Ct) was determined for every sample. The mRNA expression levels were normalized to 18S rRNA concentrations using the following formula: Gene of interest/18S = 2Ct(18S)–Ct(Gene of interest). For histological analysis, formalin fixed paraffin-embedded tissues were stained with hematoxylin and eosin and evaluated in a blinded fashion.
Statistical analysis
All values are reported as means ± s.e m. For multiple comparisons, we performed a repeated measures of ANOVA test and significance determined using Tukey’s post hoc test. A P value of <0.05 was considered significant.
RESULTS
Basic characteristics
In DIO mice, body weight remained stable during CIH and did not differ from control conditions (Table 1). In lean mice, there was a trend to decline in body weight in the CIH group (P = 0.11), and CIH mice were significantly lighter than control mice by day 28 (P = 0.002). Compared to lean mice, liver and epididymal fat weights were significantly higher in obese mice.
Table 1.
Basic characteristics of lean and diet-induced obesity (DIO) C57BL/6J mice exposed to chronic intermittent hypoxia (CIH) or control for 4 weeks
| Characteristics |
Lean mice |
DIO mice |
|||
|---|---|---|---|---|---|
| Exposure | Control | CIH | Control | CIH | |
| N | 8 | 8 | 10 | 8 | |
| Body weight (g) | |||||
| Day 0 | 23.5 ± 0.3 | 24.2 ± 1.0 | 33.0 ± 1.5* | 33.5 ± 1.6* | |
| Day 28 | 25.7 ± 0.4 | 23.0 ± 0.6** | 34.9 ± 1.3* | 34.9 ± 1.7* | |
| Mean food intake (g/day) | 3.22 ± 0.26 | 2.97 ± 0.49 | 3.34 ± 0.39 | 2.83 ± 0.38 | |
| Liver weight | (g) | 0.92 ± 0.04 | 0.86 ± 0.02 | 1.31 ± 0.10* | 1.10 ± 0.06* |
| Percentage of body weight | 4.08 ± 0.11 | 4.18 ± 0.06 | 4.25 ± 0.22 | 3.64 ± 0.18† | |
| Epididymal fat | (g) | 0.48 ± 0.02 | 0.35 ± 0.03** | 1.56 ± 0.24* | 1.65 ± 0.22* |
| Percentage of body weight | 1.94 ± 0.09 | 1.53 ± 0.12*** | 4.45 ± 0.55* | 4.83 ± 0.60* | |
CIH, chronic intermittent hypoxia; DIO, diet-induced obesity.
P < 0.01 vs. lean mice.
P < 0.01 vs. control lean mice.
P < 0.05 vs. control lean mice.
P = 0.05 vs. control DIO mice.
Glucose and insulin
Compared to lean mice, DIO mice had higher fasting levels of glucose, insulin, and the HOMA index (Figure 1). In lean mice, CIH induced a strong trend to an increase in the HOMA index (P = 0.05), although fasting blood glucose and serum insulin did not significantly increase. In contrast, in DIO mice, CIH increased fasting blood glucose levels by 30 mg/dl and induced a 1.9-fold increase in serum insulin and a 2.2-fold increase in the HOMA index (Figure 1). Figure 2 shows the intraperitoneal glucose tolerance test in lean and obese mice under the CIH and control conditions. Compared to lean mice, DIO mice had glucose intolerance at baseline. In lean mice, CIH did not lead to significant glucose intolerance (Figure 2). In contrast, in DIO mice, CIH induced severe glucose intolerance (Figure 2). As expected, the area under the curve for intraperitoneal glucose tolerance test in DIO mice was significantly larger than in lean mice at baseline. DIO mice demonstrated a further increase of the area under the curve at hypoxic conditions, whereas lean mice showed no change (Figure 3).
Figure 1.
Indices of insulin resistance during chronic intermittent hypoxia. (a) Glucose, (b) insulin, and (c) homeostasis model assessment (HOMA) index in lean and diet-induced obesity (DIO) mice during chronic intermittent hypoxia (CIH) or control conditions. P < 0.05 obese vs. lean mice.
Figure 2.
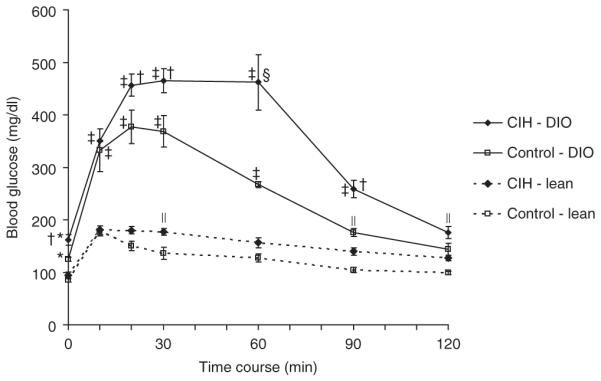
Intraperitoneal glucose tolerance test in lean and diet-induced obesity (DIO) mice submitted to chronic intermittent hypoxia (CIH) or control conditions. Overall, P < 0.05 obese vs. lean mice. *P < 0.05 vs. CIH and control lean mice; †P < 0.05 vs. control DIO mice; ‡P < 0.01 vs. CIH and control lean mice; §P < 0.01 vs. control DIO mice; P < 0.05 vs. control lean mice.
Figure 3.
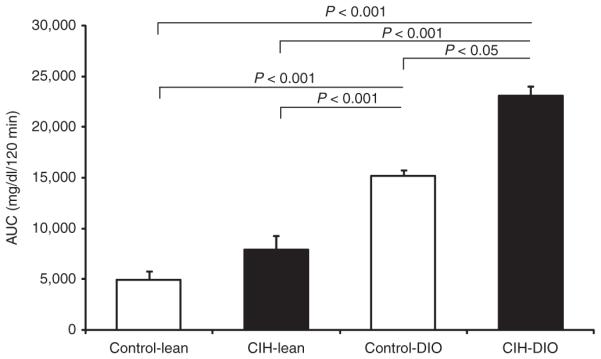
Area under the curve (AUC) for the intraperitoneal glucose tolerance test in lean and diet-induced obesity (DIO) mice submitted to chronic intermittent hypoxia (CIH) or control conditions. P < 0.05 obese vs. lean mice.
Serum triglycerides, FFAs, corticosterone, and liver enzymes
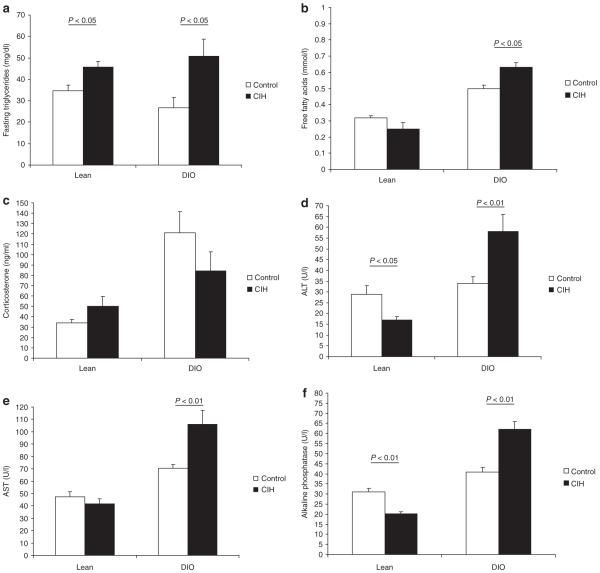
CIH induced a significant increase in serum triglycerides in both lean and DIO mice (Figure 4a). Compared to lean mice, DIO mice had higher levels of serum FFA that were amplified by the effects of CIH. In contrast, CIH did not affect serum FFA in lean mice (Figure 4b). Obesity was associated with higher baseline corticosterone levels (Figure 4c). CIH did not alter corticosterone levels in lean and DIO mice, suggesting that the animals were not stressed. In lean mice, CIH decreased serum ALT and AP (Figure 4d,f). In contrast, in DIO mice, CIH markedly increased serum AST, ALT, and AP suggesting that CIH caused liver injury in the presence of obesity (Figure 4d–f).
Figure 4.
Levels of (a) serum triglycerides, (b) free-fatty acids, (c) corticosterone, and (d–f) liver enzymes in lean and diet-induced obesity (DIO) mice submitted to chronic intermittent hypoxia (CIH) or control conditions. P < 0.05 obese vs. lean mice (except for serum triglycerides—P > 0.05). ALT, alanine aminotransaminase; AST, aspartate aminotransaminase; AP, alkaline phosphatase.
Lipid peroxidation, proinflammatory cytokines, and histology in the liver
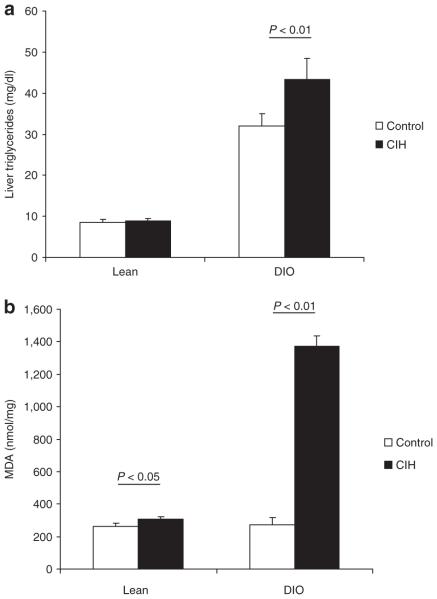
DIO led to hepatic steatosis at baseline conditions (Figure 5a, compare Figure 6a,b). In lean mice, CIH did not affect liver triglyceride content, mRNA and protein levels of proinflammatory cytokines, tumor necrosis factor-α, and macrophage inflammatory protein 2 (Figure 5 and Table 2), but induced a small, but statistically significant increase in lipid peroxidation (Figure 5b). There was no evidence of hepatic inflammation on liver histology (Figure 6a,c). In contrast, in DIO mice, CIH increased liver triglyceride content (Figure 5a), proinflammatory cytokine levels (Table 2) and caused a striking fivefold increase in lipid peroxidation (Figure 5b). We have previously shown that, in lean mice, CIH induces a twofold increase in mRNA and protein levels of a key enzyme of lipid biosynthesis, SCD-1 (22). In DIO mice, CIH increased SCD-1 mRNA levels by nearly fourfold (see Supplementary Figure S1 online). In DIO mice, CIH converted microvesicular hepatic steatosis observed at baseline into macrovesicular steatosis and caused lobular inflammation (Figure 6d).
Figure 5.
Levels of (a) liver triglycerides and (b) malondialdehyde (MDA) in lean and diet-induced obesity (DIO) mice submitted to chronic intermittent hypoxia (CIH) or control conditions. P < 0.05 obese vs. lean mice.
Figure 6.
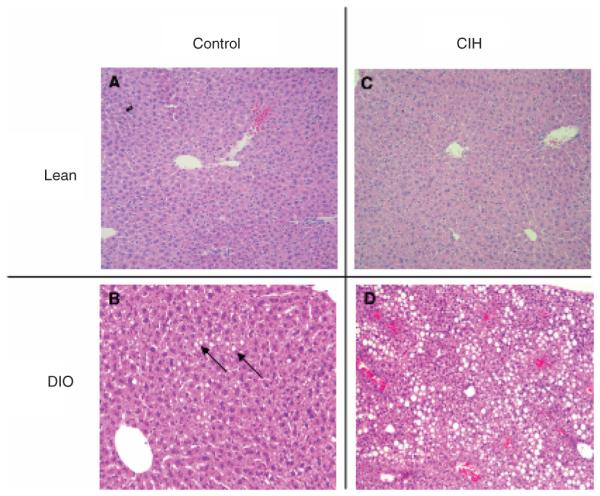
Representative images of the liver in lean (a and c) and diet-induced obesity (DIO) mice (b and d) submitted to chronic intermittent hypoxia (CIH) or control conditions. No significant changes were observed in (a) control-lean. (b) Control-DIO mice presented microvesicular hepatic steatosis. (c) No significant changes were observed in CIH-lean. (d) CIH-DIO mice presented a robust increase in macrovesicular hepatic steatosis and lobular inflammation. H&E, hematoxylin and eosin.
Table 2.
RNA expression and protein levels of liver tumor necrosis factor-α(TNF-α) and macrophage inflammatory protein-2 (MIP-2) in lean mice and mice with diet-induced obesity (DIO) submitted to chronic intermittent hypoxia (CIH) or control conditions
| Characteristics |
Lean mice |
DIO mice |
||
|---|---|---|---|---|
| Exposure | Control | CIH | Control | CIH |
| RNA expression | ||||
| TNF-α/18S mRNA ratio | 2.72 × 10⁻⁶ ± 6.39 × 10⁻⁵ | 4.30 × 10⁻⁶ ± 1.83 × 10⁻⁶ | 1.72 × 10⁻⁵ ± 4.53 × 10⁻⁶* | 3.22 × 10⁻⁵ ± 5.45 × 10⁻⁶*,** |
| MIP-2/18S mRNA ratio | 3.66 × 10⁻⁵ ± 1.13 × 10⁻⁵ | 5.28 × 10⁻⁵ ± 1.63 × 10⁻⁵ | 1.99 × 10⁻⁴ ± 5.88 × 10⁻⁵* | 4.36 × 10⁻⁴ ± 1.16 × 10⁻⁴*,** |
| Protein levels | ||||
| TNF-α (pg/mg) | 0.064 ± 0.009 | 0.051 ± 0.005 | 0.112 ± 0.006* | 0.210 ± 0.032*,** |
| MIP-2 (pg/mg) | 0.089 ± 0.028 | 0.055 ± 0.005 | 0.576 ± 0.210* | 1.039 ± 0.306*,** |
CIH, chronic intermittent hypoxia; DIO, diet-induced obesity; MIP-2, macrophage inflammatory protein-2; TNF-α, tumor necrosis factor α.
P < 0.01 vs. lean mice.
P = 0.05 vs. control DIO mice.
DISCUSSION
To the best of our knowledge, this is the first report that compares the impact of CIH on metabolic function in lean and DIO mice. The main finding of our study was that CIH exacerbated pre-existing IR and glucose intolerance in DIO mice, but did not have a dramatic impact on lean mice. In addition, in DIO mice, CIH induced severe oxidative stress in the liver and augmented pre-existing hepatic steatosis resulting in steatohepatitis. In lean mice, CIH had only a minimal impact on liver lipid peroxidation, whereas liver triglyceride content and inflammation were not affected. In the discussion below, we will elaborate on potential mechanisms of IR and steatohepatitis in CIH and clinical implications of our work.
We have previously found that in lean C57BL/6J mice, acute intermittent hypoxia (9 h) resulted in a significant increase in IR measured by hyperinsulinemic euglycemic clamp (23). The IR rapidly normalized after cessation of each diurnal intermittent hypoxia exposure (24). However, CIH for 4 weeks to 6 months in lean mice did not raise fasting serum insulin levels (20,22). In the present study, we found that CIH has a very modest effect on IR (Figure 1c) and has no effect on glucose tolerance in lean mice. Interestingly, CIH for 12 weeks increased fasting blood glucose levels without an increase in insulin suggesting injury of pancreatic β-cells (25). We did not observe this phenomenon in the current study, which could be explained by the differences in CIH severity (a nadir of 5% in the former study and 6–7% in the present study). Overall, our data show that initial detrimental effects of acute intermittent hypoxia in lean mice on IR are reversed after chronic exposure. One potential mechanism would be adaptation to stress. Indeed, short-term exposure to acute intermittent hypoxia markedly increases serum corticosterone levels (23), which was no longer observed after CIH exposure (Figure 4c). Thus, CIH for 4 weeks has a minimal impact on IR in lean mice.
Our previous work showed that CIH augments IR in genetically obese leptin-deficient mice (16). However, leptin deficiency is a poor model of human obesity, which is associated with high levels of leptin and leptin resistance (26). Our current data showed that CIH increases IR and glucose intolerance in DIO mice (Figures 1 and 2). Obesity induces IR and systemic inflammation acting via several mechanisms. Obesity leads to increased adipose tissue lipolysis (27). An acute elevation of plasma FFA leads to intramyocellular lipid accumulation in skeletal muscle and the liver (28), also known as lipotoxicity. FFA prevent tyrosine phosphorylation of insulin receptor substrate 1 (muscle) and 2 (liver), which decreases insulin stimulated glucose transport leading to IR (29). In our experiments, DIO mice showed higher baseline levels of serum FFA and liver triglycerides compared to lean mice (Figures 4b and 5a). FFA also up-regulate IκB kinase β (30), which activates the NF-κB pathway. In our study, obesity raised baseline levels of NF-κB regulated cytokines, tumor necrosis factor-α, and macrophage inflammatory protein 2 (Table 2). Overall, our findings are consistent with existing body of the literature, which suggests that excessive lipolysis plays a major role in the development of IR and hepatic steatohepatitis in DIO (31).
CIH increased circulating FFA levels in DIO mice (Figure 4b) suggesting that IH augmented lipolysis, which may further increase IR, hepatic steatosis, and inflammation. Of interest, we have recently shown that CIH increases circulating FFA levels in patients with sleep apnea in proportion to the severity of hypoxia (32). CIH activates the sympathetic nervous system (33) and activation of the sympathetic nervous system induces lipolysis via up-regulation of hormone-sensitive lipase in adipose tissue (34). In our present study, CIH increased IR (Figures 1 and 2), liver injury, and hepatic inflammation in DIO mice (Figures 4 and 6 and Table 2). We hypothesize that CIH and obesity interact to induce lipolysis increasing circulating FFA levels, which augments pre-existing IR and causes steatohepatitis.
Obesity and hyperinsulinemia induce hepatic lipid biosynthesis by activating SREBP-1 and downstream enzymes of lipid biosynthesis (35). We have previously shown that CIH induces SREBP-1 and the SREBP-1 regulated enzyme SCD-1 in lean and genetically obese mice (17,18,36,37). We now show that CIH increases hepatic SCD-1 levels in DIO mice (Supplementary Figure S1 online). SCD-1 has been implicated in the pathogenesis of obesity, fatty liver, and hepatic IR in mice (38,39). Thus, CIH and DIO may interact to induce hepatic lipid biosynthesis, which exaggerate IR and hepatic steatosis.
We have previously shown that CIH induces mild oxidative stress in the liver in the absence of obesity (19,40). Our present study also shows a small, but statistically significant increase in hepatic lipid peroxidation in lean mice (Figure 5b). We have previously shown that in lean mice CIH results in mild liver injury with elevation of liver enzymes (19). However, in the current study CIH paradoxically decreased ALT and AP levels. This apparent discrepancy with the previous data is likely related to differences in the study design. CIH induces weight loss in lean mice (40), therefore it is not surprising that in the current study CIH mice were significantly lighter than control animals. In the previous study, control mice were weightmatched to the CIH group, which was not done in the present report, because we were interested in comparing the impact of CIH on weight loss in lean and DIO mice. Second, the exposure was milder with an FiO2 nadir of 6–7% as opposed to 5% in the previous report (19). We speculate that the decrease in liver enzymes during CIH in the current study is attributable to weight loss rather than to hypoxia per se. In fact, our previous work suggests that CIH causes significant liver injury only in the presence of another insult (19,41).
We have previously shown that CIH exacerbates hepatic steatosis in leptin-deficient ob/ob mice (17). Leptin decreases IR and protects against hepatic steatosis (42). Leptin deficiency leads to severe hepatic steatosis (43) which is further augmented by CIH (17). However, leptin deficiency also has a protective effect on the liver, since leptin promotes hepatic fibrogenesis (44). Ob/ ob mice do not develop liver fibrosis, an essential component of steatohepatitis (42). Therefore, DIO mice is a preferred model of steatohepatitis compared to ob/ob mice. Our present report provides first evidence that CIH exacerbates detrimental effects of DIO on the liver leading to liver injury and steatohepatitis.
Oxidative stress in the liver is a well described mechanism of steatohepatitis and liver fibrosis (45). DIO is associated with increased oxidative stress in the liver with specific activation of nicotinamide adenine dinucleotide phosphate oxidase (46). We have previously shown that CIH leads to moderate increases in hepatic lipid peroxidation (20,25,40) mediated by nicotinamide adenine dinucleotide phosphate oxidase (40). We have now shown that CIH and DIO interact causing a dramatic six-fold increase in lipid peroxidation in the liver (Figure 5b). This increase in lipid peroxidation could be a result of exuberant adipose tissue lipolysis (31,40). We hypothesize that lipotoxic injury and lipid peroxidation induce hepatic inflammation resulting in steatohepatitis in DIO mice exposed to CIH.
Our study has several limitations: First of all, our model of CIH does not mimic all features of OSA, which also include hypercapnea and transthoracic pressure swings. However, the model mimics the oxygen profile observed in patients with severe OSA and induces frequent arousals from sleep with consequent sleep fragmentation in mice (14,15). Second, our study is not mechanistic and it does not provide an irrefutable proof that excessive lipolysis, hepatic lipid biosynthesis, and oxidative stress are the key factors mediating the synergism between CIH and obesity. Finally, we did not investigate the impact of CIH on the pancreas. CIH may have a detrimental effect on pancreatic endocrine function. Indeed, immunohistochemistry of pancreatic islets showed that short-term intermittent hypoxia increases both apoptosis and proliferation of β-cells (24,47).
In conclusion, we have demonstrated that CIH has a significant effect on metabolic function only in the presence of obesity. We hypothesize that OSA plays a critical role in the development of the metabolic syndrome in obese individuals and constitutes a second hit in the pathogenesis of NAFLD. Our recent clinical studies confirm this hypothesis demonstrating that OSA is associated with more severe manifestations of the metabolic syndrome including dyslipidemia and IR as well as systemic inflammation and steatohepatitis (9,48). Taken together, our data suggest that obese individuals with metabolic syndrome and NAFLD have to be evaluated for OSA.
Supplementary Material
ACKNOWLEDGMENTS
This study was supported in part by the Mid-Atlantic Nutrition Obesity Research Center (NORC; formerly CNRU of Maryland) - (NIH Grant P30 DK072488). L.F.D., C.R. and J.C.J. are Postdoctoral Fellows at Johns Hopkins University. L.F.D. is supported by Fundação Zerbini and Research Fellowship grant from FAPESP (2010/11681-0). J.C.J. is supported by the National Sleep Foundation/American Lung Association Pickwick Grant (SF-78568-N) and NIH T32 training grant (HL07534). C.R. is supported by the Research Fellowship grant RE 2842/1-1, German Research Foundation (DFG). V.Y.P. is supported by the National Institutes of Health (grants HL080105 and P50 HL084945) and the American Heart Association grant 10GRNT3360001.
Footnotes
SUPPLEMENTARY MATERIAL
Supplementary material is linked to the online version of the paper at http:// www.nature.com/oby
DISCLOSURE
The authors declared no conflict of interest.
REFERENCES
- 1.Flegal KM, Carroll MD, Ogden CL, Curtin LR. Prevalence and trends in obesity among US adults, 1999-2008. JAMA. 2010;303:235–241. doi: 10.1001/jama.2009.2014. [DOI] [PubMed] [Google Scholar]
- 2.Gade W, Schmit J, Collins M, Gade J. Beyond obesity: the diagnosis and pathophysiology of metabolic syndrome. Clin Lab Sci. 2010;23:51–61. quiz 62. [PubMed] [Google Scholar]
- 3.Young T, Peppard PE, Gottlieb DJ. Epidemiology of obstructive sleep apnea: a population health perspective. Am J Respir Crit Care Med. 2002;165:1217–1239. doi: 10.1164/rccm.2109080. [DOI] [PubMed] [Google Scholar]
- 4.Tufik S, Santos-Silva R, Taddei JA, Bittencourt LR. Obstructive sleep apnea syndrome in the Sao Paulo Epidemiologic Sleep Study. Sleep Med. 2010;11:441–446. doi: 10.1016/j.sleep.2009.10.005. [DOI] [PubMed] [Google Scholar]
- 5.Lecube A, Sampol G, Lloberes P, et al. Asymptomatic sleep-disordered breathing in premenopausal women awaiting bariatric surgery. Obes Surg. 2010;20:454–461. doi: 10.1007/s11695-009-0033-2. [DOI] [PubMed] [Google Scholar]
- 6.Rao A, Tey BH, Ramalingam G, Poh AG. Obstructive sleep apnoea (OSA) patterns in bariatric surgical practice and response of OSA to weight loss after laparoscopic adjustable gastric banding (LAGB) Ann Acad Med Singap. 2009;38:587–593. [PubMed] [Google Scholar]
- 7.Punjabi NM, Sorkin JD, Katzel LI, et al. Sleep-disordered breathing and insulin resistance in middle-aged and overweight men. Am J Respir Crit Care Med. 2002;165:677–682. doi: 10.1164/ajrccm.165.5.2104087. [DOI] [PubMed] [Google Scholar]
- 8.Botros N, Concato J, Mohsenin V, et al. Obstructive sleep apnea as a risk factor for type 2 diabetes. Am J Med. 2009;122:1122–1127. doi: 10.1016/j.amjmed.2009.04.026. [DOI] [PMC free article] [PubMed] [Google Scholar]
- 9.Polotsky VY, Patil SP, Savransky V, et al. Obstructive sleep apnea, insulin resistance, and steatohepatitis in severe obesity. Am J Respir Crit Care Med. 2009;179:228–234. doi: 10.1164/rccm.200804-608OC. [DOI] [PMC free article] [PubMed] [Google Scholar]
- 10.Harsch IA, Schahin SP, Brückner K, et al. The effect of continuous positive airway pressure treatment on insulin sensitivity in patients with obstructive sleep apnoea syndrome and type 2 diabetes. Respiration. 2004;71:252–259. doi: 10.1159/000077423. [DOI] [PubMed] [Google Scholar]
- 11.Gozal D, Capdevila OS, Kheirandish-Gozal L. Metabolic alterations and systemic inflammation in obstructive sleep apnea among nonobese and obese prepubertal children. Am J Respir Crit Care Med. 2008;177:1142–1149. doi: 10.1164/rccm.200711-1670OC. [DOI] [PMC free article] [PubMed] [Google Scholar]
- 12.Mishra P, Nugent C, Afendy A, et al. Apnoeic-hypopnoeic episodes during obstructive sleep apnoea are associated with histological nonalcoholic steatohepatitis. Liver Int. 2008;28:1080–1086. doi: 10.1111/j.1478-3231.2008.01822.x. [DOI] [PubMed] [Google Scholar]
- 13.Jouët P, Sabaté JM, Maillard D, et al. Relationship between obstructive sleep apnea and liver abnormalities in morbidly obese patients: a prospective study. Obes Surg. 2007;17:478–485. doi: 10.1007/s11695-007-9085-3. [DOI] [PubMed] [Google Scholar]
- 14.Jun J, Reinke C, Bedja D, et al. Effect of intermittent hypoxia on atherosclerosis in apolipoprotein E-deficient mice. Atherosclerosis. 2010;209:381–386. doi: 10.1016/j.atherosclerosis.2009.10.017. [DOI] [PMC free article] [PubMed] [Google Scholar]
- 15.Polotsky VY, Rubin AE, Balbir A, et al. Intermittent hypoxia causes REM sleep deficits and decreases EEG delta power in NREM sleep in the C57BL/6J mouse. Sleep Med. 2006;7:7–16. doi: 10.1016/j.sleep.2005.06.006. [DOI] [PubMed] [Google Scholar]
- 16.Polotsky VY, Li J, Punjabi NM, et al. Intermittent hypoxia increases insulin resistance in genetically obese mice. J Physiol (Lond) 2003;552:253–264. doi: 10.1113/jphysiol.2003.048173. [DOI] [PMC free article] [PubMed] [Google Scholar]
- 17.Li J, Grigoryev DN, Ye SQ, et al. Chronic intermittent hypoxia upregulates genes of lipid biosynthesis in obese mice. J Appl Physiol. 2005;99:1643–1648. doi: 10.1152/japplphysiol.00522.2005. [DOI] [PubMed] [Google Scholar]
- 18.Li J, Thorne LN, Punjabi NM, et al. Intermittent hypoxia induces hyperlipidemia in lean mice. Circ Res. 2005;97:698–706. doi: 10.1161/01.RES.0000183879.60089.a9. [DOI] [PubMed] [Google Scholar]
- 19.Savransky V, Nanayakkara A, Vivero A, et al. Chronic intermittent hypoxia predisposes to liver injury. Hepatology. 2007;45:1007–1013. doi: 10.1002/hep.21593. [DOI] [PubMed] [Google Scholar]
- 20.Savransky V, Bevans S, Nanayakkara A, et al. Chronic intermittent hypoxia causes hepatitis in a mouse model of diet-induced fatty liver. Am J Physiol Gastrointest Liver Physiol. 2007;293:G871–G877. doi: 10.1152/ajpgi.00145.2007. [DOI] [PubMed] [Google Scholar]
- 21.BLIGH EG, DYER WJ. A rapid method of total lipid extraction and purification. Can J Biochem Physiol. 1959;37:911–917. doi: 10.1139/o59-099. [DOI] [PubMed] [Google Scholar]
- 22.Li J, Savransky V, Nanayakkara A, et al. Hyperlipidemia and lipid peroxidation are dependent on the severity of chronic intermittent hypoxia. J Appl Physiol. 2007;102:557–563. doi: 10.1152/japplphysiol.01081.2006. [DOI] [PubMed] [Google Scholar]
- 23.Iiyori N, Alonso LC, Li J, et al. Intermittent hypoxia causes insulin resistance in lean mice independent of autonomic activity. Am J Respir Crit Care Med. 2007;175:851–857. doi: 10.1164/rccm.200610-1527OC. [DOI] [PMC free article] [PubMed] [Google Scholar]
- 24.Yokoe T, Alonso LC, Romano LC, et al. Intermittent hypoxia reverses the diurnal glucose rhythm and causes pancreatic beta-cell replication in mice. J Physiol (Lond) 2008;586:899–911. doi: 10.1113/jphysiol.2007.143586. [DOI] [PMC free article] [PubMed] [Google Scholar]
- 25.Savransky V, Nanayakkara A, Li J, et al. Chronic intermittent hypoxia induces atherosclerosis. Am J Respir Crit Care Med. 2007;175:1290–1297. doi: 10.1164/rccm.200612-1771OC. [DOI] [PMC free article] [PubMed] [Google Scholar]
- 26.Considine RV, Sinha MK, Heiman ML, et al. Serum immunoreactive-leptin concentrations in normal-weight and obese humans. N Engl J Med. 1996;334:292–295. doi: 10.1056/NEJM199602013340503. [DOI] [PubMed] [Google Scholar]
- 27.Kahn SE, Hull RL, Utzschneider KM. Mechanisms linking obesity to insulin resistance and type 2 diabetes. Nature. 2006;444:840–846. doi: 10.1038/nature05482. [DOI] [PubMed] [Google Scholar]
- 28.Unger RH, Clark GO, Scherer PE, Orci L. Lipid homeostasis, lipotoxicity and the metabolic syndrome. Biochim Biophys Acta. 2010;1801:209–214. doi: 10.1016/j.bbalip.2009.10.006. [DOI] [PubMed] [Google Scholar]
- 29.Delarue J, Magnan C. Free fatty acids and insulin resistance. Curr Opin Clin Nutr Metab Care. 2007;10:142–148. doi: 10.1097/MCO.0b013e328042ba90. [DOI] [PubMed] [Google Scholar]
- 30.Cai D, Yuan M, Frantz DF, et al. Local and systemic insulin resistance resulting from hepatic activation of IKK-beta and NF-kappaB. Nat Med. 2005;11:183–190. doi: 10.1038/nm1166. [DOI] [PMC free article] [PubMed] [Google Scholar]
- 31.Neuschwander-Tetri BA. Hepatic lipotoxicity and the pathogenesis of nonalcoholic steatohepatitis: the central role of nontriglyceride fatty acid metabolites. Hepatology. 2010;52:774–788. doi: 10.1002/hep.23719. [DOI] [PubMed] [Google Scholar]
- 32.Jun JC, Drager LF, Najjar SS, et al. Effects of sleep apnea on nocturnal fatty acids in subjects with heart failure. Sleep. doi: 10.5665/SLEEP.1240. in press. [DOI] [PMC free article] [PubMed] [Google Scholar]
- 33.Bao G, Metreveli N, Li R, Taylor A, Fletcher EC. Blood pressure response to chronic episodic hypoxia: role of the sympathetic nervous system. J Appl Physiol. 1997;83:95–101. doi: 10.1152/jappl.1997.83.1.95. [DOI] [PubMed] [Google Scholar]
- 34.Zechner R, Kienesberger PC, Haemmerle G, Zimmermann R, Lass A. Adipose triglyceride lipase and the lipolytic catabolism of cellular fat stores. J Lipid Res. 2009;50:3–21. doi: 10.1194/jlr.R800031-JLR200. [DOI] [PubMed] [Google Scholar]
- 35.Horton JD, Bashmakov Y, Shimomura I, Shimano H. Regulation of sterol regulatory element binding proteins in livers of fasted and refed mice. Proc Natl Acad Sci USA. 1998;95:5987–5992. doi: 10.1073/pnas.95.11.5987. [DOI] [PMC free article] [PubMed] [Google Scholar]
- 36.Li J, Nanayakkara A, Jun J, Savransky V, Polotsky VY. Effect of deficiency in SREBP cleavage-activating protein on lipid metabolism during intermittent hypoxia. Physiol Genomics. 2007;31:273–280. doi: 10.1152/physiolgenomics.00082.2007. [DOI] [PubMed] [Google Scholar]
- 37.Savransky V, Jun J, Li J, et al. Dyslipidemia and atherosclerosis induced by chronic intermittent hypoxia are attenuated by deficiency of stearoyl coenzyme A desaturase. Circ Res. 2008;103:1173–1180. doi: 10.1161/CIRCRESAHA.108.178533. [DOI] [PMC free article] [PubMed] [Google Scholar]
- 38.Cohen P, Miyazaki M, Socci ND, et al. Role for stearoyl-CoA desaturase-1 in leptin-mediated weight loss. Science. 2002;297:240–243. doi: 10.1126/science.1071527. [DOI] [PubMed] [Google Scholar]
- 39.Gutiérrez-Juárez R, Pocai A, Mulas C, et al. Critical role of stearoyl-CoA desaturase-1 (SCD1) in the onset of diet-induced hepatic insulin resistance. J Clin Invest. 2006;116:1686–1695. doi: 10.1172/JCI26991. [DOI] [PMC free article] [PubMed] [Google Scholar]
- 40.Jun J, Savransky V, Nanayakkara A, et al. Intermittent hypoxia has organ- specific effects on oxidative stress. Am J Physiol Regul Integr Comp Physiol. 2008;295:R1274–R1281. doi: 10.1152/ajpregu.90346.2008. [DOI] [PMC free article] [PubMed] [Google Scholar]
- 41.Savransky V, Reinke C, Jun J, et al. Chronic intermittent hypoxia and acetaminophen induce synergistic liver injury in mice. Exp Physiol. 2009;94:228–239. doi: 10.1113/expphysiol.2008.044883. [DOI] [PMC free article] [PubMed] [Google Scholar]
- 42.Diehl AM. Lessons from animal models of NASH. Hepatol Res. 2005;33:138–144. doi: 10.1016/j.hepres.2005.09.022. [DOI] [PubMed] [Google Scholar]
- 43.Lin HZ, Yang SQ, Chuckaree C, et al. Metformin reverses fatty liver disease in obese, leptin-deficient mice. Nat Med. 2000;6:998–1003. doi: 10.1038/79697. [DOI] [PubMed] [Google Scholar]
- 44.Saxena NK, Ikeda K, Rockey DC, Friedman SL, Anania FA. Leptin in hepatic fibrosis: evidence for increased collagen production in stellate cells and lean littermates of ob/ob mice. Hepatology. 2002;35:762–771. doi: 10.1053/jhep.2002.32029. [DOI] [PMC free article] [PubMed] [Google Scholar]
- 45.Browning JD, Horton JD. Molecular mediators of hepatic steatosis and liver injury. J Clin Invest. 2004;114:147–152. doi: 10.1172/JCI22422. [DOI] [PMC free article] [PubMed] [Google Scholar]
- 46.Carmiel-Haggai M, Cederbaum AI, Nieto N. A high-fat diet leads to the progression of non-alcoholic fatty liver disease in obese rats. FASEB J. 2005;19:136–138. doi: 10.1096/fj.04-2291fje. [DOI] [PubMed] [Google Scholar]
- 47.Xu J, Long YS, Gozal D, Epstein PN. Beta-cell death and proliferation after intermittent hypoxia: role of oxidative stress. Free Radic Biol Med. 2009;46:783–790. doi: 10.1016/j.freeradbiomed.2008.11.026. [DOI] [PubMed] [Google Scholar]
- 48.Drager LF, Lopes HF, Maki-Nunes C, et al. The impact of obstructive sleep apnea on metabolic and inflammatory markers in consecutive patients with metabolic syndrome. PLoS ONE. 2010;5:e12065. doi: 10.1371/journal.pone.0012065. [DOI] [PMC free article] [PubMed] [Google Scholar]
Associated Data
This section collects any data citations, data availability statements, or supplementary materials included in this article.


