

Abstract
With spontaneous elongation of the CAG repeat in the R6/2 transgene to ≥335, resulting in a transgene protein too large for passive entry into nuclei via the nuclear pore, we observed an abrupt increase in lifespan to >20 weeks, compared to the 12 weeks common in R6/2 mice with 150 repeats. In the ≥335 CAG mice, large ubiquitinated aggregates of mutant protein were common in neuronal dendrites and perikaryal cytoplasm, but intranuclear aggregates were small and infrequent. Message and protein for the ≥335 CAG transgene were reduced to one-third that in 150 CAG R6/2 mice. Neurological and neurochemical abnormalities were delayed in onset and less severe than in 150 CAG R6/2 mice. These findings suggest that polyQ length and pathogenicity in Huntington’s disease may not be linearly related, and pathogenicity may be less severe with extreme repeats. Both diminished mutant protein and reduced nuclear entry may contribute to phenotype attenuation.
Keywords: CAG repeats, Huntington’s disease, Aggregation, Nuclear entry, Pathogenesis, Striatum, R6/2 mouse
Introduction
The relationship of CAG repeat length to pathogenicity has received attention since the identification of the HD mutation. Data on HD victims show that age of onset is earlier (Huntington’s Disease Collaborative Research Group, 1993; Stine et al., 1993) and disease course more rapid and pernicious in individuals with longer repeats (Furtado et al., 1996; Penney et al., 1997; Rosenblatt et al., 2006). In vitro studies reinforce this conclusion, by showing increasing toxicity of the mutant protein with increasing polyQ length (Hackam et al., 1998a,b; Martindale et al.,1998; Aronin et al.,1999), and similar results have been obtained with transgenic animal models of HD (Mangiarini et al., 1996; Hodgson et al., 1999; Schilling et al., 1999; Shelbourne et al., 1999; Wheeler et al., 2000; Laforet et al., 2001; Lin et al., 2001). Although polyQ lengths beyond 150 have rarely been examined in experimental models of HD (Hockly et al., 2005; and Stack et al., 2005), the view that there is a linear relationship between polyQ length and pathogenicity has been favored by the findings that repeat lengths beyond 150 are pathogenic in other trinucleotide repeat disorders and that the avidity of mutant protein aggregation increases with repeat length (Li and Li, 1998; Martindale et al., 1998; Narain et al., 1999; Zoghbi and Orr, 2000; Chen et al., 2002; Barton et al., 2007).
The possible role of mutant huntingtin aggregation in HD came to light with the first of the HD transgenic mice, the R6/1 and R6/2 (Mangiarini et al., 1996; Davies et al., 1997). Both were created with a 1.9 kb genomic fragment containing promoter sequences and exon 1 of a mutant human HD gene, and both displayed a progressive neurological phenotype. The transgene in the original R6/2 mice possessed 144 CAG repeats, and these R6/2 mice showed the more severe phenotype of the two and were reported to typically die at 12–15 weeks. Prominent ubiquitinated mutant huntingtin-containing neuronal intranuclear inclusions (NII) were seen to form in nearly all neurons by 8–10 weeks in R6/2 mice, and more slowly in R6/1 mice (Davies et al., 1997; Meade et al., 2002). The observations that NII formation in these mice correlates with development of neurological and neurochemical abnormalities (Mangiarini et al., 1996; Davies et al., 1997; Cha et al., 1998; Carter et al., 1999; Lione et al., 1999; Morton et al., 2000; Meade et al., 2002; Weiss et al., 2008), and that NIIs form in HD victims as well (DiFiglia et al., 1997; Gutekunst et al., 1999; Maat-Schieman et al., 1999; Sieradzan et al., 1999), raised the possibility that NIIs might be a key means by which the mutant protein causes neuronal injury in HD. Several in vitro and in vivo studies, however, have raised doubts about the direct contributions of NIIs to neuronal injury (Kim and Tanzi, 1998; Saudou et al., 1998; Sisodia, 1998; Kuemmerle et al., 1999; Mastroberadino et al., 2002; Arrasate et al., 2004). The contributions of extranuclear versus nuclear sites of action of mutant protein to HD pathogenesis also remain unclear (Yang et al., 2002; Schilling et al., 2004; Slow et al., 2005).
We report here on a spontaneous CAG-repeat elongation of the transgene in the R6/2 model of HD to ≥335, which extends the lifespan of these mice to >20 weeks. Our findings indicate that mutant huntingtin with an extremely long polyQ tract is hindered in its nuclear entry and is expressed at diminished levels, with pathogenicity resultingly diminished. Nonetheless, neurochemical abnormalities in the striatum in these mice resemble those in HD, indicating that a cytoplasmic action of the mutant protein may also contribute to HD progression.
Materials and methods
R6/2 mice, which bear a transgene for the 5′ end of the human HD gene with about 150 CAG repeats and including the promoter region, were originally obtained from JAX (Bar Harbor, ME) in fall of 1997. A colony was maintained by breeding R6/2 mice with CBA×C57BL/6 F1 (B6CBAF1) mice, thereby obtaining offspring that were heterozygous for the transgene, and wild-type littermates. After our R6/2 mice mutated into R6/2x mice, a new R6/2 colony was founded with mice from JAX in early 2003.
Genotyping and PCR
Mice were genotyped by PCR-based amplification (Mangiarini et al., 1996; Meade et al., 2002), using genomic DNA extracted from tail biopsies, to distinguish transgene-bearing mice from their wild-type littermates. Primers for the part of the transgene that lie 5′ to the CAG repeat were used to identify mice possessing any CAG repeat variant of the transgene (5′-CGG CTG AGG CAG CAG CGG CTG T-3′ and 5′-GCA GCA GCA GCA GCA ACA GCC GCC ACC GCC-3′), yielding a 170 bp PCR product. Genotyping was carried out as described previously (Meade et al., 2002). To assess the size of the CAG repeat region of the transgene, a second PCR analysis was conducted using a primer pair that amplified across the CAG repeat (5′-CCG CTC AGG TTC TGC TTT TA-3′ and 5′-GGC TGA GGA AGC TGA GGA G-3′). For this PCR amplification, a GC-rich PCR system (Roche, Indianapolis, IN) was used, following manufacturer’s instructions. Amplification was carried out in the following cycle conditions: at 94 °C for 30 s, 58 °C for 30 s, and 68 °C for 90 s, for 40 cycles, followed by a final extension at 68 °C for 7 min.
Sequencing
Total genomic DNA was obtained from fibroblasts of two embryonic day 14.5 R6/2x embryos (i.e. transgene-possessing offspring of an R6/2x parent). The region containing the expanded CAG repeat was amplified by PCR as described above. A PCR product of about 1.4 kb was derived from the R6/2x fibroblasts, purified and both strands sequenced to determine the nature of the expansion of the transgene, using as primers 5′-CCG CTC AGG TTC TGC TTT TA-3′ and 5′-GGC TGA GGA AGC TGA GGA G-3′. We also used the following internal primers to reconfirm, CAG5: 5′-AAG CTG ATG AAG GCC TTC GAG T-3′, and CAG4: 5′-GCG GTG GCG GCT GTT GCT G-3′. Automated DNA sequencing was accomplished with an ABI Model 3100 Genetic Analyzer.
Western blotting
Total protein extract was obtained from forebrain of wild-type, R6/2 and R6/2x mice in buffer containing 10 mM HEPES pH8.3; 1.5 mM MgCl2; 1 mM DTT and proteinase inhibitor cocktail (Roche). Protein concentration was determined by the Bradford Assay (BIO-RAD, Hercules, CA). Approximately 50 μg of protein was separated by SDS-PAGE (12%) and transferred to nitrocellulose membranes. The membranes were blocked in 5% non-fat milk in PBS for 1 h at room temperature and probed overnight at 4 °C with antibodies raised against PolyQ (1C2, Chemicon, Temecula, CA, 1:5000), huntingtin N-terminus (either Ab1 at 0.75 μg/ml or S830 at 1/3000) (DiFiglia et al., 1995; Bhide et al., 1996; Sathasivam et al., 2001), or beta-tubulin (Chemicon, 1:2000), washed in PBS containing 0.2% Tween, and incubated with secondary antibodies at room temperature for 1 h. The membranes were washed in PBS containing 0.2% Tween, and protein bands were visualized by chemiluminescence (Pierce, Rockford, IL) and autoradiography.
Quantitative PCR (qPCR)
Total RNA was isolated from the brains of wild-type, R6/2 and R6/2x mice (three of each) using RNA-Stat60 made by Tel-test Inc (Friendswood, TX) following the manufacturer’s specifications. The CAG repeat length for the HD transgene in the mutant mice was determined as described above. All RNA (1 μg) samples were converted to cDNA with the High Capacity cDNA Archive Kit from Applied Biosystems. Real-time quantitative PCR was performed on a Roche LightCycler 480 instrument utilizing SyBr green and relative quantification by the DDCt method, and carried out at the Molecular Resources Center of the University of Tennessee Health Science Center. The primers specific for human exon 1 were CCGCTCAGGTTCTG-CTTTTA and AGGCCTTCATCAGCTTTTCC. These primers were designed with primer 3 software (http://frodo.wi.mit.edu/cgi-bin/primer3/primer3_www.cgi) to be specific for human exon 1 and tested utilizing genomic DNA from transgenic and normal animals. Primers for the β-tubulin internal standard were GCGCATCAGCGTATACTACAA and TTCCAAGTCCACCAGAATGG. Primers for the cyclophilin internal standard were ATGGTGAAAAACCTGCCAAA and CATCCTCAGGGAAGTCTGGA. Both internal primer standards were designed by Universal Probe Library software (www.universalprobelibrary.com). Efficiency for each primer pair was assessed and found to be indistinguishable across the WT, R6/2 and R6/2x samples. Real-time quantitative PCR was performed utilizing triplicate samples in all experiments and the entire experiment repeated twice.
Northern analysis
RNA was isolated as described above. RNA (12 μg) was fractionated on 1% agarose MOPS/sodium acetate/EDTA gels containing formaldehyde. RNA was then transferred to nylon membranes in 10×SSC and blots were hybridized with a 32P-labelled randomly primed DNA probe corresponding to HD exon 1. The probe was an RT-PCR product of 345 bp corresponding to a part of the human exon 1 (positions 12–356 of the human HD mRNA, accession number L12392). The probe was amplified using the oligos HD1forward: GGCAGAACCTGCGGGGGCA, HD3reverse: AGGGACTCGAAGGCCTTCATC.
In situ hybridization histochemistry
The brains of six R6/2x mice that were sacrificed at severe morbidity (mean repeat=380 and mean age 31 weeks), and of four wild-type age-matched littermate mice were frozen and sectioned using a cryostat, and in situ hybridization histochemistry for preproenkephalin (PPE) and preprotachykinin (PPT) mRNA carried out using 35S-labeled oligonucleotide probes, as described previously (Sun et al., 2002). The PPE antisense probe sequence was: 5′-ATC TGC ATC CTT CTT CAT GAA ACC GCC ATA CCT CTT GGC AAG GAT CTC-3′, and the PPT antisense probe sequence was: 5′-TCG GGC GAT TCT CTG AAG AAG ATG CTC AAA GGG TCT CGG CAT TGC CTC-3′. Signal intensity in striatum for these probes was quantified from film autoradiograms as described previously (Sun et al., 2002).
Immunohistochemistry
Under avertin anesthesia (0.2 ml/g body weight), R6/2, R6/2x and wild-type mice were perfused transcardially with 6% dextran in 0.1 M sodium phosphate buffer at pH7.4 (PB), followed by 4% paraformaldehyde, 0.1 M lysine-0.1 M sodium periodate in 0.1 M PB. The brains were removed, stored overnight at 4 °C in 20% sucrose/10% glycerol, and sectioned frozen in the transverse plane at 35 μm on a sliding microtome. Immunolabeling to visualize aggregates in R6/2x mice was carried out using a mouse monoclonal antibody against ubiquitin (Chemicon) or a mouse monoclonal antibody against the N-terminus of huntingtin (EM48, Chemicon), employing immunofluorescence or peroxidase-antiperoxidase (PAP) procedures described previously (Meade et al., 2002). To detect neurochemical abnormalities, immunolabeling was performed using a rabbit polyclonal anti-GFAP or using a mouse monoclonal anti-NeuN. The specificity and efficacy of these antibodies has been shown previously (Askanas et al., 1992; Mullen et al., 1992; Wolf et al., 1996; Spillantini et al., 1998; Li et al., 1999; Tekkok and Goldberg, 2001). Immunohistochemical double-labeling for ubiquitin and NeuN was performed using simultaneous immunofluorescence as described previously (Meade et al., 2002), using a rabbit polyclonal anti-ubiquitin (DakoCytomation Inc., Carpinteria, CA) and the mouse monoclonal anti-NeuN, for the purpose of determining the intracellular compartment possessing ubiquitinated aggregates of mutant protein. The specificity and efficacy of the rabbit anti-ubiquitin has been described previously (Josephs et al., 2004; Paviour et al., 2004). The double-labeling sections were subsequently incubated in ALEXA488-conjugated donkey anti-mouse IgG and ALEXA594-conjugated donkey anti-rabbit IgG (Molecular Probes, Eugene, OR). In other studies, aggregates were detected by immunofluorescence with either mouse anti-ubiquitin or EM48 (using ALEXA594-conjugated secondary antibodies), and neuronal nuclei visualized by coverslipping with 1 μM Sytox (Molecular Probes, Eugene, OR), a high affinity nucleic acid fluorescent stain that has an excitation/emission spectra similar to that of ALEXA488. To quantify the relationship between CAG repeat length and the distribution and frequency of aggregates in cortex and striatum, we used NIH Image J to analyze images (3–4 per mouse per region) from morbid mice with repeats ranging from 150 to 400, with images collected using a Bio-Rad MRC-1000 confocal laser scanning microscope (CLSM). To analyze the pattern of aggregation formation over time in cortex and striatum of R6/2x mice, we used NIH Image J to analyze images (3–4 per mouse per region) from R6/2x mice (with about 400 repeats) at a range of ages, with images collected using CLSM.
Volumetric analysis
To evaluate cortical and striatal shrinkage, the Cavalieri method was used (Zhang and Oorschot, 2006) to determine the volume of the telencephalon, cerebral cortex, lateral ventricle, and striatum for the rostral telencephalon in 13 morbid R6/2x mice and 13 age-matched WT mice (32.85 vs 32.31 weeks of age, respectively). For each mouse, an image of each section in a one-in-six series from the rostral telencephalic pole to the level of the anterior commissure, at which levels the lateral ventricles are narrow in normal mice, was captured at high resolution using a MikroTek II scanner. NIH Image was used to measure the areas occupied by the entire telencephalon, the cerebral cortex, the lateral ventricles, and the striata, as described previously (Reiner et al., 2007). Section thickness and spacing were used to determine the volume of each structure from the areal measurements in the cross-sections. Cortical, ventricular, and striatal volume were then expressed as a percent of total rostral telencephalic volume.
Electron microscopy
R6/2x, R6/2 and wild-type littermates were anesthetized, and transcardially perfused as described previously (Lei et al., 2004). The brains were removed, postfixed overnight without glutaraldehyde, and sectioned at 50 μm with a vibratome. Sections were immunolabeled with EM48 or anti-ubiquitin to visualize aggregates, as described above. The sections were then postfixed in 2% osmium tetroxide, dehydrated, impregnated with 1% uranyl acetate, and flat-embedded in Spurr’s resin (Electron Microscopy Sciences, Fort Washington, PA). Pieces of cortex or striatum were then cut from the sections, glued to carrier blocks, and ultrathin sections cut with a Reichert ultramicrotome. The sections were mounted on mesh grids, stained with lead citrate and uranyl acetate, and viewed with a JEOL 1200 electron microscope.
Results
Behavioral and genotypic characterization
We noticed an increase in lifespan in our R6/2 colony to over 20 weeks, and a slowing of symptom progression, in the Fall of 2002. Due to their extended lifespan, we dubbed these mice, R6/2x, to distinguish them from typical R6/2 mice. Despite their greater lifespan, these mice eventually became morbid, and in the days prior to death showed the weight loss and neurological signs characteristic of R6/2 mice at morbidity (e.g. foot clasping when suspended by the tail, a resting tremor, poor balance, and repetitive stroking of the nose and face). The weight at severe morbidity in an early cohort of twenty R6/2x mice (operationally defined as surviving >20 weeks) was 53% of age-matched wild-type at a mean age of 29.1 weeks, and core body temperature was reduced at severe morbidity to 91.6% of wild-type. Seizures, which are observed in some R6/2 mice (Mangiarini et al., 1996), were not observed in R6/2x mice. With subsequent generations, R6/2x lifespan progressively increased beyond 30 weeks, and neurological symptoms progressed yet more slowly from onset to mortality. Behavioral changes in R6/2x mice compared to R6/2 mice have been more thoroughly assessed by Morton et al. (2008). Their work shows that behavioral abnormalities in R6/2x mice are similar to those in R6/2 mice but slower in onset and course.
We investigated the possibility that an alteration in the transgene might account for the elongated lifespan. In a series of R6/2 and R6/2x mice (with R6/2x mice again operationally defined as surviving >20 weeks), we carried out PCR using a primer pair that amplified across the CAG repeat of the transgene, with a 130 CAG-repeat bearing fragment represented by a 611 bp product. The R6/2x mice showed elongation of their transgene PCR product to 1250–1400 bp (Fig. 1A), suggesting the CAG repeat to have increased to >325, and to as high as 400 in some R6/2x mice. In mice born at different times from 2000 until 2003, we noted that an elongation to 700–900 bp (160–225 CAG repeats) of the CAG-spanning PCR product appears to have occurred already in mice born in 2001, without noteworthy change in longevity (Fig. 1A). Other investigators have also noted that CAG repeats in the 160–225 range do not greatly affect the phenotype of R6/2 mice (Hockly et al., 2005; Stack et al., 2005; Morton et al., 2008).
Fig. 1.

Molecular characterization of the transgene in R6/2x mice. (A) Primers specific to the 5-prime end of exon 1, 5-prime to the CAG repeat, detected a 170 bp fragment that indicates the presence of the R6/2 transgene in a series of R6/2 and R6/2x mice born at different times. Wild-type and water controls lack the band identifying the presence of the transgene. A second primer pair was used that amplified across the CAG repeat region of the transgene, with a 130 CAG repeat fragment represented by a 611 bp band. The results show progressive expansion of the CAG repeat region over time in our R6/2 colony, culminating in the emergence of the long-lived R6/2x mice in 2002. (B) Analysis of mutated transgenic protein by Western blot, as detected by the 1C2 antibody against polyglutamine or the Ab1 antibody against the N-terminus of huntingtin shows the R6/2x transgenic protein is expressed and is larger than the R6/2 protein product. Note that although the predicted sizes are 25 kDa and 52 kDa for R6/2 and R62/x transgenic proteins, respectively, both proteins migrate higher than expected due to the presence of the large polyglutamine tracts (Mangiarini et al., 1996). (C) A section of the CAG repeat of the R6/2 transgene in a representative R6/2x mouse is shown. The CAG repeat region of the transgene was amplified and sequenced in two representative mutant mice from an R6/2x litter to determine the extent and purity of the CAG repeat expansion. A 1.4 kb PCR product was purified and sequenced from either direction. While neither PCR product spanned the entire CAG stretch, each spanned more than half the stretch and together indicated that the R6/2 transgene in these two mice possessed an expansion of the CAG stretch to about 400 consecutive uninterrupted repeats.
PCR revealed that the CAG repeat length varied among individuals in any given R6/2x litter, as well as from generation to generation. Analysis of a set of R6/2 and R6/2x mice (n=30) allowed to live to severe morbidity from several generations spanning the transition from R6/2 to R6/2x revealed that CAG repeat length was significantly and directly correlated (r=0.814) with life span; thus, mice with longer expansions lived longer. The effect of the expansion was small over the 150–300 repeat range, with survival only increasing from 12 weeks at 150 repeats to about 16 weeks at 300 repeats (Fig. 2). At just above 325 repeats, however, a threshold was reached, beyond which survival was much increased, with survival being 20–30 weeks at just over 335 repeats and 30–40 weeks with repeats around 400 (Fig. 2). When two best-fit linear regression lines were fit to the data for these 30 mice, the intersection of the two lines occurred at an age of 21.2 weeks and 337.0 CAG repeats (Fig. 2). Thus, the abrupt change in phenotype occurred at about 335 repeats.
Fig. 2.
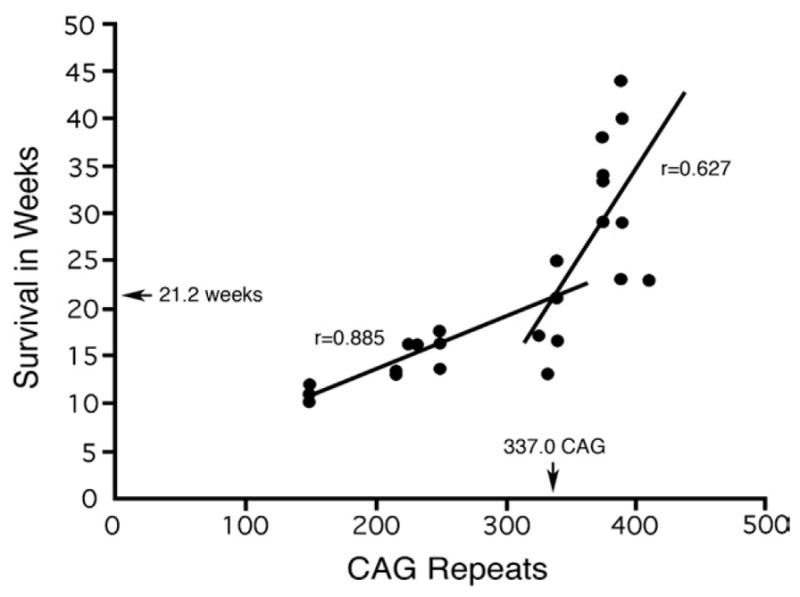
Plot of survival in weeks of mice bearing the R6/2 transgene, as a function of the size of the CAG repeat expansion in that transgene. The graph shows an abrupt increase in survival at about 335 repeats. Note that animals were sacrificed as they reached severe morbidity. Best fit linear regression lines were fit to the flat and rising portions of the survival data, and the linear correlations shown for these segments of the data were highly significant. The intersection of these two lines predicts the CAG repeat and age at which the abrupt transformation in phenotype occurred.
To determine the nature of the expansion in the CAG repeat-bearing part of the transgene, a 1.4 kb PCR product spanning this region was purified and sequenced from two R6/2x embryos. The analysis revealed that the 1.4 kb PCR product from these two mice possessed a pure CAG stretch of about 400 repeats (Fig. 1C). Note that PCR product was sequenced from both strands in this analysis (see Materials and methods), because the large size of the repeat and its repetitive nature resulted in a difficulty in sequencing directly across the entire length of the repeat. Our finding of a 400 CAG repeat in these two mice is consistent with the magnitude of the transgene elongation indicated by the PCR analysis, and suggests that the mutation in R6/2x mice associated with the notably increased lifespan was an expansion of the repetitive CAG stretch of the transgene to ≥335 repeats.
In principle, however, the possibility existed that a fortuitous mutation lying outside the R6/2x transgene conferred longevity, and the CAG repeat expansion only spuriously correlated with longevity. If this were the case, we would expect that the R6/2x CAG expansion and the longevity trait would have different patterns of segregation across a series of generations. In over 8 generations (>100 R6/2x offspring), however, we never observed mice with ≥335 CAG repeats that showed the typical R6/2 12–15 week lifespan. This argues that either the CAG expansion is indeed responsible for the increased lifespan of R6/2x mice, or that the fortuitous mutation is so closely linked to the R6/2x transgene that they did not segregate over 8 generations. In the latter case, the putative mutation should rescue the R6/2 phenotype as well. To further address this possibility, we crossed R6/2 and R6/2x mice. In the seven litters of offspring of such matings, mice possessing either only the normal R6/2 repeat or both the R6/2 and R6/2x mutant transgenes displayed the typical R6/2 12–15 week lifespan, indicating that neither the ≥335 CAG repeat transgene nor any nearby genes increase lifespan in the presence of an R6/2 transgene bearing a CAG repeat length of about 150. These findings support our interpretation that the CAG expansion alone is responsible for the increased longevity.
Expression of expanded R6/2 transgene
Western blot analysis of brain extracts from R6/2x mice (with 390 repeats) showed that the expanded transgene protein is expressed, is much larger than the transgene protein product from R6/2 mice with about 150 CAG repeats, and is enriched in polyQ antigenic sites (Fig. 1B). In the Western blot analyses, the results obtained with the two polyclonal antibodies against the N-terminal region of huntingtin (htt) were similar — the intensity of the R6/2x mutant protein band was about 1/3 of that for the R6/2 mutant protein band, as measured by densitometry. The migration of the R6/2x protein as an apparently larger protein than predicted is consistent with the altered protein conformation stemming from the expanded polyglutamine stretch, as also observed by others for htt N-terminal fragments carrying expanded polyQ tracts (Rigamonti et al., 2000). This altered conformation could, in principle, also affect the efficiency of transfer of the protein to the Western blot membrane and decrease the exposure of the epitope recognized by anti-htt N-terminal antibodies. As a consequence, the finding that the R6/2x htt protein is 1/3 the intensity of the R6/2 htt band when anti-N-terminus htt is used cannot, by itself, be taken as definitive evidence that mutant huntingtin levels are less in R6/2x than in R6/2 mice. With the anti-polyQ antibody 1C2, an opposite result to those with the antibodies against the amino-terminus of htt was observed — the R6/2x mutant htt band was approximately 5–6 fold more intense than the R6/2 mutant htt band (Fig. 1B). Since 1C2 binds to polyQ tracts, a longer polyQ tract such as that in R6/2x mice would be expected to yield more 1C2 binding per mutant huntingtin molecule, leading to more intense labeling even with no increase in number of huntingtin molecules. Thus, the Western blot data alone do not allow an unambiguous conclusion about whether transgene protein levels are higher, lower or the same in R6/2x mice as in R6/2, although their simplest interpretation is that mutant protein is reduced in R6/2x mice.
Because of these uncertainties, qPCR and Northern blot analyses were also used to assess expression of the R6/2x transgene compared to the R6/2 transgene. The qPCR studies confirmed that the expression of the mutant transgene in R6/2x mice (with 410 CAG repeats) was significantly less than that in R6/2 mice (26.1% pf R6/2 with a cyclophilin standard and 29.0% of R6/2 with a beta-tubulin standard). Similarly, Northern analysis of total RNA from adult brains obtained from the same wild-type, R6/2 and R6/2x mice (n=3 for each) as used for the qPCR revealed that R6/2x transgene expression is only 36.2% that in the R6/2 (Fig. 3).
Fig. 3.
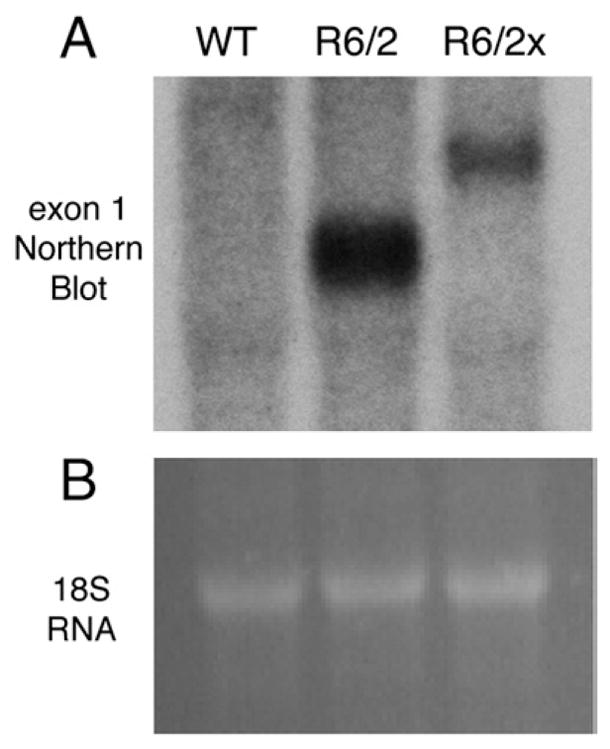
Northern blot analysis of total RNA from adult brains obtained from wild-type (WT), R6/2 and R6/2x mice. Image A shows a blot hybridized with a 32P-labelled randomly primed DNA probe corresponding to HD exon 1. The probe revealed the presence of transgene expression in both the R6/2 and R6/2x samples, but the transgene was of a higher molecular weight and expressed at a lower level in the R6/2x than the R6/2 mouse. Densitometric analysis revealed that R6/2x expression was three-fold less than that in R6/2. Image B presents a region of the RNA gel containing the 18S rRNA species stained with ethidium bromide showing that sample loading for each of the three mice shown in image A was the same.
Aggregate formation
Immunolabeling of brain tissue with either EM48 against huntingtin N-terminus or with anti-ubiquitin revealed that ubiquitinated extranuclear aggregates of mutant huntingtin transgene protein were widespread in the neuropil and neuronal cytoplasm in cortex and striatum of R6/2x mice sacrificed at morbidity (Fig. 4). Throughout brain their abundance appeared to be proportional to the regional abundance of NIIs in R6/2 mice. The neuropil aggregates were typically oblong in shape and larger ones were 2–4 μm in length. Remarkably, the large, distinctly round NIIs characterizing nearly all neurons of R6/2 brain were not evident. Double-label immunoflourescence for NeuN and ubiquitin, or Sytox nuclear staining combined with immunofluorescence for ubiquitin or N-terminal huntingtin, confirmed that ubiquitinated huntingtin-containing aggregates were mainly extranuclear in R6/2x (i.e. mice with ≥335 CAG repeats) cortex and striatum, though a minority of cortical and striatal neurons contained small nuclear aggregates (Figs. 5, 6). The nuclear aggregates that were seen in R6/2x mice, however, were about half the size of the NIIs in R6/2 mice, and they were also not as prominently rounded. Image analysis of the relative nuclear versus extranuclear abundance of the aggregates in cortex and striatum for a cohort of 16 severely morbid mice with CAG repeats ranging from 150 to 400 revealed that in morbid R6/2x mice (≥335 CAG repeats) about 92% of the total aggregate load was extranuclear and only about 25% of neurons possessed nuclear aggregates (Tables 1, 2; Fig. 7). By contrast, in R6/2 mice (150 CAG repeats), 95% of neurons in cortex and striatum possessed large rounded NIIs (Meade et al., 2002) and only about 20% of the total aggregate volume was extranuclear, with the extranuclear aggregates tending to be small (Tables 1, 2; Fig. 7). Mice with 250 to 325 CAG repeats showed an intermediate phenotype, with the aggregate load being equally divided between extranuclear aggregates and NIIs (Tables 1, 2; Fig. 7). Moreover, in mice with an intermediate CAG repeat length, about 75% of neurons possessed NIIs and these NIIs were the same size as in R6/2 mice with 150 CAG repeats. For the sample of 16 mice with repeats ranging from 150 to 400, the abundance of aggregates (irrespective of subcellular location) tended to increase with CAG repeat size for both cortex and striatum, and was about twice as great for morbid R6/2x as for morbid R6/2 mice (Tables 2, 3; Fig. 7). Moreover, nuclear aggregate size and frequency declined notably with CAG repeat size increase.
Fig. 4.

Images showing aggregates in cortex and striatum of 11 week old R6/2 (A, C, E, G) and 32 week old R6/2x (B, D, F, H) mice. Aggregates were detected by immunolabeling for the N-terminus of huntingtin using the EM48 antibody. Similar labeling was obtained with anti-ubiquitin. Note that aggregates are localized to neuronal nuclei in the R6/2 mice, as more clearly seen in the higher power views in E and G, and the aggregates evident in R6/2 mice represent typical NIIs. By contrast, in the R6/2x mouse, the aggregates are more numerous, diverse in size, and in many cases can be seen to reside outside cell bodies. Both mice were sacrificed at morbidity. Images A, B, C and D are at the same magnification, while images E, F, G and H are at the same magnification.
Fig. 5.

Merged CLSM images showing the location of aggregates in cortex and striatum of a 12 week old R6/2 mouse and a 23 week old R6/2x mouse, with respect to cell nuclei. Aggregates were detected by immunolabeling for the N-terminus of huntingtin using the EM48 antibody (as visualized with ALEXA594-conjugated donkey anti-mouse IgG), while neuronal nuclei were detected with the Sytox nuclear stain. Immunolabeling detects aggregated (red) mutant protein in Sytox-stained (green) neuronal nuclei in R6/2 mice but in the neuropil in R6/2x mice. These results indicate that the expanded mutant transgene protein avoids nuclear entry and predominantly forms extranuclear aggregates in R6/2x mice. Both mice were sacrificed at morbidity. Magnification is the same in all images.
Fig. 6.

Merged CLSM images showing the location of aggregates with respect to neuronal nuclei, in striatum of an 11 week old R6/2 mouse in comparison to 23 week, 32 week, and 38 week old R6/2x mice. Aggregates were detected by immunolabeling for the N-terminus of huntingtin using EM48 (as visualized with ALEXA594-conjugated donkey anti-mouse IgG), while nuclei were detected with the Sytox nuclear stain. Immunolabeling detects aggregated (red) mutant protein in Sytox-stained (green) neuronal nuclei in R6/2 mice, but mainly outside of nuclei in R6/2x mice. Note that aggregates are consistently more abundant in the R6/2x mice than in the 11 week old R6/2 mouse. All mice were sacrificed at morbidity. Magnification the same in all images.
Table 1.
Nuclear and extranuclear aggregate load in cortex and striatum in R6/2x mice (≥335CAG) compared to standard R6/2 mice (150CAG) and R6/2 mice with an intermediate expansion (261CAG)
| CAG mouse group | Age in weeks | Mean CAG repeat | % Field in cortex with aggregates | % Field in cortex with nuclear aggregates | % Field in cortex with extranuclear aggregates | % of cortical aggregate load in nuclei |
|---|---|---|---|---|---|---|
| Standard R6/2 (n=3) | 10.7±0.408 | 150 | 0.309%±0.044 | 0.264%±0.048 | 0.045%±0.012 | 84.96%±4.64 |
| R6/2 with moderate expansion (n=6) | 14.6±0.725 | 261.3±22.75 | 0.494%±0.074 | 0.246%±0.041 | 0.248%±0.038 | 48.84%±3.02 |
| R6/2x (n=7) | 24.9±2.17 | 357.1±8.29 | 0.409%±0.070 | 0.024%±0.008 | 0.386%±0.070 | 7.96%±4.50 |
| CAG mouse group | Age in weeks | Mean CAG repeat | % Field in striatum with aggregates | % Field in striatum with nuclear aggregates | % Field in striatum with extranuclear aggregates | % of striatal aggregate load in nuclei |
|---|---|---|---|---|---|---|
| Standard R6/2(n=3) | 10.7±0.408 | 150 | 0.107%±0.011 | 0.074%±0.021 | 0.032%±0.0294 | 72.50%±23.80 |
| R6/2 with moderate expansion (n=6) | 14.6±0.725 | 261.3±22.75 | 0.339%±0.094 | 0.201%±0.065 | 0.136%±0.041 | 50.41%±11.34 |
| R6/2x (n=7) | 24.9±2.17 | 357.1±8.29 | 0.231%±0.057 | 0.017%±0.006 | 0.215%±0.054 | 8.51%±3.74 |
Table illustrating nuclear and extranuclear aggregate load in cortex and striatum in R6/2x mice (≥335 CAG) compared to standard R6/2 mice (150 CAG) and R6/2 mice with an intermediate expansion (261 CAG). Aggregate load is expressed as the percent of the field occupied by aggregates, based on computer-assisted analysis of confocal laser scanning microscope images of material in which aggregates were immunolabeled for ubiquitin and nuclei were visualized with Sytox.
Table 2.
Size and frequency of nuclear aggregates in cortex and striatum of R6/2x mice (≥335CAG) compared to standard R6/2 mice (150CAG) and R6/2 mice with an intermediate expansion (261CAG)
| CAG mouse group | Age in weeks | Mean CAG repeat | % Nuclei in cortex with aggregates | Mean size of cortical aggregates | % Nuclei in striatum with aggregates | Mean size of striatal aggregates |
|---|---|---|---|---|---|---|
| Standard R6/2(n=3) | 10.7±0.408 | 150 | 95.0%±7.58 | 3.11 μm±0.2427 | 95.0%±12.83 | 2.37 μm±0.290 |
| R6/2 with moderate expansion (n=6) | 14.6±0.725 | 261.3±22.75 | 79.1%±6.13 | 3.43 μm±0.306 | 75.8%±16.28 | 2.61 μm±0.555 |
| R6/2x (n=7) | 24.9±2.17 | 357.1±8.29 | 22.4%±6.94 | 1.81 μm±0.268 | 27.9%±12.46 | 1.39 μm±0.305 |
Table illustrating size and frequency of nuclear aggregates in cortex and striatum of R6/2x mice (≥335 CAG) compared to standard R6/2 mice (150 CAG) and R6/2 mice with an intermediate expansion (261 CAG). Analysis is based on confocal laser scanning microscope images of material in which aggregates were immunolabeled for ubiquitin and nuclei were visualized with Sytox. Note that because of the narrow confocal laser scanning microscopy imaging plane that does not encompass the entire nuclear depth of each neuron, nuclear aggregates are not always detected in a given neuron that possesses them if not present in the plane of view. Estimates of nuclear aggregate frequency have therefore been corrected based on prior evidence that about 95% of cortical and striatal neurons in R6/2 mice possess NIIs (Meade et al., 2002).
Fig. 7.

Merged CLSM images showing the location of aggregates with respect to neuronal nuclei, in striatum of a 150 CAG R6/2 mouse, a 225 CAG R6/2 mouse, and a 375 CAG R6/2x mouse. Aggregates were detected by immunolabeling for ubiquitin (as visualized with ALEXA594-conjugated donkey anti-mouse IgG), while nuclei were detected with the Sytox nuclear stain. Note that immunolabeled aggregates (red) are infrequent in Sytox-stained (green) neuronal nuclei in the 375CAG mouse but common in the 150CAG and 225CAG mice. By contrast, extranuclear aggregates predominate in the R6/2x mouse, and both NIIs and extranuclear aggregates are evident in the 225 CAG mouse. All mice were sacrificed at morbidity. Magnification the same in all images.
Table 3.
Age-related changes in nuclear and extranuclear aggregate load in cortex and striatum in R6/2x mice (≥335CAG)
| R6/2x mouse group | Age in weeks | Mean CAG repeat | % Field in cortex with aggregates | % Field in cortex with nuclear aggregates | % Field in cortex with extranuclear aggregates | Total % of aggregate load in nuclei in cortex |
|---|---|---|---|---|---|---|
| Very young (n=2) | 8.0±0.0 | 395.0±21.2 | 0.097%±0.016 | 0.005%±0.007 | 0.091%±0.024 | 5.88%±8.32 |
| Young premorbid (n=3) | 11.5±0.65 | 410.0±0.0 | 0.069%±0.045 | 0.004%±0.005 | 0.065%±0.041 | 4.96%±4.05 |
| Morbid (n=3) | 29.0±3.93 | 380.0±6.13 | 0.503%±0.157 | 0.025%±0.014 | 0.478%±0.145 | 5.11%±1.42 |
| R6/2x mouse group | Age in weeks | Mean CAG repeat | % field in striatum with aggregates | % field in striatum with nuclear aggregates | % field in striatum with extranuclear aggregates | Total % of aggregate load in nuclei in striatum |
|---|---|---|---|---|---|---|
| Very young (n=2) | 8.0±0.0 | 395.0±21.2 | 0.023%±0.006 | 0.006%±0.008 | 0.017%±0.014 | 31.58%±0.014 |
| Young premorbid (n=3) | 11.5±0.65 | 410.0±0.0 | 0.079%±0.045 | 0.017%±0.017 | 0.062%±0.032 | 19.59%±0.032 |
| Morbid (n=3) | 29.0±3.93 | 380.0±6.13 | 0.257%±0.132 | 0.027%±0.017 | 0.231%±0.124 | 4.91%±0.124 |
Table illustrating age-related changes in nuclear and extranuclear aggregate load in cortex and striatum in R6/2x mice, for sets of R6/2x mice with mean ages of 8,11.5 and 29.0 weeks. Aggregate load is expressed as the percent of the field occupied by aggregates, based on computer-assisted analysis of confocal laser scanning microscope images of material in which aggregates were immunolabeled for ubiquitin and nuclei were visualized with Sytox.
Analysis of genotypic R6/2x mice (with repeats ranging from 380 to 410) over an age range of 8–34 weeks (including non-morbid young R6/2x mice) revealed that R6/2-size NIIs were not evident at any age, while cytoplasmic and neuropil aggregates were already evident by 8 weeks (Tables 3, 4). At this same age, nuclear aggregates were infrequent in cortex and striatum (5.76% and 2.47%, respectively, of all neurons) and small (0.72 μm and 0.56 μm, respectively). Extranuclear aggregate load in R6/2x mice at 11.5 weeks (Table 3) was less than half the nuclear aggregate load in 150CAG R6/2 mice at a comparable age (Table 1), based on the percent of the field occupied by aggregates. Overall aggregate abundance in R6/2x mice did not reach the 12-week R6/2 abundance until about 15–20 weeks (Tables 1, 3). These results suggest that aggregates may form more slowly in R6/2x mice than in R6/2 mice, which would be consistent with the reduced mutant protein production in R6/2x mice. The abundance and size of extranuclear aggregates increased dramatically beyond 20 weeks for R6/2x mice, but intranuclear aggregate load did not increase as notably. Thus, while the percent of nuclei with aggregates was as high as 25–30% by 35 weeks of age in the cortex and striatum in R6/2x mice, extranuclear aggregates predominated in R6/2x mice at all ages due to their greater size and abundance. In cortex of R6/2x mice, nuclear aggregate load remained at about 5% throughout mouse lifetime, while in striatum the relative part of the aggregate load in nuclei appeared to decline with age (Table 4). Despite the seemingly slower pace of aggregate formation, the greater overall abundance of aggregates in mice with ≥335 CAG repeat length seems explainable by their longer survival and thus greater duration of time available for aggregate formation. These results show that a high extranuclear aggregate load in R6/2x mice is seemingly endured for many weeks longer than is a lesser nuclear aggregate load in the R6/2 mice, implying nuclear accumulation of truncated mutant protein is more harmful than extranuclear.
Table 4.
Age-related changes in size and frequency of nuclear aggregates in cortex and striatum of R6/2x mice (≥335CAG) compared to R6/2 mice (150CAG)
| R6/2x mouse group | Age in weeks | Mean CAG repeat | % Nuclei in cortex with aggregates | Mean size of cortical nuclear aggregates | % Nuclei in striatum with aggregates | Mean size of striatal nuclear aggregates |
|---|---|---|---|---|---|---|
| Very young (n=2) | 8.0±0.0 | 395.0±21.2 | 5.76%±8.15 | 0.72 μm±1.02 | 2.47%±3.49 | 0.56 μm±0.79 |
| Young premorbid (n=3) | 11.5±0.65 | 410.0±0.0 | 7.69%±9.41 | 0.43 μm±0.56 | 14.3%±8.74 | 1.07 μm±0.68 |
| Morbid (n=3) | 29.0±3.93 | 380.0±6.13 | 21.41%±9.95 | 1.51 μm±0.383 | 36.23%±30.53 | 1.46 μm±0.90 |
| R6/2 mouse group | Age in weeks | Mean CAG repeat | % Nuclei in cortex with aggregates | Mean size of cortical nuclear aggregates | % Nuclei in striatum with aggregates | Mean size of striatal nuclear aggregates |
|---|---|---|---|---|---|---|
| Young premorbid (n=2) | 4 | 150 | 41.42% | 1.26 μm | 53.0% | 1.07 μm |
| Young morbid (n=2) | 9 | 150 | 91.79% | 2.38 μm | 99.0% | 1.73 μm |
| Late morbid (n=2) | 12 | 150 | 93.21% | 2.34 μm | 94.0% | 1.94 μm |
Table illustrating age-related changes in size and frequency of nuclear aggregates in cortex and striatum of R6/2x mice, for sets of R6/2x mice with mean ages of 8,11.5 and 29.0 weeks. Analysis is based on confocal laser scanning microscope images of material in which aggregates were immunolabeled for ubiquitin and nuclei were visualized with Sytox. Note that because of the narrow confocal laser scanning microscopy imaging plane that does not encompass the entire nuclear depth of each neuron, nuclear aggregates are not always detected in a given neuron that possesses them if not present in the plane of view. Estimates of nuclear aggregate frequency have therefore been corrected based on prior evidence that about 95% of cortical and striatal neurons in R6/2 mice possess NIIs (Meade et al., 2002). The R6/2 data shown is from Meade et al. (2002) and CAG repeat lengths for the R6/2 mice are based on sampling of the repeat length common in our colony at the time of the Meade et al. study.
Ultrastructural studies in morbid R6/2x mice confirmed the predominance of cytoplasmic and neuropil aggregates in cortex and striatum (Fig. 8), and revealed they were commonly localized to axons and dendrites, which may explain their elongate shape. Within dendrites, the aggregates tended to cause a localized bulge, partly occluding the process and causing a local distortion in the microtubule array. Both perikaryal cytoplasmic and nuclear aggregates tended to be small, and nuclear aggregates were infrequent at the EM level.
Fig. 8.

Electron micrographic images showing EM48-immunolabeled aggregates in dendrites and perikarya of R6/2x mice (A–D) and in neuronal nuclei (Nu) of R6/2 mice (E, F). Neuropil aggregates (arrows) in R6/2x mice are prominent in dendrites and less conspicuous in perikaryal cytoplasm in R6/2x mice. In R6/2 mice, the aggregates formed large rounded structures (arrowheads) in the nucleus. All mice were sacrificed at morbidity.
Pathology in cortex and striatum
In situ hybridization histochemistry revealed that striatal pre-proenkephalin (PPE) message was significantly reduced (81.7% of wild-type) in six morbid R6/2x mice (p=0.011), while preprotachykinin (PPT) levels remained normal (100.7% of wild-type) (Fig. 9). The reduction in PPE expression was similar to that observed in 4 week-old premorbid R6/2 mice, but much less severe than in morbid 12 week-old R6/2 mice (Cha et al., 1998; Bibb et al., 2000; Luthi-Carter et al., 2000, 2002; Menalled et al., 2000; Sun et al., 2002). Beginning at 20 weeks, a progressive increase in GFAP-immunolabeling of astrocytes was evident in R6/2x cortex and striatum, indicating pathology in these regions (Fig. 10), although the abundance of NeuN-immunolabeled perikarya remained indistinguishable from normal. By contrast, GFAP elevation in cortex and striatum is evident by 12–15 weeks in R6/2 mice with 150 repeats (Figs. 10, 11) (Reiner et al., 2007). These findings suggest that neurochemical pathology is present, but delayed in onset, slowed in progression, and attenuated in severity in R6/2x mice. Volumetric analysis of 13 morbid R6/2x mice (mean age=32.8 weeks; mean CAG repeat=378) revealed that the rostral telencephalon was significantly smaller in R6/2x mice than wild-type (89.8% of WT) (Fig. 12). Additionally, cortex and striatum as a percentage of the telencephalon showed slight but significant shrinkage in R6/2x mice (93.1% and 94.3% of wild-type, respectively) (Fig. 12). Consistent with striatal shrinkage, the lateral ventricle was significantly enlarged in R6/2x mice (174.4% of wild-type). These volumetric changes resemble those we previously observed in 12 week old R6/2 mice (Reiner et al., 2007).
Fig. 9.

Images of coronal sections through rostral striatum showing that striatal PPE mRNA levels, but not PPT mRNA levels, were reduced in R6/2x mice. The R6/2x mouse illustrated had 373 CAG repeats.
Fig. 10.

Images of layer 5 of motor cortex from transverse sections immunostained for GFAP, from an R6/2 mouse that lived 12 weeks (A), an R6/2x mouse (410 CAG) that lived 12 weeks (B), a WT mouse that lived 40 weeks (C), and an R6/2x mouse (410 CAG) that lived 40 weeks (D). Note that GFAP+ astrocytes are evident in the cerebral cortex of the R6/2 mouse and the 40 week-old R6/2x mouse. Dorsal is to the top and magnification is the same in all images.
Fig. 11.

Images of dorsolateral striatum from transverse sections immunostained for GFAP, from an R6/2 mouse that lived 12 weeks (A), an R6/2x mouse (410 CAG) that lived 12 weeks (B), a WT mouse that lived 40 weeks (C), and an R6/2x mouse (410 CAG) that lived 40 weeks (D). Note that GFAP+ astrocytes are evident in the striatum of the R6/2 mouse and the 40 week-old R6/2x mouse. Dorsal is to the top and magnification is the same in all images.
Fig. 12.

Images of transverse sections through the telencephalon slightly rostral to the anterior commissure of a 32 week old wild-type (A) and a 32 week old R6/2x mouse (B). The brains of the R6/2x mice appeared largely normal in gross morphology and cytoarchitecture, but brain size, cortical size and striatal size were slightly less and lateral ventricular size slightly greater in R6/2x than in WT mice. The R6/2x mouse illustrated had a CAG repeat length of 410.
Discussion
We have found that a ≥335 CAG repeat expansion in the R6/2 transgene results in a marked increase in lifespan, slowing of symptom development, diminished mutant protein production, and great reduction in mutant protein aggregates in nuclei. Additionally, Morton et al. (2008) have shown an attenuation of the behavioral phenotype. The reduction in nuclear aggregates may stem from diminished entry into nuclei by the polyQ-expanded transgene protein. Passive entry of proteins into eukaryotic nuclei via the nuclear pore complex is unhindered for proteins less than 35–40 kDa, but precluded above 50 kDa (Görlich and Mattaj, 1996; Hackam et al., 1998a; Suntharalingam and Wente, 2003; Terry et al., 2007). Hindrance of nuclear entry of mutant protein in our ≥335 CAG mice would explain the abrupt decline in nuclear aggregates at a repeat length at which the predicted protein size (about 52 kDa) becomes too large for passive nuclear entry. This interpretation is consistent with the work of Hackam et al. (1998a), who reported that >60 kDa 128CAG huntingtin constructs formed mainly extranuclear aggregates, while ≤40 kDa 128CAG huntingtin constructs formed predominantly nuclear aggregates. The minority of R6/2x neurons that show some nuclear aggregation may reflect limited active nuclear entry by mutant protein into some neurons, or a breakdown of passive entry restrictions. By contrast, in mice with CAG repeat lengths at whose predicted protein size passive nuclear entry is only partly hindered (200–300 CAG), we observed only slightly reduced NII prevalence, and increased extranuclear aggregate prominence. The small size of the R6/2 transgene protein with 144 polyQ (about 25 kDa) explains the avid nuclear entry revealed by the extensive NII formation in the original R6/2 mice (Mangiarini et al., 1996; Davies et al., 1997). Note that the 144 polyQ mutant huntingtin resists nuclear export despite a Tpr (nuclear pore protein translocated promotor region) binding sequence favoring export. The tendency of mutant polyQ protein to rapidly form detergent-insoluble aggregates that prevent its interaction with Tpr appears to account for its resistance to export, as well as for the very low levels of soluble mutant protein in nuclei in mice bearing the R6/2 transgene (Benn et al., 2005; Cornett et al., 2005).
Our findings suggest that NIIs or the nuclear entry they reflect are harmful, since reduction in nuclear aggregation in R6/2x mice was associated with an attenuated phenotype. Using nuclear localization signals to facilitate or nuclear export signals to hinder nuclear accumulation of N-terminal mutant huntingtin, Benn et al. (2005) also found that nuclear accumulation of mutant protein is harmful. Similarly, increased nuclear entry of HprtQ150 protein favors nuclear aggregate formation and accelerates onset of behavioral abnormalities (Jackson et al., 2003), and nuclear entry of mutant ataxin-1 is critical to the phenotype in spinocerebellar ataxia type 1 (Klement et al., 1998). Thus, nuclear accumulation of mutant protein in R6/2 mice is likely to contribute to the more aggressive phenotype in R6/2 than R6/2x mice. Diminished mutant protein production in R6/2x mice may also contribute to the delay in the phenotype in R6/2x mice, by slowing aggregate formation, since prior studies show that mutant gene dose affects neurological disease severity (Narain et al., 1999; Eriksen et al., 2005). Note that at least some cells whose dysfunction contribute to demise in R6/2 and R6/2x mice could reside outside the brain, since heart and muscle atrophy, diabetes, and adipocyte abnormalities occur in R6/2 mice (Hurlbert et al., 1999; Fain et al., 2001; Luthi-Carter et al., 2002; Orth et al., 2003; Ribchester et al., 2004; Mihm et al., 2007).
Determining the extent to which reduced nuclear entry of mutant protein versus reduced expression of mutant protein cause phenotype attenuation in R6/2x mice is not unambiguous. Mangiarini et al. (1996) originally described 3 lines of R6 mice: R6/2 with 144 CAG that survive about 15 weeks, R6/1 mice that have 1/3 as much transgene expression,120 repeats and survive 35 weeks, and R6/5 mice that have 135 repeats, transgene expression similar to R6/2 mice and a normal lifespan. The R6/5 group shows that insertion site, as well as repeat length and expression level, influence phenotype. Under these circumstances, comparison of R6/2x and R6/1 mice (which have similar transgene expression relative to 150CAG R6/2 mice) is complicated by their differing insertion sites. Thus, the fact that R6/1 mice and R6/2x mice have similar survival and similar transgene expression, but differing localization of aggregates (mainly nuclear for R6/1 and mainly extranuclear for R6/2x) cannot be safely used to conclude that reduced expression level mainly accounts for the R6/2x phenotype attenuation. Similarly, Morton et al. (2008) have analyzed homozygous R6/2x mice compared to heterozygous R6/2x mice to assess the impact of expression level on phenotype. They found that homozygous R6/2x mice with CAG repeats around 400 in both transgenes do not show a noteworthy acceleration of phenotype compared to mice with only one 400CAG transgene. This result favors the view that reduced expression level is not the major basis of the R6/2 phenotype attenuation. Homozygous mice with one transgene in the 350CAG range and one in the 400CAG range, however, do show acceleration of phenotype. This result then does favor the view that expression level reduction contributes significantly to the R6/2x phenotype attenuation. Together, the results seem to show a role of both expression level and extranuclear localization in driving the phenotype, with the precise repeat length also being a factor. In any event, prior studies of mutant huntingtin action show that reduced nuclear entry and reduced expression can both diminish pathogenicity (Benn et al., 2005).
The striatal neurochemical abnormalities in R6/2x mice resemble those seen in HD striatum (Glass et al., 2000; Deng et al., 2004) and in R6/2 mice (Cha et al., 1998; Bibb et al., 2000; Luthi-Carter et al., 2000, 2002; Menalled et al., 2000; Sun et al., 2002). The neurochemical abnormalities in morbid R6/2x mice, however, are no more severe than those seen in young non-morbid R6/2 mice. This also seems true of the behavioral abnormalities (Morton et al., 2008). Since nuclear aggregates are far larger and more numerous in non-morbid R6/2 mice at 6 weeks (Meade et al., 2002; Bibb et al., 2000; Sun et al., 2002) than they are at morbidity in R6/2x mice, it seems likely that nuclear accumulation of R6/2x mutant protein is not the basis of their abnormalities. By contrast, extranuclear aggregate formation, which is relatively minimal in R6/2 mice (Li et al., 1999; Morton et al., 2000), is favored in R6/2x mice, and extranuclear aggregates are as common and large by about 20 weeks of age in R6/2x mice as are NIIs in R6/2 mice at 12 weeks of age. Thus, an extranuclear action by the expanded mutant protein may be adequate if given enough time to drive these abnormalities. This is consistent with prior reports on postmortem human tissue that NIIs are scarce in HD cortex and striatum, but extranuclear aggregates common (DiFiglia et al., 1997; Gutekunst et al., 1999; Kuemmerle et al., 1999; Maat-Schieman et al., 1999; Sieradzan et al., 1999). This is also consistent with evidence that suppressing extranuclear aggregate formation with intrabodies in N171-82Q mouse yields phenotypic improvement (Wang et al., 2008). Our results and the work of other investigators thus suggest that although preventing nuclear entry and/or NII formation may be protective (Jackson et al., 2003; Benn et al., 2005), halting nuclear entry will not entirely prevent symptom formation.
Our EM studies indicate that dendrites, in which the aggregates cause local disruptions in microtubules, are a prominent site of extranuclear aggregates in both cortex and striatum. Dendritic aggregates that disrupt local substructure have been noted in cortex and striatum in human HD as well (DiFiglia et al., 1997; Gutekunst et al., 1999; Sapp et al., 1999). Aggregates have also been observed in axons and terminals in HD, notably those of cortical neurons (DiFiglia et al., 1997; Sapp et al., 1999). Given the disruptions in substructure they cause, the extranuclear aggregates may interfere with dendritic and axonal trafficking (Gunawardena and Goldstein, 2005), leading to the dendritic pathologies and axonal dystrophies observed in HD victims and transgenic mice (Graveland et al., 1985; Guidetti et al., 2001; Klapstein et al., 2001; Laforet et al., 2001; Spires et al., 2004). This, in turn, could cause dysfunction of the neurons containing the aggregates, as well as a disturbance in communication between them and their target neurons (Cepeda et al., 2001, 2003; Gauthier et al., 2004). A trafficking disruption would be consistent with the observation that many proteins that interact with mutant huntingtin are cytoplasmic proteins (Faber et al., 1998), the finding that expression of many trafficking and cytoplasmic proteins is altered early in HD (Sipione et al., 2002), and the evidence that microtubule destabilization is toxic and can be driven by mutant huntingtin (Trushina et al., 2003, 2004). An extranuclear role of mutant huntingtin in HD pathogenesis would also be consistent with the low nuclear levels of mutant huntingtin in early HD brain (Dyer and McMurray, 2001), and the evidence that nuclear entry of mutant huntingtin fragments in HD brain is only a late contributor to the injury process (Trushina et al., 2003, 2004). Huntingtin is thought to be a cell membrane-associated scaffolding protein, and the sequence mediating its targeting to the cell membrane appears to reside in its N-terminus (Qin et al., 2004; Atwal et al., 2007). Thus, the aggregation of the mutant exon 1 protein product in dendrites may reflect the normal cellular targeting of wild-type huntingtin. Full-length mutant protein, however, may localize to subcellular compartments that exon 1 protein does not, and thus may exert pathogenic effects at more subcellular sites (La Spada and Taylor, 2003; Yu et al., 2003). Sequestration of wild-type huntingtin and other critical proteins by mutant protein aggregates also may contribute to the functional derangement caused by mutant huntingtin (Velier et al., 1998; Reiner et al., 2003).
Our present results suggest a nonlinear relationship of repeat size to symptoms. Animal studies, in vitro studies and studies of human HD show that repeats progressively less than 150 have a less and less adverse effect on lifespan and/or neuronal survival (Huntington’s Disease Collaborative Research Group, 1993; Stine et al., 1993; Mangiarini et al., 1996; Penney et al., 1997; Hackam et al., 1998a,b; Aronin et al., 1999; Hodgson et al., 1999; Schilling et al., 1999; Shelbourne et al., 1999; Wheeler et al., 2000; Laforet et al., 2001; Lin et al., 2001). Surprisingly, our results show that repeats ≥335 also have a diminishingly adverse effect. Moreover, we found that increase in repeat length from about 175 to 335 as well exerts a steadily less adverse effect on lifespan, although not as much so as expansion beyond 335. Whether CAG repeats beyond 200 are progressively less harmful in HD is uncertain. Repeats above 60 invariably cause the rapidly progressing juvenile-onset form of HD, with rigidity as the presenting symptom (Huntington’s Disease Collaborative Research Group,1993; Stine et al.,1993; Squitieri et al., 2000), and repeats in the 100–150 range yield an age of onset of 2–5 years (Huntington’s Disease Collaborative Research Group, 1993; Furtado et al., 1996; Squitieri et al., 2000; Gambardella et al., 2001; Nahhas et al., 2005; Papapetropoulos et al., 2005; Wojaczynska-Stanek et al., 2006). The rare HD victims found to possess >200 CAG repeats, however, also show an age of onset of 2–3 years, and one case with a 265-repeat HD allele presented at 4 years of age with the typically adult-onset symptom of chorea (Nance et al.,1999; Milunsky et al., 2003; Seneca et al., 2004). Thus, the relationship between CAG repeat size and age of HD onset is negatively sloped between 40 and 100 repeats, but thereafter is largely flat up to 265 repeats (Anderesen et al., 2006; Squitieri et al., 2006). While HD onset cannot precisely be predicted from CAG repeat length, these findings raise the possibility that HD onset age does not decline steadily (and thus severity increase) as repeats increase beyond 100. Whether the same attenuating mechanisms are in action as with the large CAG repeat expansion in our R6/2x mice is not certain. Moreover, whether repeats beyond 335 in humans would yield later onset than smaller repeats is also not certain. Complicating comparisons between R6/2 mice and humans is that human HD victims make full-length mutant protein while R6/2 mice only make the mutant exon 1 product, which is known to be more pathogenic (Mangiarini et al., 1996; Hackam et al., 1998a; Benn et al., 2005).
Factors that contribute to the nonlinear effect of polyQ length on survival in the R6/2x mice include the apparently diminished nuclear entry at around 200 repeats, and the loss of passive nuclear entry at about 335 repeats. It is also possible that polyglutamine tracts beyond 335 produce their benefit by means of the increased avidity of aggregation attending longer polyQ (Li and Li, 1998; Martindale et al., 1998; Narain et al., 1999; Zoghbi and Orr, 2000; Chen et al., 2002; Burke et al., 2003). Such an aggregation-based benefit could stem from increased sequestering of the toxic free form of the mutant protein, or of small oligomers of it (Saudou et al.,1998; Sanchez et al., 2003; Arrasate et al., 2004; Ross and Poirier, 2004; Bowman et al., 2005; Takahashi et al., 2008). Finally, as also true of pathogenic CAG repeat expansions in exon 1 of the androgen receptor that cause spinobulbar muscular atrophy (Choong et al., 1996), the CAG repeat expansion of the R6/2x exon 1 transgene appears to be associated with its diminished expression, and lower expression of the R6/2 transgene is associated with abatement of the R6/2 phenotype (Mangiarini et al., 1996; Benn et al., 2005). Thus, polyQ tracts beyond 335 may be less deleterious than shorter tracts by three processes — diminishing nuclear entry, facilitating aggregation and reducing expression. These findings and the flat relationship between CAG expansion >100 and onset age in humans bring into question whether the extreme somatic expansions of the CAG repeat length reported in HD brain and in the brains of HD transgenic mice could be required for pathogenicity (Kennedy et al., 2003; Shelbourne et al., 2007), as have other findings (Watase et al., 2003).
Acknowledgments
We thank Bill Taylor for his assistance with the qPCR, Lydia Hu, Jianping Xie, Sherry Cuthbertson-Coates, Amanda Taylor, Kim Ries, and Bhavin Vadodaria for technical assistance, and Drs. M. DiFiglia, C. Ross and G. Bates for providing N-terminus antibodies against huntingtin. Supported by Cure HD Contracts from the Hereditary Disease and High Q Foundations (DG/AR/ID), and NIH grants NS19620 (AR), NS28721 (AR). The authors have no financial interest in the research reported here.
References
- Andersen JM, Javiar G, Djousse L, Roberts S, Brocklebank D, Cherny SS, Cardon LR, Gusella JF, MacDonald MF, Myers RH, Houseman DE, Wexler NS The US-Venezuela-Collaborative Research Group, The HD-MAPS Collaborative Research Group. The relationship between CAG repeat length and age of onset differs for Huntington’s disease patients with juvenile onset or adult onset. Ann Hum Gen. 2006;71:295–301. doi: 10.1111/j.1469-1809.2006.00335.x. [DOI] [PubMed] [Google Scholar]
- Aronin N, Kim M, Laforet G, DiFiglia M. Are there multiple pathways in the pathogenesis of Huntington’s disease? Phil Trans R Soc Lond B. 1999;354:995–1003. doi: 10.1098/rstb.1999.0451. [DOI] [PMC free article] [PubMed] [Google Scholar]
- Arrasate M, Mitra S, Schweitzer ES, Segal MR, Finkbeiner S. Inclusion body formation reduces levels of mutant huntingtin and the risk of neuronal death. Nature. 2004;431:805–810. doi: 10.1038/nature02998. [DOI] [PubMed] [Google Scholar]
- Askanas V, Serdaroglu P, Engel WK, Alvarez RB. Immunocytochemical localization of ubiquitin in inclusion body myositis allows its light-microscopic distinction from polymyositis. Neurology. 1992;42:460–461. doi: 10.1212/wnl.42.2.460. [DOI] [PubMed] [Google Scholar]
- Atwal RS, Xia J, Pinchev D, Taylor J, Epand RM, Truant R. Huntingtin has a membrane association signal that can modulate huntingtin aggregation, nuclear entry and toxicity. Hum Mol Gen. 2007;16:2600–2615. doi: 10.1093/hmg/ddm217. [DOI] [PubMed] [Google Scholar]
- Barton S, Jacak R, Khare SD, Ding F, Dokholyan NV. The length dependence of the polyQ-mediated protein aggregation. J Biol Chem. 2007;282:25487–25492. doi: 10.1074/jbc.M701600200. [DOI] [PubMed] [Google Scholar]
- Benn CL, Landles C, Li H, Strand AD, Woodman B, Sathasivam K, Li SH, Ghazi-Noori S, Hockly E, Faruque SMNN, Cha JHJ, Sharpe PT, Olson JM, Li XJ, Bates GP. Contribution of nuclear and extranuclear polyQ to neurological phenotypes in mouse models of Huntington’s disease. Hum Mol Gen. 2005;14:3065–3078. doi: 10.1093/hmg/ddi340. [DOI] [PubMed] [Google Scholar]
- Bibb JA, Yan Z, Svenningsson P, Snyder GL, Pieribone VA, Horiuchi A, Nairn AC, Messer A, Greengard P. Severe deficiencies in dopamine signaling in presymptomatic Huntington’s disease mice. Proc Natl Acad Sci USA. 2000;97:6809–6812. doi: 10.1073/pnas.120166397. [DOI] [PMC free article] [PubMed] [Google Scholar]
- Bhide PG, Day M, Sapp E, Schwarz C, Sheth A, Kim J, Young AB, Penney J, Golden J, Aronin N, DiFiglia M. Expression of normal and mutant huntingtin in the developing brain. J Neurosci. 1996;16:5523–5535. doi: 10.1523/JNEUROSCI.16-17-05523.1996. [DOI] [PMC free article] [PubMed] [Google Scholar]
- Bowman AB, Yoo SY, Dantuma NP, Zoghbi HY. Neuronal dysfunction in a polyglutamine disease model occurs in the absence of ubiquitin–proteosome system impairment and inversely correlates with degree of nuclear inclusion formation. Hum Mol Gen. 2005;14:679–691. doi: 10.1093/hmg/ddi064. [DOI] [PubMed] [Google Scholar]
- Burke MG, Woscholski R, Yaliraki SN. Differential hydrophobicity drives self-assembly in Huntington’s disease. Proc Natl Acad Sci USA. 2003;100:13928–13933. doi: 10.1073/pnas.1936025100. [DOI] [PMC free article] [PubMed] [Google Scholar]
- Carter RJ, Lione LA, Humby T, Mangiarini L, Mahal A, Bates GP, Dunnett SB, Morton AJ. Characterization of progressive motor deficits in mice transgenic for the human Huntington’s disease mutation. J Neurosci. 1999;19:3248–3257. doi: 10.1523/JNEUROSCI.19-08-03248.1999. [DOI] [PMC free article] [PubMed] [Google Scholar]
- Cepeda C, Ariano MA, Calvert CR, Flores-Hernandez J, Chandler SH, Leavitt BR, Hayden MR, Levine MS. NMDA receptor function in mouse models of Huntington Disease. J Neurosci Res. 2001;66:525–539. doi: 10.1002/jnr.1244. [DOI] [PubMed] [Google Scholar]
- Cepeda C, Hurst RS, Calvert CR, Hernandez-Echeagaray E, Nguyen OK, Jocoy E, Christian LJ, Ariano MA, Levine MS. Transient and progressive electrophysiological alterations in the corticostriatal pathway in a mouse model of Huntington’s disease. J Neurosci. 2003;23:961–969. doi: 10.1523/JNEUROSCI.23-03-00961.2003. [DOI] [PMC free article] [PubMed] [Google Scholar]
- Cha JH, Kosinski CM, Kerner JA, Alsdorf SA, Mangiarini L, Davies SW, Penney JB, Bates GP, Young AB. Altered brain neurotransmitter receptors in transgenic mice expressing a portion of an abnormal human Huntington’s disease gene. Proc Natl Acad Sci USA. 1998;95:6480–6485. doi: 10.1073/pnas.95.11.6480. [DOI] [PMC free article] [PubMed] [Google Scholar]
- Chen S, Ferrone FA, Wetzel R. Huntington’s disease age-of-onset linked to polyglutamine aggregation nucleation. Proc Natl Acad Sci USA. 2002;99:11884–11889. doi: 10.1073/pnas.182276099. [DOI] [PMC free article] [PubMed] [Google Scholar]
- Choong CS, Kemppainen JA, Zhou ZX, Wilson EM. Reduced androgen receptor gene expression with first exon CAG repeat expansion. Mol Endocrinol. 1996;10:1527–1535. doi: 10.1210/mend.10.12.8961263. [DOI] [PubMed] [Google Scholar]
- Cornett J, Cao F, Wang CE, Ross CA, Bates GP, Li SH, Li XJ. Polyglutamine expansion of huntingtin impairs its nuclear export. Nat Genet. 2005;37:198–204. doi: 10.1038/ng1503. [DOI] [PubMed] [Google Scholar]
- Davies SW, Turmaine M, Cozens BA, DiFiglia M, Sharp AH, Ross CA, Scherzinger E, Wanker EE, Mangiarini L, Bates GP. Formation of neuronal intranuclear inclusions underlies the neurological dysfunction in mice transgenic for the HD mutation. Cell. 1997;90:537–548. doi: 10.1016/s0092-8674(00)80513-9. [DOI] [PubMed] [Google Scholar]
- Deng YP, Albin RL, Penney JB, Young AB, Anderson KD, Reiner A. Differential loss of striatal projection systems in Huntington’s disease, a quantitative immunohistochemical study. J Chem Neuroanat. 2004;27:143–164. doi: 10.1016/j.jchemneu.2004.02.005. [DOI] [PubMed] [Google Scholar]
- DiFiglia M, Sapp E, Chase K, Schwarz C, Meloni A, Young C, Martin E, Vonsattel JP, Carraway R, Reeves SA, Boyce FM, Aronin N. Huntingtin is a cytoplasmic protein associated with vesicles in human and rat brain neurons. Neuron. 1995;14:1075–1081. doi: 10.1016/0896-6273(95)90346-1. [DOI] [PubMed] [Google Scholar]
- DiFiglia M, Sapp E, Chase KO, Davies SW, Bates GP, Vonsattel JP, Aronin JP. Aggregation of huntingtin in neuronal intranuclear inclusions and dystrophic neurites in brain. Science. 1997;277:1990–1993. doi: 10.1126/science.277.5334.1990. [DOI] [PubMed] [Google Scholar]
- Dyer RB, McMurray CT. Mutant protein in Huntington disease is resistant to proteolysis in affected brain. Nature Gen. 2001;29:270–278. doi: 10.1038/ng745. [DOI] [PubMed] [Google Scholar]
- Eriksen JL, Przedborski S, Petrucelli L. Gene dosage and pathogenesis of Parkinson’s disease. Trends Mol Med. 2005;11:91–96. doi: 10.1016/j.molmed.2005.01.001. [DOI] [PubMed] [Google Scholar]
- Faber PW, Barnes GT, Srinidhi J, Chen J, Gusella JF, MacDonald ME. Huntingtin interacts with a family of WW domain proteins. Hum Mol Gen. 1998;7:1463–1474. doi: 10.1093/hmg/7.9.1463. [DOI] [PubMed] [Google Scholar]
- Fain JN, Del Mar NA, Meade CA, Reiner A, Goldowitz D. Abnormalities in the functioning of adipocytes from R6/2 mice that are transgenic for the Huntington’s disease mutation. Hum Mol Gen. 2001;10:145–152. doi: 10.1093/hmg/10.2.145. [DOI] [PubMed] [Google Scholar]
- Furtado S, Suchowersky O, Rewcastle NB, Graham L, Klimek ML, Garber A. Relationship between trinucleotide repeats and neuropathological changes in Huntington’s disease. Ann Neurol. 1996;39:132–136. doi: 10.1002/ana.410390120. [DOI] [PubMed] [Google Scholar]
- Gambardella A, Muglia M, Labate A, Magariello A, Gabriele AL, Mazzei R, Pirritano D, Conforti FL, Patitucci A, Valentino P, Zappia M, Quattrone A. Juvenile Huntington’s disease presenting as progressive myoclonic epilepsy. Neurology. 2001;57:708–711. doi: 10.1212/wnl.57.4.708. [DOI] [PubMed] [Google Scholar]
- Gauthier LR, Charrin BC, Borrell-Pages M, Dompierre JP, Rangone H, MacDondald ME, Lessmann V, Humbert S, Saudou F. Huntingtin controls neurotrophic support and survival of neurons by enhancing BDNF vesicular transport along microtubules. Cell. 2004;118:127–138. doi: 10.1016/j.cell.2004.06.018. [DOI] [PubMed] [Google Scholar]
- Glass M, Dragunow M, Faull RLM. The pattern of neurodegeneration in Huntington’s disease: a comparative study of cannabinoid, dopamine, adenosine and GABAA receptor alterations in the human basal ganglia in Huntington’s disease. Neuroscience. 2000;97:505–519. doi: 10.1016/s0306-4522(00)00008-7. [DOI] [PubMed] [Google Scholar]
- Görlich D, Mattaj IW. Nucleocytoplasmic transport. Science. 1996;271:1513–1518. doi: 10.1126/science.271.5255.1513. [DOI] [PubMed] [Google Scholar]
- Graveland GA, Williams RS, DiFiglia M. Evidence for degenerative and regenerative changes in neostriatal spiny neurons in Huntington’s disease. Science. 1985;227:770–773. doi: 10.1126/science.3155875. [DOI] [PubMed] [Google Scholar]
- Guidetti P, Charles V, Chen EY, Reddy PH, Kordower JH, Whetsell WO, Jr, Schwarcz R, Tagle DA. Early degenerative changes in transgenic mice expressing mutant huntingtin involve dendritic abnormalities but no impairment of mitochondrial energy production. Exper Neurol. 2001;169:340–350. doi: 10.1006/exnr.2000.7626. [DOI] [PubMed] [Google Scholar]
- Gunawardena S, Goldstein LSB. Polyglutamine disease and transport problems. Deadly traffic jams on neuronal highways. Arch Neurol. 2005;62:46–51. doi: 10.1001/archneur.62.1.46. [DOI] [PubMed] [Google Scholar]
- Gutekunst CA, Li SH, Yi H, Mulroy JS, Kuemmerle S, Jones R, Rye D, Ferrante RJ, Hersch SM, Li XJ. Nuclear and neuropil aggregates in Huntington’s disease: relationship to neuropathology. J Neurosci. 1999;19:2522–2534. doi: 10.1523/JNEUROSCI.19-07-02522.1999. [DOI] [PMC free article] [PubMed] [Google Scholar]
- Hackam AS, Singaraja R, Wellington CL, Metzler M, Zhang Z, Kalchman M, Hayden MR. The influence of huntingtin protein size on nuclear localization and cellular toxicity. J Cell Biol. 1998a;141:1097–1105. doi: 10.1083/jcb.141.5.1097. [DOI] [PMC free article] [PubMed] [Google Scholar]
- Hackam AS, Wellington CL, Hayden MR. The fatal attraction of poly-glutamine-containing proteins. Clin Gen. 1998b;53:233–242. doi: 10.1111/j.1399-0004.1998.tb02687.x. [DOI] [PubMed] [Google Scholar]
- Hockly E, Woodman B, Mahhal A, Lewis CM, Bates G. Standardization and statistical approaches to therapeutic trials in the R6/2 mouse. Brain Res Bull. 2005;61:469–479. doi: 10.1016/s0361-9230(03)00185-0. [DOI] [PubMed] [Google Scholar]
- Hodgson JG, Agopyan N, Gutekunst CA, Leavitt BR, LePiane F, Singaraja R, Smith DJ, Bissada N, McCutcheon K, Nasir J, Jamot L, Li XJ, Stevens ME, Rosemond E, Roder JC, Phillips AG, Rubin EM, Hersch SM, Hayden MR. A YAC mouse model for Huntington’s disease with full-length mutant huntingtin, cytoplasmic toxicity, and selective striatal neurodegeneration. Neuron. 1999;23:181–192. doi: 10.1016/s0896-6273(00)80764-3. [DOI] [PubMed] [Google Scholar]
- Huntington’s Disease Collaborative Research Group. A novel gene containing a trinucleotide repeat that is expanded and unstable on the HD chromosome. Cell. 1993;72:971–983. doi: 10.1016/0092-8674(93)90585-e. [DOI] [PubMed] [Google Scholar]
- Hurlbert MS, Zhou W, Wasmeier C, Kaddis FG, Hutton JC, Freed CR. Mice transgenic for an expanded CAG repeat in the Huntington’s disease gene develop diabetes. Diabetes. 1999;48:649–651. doi: 10.2337/diabetes.48.3.649. [DOI] [PubMed] [Google Scholar]
- Jackson WS, Tallaksen-Greene SJ, Albin RL, Detloff PJ. Nucleocytoplasmic transport signals affect the age at onset of abnormalities in knock-in mice expressing polyglutamine within an ectopic protein context. Hum Mol Gen. 2003;12:1621–1629. doi: 10.1093/hmg/ddg163. [DOI] [PubMed] [Google Scholar]
- Josephs KA, Holton JL, Rossor MN, Godbolt AK, Ozawa T, Strand K, Khan N, Al-Sarraj S, Revesz T. Frontotemporal lobar degeneration and ubiquitin immunohistochemistry. Neuropath Appl Neurobiol. 2004;30:369–373. doi: 10.1111/j.1365-2990.2003.00545.x. [DOI] [PubMed] [Google Scholar]
- Kennedy L, Evans E, Chen CM, Craven L, Detloff PJ, Ennis M, Shelbourne PF. Dramatic tissue-specific mutation length increases are an early molecular event in Huntington’s disease pathogenesis. Hum Mol Gen. 2003;12:3359–3367. doi: 10.1093/hmg/ddg352. [DOI] [PubMed] [Google Scholar]
- Kim TW, Tanzi RE. Neuronal intranuclear inclusions in polyglutamine diseases: nuclear weapons or nuclear fallout. Neuron. 1998;21:657–659. doi: 10.1016/s0896-6273(00)80581-4. [DOI] [PubMed] [Google Scholar]
- Klapstein GJ, Fisher RS, Zanjani H, Cepeda C, Jokel ES, Chesselet MF, Levine MS. Electrophysiological and morphological changes in striatal spiny neurons in R6/2 Huntington’s disease transgenic mice. J Neurophysiol. 2001;86:2667–2677. doi: 10.1152/jn.2001.86.6.2667. [DOI] [PubMed] [Google Scholar]
- Klement IA, Skinner PJ, Kaytor MD, Yi H, Hersch SM, Clark HB, Zoghbi HY, Orr HT. Ataxin-1 nuclear localization and aggregation: role in polyglutamine-induced disease in SCA1 transgenic mice. Cell. 1998;95:41–53. doi: 10.1016/s0092-8674(00)81781-x. [DOI] [PubMed] [Google Scholar]
- Kuemmerle S, Gutekunst CA, Klein AM, Li XJ, Li SH, Beal MF, Hersch SM, Ferrante RJ. Huntingtin aggregates may not predict neuronal death in Huntington’s disease. Ann Neurol. 1999;46:842–849. [PubMed] [Google Scholar]
- Laforet GA, Sapp E, Chase K, McIntyre C, Boyce FM, Campbell M, Cadigan BA, Warzecki L, Tagle DA, Reddy PH, Cepeda C, Calvert CR, Jokel ES, Klapstein GJ, Ariano MA, Levine MS, DiFiglia M, Aronin N. Changes in cortical and striatal neurons predict behavioral and electrophysiological abnormalities in a transgenic murine model of Huntington’s disease. J Neurosci. 2001;21:9112–9123. doi: 10.1523/JNEUROSCI.21-23-09112.2001. [DOI] [PMC free article] [PubMed] [Google Scholar]
- La Spada AR, Taylor JP. Polyglutamines placed into cortex. Neuron. 2003;38:681–684. doi: 10.1016/s0896-6273(03)00328-3. [DOI] [PubMed] [Google Scholar]
- Lei WL, Jiao Y, Del Mar N, Reiner A. Evidence for differential cortical input to direct pathway versus indirect pathway striatal projection neurons in rats. J Neurosci. 2004;24:8289–8299. doi: 10.1523/JNEUROSCI.1990-04.2004. [DOI] [PMC free article] [PubMed] [Google Scholar]
- Li SH, Li XJ. Aggregation of N-terminal huntingtin is dependent on the length of its glutamine repeats. Hum Mol Gen. 1998;7:777–782. doi: 10.1093/hmg/7.5.777. [DOI] [PubMed] [Google Scholar]
- Li H, LSH, Cheng AL, Mangiarini L, Bates GP, Li XJ. Ultrastructural localization and progressive formation of neuropil aggregates in Huntington’s disease transgenic mice. Hum Mol Gen. 1999;8:1227–1236. doi: 10.1093/hmg/8.7.1227. [DOI] [PubMed] [Google Scholar]
- Lin CH, Tallaksen-Greene S, Chien WM, Cearley JA, Jackson WS, Crouse AB, Ren S, Li XJ, Albin RL, Detloff PJ. Neurological abnormalities in a knock-in mouse model of Huntington’s disease. Hum Mol Gen. 2001;10:137–144. doi: 10.1093/hmg/10.2.137. [DOI] [PubMed] [Google Scholar]
- Lione LA, Carter RJ, Hunt MJ, Bates GP, Morton AJ, Dunnett SB. Selective discrimination learning impairments in mice expressing the human Huntington’s disease mutation. J Neurosci. 1999;19:10428–10437. doi: 10.1523/JNEUROSCI.19-23-10428.1999. [DOI] [PMC free article] [PubMed] [Google Scholar]
- Luthi-Carter R, Strand A, Peters NL, Solano SM, Hollingsworth ZR, Menon AS, Frey AS, Spektor BS, Penney EB, Schilling G, Ross CA, Borchelt DR, Tapscott SJ, Young AB, Cha JH, Olson JM. Decreased expression of striatal signaling genes in a mouse model of Huntington’s disease. Hum Mol Gen. 2000;9:1259–1271. doi: 10.1093/hmg/9.9.1259. [DOI] [PubMed] [Google Scholar]
- Luthi-Carter R, Hanson SA, Strand AD, Bergstrom DA, Chun W, Peters NL, Woods AM, Chan-Kooperberg EY, Krainc CD, Young AB, Tapscott SJ, Olson JM. Dysregulation of gene expression in the R6/2 model of polyglutamine disease: parallel changes in muscle and brain. Hum Mol Gen. 2002;11:1911–1926. doi: 10.1093/hmg/11.17.1911. [DOI] [PubMed] [Google Scholar]
- Mangiarini L, Sathasivam K, Seller M, Cozens B, Harper A, Hetherington C, Lawton M, Trottier Y, Lehrach H, Davies SW, Bates GP. Exon 1 of the HD gene with an expanded CAG repeat is sufficient to cause a progressive neurological phenotype in transgenic mice. Cell. 1996;87:493–506. doi: 10.1016/s0092-8674(00)81369-0. [DOI] [PubMed] [Google Scholar]
- Maat-Schieman ML, Dorsman JC, Smoor MA, Siesling S, Van Duinen SG, Verschuuren JJ, den Dunnen JT, Van Ommen GJ, Roos RA. Distribution of inclusions in neuronal nuclei and dystrophic neurites in Huntington disease brain. J Neuropathol Exper Neurol. 1999;58:129–137. doi: 10.1097/00005072-199902000-00003. [DOI] [PubMed] [Google Scholar]
- Martindale D, Hackam A, Wieczorek A, Ellerby L, Wellington C, McCutcheon K, Singaraja R, Kazemi-Esfarjani P, Devon R, Kim SU, Bredesen DE, Tufaro F, Hayden MR. Length of huntingtin and its polyglutamine tract influences localization and frequency of intracellular aggregates. Nature Gen. 1998;18:150–154. doi: 10.1038/ng0298-150. [DOI] [PubMed] [Google Scholar]
- Meade CA, Deng YP, Fusco F, Del Mar N, Hersch S, Goldowitz D, Reiner A. Localization of neuronal intranuclear inclusions (NIIs) in the striatum and cortex of the Bates R6/2 transgenic mouse. J Comp Neurol. 2002;449:241–269. doi: 10.1002/cne.10295. [DOI] [PubMed] [Google Scholar]
- Menalled L, Zanjani H, MacKenzie L, Koppel A, Carpenter E, Zeitlin S, Chesselet MF. Decrease in striatal enkephalin mRNA in mouse models of Huntington’s disease. Exper Neurol. 2000;162:328–342. doi: 10.1006/exnr.1999.7327. [DOI] [PubMed] [Google Scholar]
- Mastroberardino PG, Iannicola C, Nardacci R, Bernassola F, De Laurenzi V, Melino G, Moreno S, Pavone F, Oliverio S, Fesus L, Piacentini M. ‘Tissue’ transglutaminase ablation reduces neuronal death and prolongs survival in a mouse model of Huntington’s disease. Cell Death Differ. 2002;9:873–880. doi: 10.1038/sj.cdd.4401093. [DOI] [PubMed] [Google Scholar]
- Mihm MJ, Amann DM, Schanbacher BL, Altschuld RA, Bauer JA, Hoyt KR. Cardiac dysfunction in the R6/2 mouse model of Huntington’s disease. Neurobiol Dis. 2007;25:297–308. doi: 10.1016/j.nbd.2006.09.016. [DOI] [PMC free article] [PubMed] [Google Scholar]
- Milunsky J, Maher T, Loose B, Darras B, Ito M. XL PCR for the detection of large trinucleotide expansions in juvenile Huntington’s disease. Clin Gen. 2003;64:70–73. doi: 10.1034/j.1399-0004.2003.00108.x. [DOI] [PubMed] [Google Scholar]
- Morton AJ, Lagan MA, Skepper JN, Dunnett SB. Progressive formation of inclusions in the striatum and hippocampus of mice transgenic for the human Huntington’s disease mutation. J Neurocytol. 2000;29:679–702. doi: 10.1023/a:1010887421592. [DOI] [PubMed] [Google Scholar]
- Morton AJ, Glynn D, Leavens W, Zheng Z, Skepper J, Wigth J, Fyfe I. Paradoxical delay in the onset of disease caused by superlong CAG repeat expansions unmasks neurodegeneration in R6/2 mice. Hereditary Disease Foundation Symposium: HD2008: “The Milton Wexler Celebration of Life”. 2008:Abst# 26. [Google Scholar]
- Mullen RJ, Buck CR, Smith AM. NeuN, a neuronal specific nuclear protein in vertebrates. Development. 1992;116:201–211. doi: 10.1242/dev.116.1.201. [DOI] [PubMed] [Google Scholar]
- Nahhas FA, Garbern J, Krajewski KM, Roa BB, Feldman GL. Juvenile onset Huntington disease resulting from a very large maternal expansion. Am J Med Gen. 2005;137A:328–331. doi: 10.1002/ajmg.a.30891. [DOI] [PubMed] [Google Scholar]
- Nance MA, Mathias-Hagen V, Breningstall G, Wick MJ, McGlennen RC. Analysis of a very large trinucleotide repeat in a patient with juvenile Huntington’s disease. Neurology. 1999;52:392–394. doi: 10.1212/wnl.52.2.392. [DOI] [PubMed] [Google Scholar]
- Narain Y, Wyttenbach A, Rankin J, Furlong RA, Rubinsztein DC. A molecular investigation of true dominance in Huntington’s disease. J Med Gen. 1999;36:739–746. doi: 10.1136/jmg.36.10.739. [DOI] [PMC free article] [PubMed] [Google Scholar]
- Orth M, Cooper JM, Bates GP, Schapira AH. Inclusion formation in Huntington’s disease R6/2 mouse muscle cultures. J Neurochem. 2003;87:1–6. doi: 10.1046/j.1471-4159.2003.02009.x. [DOI] [PubMed] [Google Scholar]
- Papapetropoulos S, Lopez-Alberola R, Baumbach L, Russell A, Gonzalez MA, Bowen BC, Singer C. Case of maternally transmitted juvenile Huntington’s disease with a very large trinucleotide repeat. Movement Dis. 2005;20:1380–1383. doi: 10.1002/mds.20557. [DOI] [PubMed] [Google Scholar]
- Paviour DC, Lees AJ, Josephs KA, Ozawa T, Ganguly M, Strand C, Godbolt A, Howard RS, Revesz T, Holton JL. Frontotemporal lobar degeneration with ubiquitin-only-immunoreactive neuronal changes: broadening the clinical picture to include progressive supranuclear palsy. Brain. 2004;127:2441–2451. doi: 10.1093/brain/awh265. [DOI] [PubMed] [Google Scholar]
- Penney JB, Jr, Vonsattel JP, MacDonald ME, Gusella JF, Myers RH. CAG repeat number governs the development rate of pathology in Huntington’s disease. Ann Neurol. 1997;41:689–692. doi: 10.1002/ana.410410521. [DOI] [PubMed] [Google Scholar]
- Qin ZH, Wang Y, Sapp E, Cuiffo B, Wanker E, Hayden MR, Kegel KB, Aronin N, DiFiglia M. Huntingtin bodies sequester vesicle-associated proteins by a polyproline-dependent interaction. J Neurosci. 2004;24:269–281. doi: 10.1523/JNEUROSCI.1409-03.2004. [DOI] [PMC free article] [PubMed] [Google Scholar]
- Reiner A, Dragatsis I, Zeitlin S, Goldowitz D. Wild-type huntingtin plays a role in brain development and neuronal survival. Mol Neurobiol. 2003;28:259–275. doi: 10.1385/MN:28:3:259. [DOI] [PubMed] [Google Scholar]
- Reiner A, Del Mar N, Deng YP, Meade CA, Sun Z, Goldowitz D. R6/2 Neurons with intranuclear inclusions survive for prolonged periods in the brains of chimeric mice. J Comp Neurol. 2007;505:603–737. doi: 10.1002/cne.21515. [DOI] [PubMed] [Google Scholar]
- Ribchester RR, Thomson D, Wood NI, Hinks T, Gillingwater TH, Wishart TM, Court FA, Morton AJ. Progressive abnormalities in skeletal muscle and neuromuscular junctions of transgenic mice expressing the Huntington’s disease mutation. Eur J Neurosci. 2004;20:3092–3114. doi: 10.1111/j.1460-9568.2004.03783.x. [DOI] [PubMed] [Google Scholar]
- Rigamonti D, Bauer JH, De-Fraja C, Conti L, Sipione S, Sciorati C, Clementi E, Hackam A, Hayden MR, Li Y, Cooper JK, Ross CA, Govoni S, Vincenz C, Cattaneo E. Wild-type huntingtin protects from apoptosis upstream of caspase-3. J Neurosci. 2000;20:3705–3713. doi: 10.1523/JNEUROSCI.20-10-03705.2000. [DOI] [PMC free article] [PubMed] [Google Scholar]
- Rosenblatt A, Liang KY, Zhou H, Abbott MH, Gourley LM, Margolis RL, Brandt J, Ross CA. The association of CAG repeat length with clinical progression in Huntington’s disease. Neurology. 2006;66:1016–1020. doi: 10.1212/01.wnl.0000204230.16619.d9. [DOI] [PubMed] [Google Scholar]
- Ross CA, Poirier MA. Protein aggregation and neurodegenerative disease. Nature Med. 2004;10:S10–S17. doi: 10.1038/nm1066. [DOI] [PubMed] [Google Scholar]
- Sathasivam K, Woodman B, Mahal A, Bertaux F, Wanker EE, Shima DT, Bates GP. Centrosome disorganization in fibroblast cultures derived from R6/2 Huntington’s disease (HD) transgenic mice and HD patients. Hum Mol Gen. 2001;10:2425–2435. doi: 10.1093/hmg/10.21.2425. [DOI] [PubMed] [Google Scholar]
- Sanchez I, Mahlke C, Yuan J. Pivotal role of oligomerization in expanded polyglutamine neurodegenerative disorders. Science. 2003;421:373–379. doi: 10.1038/nature01301. [DOI] [PubMed] [Google Scholar]
- Sapp E, Penney J, Young A, Aronin N, Vonsattel JP, DiFiglia M. Axonal transport of N-terminal huntingtin suggests early pathology of corticostriatal projections in Huntington disease. J Neuropathol Exper Neurol. 1999;58:165–173. doi: 10.1097/00005072-199902000-00006. [DOI] [PubMed] [Google Scholar]
- Saudou F, Finkbeiner S, Devys D, Greenberg ME. Huntingtin acts in the nucleus to induce apoptosis but death does not correlate with the formation of intranuclear inclusions. Cell. 1998;95:55–66. doi: 10.1016/s0092-8674(00)81782-1. [DOI] [PubMed] [Google Scholar]
- Schilling G, Becher MW, Sharp AH, Jinnah HA, Duan K, Kotzuk JA, Slunt HH, Ratovitski T, Cooper JK, Jenkins NA, Copeland NG, Price DL, Ross CA, Borchelt DR. Intranuclear inclusions and neuritic aggregates in transgenic mice expressing a mutant N-terminal fragment of huntingtin. Hum Mol Gen. 1999;8:397–407. doi: 10.1093/hmg/8.3.397. [DOI] [PubMed] [Google Scholar]
- Schilling G, Savonenko AV, Klevytska A, Morton JL, Tucker SM, Poirier M, Gale A, Chan N, Gonzales V, Slunt HH, Coonfield ML, Jenkins NA, Copeland NG, Ross CA, Borchelt DR. Nuclear-targeting of mutant huntingtin fragments produces Huntington’s disease-like phenotypes in transgenic mice. Hum Mol Gen. 2004;13:1599–1610. doi: 10.1093/hmg/ddh175. [DOI] [PubMed] [Google Scholar]
- Seneca S, Fagnart D, Keymolen K, Lissens W, Hasaerts D, Debulpaep S, Desprechins B, Liebaers I, De Meirleir L. Early onset Huntington disease: a neuronal degeneration syndrome. Eur J Pediat. 2004;163:71–721. doi: 10.1007/s00431-004-1537-3. [DOI] [PubMed] [Google Scholar]
- Shelbourne PF, Killeen N, Hevner RF, Johnston HM, Tecott L, Lewandoski M, Ennis M, Ramirez L, Li Z, Iannicola C, Littman DR, Myers RM. A Huntington’s disease CAG expansion at the murine Hdh locus is unstable and associated with behavioural abnormalities in mice. Hum Mol Gen. 1999;8:763–774. doi: 10.1093/hmg/8.5.763. [DOI] [PubMed] [Google Scholar]
- Shelbourne PF, Keller-McGandy PF, Bi WL, Yoon SR, Dubeau L, Veitch NJ, Vonsattel JP, Wexler NS, Arnheim N, Augood SJ The US-Venezuela Collaborative Research Group. Triplet repeat mutation length gains correlate with cell-type specific vulnerability in Huntington disease brain. Hum Mol Gen. 2007;16:133–1142. doi: 10.1093/hmg/ddm054. [DOI] [PubMed] [Google Scholar]
- Sieradzan KA, Mechan AO, Jones L, Wanker EE, Nukina N, Mann DM. Huntington’s disease intranuclear inclusions contain truncated, ubiquitinated huntingtin protein. Exper Neurol. 1999;156:92–99. doi: 10.1006/exnr.1998.7005. [DOI] [PubMed] [Google Scholar]
- Sipione S, Rigamonti D, Valenza M, Zuccato C, Conti L, Pritchard J, Kooperberg C, Olson JM, Cattaneo E. Early transcriptional profiles in huntingtin-inducible striatal cells by microarray analyses. Hum Mol Gen. 2002;11:1953–1965. doi: 10.1093/hmg/11.17.1953. [DOI] [PubMed] [Google Scholar]
- Sisodia SS. Nuclear inclusion in glutamine repeat disorders: are they pernicious, coincidental or beneficial? Cell. 1998;95:1–4. doi: 10.1016/s0092-8674(00)81743-2. [DOI] [PubMed] [Google Scholar]
- Slow EJ, Graham RK, Osmand AP, Devon RS, Lu G, Deng Y, Pearson J, Vaid K, Bissada N, Wetzel R, Leavitt BR, Hayden MR. Absence of behavioral abnormalities and neurodegeneration in vivo despite widespread neuronal huntingtin inclusions. Proc Natl Acad Sci USA. 2005;102:11402–11407. doi: 10.1073/pnas.0503634102. [DOI] [PMC free article] [PubMed] [Google Scholar]
- Spillantini MG, Crowther RA, Jakes R, Hasegawa M, Goedert M. Alpha-synuclein in filamentous inclusions of Lewy bodies from Parkinson’s disease and dementia with Lewy bodies. Proc Natl Acad Sci USA. 1998;95:6469–6473. doi: 10.1073/pnas.95.11.6469. [DOI] [PMC free article] [PubMed] [Google Scholar]
- Spires TL, Grote HE, Garry S, Cordery PM, Van Dellen A, Blakemore C, Hannan AJ. Dendritic spine pathology and deficits in experience-dependent dendritic plasticity in R6/1 Huntington’s disease transgenic mice. Eur J Neurosci. 2004;19:2799–2807. doi: 10.1111/j.0953-816X.2004.03374.x. [DOI] [PubMed] [Google Scholar]
- Squitieri F, Sabbadini G, Mandich P, Gellera C, Di Maria E, Bellone E, Castellotti B, Nargi E, de Grazia U, Frontali M, Novellotto A. Family and molecular data for a fine analysis of age at onset in Huntington Disease. Am J Med Gen. 2000;95:366–373. doi: 10.1002/1096-8628(20001211)95:4<366::aid-ajmg13>3.0.co;2-2. [DOI] [PubMed] [Google Scholar]
- Squitieri F, Frati L, Ciarmiello A, Lastoria S, Quarrell O. Juvenile Huntington’s disease: does a dosage-effect pathogenic mechanism differ from the classical adult disease? Mech Aging Devel. 2006;127:208–212. doi: 10.1016/j.mad.2005.09.012. [DOI] [PubMed] [Google Scholar]
- Stack EC, Kubilus JK, Smith K, Cormier K, Del Signore SJ, Guelin E, Ryu H, Hersch SM, Ferrante RJ. Chronology of behavioral symptoms and neuropathological sequela in R6/2 Huntington ‘s disease transgenic mice. J Comp Neurol. 2005;490:354–370. doi: 10.1002/cne.20680. [DOI] [PubMed] [Google Scholar]
- Stine OC, Pleasant N, Franz ML, Abbott MH, Folstein SE, Ross CA. Correlation between the onset age of Huntington’s disease and length of the trinucleotide repeat in IT15. Hum Mol Gen. 1993;2:1547–1549. doi: 10.1093/hmg/2.10.1547. [DOI] [PubMed] [Google Scholar]
- Sun Z, Del Mar N, Meade C, Goldowitz D, Reiner A. Differential changes in striatal projection neurons in R6/2 mice transgenic for Huntington’s disease. Neurobiol Dis. 2002;11:369–385. doi: 10.1006/nbdi.2002.0554. [DOI] [PubMed] [Google Scholar]
- Suntharalingam M, Wente SR. Peering through the pore: nuclear pore complex structure, assembly, and function. Dev Cell. 2003;4:775–789. doi: 10.1016/s1534-5807(03)00162-x. [DOI] [PubMed] [Google Scholar]
- Takahashi T, Kikuchi S, Katada S, Nagai Y, Nishizawa M, Onodera O. Soluble polyglutamine oligomers formed prior to inclusion body formation are cytotoxic. Hum Mol Gen. 2008;17:345–356. doi: 10.1093/hmg/ddm311. [DOI] [PubMed] [Google Scholar]
- Tekkok SB, Goldberg MP. AMPA/kainate receptor activation mediates hypoxic oligodendrocyte death and axonal injury in cerebral white matter. J Neurosci. 2001;21:4237–4248. doi: 10.1523/JNEUROSCI.21-12-04237.2001. [DOI] [PMC free article] [PubMed] [Google Scholar]
- Terry LJ, Shows EB, Wente SR. Crossing the nuclear envelope: hierarchical regulation of nucleocytoplasmic transport. Science. 2007;318:1412–1416. doi: 10.1126/science.1142204. [DOI] [PubMed] [Google Scholar]
- Trushina E, Heldebrant MP, Perez-Terzic CM, Bortolon R, Kovtun IV, Badger JD, II, Terzic A, Estevez A, Windebank AJ, Dyer RB, Yao J, McMurray CT. Microtubule destabilization and nuclear entry are sequential steps leading to toxicity in Huntington’s disease. Proc Natl Acad Sci USA. 2003;100:12171–12176. doi: 10.1073/pnas.2034961100. [DOI] [PMC free article] [PubMed] [Google Scholar]
- Trushina E, Dyer RB, Badger JD, II, Ure D, Eide L, Tran DD, Vrieze BT, Legendre-Guillemin V, McPherson PS, Mandavilli BS, Van Houten B, Zeitlin S, McNiven M, Aebersold R, Hayden M, Parisi JE, Seeberg E, Dragatsis I, Doyle K, Bender A, Chacko C, McMurray CT. Mutant huntingtin impairs axonal trafficking in mammalian neurons in vivo and in vitro. Mol Cell Biol. 2004;24:8195–8209. doi: 10.1128/MCB.24.18.8195-8209.2004. [DOI] [PMC free article] [PubMed] [Google Scholar]
- Wheeler VC, White JK, Gutekunst CA, Vrbanac V, Weaver M, Li XJ, Li SH, Yi H, Vonsattel JP, Gusella JF, Hersch S, Auerbach W, Joyner AL, MacDonald ME. Long glutamine tracts cause nuclear localization of a novel form of huntingtin in medium spiny striatal neurons in HdhQ92 and HdhQ111 knock-in mice. Hum Mol Gen. 2000;9:503–513. doi: 10.1093/hmg/9.4.503. [DOI] [PubMed] [Google Scholar]
- Velier J, Kim M, Schwarz C, Kim TW, Sapp E, Chase K, Aronin N, DiFiglia M. Wild-type and mutant huntingtin function in vesicle trafficking in the secretory and endocytotic pathways. Exper Neurol. 1998;152:34–40. doi: 10.1006/exnr.1998.6832. [DOI] [PubMed] [Google Scholar]
- Wang CE, Zhou H, McGuire JR, Cerullo V, Lee B, Li SH, Li XL. Suppression of neuropil aggregates and neurological symptoms by an intracellular antibody implicates the cytoplasmic toxicity of mutant huntingtin. J Cell Biol. 2008;181:803–816. doi: 10.1083/jcb.200710158. [DOI] [PMC free article] [PubMed] [Google Scholar]
- Watase K, Venken KJT, Sun Y, Orr HT, Zoghbi HY. Regional differences of somatic CAG repeat instability do not account for selective neuronal vulnerability in a knock-in mouse model of SCA1. Hum Mol Gen. 2003;12:2789–2795. doi: 10.1093/hmg/ddg300. [DOI] [PubMed] [Google Scholar]
- Weiss A, Klein C, Woodman B, Sathasivam K, Bibel M, Regulier E, Bates GP, Paganetti P. Sensitive biochemical aggregate detection reveals aggregation onset before symptom development in cellular and murine models of Huntington’s disease. J Neurochem. 2008;104:846–858. doi: 10.1111/j.1471-4159.2007.05032.x. [DOI] [PubMed] [Google Scholar]
- Wojaczynska-Stanek K, Adamek D, Marsza E, Hoffman-Zacharska D. Huntington Disease in a 9-year-old boy: Clinical course and neuropathologic examination. J Child Neurol. 2006;21:1068–1073. doi: 10.1177/7010.2006.00244. [DOI] [PubMed] [Google Scholar]
- Wolf HK, Buslei R, Schmidt-Kastner R, Schmidt-Kastner PK, Pietsch T, Wiestler OD, Bluhmke I. NeuN: a useful neuronal marker for diagnostic histopathology. J Histochem Cytochem. 1996;44:1167–1171. doi: 10.1177/44.10.8813082. [DOI] [PubMed] [Google Scholar]
- Yang W, Dunlap JR, Andrews RB, Wetzel R. Aggregated polyglutamine peptides delivered to nuclei are toxic to mammalian cells. Hum Mol Gen. 2002;11:2905–2917. doi: 10.1093/hmg/11.23.2905. [DOI] [PubMed] [Google Scholar]
- Yu ZX, Li SH, Evans J, Pillariseti A, Li H, Li XJ. Mutant huntingtin causes context-dependent neurodegeneration in mice with Huntington’s disease. J Neurosci. 2003;23:2193–2202. doi: 10.1523/JNEUROSCI.23-06-02193.2003. [DOI] [PMC free article] [PubMed] [Google Scholar]
- Zhang R, Oorschot DE. Total number of neurons in the habenular nuclei of the rat epithalamus, a stereological study. J Anat. 2006;208:577–585. doi: 10.1111/j.1469-7580.2006.00573.x. [DOI] [PMC free article] [PubMed] [Google Scholar]
- Zoghbi HY, Orr HT. Glutamine repeats and neurodegeneration. Ann Rev Neurosci. 2000;23:217–247. doi: 10.1146/annurev.neuro.23.1.217. [DOI] [PubMed] [Google Scholar]