The crystal structure of the human actin-regulating protein cofilin 1, and comparisons with yeast, Chromalveolata and plant homologues that reveal conformational changes required for actin binding, are reported.
Keywords: cofilin, actin, cytoskeleton
Abstract
The actin cytoskeleton is the chassis that gives a cell its shape and structure, and supplies the power for numerous dynamic processes including motility, endocytosis, intracellular transport and division. To perform these activities, the cytoskeleton undergoes constant remodelling and reorganization. One of the major actin-remodelling families are the cofilin proteins, made up of cofilin 1, cofilin 2 and actin-depolymerizing factor (ADF), which sever aged ADP-associated actin filaments to reduce filament length and provide new potential nucleation sites. Despite the significant interest in cofilin as a central node in actin-cytoskeleton dynamics, to date the only forms of cofilin for which crystal structures have been solved are from the yeast, Chromalveolata and plant kingdoms; none have previously been reported for an animal cofilin protein. Two distinct regions in animal cofilin are significantly larger than in the forms previously crystallized, suggesting that they would be uniquely organized. Therefore, it was sought to determine the structure of human cofilin 1 by X-ray crystallography to elucidate how it could interact with and regulate dynamic actin-cytoskeletal structures. Although wild-type human cofilin 1 proved to be recalcitrant, a C147A point mutant yielded crystals that diffracted to 2.8 Å resolution. These studies revealed how the actin-binding helix undergoes a conformational change that increases the number of potential hydrogen bonds available for substrate binding.
1. Introduction
The dynamic remodelling and reorganization of the actin cytoskeleton is a vital process that impacts upon a variety of cellular processes including motility, endocytosis, intracellular transport and division. The length of individual actin filaments is a function of positive (polymerization) and negative (depolymerization and severing) factors. At the same time, actin filaments may be bundled into higher-order structures that contribute to the overall structure of the cytoskeleton. The major mediators of filamentous actin severing are members of the cofilin protein family, comprised of cofilin 1, cofilin 2 and actin-depolymerizing factor (ADF, also known as destrin; Poukkula et al., 2011 ▶; Bernstein & Bamburg, 2010 ▶). By virtue of their actin-severing activity, cofilin proteins play a significant role in regulating actin-cytoskeletal dynamics. In addition to these direct effects on actin structures, cofilin family proteins influence apoptosis, proliferation and gene expression, indicating that they are central players in cellular homeostasis.
The best characterized mechanism of cofilin regulation is phosphorylation of Ser3, which reduces its affinity for filamentous actin (F-actin) as well as globular actin (G-actin) (Moriyama et al., 1996 ▶; Nagaoka et al., 1996 ▶). Increases in pH and the binding of phosphatidylinositol 4,5-bisphosphate (PIP2) are also involved in the regulation of cofilin activity, and results indicate that these three factors act in concert (Frantz et al., 2008 ▶; Pope et al., 2004 ▶). A further mechanism of regulation independent of Ser3 phosphorylation, pH or PIP2 binding is cysteine oxidation (Pfannstiel et al., 2001 ▶; Klemke et al., 2008 ▶). A significant consequence of cysteine oxidation is to promote the formation of cofilin dimers and oligomers, with activity switching from actin severing as monomers to actin bundling as dimers and oligomers (Pfannstiel et al., 2001 ▶). In some circumstances, cofilin oligomers contribute to the formation of cofilin–actin ‘rods’ in cells, particularly in neurons, that contain equimolar cofilin and actin proteins (Minamide et al., 2010 ▶) and which are dependent upon intermolecular disulfide bonds between cofilin molecules for their formation (Bernstein et al., 2012 ▶). The predominant multimerized form of cofilin observed in ATP-depleted cells was dimers that could be dissociated by dithiothreitol, consistent with intermolecular disulfide bonds mediating the interaction (Bernstein et al., 2012 ▶).
By solving the crystal structure of human cofilin 1 (hCof1), we aimed to determine how the similarities to, and differences from, previously determined X-ray crystal structures would inform us about the function of cofilin. To accomplish these aims, we expressed and purified wild-type human cofilin, as well as four single cysteine-to-alanine point mutants that would be anticipated to be limited in their ability to form disulfide-linked complexes. Only the C147A mutation formed crystals, which diffracted to 2.8 Å resolution.
2. Methods
2.1. Expression and purification of human cofilin 1
Expression and purification was performed essentially as described in Mezna et al. (2011 ▶). Overnight cultures of Escherichia coli BL21(DE3)pLysS cells expressing pGEX-KG-cofilin 1, or point mutants introduced using the QuikChange kit (Stratagene) according to the manufacturer’s protocol, were grown in 200 ml lysogeny broth containing 200 µg ml−1 ampicillin and 20 µg ml−1 chloramphenicol at 310 K. Each culture was diluted 1:10 into 2 l lysogeny broth with ampicillin and was grown to an OD600 of 0.6–1.0 at 310 K before induction with 100 µM isopropyl β-d-1-thiogalactopyranoside (IPTG) for 3 h at 310 K. Cells were pelleted by centrifugation at 4500g for 20 min at 277 K, resuspended in 5 ml Tris-buffered saline (TBS) pH 7.4 containing 1 mM DTT and 1× Complete protease-inhibitor cocktail tablet (Roche) and then disrupted by three 1 min rounds of sonication at 20% intensity using a Branson Digital Sonifier. Debris was removed by centrifugation at 12 000g for 30 min at 277 K and clarified supernatants were incubated with a 10 ml bed volume of TBS/DTT-washed glutathione Sepharose (GE) bead slurry in a Bio-Rad 14 cm Econo-Pac chromatography column overnight at 277 K. The beads were washed with >50 bed volumes of TBS/DTT and cofilin was released from the GST moiety by incubation with 250 units of bovine thrombin (Sigma) overnight at 277 K. The supernatant was removed and incubated with 30 µl of washed p-aminobenzamidine beads (Sigma) for 1 h at room temperature to remove thrombin. Protein concentration and purity were determined by running on a 15% polyacrylamide gel against bovine serum albumin standards, followed by staining with SimplyBlue Safestain (Invitrogen) and quantification using a LiCor Odyssey infrared scanner.
2.2. Filamentous actin severing
Filamentous actin (F-actin) severing assays were carried out as described in Scott et al. (2010 ▶). Globular actin (G-actin) was purified from rabbit muscle as described previously (Spudich & Watt, 1971 ▶) and maintained in G-buffer (2 mM Tris–HCl pH 8.0, 0.2 mM ATP, 0.5 mM DTT, 0.2 mM CaCl2). 1 mg ml−1 G-actin was labelled with pyrene (5 mg ml−1) in dimethylformamide for 15 h and dialyzed in G-buffer. Actin polymerization was initiated by the addition of 50 mM KCl, 2 mM MgCl2 and 0.1 mM EGTA; ultracentrifugation was then used to pellet the F-actin. The F-actin pellet was resuspended in G-buffer and its concentration was determined. For the severing assay, G-actin (95% unlabelled; 5% pyrene-labelled) was polymerized at 2 µM (final G-actin concentration) for 3–4 h until steady-state fluorescence was reached. Labelled F-actin (50 µl at 2 µM) was added to a PTI glass cuvette (with or without the addition of 10 µM cofilin) and the fluorescence (excitation at 339 nm; emission at 384 nm) was measured on a spectrofluorometer for 300 s. Data were normalized to allow comparison between data sets and were reported as percentage fluorescence over time and final percentage fluorescence.
2.3. Crystallization
The cofilin proteins were used at 10 and 20 mg ml−1 for crystallization trials at both 277 and 292 K. The crystallization screens ComPAS, JSCG+ and PACT from Qiagen and Ammonium Sulfate Grid Screen, Sodium Malonate Grid Screen, MPD Grid Screen, Crystal Screen HT, Crystal Screen Lite, PEG/Ion, PEG 6000 and PEG LiCl from Hampton Research were used. Cofilin C147A crystals grew in hanging drops with 2.4 M sodium malonate pH 7.0 (1:1 ratio of protein solution and precipitant solution) at 292 K. Initial data collection resulted in low-resolution data sets. In order to increase the data quality, two dehydration methods were applied (Nagendra et al., 1995 ▶). In the first method, crystals were transferred through increasing concentrations of sodium malonate from 2.4 to 3.0 M (in 0.2 M steps). Various incubation times were tested (5, 7.5, 10 and 15 min). The second method comprised air-dehydration of crystals for 5, 7.5, 10 and 15 min. The crystals were harvested directly after dehydration. The best diffraction was obtained from air-dried crystals.
2.4. Data collection, structure determination and model refinement
Cofilin C147A crystals were transferred into a cryoprotectant solution consisting of 20%(w/v) meso-erythritol (Sigma) in 2.8 M sodium malonate pH 7.0 and flash-cooled in liquid nitrogen. Data were collected at cryogenic temperatures on beamline I04 at Diamond Light Source and were processed with MOSFLM (Battye et al., 2011 ▶); the data were scaled in space group P3221 to a resolution of 2.8 Å based on the data-collection and refinement statistics presented in Table 1 ▶. The structure was solved by molecular replacement using MOLREP (Vagin & Teplyakov, 2010 ▶) with the yeast cofilin structure (PDB entry 1cfy; Fedorov et al., 1997 ▶) as the search model. The asymmetric unit contained one copy of cofilin C147A positioned by REFMAC5 (Vagin et al., 2004 ▶) using rigid-body and restrained refinement. The model was subsequently improved with Coot (Emsley et al., 2010 ▶) and further refined using PHENIX (Zwart et al., 2008 ▶). The geometry of the structure was validated using the MolProbity server (Chen et al., 2010 ▶). Figures were produced using ALINE (Bond & Schüttelkopf, 2009 ▶) and PyMOL (http://www.pymol.org). Protein interfaces were calculated using the Protein Interfaces, Surfaces and Assemblies (PISA) server at the European Bioinformatics Institute (http://www.ebi.ac.uk/pdbe/prot_int/pistart.html; Krissinel & Henrick, 2007 ▶). Superpositions of proteins and structural elements were performed using LSQMAN (Sierk & Kleywegt, 2004 ▶) and hydrogen-bond formation was analysed by the WHAT IF server (Hooft et al., 1996 ▶).
Table 1. Data-processing, scaling and refinement statistics.
Values in parentheses are for the highest resolution shell.
| Space group | P3221 |
| Unit-cell parameters () | a = b = 85.94, c = 85.29 |
| Resolution () | 74.432.80 (2.952.80) |
| Wavelength () | 0.9795 |
| Observed reflections | 253576 |
| Unique reflections | 13538 |
| Multiplicity | 5.8 (6.0) |
| Completeness (%) | 99.8 (100) |
| R meas † (%) | 7.6 (66.9) |
| R p.i.m. ‡ (%) | 3.2 (27.2) |
| I/(I) | 5.7 (1.3) |
| Wilson B (2) | 95.2 |
| Matthews coefficient (3Da1) | 4.92 |
| Solvent content (%) | 75.04 |
| No. of protein residues/atoms | 166/1294 |
| No. of water molecules | 16 |
| R work § (%) | 20.65 |
| R free ¶ (%) | 23.57 |
| R.m.s.d., bond lengths ()/angles () | 0.007/1.073 |
| Average isotropic thermal parameters (2) | |
| Main chain | 67.71 |
| Side chain | 69.84 |
| Water molecules | 66.69 |
| Ramachandran outliers (%) | 1.8 |
| MolProbity clashscore | 9.48 |
R
meas is defined as 
 .
.
R
p.i.m. is defined as 
 .
.
R
work is defined as 
 .
.
R free is calculated as R work but using 5% of the data that were excluded from refinement.
3. Results and discussion
3.1. Cofilin expression and filamentous actin severing
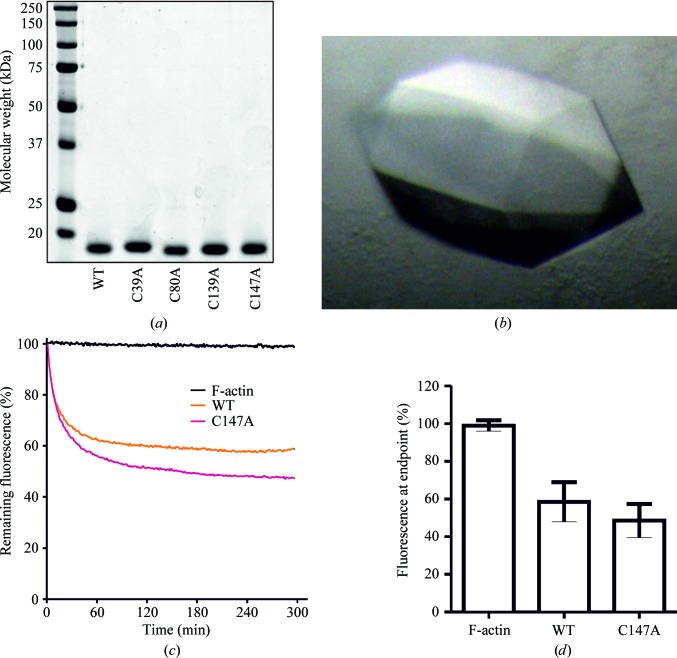
Given the possibility that recombinant cofilin might form disulfide-bonded multimers (Pfannstiel et al., 2001 ▶) that could affect crystallization, wild-type (WT) and four single cysteine-to-alanine mutants of human cofilin 1 (hCof1) were expressed in E. coli and purified to >95% purity based on SDS–PAGE analysis (Fig. 1 ▶ a). Crystallization of all five forms was attempted in parallel, but only the C147A mutant produced crystals (Fig. 1 ▶ b), which measured ∼400 × 200 × 200 µm. The single cysteine-to-alanine substitution did not affect the cofilin activity; the activity of C147A cofilin in an assay of pyrene-labelled actin severing (Cooper et al., 1983 ▶) did not differ from that of wild-type protein (Figs. 1 ▶ c and 1 ▶ d).
Figure 1.
Expression, crystallization and actin-severing activity of recombinant human cofilin 1. (a) Polyacrylamide gel electrophoresis of wild-type (WT) and four cysteine-to-alanine point-mutant forms of purified recombinant human cofilin 1. (b) C147A cofilin 1 crystals. (c) Fluorescence of pyrene-labelled filamentous actin without the addition of cofilin 1 (F-actin) or with the addition of WT or C147A cofilin 1 as indicated over time. The decrease in fluorescence indicates a shift in the proportion of F-actin towards G-actin. Lines represent the average of 8–12 determinations. (d) Means and standard deviation of the fluorescence remaining at the 300 s experiment endpoint for the indicated conditions for 8–12 determinations.
3.2. Cofilin crystallization
Recombinant hCof1 C147A was crystallized in the trigonal space group P3221, with unit-cell parameters a = b = 85.94, c = 85.29 Å. The crystals diffracted to 2.8 Å resolution and all 166 residues were accounted for in the electron density (data-processing, scaling and refinement statistics are reported in Table 1 ▶). The structure and experimental data have been deposited in the Protein Data Bank (PDB entry 4bex). To date, crystal structures of cofilin from Saccharomyces cerevisiae, Schizosaccharomyces pombe, Toxoplasma gondii, Plasmodium falciparum, P. berghei and Arabidopsis thaliana have been reported. Additionally, a number of NMR structures are available, including those of hCof1, Gallus gallus cofilin 1, Trypanosoma brucei cofilin and the more distantly related ADF from Leishmania donovani (Table 2 ▶).
Table 2. Structures used for comparison in this study, with PDB code, species, sequence identity and r.m.s.d. when superposed onto hCof1.
| PDB code | Protein | Species | Sequence identity (%) | R.m.s.d. () | Method |
|---|---|---|---|---|---|
| 4bex | hCof1 | H. sapiens | X-ray | ||
| 1q8x | Cofilin 1 | H. sapiens | 99 | 1.73 | NMR |
| 1ak6 | Destrin | H. sapiens | 65 | 1.83 | NMR |
| 1tvj | Cofilin | G. gallus | 77 | 1.51 | NMR |
| 1cof | Cofilin | S. cerevisiae | 28 | 1.11 | X-ray |
| 2i2q | Cofilin | S. pombe | 31 | 1.02 | X-ray |
| 1f7s | ADF | A. thaliana | 29 | 1.15 | X-ray |
| 2l72 | ADF | T. gondii | 12 | 1.99 | NMR |
| 2lj8 | Cofilin | T. brucei | 19 | 1.92 | NMR |
| 2kvk | Actin-severing and dynamics regulator | L. donovani | 17 | 1.53 | NMR |
| 3q2b | Cofilin 1 homologue | P. falciparum | 19 | 1.40 | X-ray |
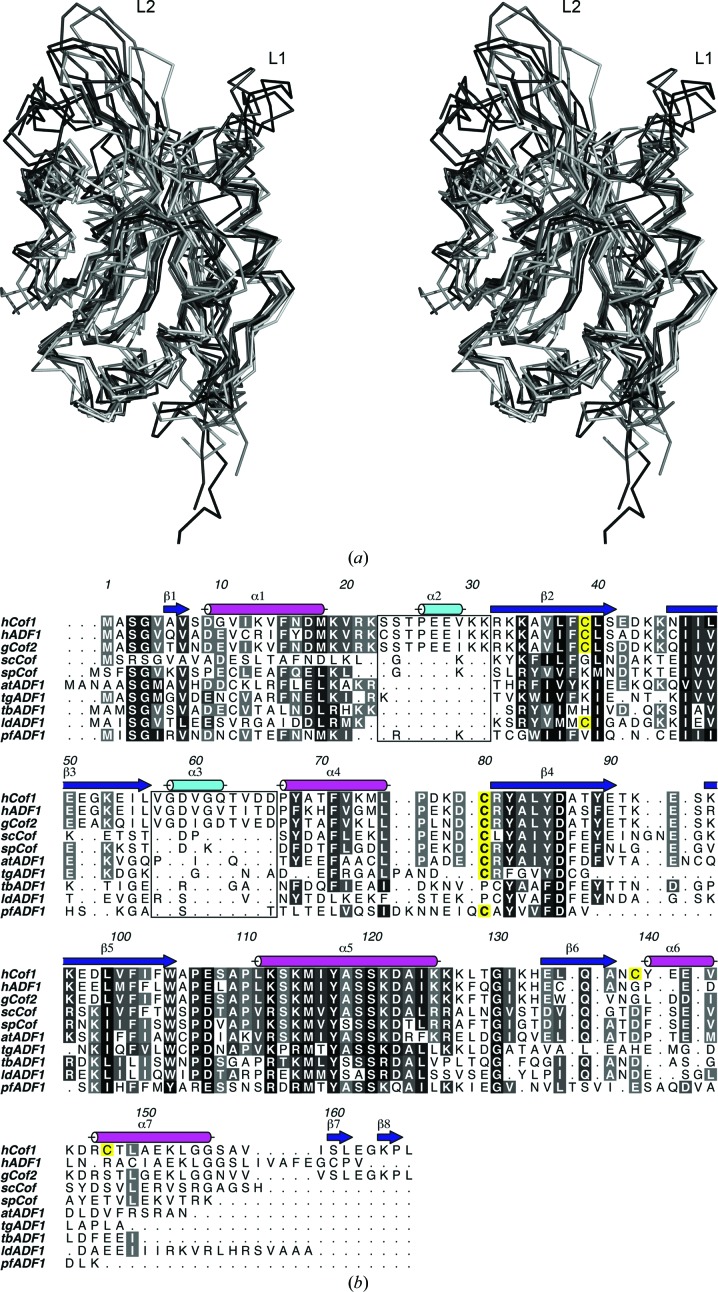
The overall cofilin fold is strongly conserved and all structures superpose with a root-mean-square deviation (r.m.s.d.) of less than 2 Å (Table 2 ▶ and Fig. 2 ▶ a). The structure is comprised of a central six-stranded mixed β-sheet, with strands β1 and β3 running in parallel followed by β4 and β5 in an antiparallel fashion and β6 running parallel to β5. The twisted sheet is flanked by α-helices on both sides (α1, α2 and α5 on one side and α3, α4, α6 and α7 on the other; Fig. 3 ▶). Helix α5 exhibits a kink at residue Ser120 which is typical throughout members of the cofilin fold. A particular feature that has so far only been observed in hCof1 is a short β-hairpin made up by strands β7 and β8 at the very C-terminus, forming a brief extension of the central sheet by its close proximity to β4. The function of this extension is unclear, but it may be involved in stabilizing β4 and the loop between β4 and β5. When aligning sequences of cofilin and ADF based on three-dimensional structure, two extended regions are apparent (Fig. 2 ▶ b). The first region is a loop (loop 1) located between residues 24 and 32 (based on hCof1 numbering) containing a short α-helix (α2). The sequence is well conserved in human ADF (hADF, also known as destrin) and cofilin from chicken (gCof), but is not present in yeast, plant or Chromalveolata forms.
Figure 2.
(a) Stereo figure of the superposition of all known structures, confirming the well conserved core, with minor changes in the loop regions. Loops 1 and 2 are labelled. (b) Structure-based sequence alignment of the available three-dimensional structures of ADF/cofilin (hCof1, human cofilin 1; hADF, human actin-depolymerizing factor 1; gCof, chicken cofilin; scCof, S. cerevisiae cofilin; spCof, S. pombe cofilin; atADF1, A. thaliana actin-depolymerizing factor 1; tgADF1, T. gondii actin-depolymerizing factor 1; tbADF1, T. brucei actin-depolymerizing factor 1; ldADF1, L. donovani actin-depolymerizing factor 1; pfADF1, P. falciparum actin-depolymerizing factor 1). The conserved residues are highlighted in shades of grey and the cysteines are highlighted in yellow. The secondary structure is based on the structure of hCof1. The two loops (loop 1 and 2) that are only found in higher vertebrates are highlighted by a box.
Figure 3.
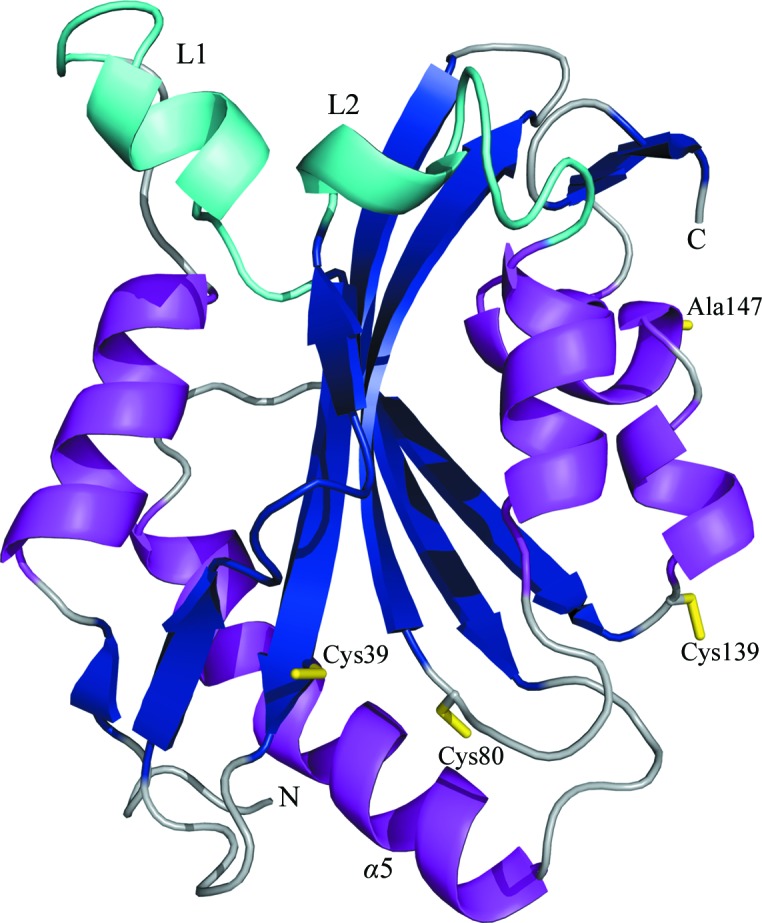
Cartoon representation of hCof1 C147A, with the central β-sheet (dark blue) sandwiched between α-helices (magenta). The two regions that are only observed in higher vertebrates are highlighted in cyan. Cysteines Cys39, Cys80 and Cys139 and C147A are shown as yellow sticks.
Loop 1 contains a bipartite nuclear localization signal (NLS) at positions 21–34 that has been shown to be essential for cofilin nuclear translocation through the nuclear pore complex (Abe et al., 1993 ▶; Munsie et al., 2012 ▶). It has been suggested that the flexibility of this loop allows it to function as a molecular switch to regulate cellular localization (Bowman et al., 2000 ▶), which is consistent with the poor electron-density quality and the average B factor of 149 Å2 for this loop compared with an overall average B factor of 68 Å2 for the complete hCof1 structure. Recent work by Munsie et al. (2012 ▶) identified a nuclear-export signal (NES) in the structurally conserved α1 leading into loop 1.
The second extended region (loop 2) between residues 57 and 67 also contains a short helix (α3) close in space to loop 1. The sequence is highly conserved between hCof1, hADF and gCof, but is not present in any homologues from lower organisms. The significance of this region is not known, but it has been speculated that it may be involved in the recognition of vertebrate-specific factors that are involved in the conformational changes in the NLS (Bowman et al., 2000 ▶).
The minimum unit for the cofilin fold is exhibited by ADF1 from P. falciparum. This structure maintains the central β-sheet, albeit with β4 and β5 and the loop connecting them shortened by 11 residues and a C-terminus that ends after α6. The remaining features are present in all known structures of cofilin-like domains.
It has been suggested that cofilin is regulated by the oxidation of cysteine residues (Bernstein & Bamburg, 2010 ▶). Of the four cysteine residues in hCof (Cys39, Cys80, Cys139 and Cys147; Figs. 2 ▶ and 3 ▶), one is highly conserved throughout higher eukaryotes (Cys80), while another is conserved mainly amongst higher vertebrates (Cys39). Chromalveolata cofilins typically have only one cysteine located near, but not in the exact same position as, hCof1 Cys80. However, the Cys139 and Cys147 residues are not conserved across kingdoms, suggesting that any important regulatory roles that they might play are restricted to actin-cytoskeletal dynamics in higher species. If the cysteine oxidation states are important regulators of cofilin activity in general, it is likely that residues Cys39 and Cys80 are involved given their wide conservation. As Cys39 and Cys80 are in close proximity to each other (7.3 Å between the Cα atoms; Fig. 3 ▶), they are obvious candidates for internal disulfide-bond formation.
3.3. Crystal packing
The structure of hCof1 C147A contains a monomer in the asymmetric unit; however, a disulfide bond is formed between Cys139 and a symmetry-related Cys139. Analysis of the structure using PISA suggests that hCof1 is a dimer with a dimerization interface of 574 Å2 from each subunit (corresponding to 7% of the overall solvent-accessible surface) surrounding this disulfide bond. Mass spectrometry has identified the oxidation of Cys139 in cells treated with hydrogen peroxide or diamide (Martínez-Acedo et al., 2012 ▶). Consistent with this finding, both untreated and hydrogen peroxide-treated recombinant cofilin were found to be oxidized in vitro at Cys139 (Klemke et al., 2008 ▶), suggesting that this residue would be likely to be involved in the formation of intermolecular disulfide bonds. However, analysis of the oligomerization of recombinant cofilin induced in vitro with 5,5′-dithio-2-nitrobenzoic acid led to the inference that Cys39 and Cys147 are likely participants (Pfannstiel et al., 2001 ▶). By definition, more than one cysteine residue in each cofilin molecule would participate in the formation of oligomers larger than dimers, making it difficult to determine which cysteine residues are paired using biochemical methods. Therefore, it remains to be determined whether this is a biological dimer or a crystallographic artefact.
3.4. Actin binding
Cofilin contains two specific regions involved in actin binding: the main binding site involved in the binding of both G-actin and F-actin (Nishida et al., 1985 ▶), and the F-loop involved in binding to F-actin (on the neighbouring unit of filamentous actin). To date, the only crystal structure of a cofilin-like fold in complex with actin deposited in the Protein Data Bank is of the C-terminal cofilin-like domain of mouse twinfilin (Twf-C) in complex with a single unit of actin at 2.5 Å resolution (PDB entry 3daw; Paavilainen et al., 2008 ▶).
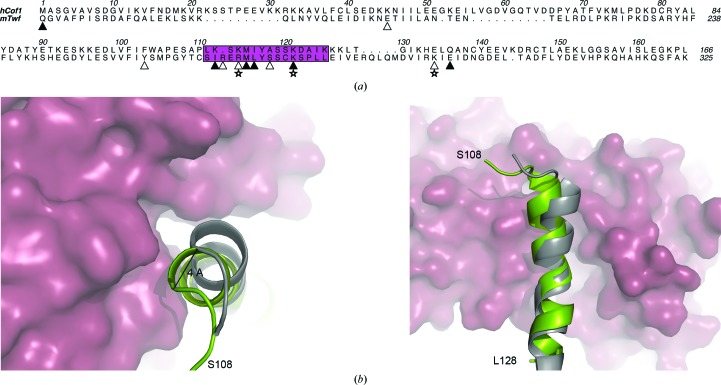
The main actin-binding site of cofilin consists of helix α5 (residues 111–125; hCof1 numbering), which is well conserved throughout all ADF/cofilin structures, flanked by the hCof1 N-terminus and the C-terminal part of β6 (Fig. 4 ▶). This area is responsible for binding to both G-actin and F-actin, and the residues involved were identified using the Twf-C complex structure and by mutagenesis studies (Pope et al., 2004 ▶; Paavilainen et al., 2008 ▶). To model the binding of hCof1 to actin, hCof1 was superposed onto the structure of Twf-C, with an r.m.s.d. of 1.54 Å for 101 Cα atoms. In the Twf-C structure, the helix corresponding to hCof1 α5 fits into a groove between actin subdomains 1 and 3, with a buried surface of 1200 Å2 of Twf-C and 1110 Å2 of actin, making up 15% and 6.5% of the overall solvent-accessible areas of the respective proteins. A number of residues predicted to form salt bridges or hydrogen bonds between Twf-C and actin, and the corresponding residues in hCof1, are highlighted in Fig. 5 ▶(a). Although hCof1 superimposes well onto the Twf-C structure overall, there is a clash between the N-terminal end of hCof1 helix α5 and a small helix of actin (residues 137–145) in the model of the complex. This clash does not occur in the Twf-C crystal structure, as the helix corresponding to α5 in hCof1 has shifted after the typical kink at Ser120 (hCof1 numbering), resulting in the Cα backbone moving 4 Å (Fig. 5 ▶ b). This reorganization of Twf-C aligns the helix with the actin groove to allow a better fit between the two proteins. This is reflected in the fact that the Twf-C–actin complex has 19 hydrogen bonds between the protein and actin, whereas the model of hCof1 and actin has only nine based on PISA predictions (Krissinel & Henrick, 2007 ▶).
Figure 4.
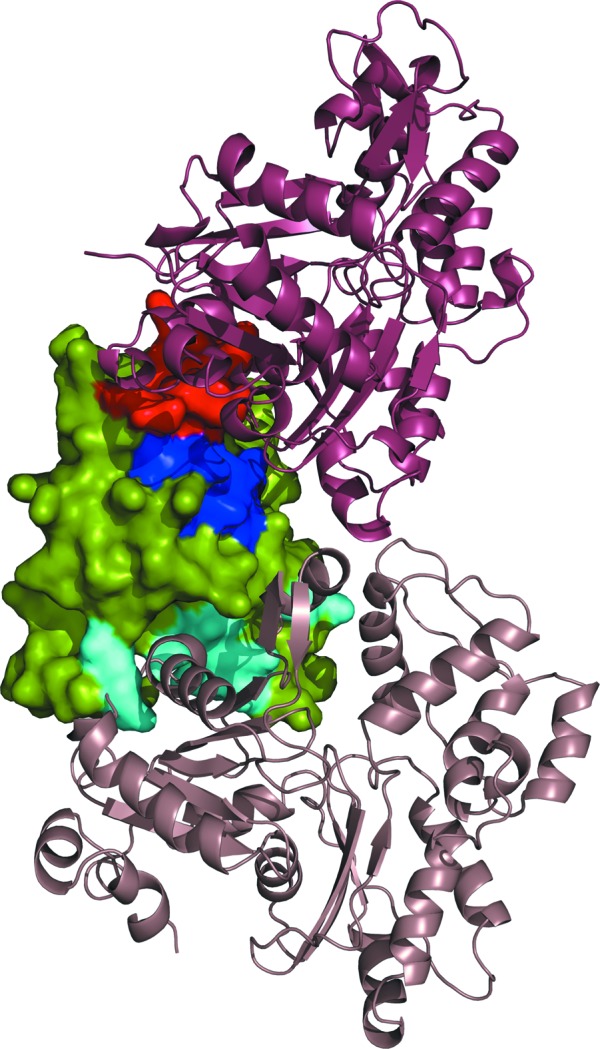
Surface and cartoon representation of hCof1 (surface) and the modelled interactions with G-actin (raspberry) and F-actin (beige). The regions of hCof1 that form interactions with actin in the model are shown in dark blue. The regions that form a clash owing to helix α5 in the non-actin-binding form are shown in red and the region that is likely to be involved in the binding to F-actin on a different subunit is shown in cyan.
Figure 5.
(a) Structure-based sequence alignment of hCof1 and the C-terminal part of twinfilin (Twf-C). The actin-binding helix (α5 in hCof1) is shown in magenta. Residues that are predicted to form hydrogen bonds between actin and Twf-C or hCof1 are marked with filled triangles and residues that are only predicted to form hydrogen bonds between actin and Twf-C are marked with open triangles. Salt bridges between actin and Twf-C are labelled with open stars. (b) Top and side view of a cartoon representation of the actin-binding helix from Twf-C (grey) and hCof1 (green). The hCof1 helix clashes with actin (raspberry surface). The 4 Å shift of the helix to accommodate binding to actin is highlighted.
Superposing helix α5 from hCof1 onto the equivalent helix from other available ADF/cofilin structures (Table 2 ▶) using LSQMAN (Sierk & Kleywegt, 2004 ▶) gives a mean r.m.s.d. of 0.8 Å for 20 Cα atoms [human destrin (PDB entry 1ak6; Hatanaka et al., 1996 ▶) has the highest r.m.s.d. of 1.26 Å, whereas S. cerevisiae cofilin (PDB entry 1cof; Fedorov et al., 1997 ▶) has the lowest r.m.s.d. of 0.4 Å]. However, when hCof1 helix α5 is superposed onto the equivalent helix in Twf-C, the r.m.s.d. is 2.47 Å for 21 Cα atoms. Comparing the network of hydrogen bonds predicted to form with at least one donor or acceptor amongst residues 108–128 (hCof1 numbering, corresponding to 263–283 in Twf-C) reveals that the majority of these are formed by main-chain interactions, mainly making up the helix. The helical hydrogen-bond pattern is broken around residue Cys275 (Ser120 in hCof1), leading to the helix being effectively broken in half in Twf-C. The majority of the hydrogen bonds in hCof1 have corresponding hydrogen bonds in Twf-C, although some are specific to each structure and these are mainly located in the N-terminal part of α5 undergoing the shift. The hCof1-specific hydrogen bonds are all involved in forming contacts between α5 and the end of β5, which precedes α5 via a short loop, whereas the Twf-C specific hydrogen bonds are formed on the side of the helix facing actin and some are direct hydrogen bonds between Twf-C and actin. As this break in the actin-binding helix is only observed in the structure in which the cofilin fold is in complex with actin, a possibility is that this movement is caused by the interaction between the two proteins to strengthen the binding between them. Alternatively, it is also possible that this subtle change in the interface between actin and cofilin accommodates the binding of proteins such as CAP1 (adenylyl cyclase-associated protein 1), the N-terminus of which binds to both actin and cofilin (Moriyama & Yahara, 2002 ▶).
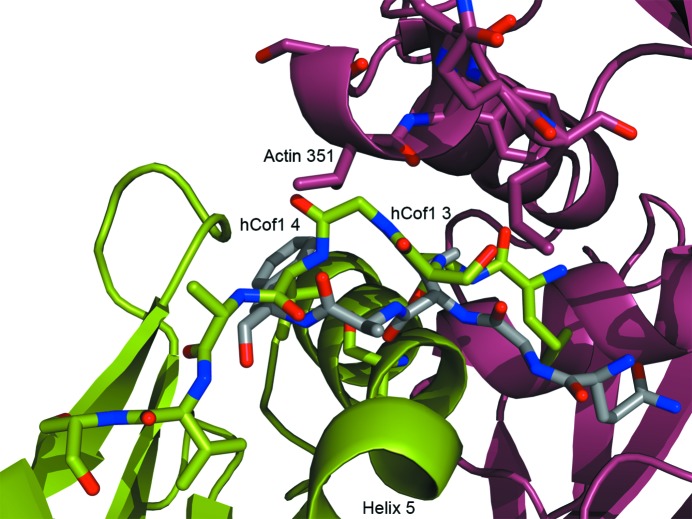
The main actin-binding site helix is flanked by the hCof1 N-terminus. There is a clash between the two proteins in this model of hCof1 and actin, but as this region is normally flexible in solution (Pope et al., 2004 ▶), as reflected by the higher B factors for this region compared with the overall structure (49 and 38 Å2, respectively), it is likely that the ordered position exhibited in our structure is owing to crystal packing. This N-terminus is also disordered in other crystal structures of cofilin 1 (Fedorov et al., 1997 ▶). A shift of the three N-terminal residues is required for the hCof1 N-terminus to mimic the position of the equivalent region of Twf-C (Fig. 6 ▶). This movement is important, as phosphorylation of Ser3 in hCof inhibits actin binding (Moriyama et al., 1996 ▶; Nagaoka et al., 1996 ▶), most probably owing to interactions with Lys126 or Lys127 that would occlude the binding site (Frantz et al., 2008 ▶).
Figure 6.
Cartoon and stick representation of hCof1 (green) modelled with actin (raspberry). The N-terminal part of hCof1 would clash with actin in this figure. However, a shift of the three N-terminal residues to a position similar to that of the N-terminal part of Twf-C (grey) would allow an induced fit.
The final part of the interface, on the opposite side of the helix, is made up of residues Lys294 and Glu296 in Twf-C, corresponding to residues Glu134 and Gln136 in hCof1. It is likely that no rearrangement will be required for this part of the interface.
A second actin-binding site, called the F-site, only binds to filamentous actin and to a different actin subunit than the G-site. The only structure available of this is the 9 Å resolution electron-microscopy map of human actin and cofilin, and a model of these based on restrained refinement of available structures (PDB entries 2btf and 1q8g, respectively; Galkin et al., 2011 ▶). This binding site comprises a small loop between α7 and β7 of hCof1 (residues 154–158) and the N-terminal part of β5 (residues 94–98; Fig. 4 ▶). There is a small shift of the loop between hCof1 and the EM model of cofilin 2; however, no significant changes can be determined at this resolution.
Based on the NMR structure of hCof1 (Pope et al., 2004 ▶; Frantz et al., 2008 ▶), it has been suggested that the binding to filamentous actin is regulated by a protonated His133 forming a salt bridge to Asp98 at low pH (pH 6.5). Using molecular dynamics, Frantz et al. (2008 ▶) suggested that deprotonation of His133 allows a new interaction between Asp98 and Lys96 to be formed instead and that this small conformational change may attenuate the binding affinity of the F-site. The pH of our crystallization condition was 7.0, and although Asp98 is directed towards His133 based on the electron density, the 4.5 Å distance between the reactive atoms is too long to form a salt bridge. At this pH it appears that there may be weak interactions between His133 and Asp98, but we find no evidence of salt bridges between any of these residues in our structure.
4. Conclusions
We have determined the crystal structure of human cofilin 1 C147A to a resolution of 2.8 Å. When modelling the interactions between hCof1 and G-actin a shift of α5 became apparent and we have speculated that this movement is typical of all cofilin-like folds when interacting with actin, which would allow an induced fit that enhances the binding of the two proteins, with a doubling of the number of hydrogen bonds formed. The protein forms an intermolecular disulfide bond between Cys139 and Cys139 on a symmetry-related protomer; however, it remains to be determined whether this linkage occurs in nature.
Supplementary Material
PDB reference: human cofilin 1, 4bex
Acknowledgments
This research was supported by Cancer Research UK and the Breast Cancer Campaign (2012MaySP008). We thank the Diamond Light Source for access to beamline I04 (Proposal No. MX1229), which contributed to the results presented here, and Laura Machesky (Beatson Institute for Cancer Research) for advice and reagents for actin-severing experiments.
References
- Abe, H., Nagaoka, R. & Obinata, T. (1993). Exp. Cell Res. 206, 1–10. [DOI] [PubMed]
- Battye, T. G. G., Kontogiannis, L., Johnson, O., Powell, H. R. & Leslie, A. G. W. (2011). Acta Cryst. D67, 271–281. [DOI] [PMC free article] [PubMed]
- Bernstein, B. W. & Bamburg, J. R. (2010). Trends Cell Biol. 20, 187–195. [DOI] [PMC free article] [PubMed]
- Bernstein, B. W., Shaw, A. E., Minamide, L. S., Pak, C. W. & Bamburg, J. R. (2012). J. Neurosci. 32, 6670–6681. [DOI] [PMC free article] [PubMed]
- Bond, C. S. & Schüttelkopf, A. W. (2009). Acta Cryst. D65, 510–512. [DOI] [PubMed]
- Bowman, G. D., Nodelman, I. M., Hong, Y., Chua, N.-H., Lindberg, U. & Schutt, C. E. (2000). Proteins, 41, 374–384. [DOI] [PubMed]
- Chen, V. B., Arendall, W. B., Headd, J. J., Keedy, D. A., Immormino, R. M., Kapral, G. J., Murray, L. W., Richardson, J. S. & Richardson, D. C. (2010). Acta Cryst. D66, 12–21. [DOI] [PMC free article] [PubMed]
- Cooper, J. A., Walker, S. B. & Pollard, T. D. (1983). J. Muscle Res. Cell Motil. 4, 253–262. [DOI] [PubMed]
- Emsley, P., Lohkamp, B., Scott, W. G. & Cowtan, K. (2010). Acta Cryst. D66, 486–501. [DOI] [PMC free article] [PubMed]
- Fedorov, A. A., Lappalainen, P., Fedorov, E. V., Drubin, D. G. & Almo, S. C. (1997). Nature Struct. Biol. 4, 366–369. [DOI] [PubMed]
- Frantz, C., Barreiro, G., Dominguez, L., Chen, X., Eddy, R., Condeelis, J., Kelly, M. J., Jacobson, M. P. & Barber, D. L. (2008). J. Cell Biol. 183, 865–879. [DOI] [PMC free article] [PubMed]
- Galkin, V. E., Orlova, A., Kudryashov, D. S., Solodukhin, A., Reisler, E., Schröder, G. F. & Egelman, E. H. (2011). Proc. Natl Acad. Sci. USA, 108, 20568–20572. [DOI] [PMC free article] [PubMed]
- Hatanaka, H., Ogura, K., Moriyama, K., Ichikawa, S., Yahara, I. & Inagaki, F. (1996). Cell, 85, 1047–1055. [DOI] [PubMed]
- Hooft, R. W. W., Sander, C. & Vriend, G. (1996). Proteins, 26, 363–376. [DOI] [PubMed]
- Klemke, M., Wabnitz, G. H., Funke, F., Funk, B., Kirchgessner, H. & Samstag, Y. (2008). Immunity, 29, 404–413. [DOI] [PubMed]
- Krissinel, E. & Henrick, K. (2007). J. Mol. Biol. 372, 774–797. [DOI] [PubMed]
- Martínez-Acedo, P., Núñez, E., Gómez, F. J., Moreno, M., Ramos, E., Izquierdo-Álvarez, A., Miró-Casas, E., Mesa, R., Rodriguez, P., Martínez-Ruiz, A., Dorado, D. G., Lamas, S. & Vázquez, J. (2012). Mol. Cell. Proteomics, 11, 800–813. [DOI] [PMC free article] [PubMed]
- Mezna, M., Wong, A. C., Ainger, M., Scott, R. W., Hammonds, T. & Olson, M. F. (2011). J. Biomol. Screen. 17, 460–468. [DOI] [PMC free article] [PubMed]
- Minamide, L. S., Maiti, S., Boyle, J. A., Davis, R. C., Coppinger, J. A., Bao, Y., Huang, T. Y., Yates, J., Bokoch, G. M. & Bamburg, J. R. (2010). J. Biol. Chem. 285, 5450–5460. [DOI] [PMC free article] [PubMed]
- Moriyama, K., Iida, K. & Yahara, I. (1996). Genes Cells, 1, 73–86. [DOI] [PubMed]
- Moriyama, K. & Yahara, I. (2002). J. Cell Sci. 115, 1591–1601. [DOI] [PubMed]
- Munsie, L. N., Desmond, C. R. & Truant, R. (2012). J. Cell Sci. 125, 3977–3988. [DOI] [PubMed]
- Nagaoka, R., Abe, H. & Obinata, T. (1996). Cell Motil. Cytoskeleton, 35, 200–209. [DOI] [PubMed]
- Nagendra, H. G., Sudarsanakumar, C. & Vijayan, M. (1995). Acta Cryst. D51, 390–392. [DOI] [PubMed]
- Nishida, E., Muneyuki, E., Maekawa, S., Ohta, Y. & Sakai, H. (1985). Biochemistry, 24, 6624–6630. [DOI] [PubMed]
- Paavilainen, V. O., Oksanen, E., Goldman, A. & Lappalainen, P. (2008). J. Cell Biol. 182, 51–59. [DOI] [PMC free article] [PubMed]
- Pfannstiel, J., Cyrklaff, M., Habermann, A., Stoeva, S., Griffiths, G., Shoeman, R. & Faulstich, H. (2001). J. Biol. Chem. 276, 49476–49484. [DOI] [PubMed]
- Pope, B. J., Zierler-Gould, K. M., Kühne, R., Weeds, A. G. & Ball, L. J. (2004). J. Biol. Chem. 279, 4840–4848. [DOI] [PubMed]
- Poukkula, M., Kremneva, E., Serlachius, M. & Lappalainen, P. (2011). Cytoskeleton, 68, 471–490. [DOI] [PubMed]
- Scott, R. W., Hooper, S., Crighton, D., Li, A., König, I., Munro, J., Trivier, E., Wickman, G., Morin, P., Croft, D. R., Dawson, J., Machesky, L., Anderson, K. I., Sahai, E. A. & Olson, M. F. (2010). J. Cell Biol. 191, 169–185. [DOI] [PMC free article] [PubMed]
- Sierk, M. L. & Kleywegt, G. J. (2004). Structure, 12, 2103–2111. [DOI] [PubMed]
- Spudich, J. A. & Watt, S. (1971). J. Biol. Chem. 246, 4866–4871. [PubMed]
- Vagin, A. A., Steiner, R. A., Lebedev, A. A., Potterton, L., McNicholas, S., Long, F. & Murshudov, G. N. (2004). Acta Cryst. D60, 2184–2195. [DOI] [PubMed]
- Vagin, A. & Teplyakov, A. (2010). Acta Cryst. D66, 22–25. [DOI] [PubMed]
- Zwart, P. H., Afonine, P. V., Grosse-Kunstleve, R. W., Hung, L.-W., Ioerger, T. R., McCoy, A. J., McKee, E., Moriarty, N. W., Read, R. J., Sacchettini, J. C., Sauter, N. K., Storoni, L. C., Terwilliger, T. C. & Adams, P. D. (2008). Methods Mol. Biol. 426, 419–435. [DOI] [PubMed]
Associated Data
This section collects any data citations, data availability statements, or supplementary materials included in this article.
Supplementary Materials
PDB reference: human cofilin 1, 4bex


