Correction to: Mol Syst Biol (2015) 11: 781. DOI 10.15252/msb.20145794 | Published online 12 January 2015
In our previously published study, we provided high-resolution measurements of RNA synthesis and degradation lifetimes and proposed a model to explain the coordination of gene expression in Escherichia coli given the measured constraints. As part of that study, we reported 847 RNA lifetimes (Supplementary Table S4) measured in exponentially growing bacteria, and 1,259 RNA lifetimes (Supplementary Table S7) measured in stationary phase bacteria. For an exponential process, lifetime is related to half-life as follows: half-life = (ln2) × lifetime. To report the distribution of the lifetimes, we described the data using average and standard deviation, which we reported as 2.5 min (s.d. 2.5 min) and 4.5 min (s.d. 2.5 min) for exponential and stationary phase, respectively, in Figures 3 and 4, as well as in the main text.
Since the publication of the above article, we have realized that the average lifetimes and standard deviations were miscalculated, although the reported dataset and histograms are correct. The new average lifetimes and standard deviations are 4.1 min (s.d. 6.2 min) and 7.8 min (s.d. 48.1 min) for exponentially growing bacteria and stationary phase bacteria, respectively. Additionally, we now report that the median lifetime in exponential phase is 2.8 min and the median lifetime in stationary phase is 4.6 min. We regret that this error occurred; however, it does not substantively change our interpretation of the data. Because of the change in the spread of the distributions, we can no longer make the point that stationary phase distribution of RNA lifetime is relatively narrow compared to that of RNA lifetimes measured in exponentially growing E. coli cells, which was a minor point in our article. The more important claim that the average lifetimes measured with correction for RNA polymerase elongation is shorter than previously published microarray data (average lifetime ∼8 min) still holds. Moreover, our kinetic model of RNA synthesis and degradation does not depend on the reported average lifetimes and standard deviations.
Given that the average lifetime is of interest to the general scientific community, we thought it is important to correct the average lifetimes in our report. The updated figures are presented below, where the only changes concern the number of average lifetime. The dataset does not require any changes.
We also noticed that the synthesis rates and degradation rates shown in Figure 4C and D were calculated using an older dataset. We have corrected the calculations and provide here the updated figure panels. The conclusion that RNA abundance is better explained by synthesis rather than degradation still stands, although the R2 values (the degree to which RNA abundance can be explained) are slightly different.
Additionally, we would like to correct a number from a reference. In the 2nd paragraph under the section “Global behavior of RNA degradation”, we mentioned that the average RNA lifetime in E.coli reported by previous papers is 6 min. This is incorrect; the average half-life, not lifetime, is ∼6 min (lifetime equivalent is ∼8 min).
We would also like to clarify that in reporting the transcript lifetime, we averaged the lifetimes up to the first six 300-nt bins. This was done because measurements grow increasingly inaccurate toward the 3′ end due to the elongation effect, which limits the number of points for fitting. Thus, to fairly represent and compare transcripts of different lengths, we calculated the average transcript lifetime from the 5′-most 1,800 nt of data.
Updated figures and figure legends
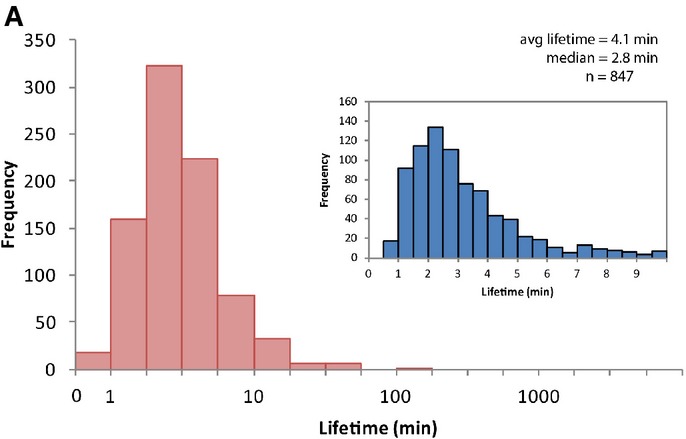
Figure 3A.

The lifetimes of 847 transcripts were measured, with an average lifetime of 4.1 min (standard deviation 6.2 min) and median lifetime of 2.8 min. The histogram displays the data on all 847 transcripts and the distribution of lifetimes up to 10 min (current figure panels) is shown in the inset.
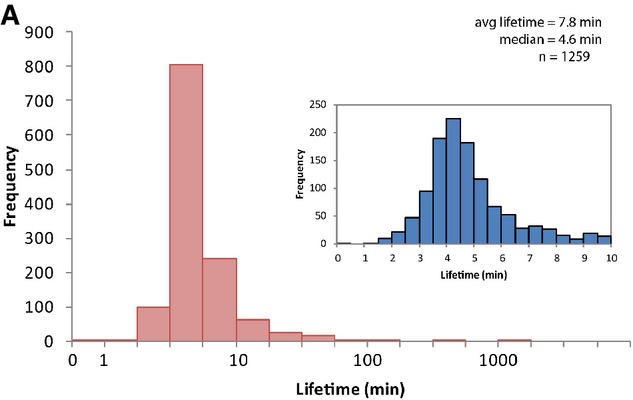
Figure 4A.

The lifetimes of 1,259 transcripts in stationary phase E. coli were measured. The average lifetime is 7.8 min (standard deviation = 48.1 min), and the median lifetime is 4.6 min. The histogram displays the data on all 1,259 transcripts and the distribution of lifetimes up to 10 min (current figure panels) is shown in the inset.
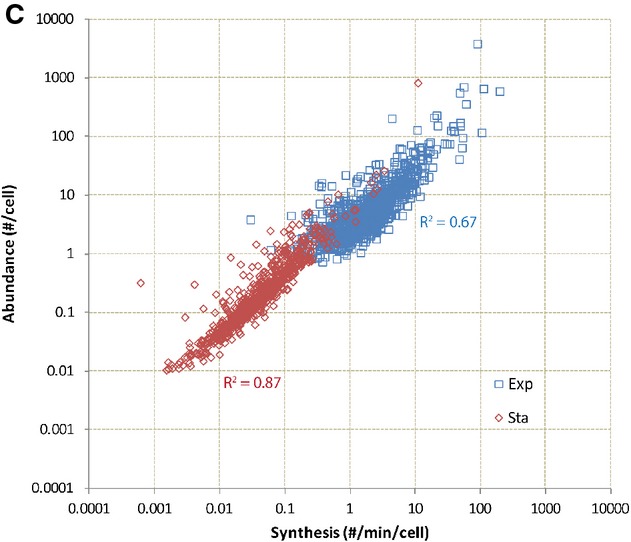
Figure 4C.

RNA abundance can be explained by RNA synthesis rate for both exponential and stationary phase cells. RNA abundance and transcription initiation rates correlate well for the exponential phase measurements (R2 = 0.67) and have an even stronger correlation in stationary phase (R2 = 0.87).
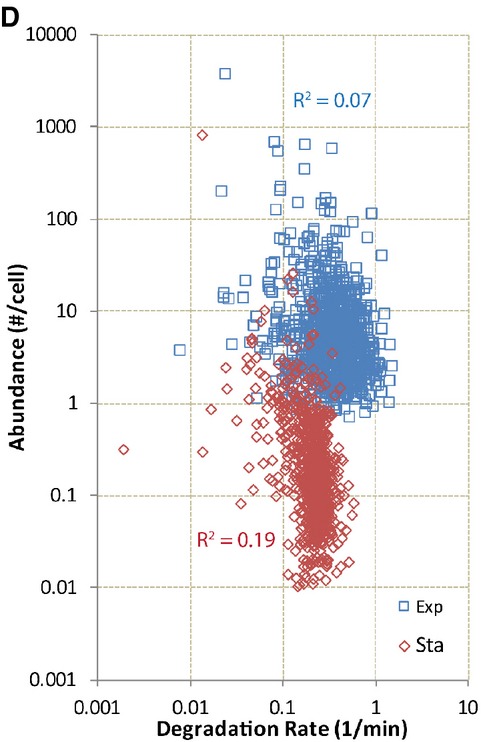
Figure 4D.

RNA abundance is poorly correlated to degradation rate (1/lifetime) in exponential and stationary phase E. coli. Degradation rates do not correlate well with RNA abundance in exponential (R2 = 0.07) and stationary phase (R2 = 0.19), in contrast to the correlation of RNA abundance with synthesis rates.


