

Abstract
Different locomotor gaits in mammals, such as walking or galloping, are produced by coordinated activity in neuronal circuits in the spinal cord. Coordination of neuronal activity between left and right sides of the cord is provided by commissural interneurons (CINs), whose axons cross the midline. In this study, we construct and analyse two computational models of spinal locomotor circuits consisting of left and right rhythm generators interacting bilaterally via several neuronal pathways mediated by different CINs. The CIN populations incorporated in the models include the genetically identified inhibitory (V0D) and excitatory (V0V) subtypes of V0 CINs and excitatory V3 CINs. The model also includes the ipsilaterally projecting excitatory V2a interneurons mediating excitatory drive to the V0V CINs. The proposed network architectures and CIN connectivity allow the models to closely reproduce and suggest mechanistic explanations for several experimental observations. These phenomena include: different speed-dependent contributions of V0D and V0V CINs and V2a interneurons to left–right alternation of neural activity, switching gaits between the left–right alternating walking-like activity and the left–right synchronous hopping-like pattern in mutants lacking specific neuron classes, and speed-dependent asymmetric changes of flexor and extensor phase durations. The models provide insights into the architecture of spinal network and the organization of parallel inhibitory and excitatory CIN pathways and suggest explanations for how these pathways maintain alternating and synchronous gaits at different locomotor speeds. The models propose testable predictions about the neural organization and operation of mammalian locomotor circuits.
Key points
Coordination of neuronal activity between left and right sides of the mammalian spinal cord is provided by several sets of commissural interneurons (CINs) whose axons cross the midline. Genetically identified inhibitory V0D and excitatory V0V CINs and ipsilaterally projecting excitatory V2a interneurons were shown to secure left–right alternation at different locomotor speeds.
We have developed computational models of neuronal circuits in the spinal cord that include left and right rhythm-generating centres interacting bilaterally via three parallel pathways mediated by V0D, V2a–V0V and V3 neuron populations.
The models reproduce the experimentally observed speed-dependent left–right coordination in normal mice and the changes in coordination seen in mutants lacking specific neuron classes.
The models propose an explanation for several experimental results and provide insights into the organization of the spinal locomotor network and parallel CIN pathways involved in gait control at different locomotor speeds.
Introduction
The basic pattern of neural activity controlling locomotion in mammals is generated by neural circuits within the spinal cord (Grillner, 1981, 2006; Kiehn, 2006, 2011). These circuits define all aspects of locomotor activity, including rhythm generation, intralimb flexor–extensor alternation, and left–right limb coordination. Left–right coordination is controlled by commissural interneurons (CINs) whose axons cross the midline of the spinal cord. Electrophysiological experiments in the rodent spinal cord have revealed monosynaptic excitatory and disynaptic inhibitory pathways to contralateral neurons mediated by inhibitory and excitatory CINs (Kjärulff & Kiehn, 1997; Butt & Kiehn, 2003; Quinlan & Kiehn, 2007). Recent experiments have demonstrated that these pathways involve genetically identified inhibitory (V0D) and excitatory (V0V) subtypes of V0 CINs (Lanuza et al. 2004; Talpalar et al. 2013). Ablation of both subtypes leads to left–right synchronized, hopping-like activity at all locomotor frequencies. Selective ablation of the inhibitory V0D CINs disturbs left–right alternation at low frequencies, yet maintains alternation at high frequencies (Talpalar et al. 2013). In contrast, ablation of the excitatory V0V CINs maintains alternation at low frequencies and switches to synchronized activity at high frequencies. In addition, a subset of ipsilaterally projecting excitatory V2a neurons is critically involved in left–right alternation at high locomotor speeds (Crone et al. 2008, 2009; Zhong et al. 2011). A subset of V2a neurons directly projects to V0V CINs (Crone et al. 2008), and their selective ablation mimics the V0V ablation (Crone et al. 2009). In addition, there are functionally excitatory CIN pathways that support left–right synchronization when the inhibitory CIN pathways are suppressed; at present, the probable components of these pathways are the excitatory V3 CINs (Zhang et al. 2008). However, the exact organization of the spinal circuits and commissural pathways that provides speed-dependent control of left–right alternation remains unknown.
In this study, we constructed two computational models of spinal neuronal circuits. The models described interacting neuron populations with each neuron modelled in the Hodgkin–Huxley style. Each model contained left and right rhythm generators consisting of flexor and extensor centres (excitatory neuron populations with intrinsic rhythmogenic properties) inhibiting each other via inhibitory interneuron populations. The left and right centres interacted bilaterally via parallel commissural pathways involving populations of V0D, V0V, V2a and V3 neurons. Rhythm generation in the network was based on persistent sodium current and was primarily defined by endogenous rhythmic activity in the flexor centres (Zhong et al. 2012). The oscillation frequency was controlled by the average level of neuronal excitation defined by leakage reversal potentials that were changed to imitate frequency control in the spinal cord by changing neuroactive drug concentrations. The organization of commissural pathways mediated by V0D, V2a–V0V and V3 neurons allowed the models to reproduce the experimental data showing the differential frequency-dependent involvement of these neurons in left–right coordination of spinal activity (Crone et al. 2009; Talpalar et al. 2013).
Our study provides mechanistic understanding of how the dynamic interactions of parallel CIN pathways coordinate left–right activity during locomotion, and how selective activation/inhibition of these pathways may provide speed-dependent control of locomotor gait.
Methods
Model structure
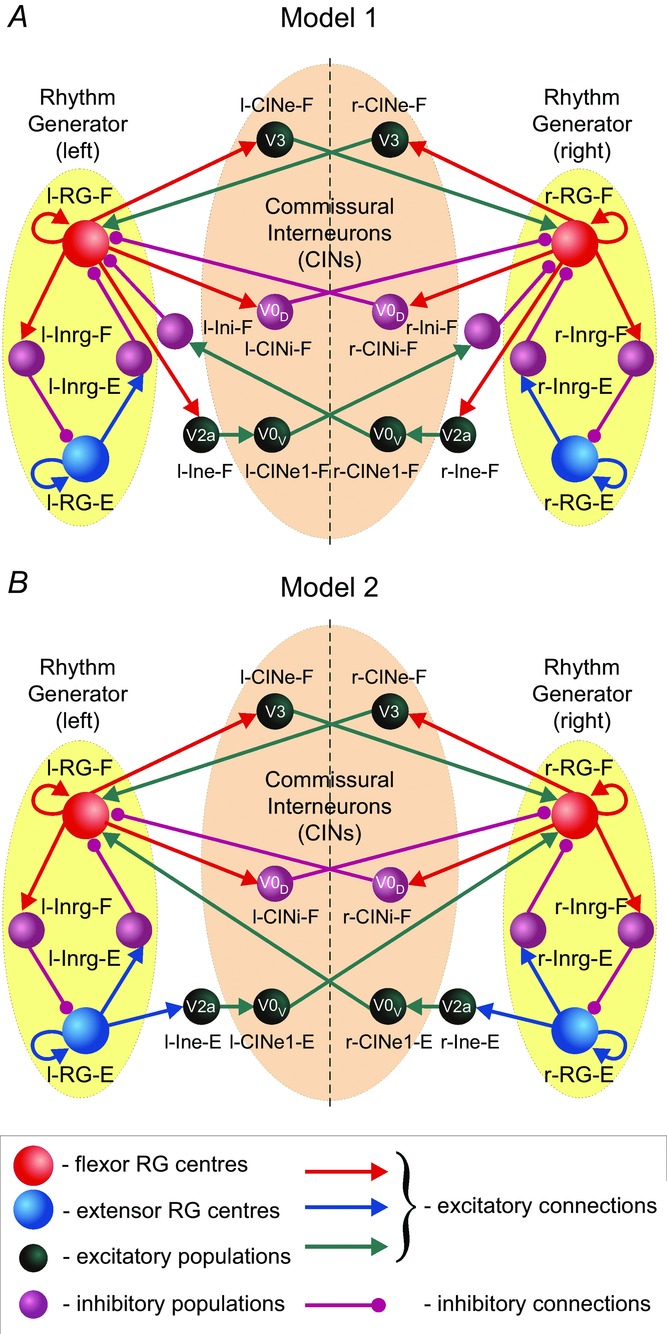
The models of the spinal circuits described in this paper represent bilaterally symmetric networks of interacting neural populations (Fig.1A and B). Each model contains left and right rhythm generating (RG) networks. Each RG network consists of two RG neural populations representing flexor and extensor centres, respectively. The flexor (RG-F) and extensor (RG-E) centres on each side reciprocally inhibit each other via inhibitory populations. The left–right interactions between the RG networks are mediated by several populations of CINs, representing the genetically identified V0 (V0D and V0V subtypes) and V3 CINs, and involve the ipsilaterally projecting populations of excitatory (V2a) and inhibitory (Ini) interneurons. The detailed description of model structures is provided in the Results section.
Figure 1.
Schematics of the bilaterally organized spinal circuits in Models 1 and 2
A, Model 1. B, Model 2. Neural populations are shown by spheres. Excitatory and inhibitory synaptic connections are represented by arrows and circles, respectively. The RG in each side of the cord includes RG-F and RG-E interacting via the inhibitory Inrg-F and Inrg-E populations. Suffix F- or E- in the population names indicate that the population is co-active with the flexor or extensor RG centre, respectively. The left and right RGs interact via CINs: CINe-F (V3), CINi-F (V0D) and CINe1-F (V0V) in Model 1 (A), and CINe-F (V3), CINi-F (V0D) and CINe-E (V0V) in Model 2 (B). CIN, commissural interneuron; -E, extensor; -F, flexor; l-, left; r-, right; RG, rhythm generator.
Single neuron models
All neurons are simulated in the Hodgkin–Huxley style as single compartment models. The membrane potential, V, in neurons of the left and right RG-E and RG-F populations is described by the following differential equation
| 1 |
where C is the membrane capacitance and t is time.
In all other populations, the neuronal membrane potential is described as follows:
| 2 |
The ionic currents in eqns 1 and 2 are described as follows:
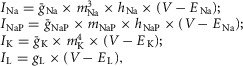 |
3 |
where INa is the fast sodium current with maximal conductance  ; INaP is the persistent (slowly inactivating) sodium current with maximal conductance
  (present only in RG neurons); IK is the delayed-rectifier potassium current with maximal conductance
  ; and IL is the leakage current with constant conductance gL; ENa, EK and EL are the reversal potentials for sodium, potassium and leakage currents, respectively; variables m and h with indexes indicating ionic currents are the activation and inactivation variables of the corresponding ionic channels. The values of maximal conductances for ionic currents and initial average values for the leakage reversal potential in each neuron type are specified in Table1.
Table 1.
Maximal conductances of ionic channels and basic leakage reversal potential  (at α = 0) in different neuron types
| Neuron type |
 , mS/cm2 , mS/cm2
|
 , mS/cm2 , mS/cm2
|
 , mS/cm2 , mS/cm2
|
gL, mS/cm2 |
 , mV , mV |
|---|---|---|---|---|---|
| Models 1 and 2 | |||||
| RG-F | 25 | 0.75(±0.0375) | 2 | 0.07 | −67 (±0.67) |
| RG-E | 25 | 0.75(±0.0375) | 2 | 0.07 | −60 (±0.6) |
| Inrg-F | 10 | 5 | 0.1 | −67 (±1.34) | |
| Inrg-E | 10 | 5 | 0.1 | −67 (±1.34) | |
| CINe-F (V3) | 40 | 5 | 0.7 | −59 (±1.77) | |
| CINi-F (V0D) | 10 | 5 | 0.1 | −68 (±1.36) | |
| Model 1 | |||||
| Ini-F | 10 | 5 | 0.1 | −64 (±1.28) | |
| Ine-F (V2a) | 40 | 5 | 0.8 | −60.5 (±1.21) | |
| CINe1-F (V0V) | 10 | 5 | 0.1 | −62 (±1.24) | |
| Model 2 | |||||
| Ine-E (V2a) | 40 | 5 | 0.8 | −60.5 (±1.21) | |
| CINe-E (V0V) | 10 | 5 | 0.1 | −62 (±1.24) | |
CIN, commissural interneuron; E, extensor; F, flexor; RG, rhythm generator.
The values of  ,
,  and gL conductances (10, 5 and 0.1 mS cm–2, respectively) represented these values for our generic neuron model and were used for all inhibitory interneurons and V0 CINs. An increased value of
  (25 mS cm–2) and reduced value for
  (2 mS cm–2) were assigned in all RG neurons to accommodate additional incorporation of
  to provide a necessary bursting regime. An increased value of
  (40 mS cm–2) and gL (0.7–0.8 mS cm–2) were assigned for V2a and V3 neurons to provide their recruitment and a stronger (then in V0 neurons) dependence of their activity on neuronal excitability (
 ) increased with increasing α imitating an increasing drug concentration.
Activation m and inactivation h of voltage-dependent ionic channels (e.g. Na+, NaP and K+) in eqn 3 are described by the following differential equations:
| 4 |
where m∞i(V) and h∞i(V) define the voltage-dependent steady-state activation and inactivation of the channel i, respectively, and τmi(V) and τhi(V) define the corresponding time constants. Activation of the sodium channels is considered to be instantaneous (tmNa = tmNaP = 0). The expressions for channel kinetics are given in Table2.
Table 2.
Steady-state activation and inactivation variables and time constants for voltage-dependent ionic channels
| Ionic channels | m∞(V) (V in mV); | τm(V), ms; |
|---|---|---|
| h∞(V) (V in mV) | τh(V), ms. | |
| Fast sodium, Na+ |  |
τmNa = 0; |
 |
||
 |
||
| Persistent sodium, NaP |  |
τmNaP = 0; |
 |
 |
|
| Potassium delayed-rectifier,K+ |  |
 |
| hK = 1 |
Although there are limited descriptions of the electrical properties and firing characteristics for the selected neuron types (e.g. V3, see Zhang et al. 2008; Borowska et al. 2013, and V2a, see Dougherty & Kiehn, 2010; Zhong et al. 2010), these data are incomplete and do not include experimentally measured parameters for ionic channel kinetics, which would be necessary for the realistic, data-based modelling of each neuron type. In addition, none of these studies described the changes in neuronal properties as a function of neuroactive drug concentrations, which would be important here. Therefore, our neuron models have been constructed using generic neuron descriptions in the Hodgkin–Huxley style. Moreover, because our network models are based not on interactions between single neurons, but on interactions between neuron populations with neuronal parameters randomly distributed within each population (see below), the intrinsic membrane properties of individual neurons (except for the parameters of INaP kinetics in the RG neurons) play a minor role in the activity of neural populations activity and overall functioning of the models.
The synaptic excitatory (ISynE with conductance gSynE and reversal potential ESynE) and inhibitory (ISynI with conductance gSynI and reversal potential ESynI) currents are described as follows:
| 5 |
where gSynE and gSynI are equal to zero at rest and are activated by the excitatory or inhibitory inputs, respectively:
 |
6 |
where S{x} = x, if x ≥ 0, and 0 if x < 0. Each spike arriving to neuron i in a target population from neuron j in a source population at time tkj increases the excitatory synaptic conductance by  if the synaptic weight wji > 0, or increases the inhibitory synaptic conductance by
  if the synaptic weight wji < 0.
  and
and  define an increase in the excitatory or inhibitory synaptic conductance, respectively, produced by one arriving spike at |wji| = 1. τSynE and τSynI are the decay time constants for gSynE and gSynI, respectively.
The following general neuronal parameters were assigned: C = 1 μF cm−2; ENa = 55 mV; EK = −80 mV; ESynE = −10 mV; ESynI = −70 mV;  =
=  = 0.05 mS cm–2; τSynE = τSynI = 5 ms.
Neuron populations
Each RG population (representing RG-F or RG-E centres) contains 200 neurons. All other populations, including CINs, V2a, and inhibitory populations, consist of 50 neurons each. The number of neurons in the populations was selected to provide a reasonable compromise between the reproducibility of simulation results (despite randomized neuronal characteristics) and simulation time. The greater number of neurons in the RG populations (200) was selected because of the low probability of interconnections within these populations (P = 0.1, see below and in Table3).
Table 3.
Average weights ( ) and probabilities (P) of synaptic connections
| Source population (type) | Target populations (type) ( , probability of connection P) , probability of connection P) |
|---|---|
| Models 1 and 2 | |
| i-RG-F | i-RG-F (0.009, P = 0.1*); i-Inrg-F (0.02, P = 1); |
| i-CINe-F (V3) (0.01, P = 1); i-CINi-F (V0D) (0.005, P = 1) | |
| i-RG-E | i-RG-E (0.009, P = 0.1*); i-Inrg-E (0.02, P = 1) |
| i-Inrg-F | i-RG-E (–0.5, P = 0.1) |
| i-Inrg-E | i-RG-F (–0.04, P = 0.1) |
| i-CINe-F (V3) | c-RG-F (0.002, P = 1) |
| i-CINi-F (V0D) | c-RG-F (–0.009, P = 1) |
| Model 1 | |
| i-RG-F | i-Ine-F (V2a) (0.01, P = 1) |
| i-Ini-F | i-RG-F (–0.01, P = 1) |
| i-Ine-F (V2a) | i-CINe1-F (V0V) (0.12, P = 1) |
| i-CINe1-F (V0V) | c-Ini-F (0.06, P = 1) |
| Model 2 | |
| i-RG-E | i-Ine-E (V2a) (0.01, P = 1) |
| i-Ine-E (V2a) | i-CINe-E (V0V) (0.12, P = 1) |
| i-CINe-E (V0V) | c-RG-F (0.0022, P = 1) |
c-, contralateral population; CIN, commissural interneuron; E, extensor; F, flexor; i-, ipsilateral population; l-, left; r-, right; RG, rhythm generator.
The shape of population bursts in RG populations was dependent on the probability of excitatory interconnections within these populations. The probability P = 0.1 was found experimentally to provide (qualitatively) the most realistic shape of RG-F population bursts. It is interesting that this probability corresponds to the estimated probability of mutual connections between Shox2 interneurons (Dougherty & Kiehn, unpublished observation) considered candidates for the RG interneurons (Dougherty et al. 2013).
Random synaptic connections between the neurons of interacting populations are calculated before each simulation based on an assigned probability of connection, P, so that, if a population A is assigned to receive an excitatory (or inhibitory) input from a population B, then each neuron in population A receives the corresponding synaptic input from each neuron in population B with the probability P{A, B}. If P{A, B}<1, a random number generator is used to define the existence of each synaptic connection; otherwise (if P{A, B} = 1) each neuron in population A receives synaptic input from each neuron of population B. Values of synaptic weights (wji) are also set using a random number generator based on the average values of these weights  and the variances, which are defined as 5% of
  for excitatory connections and 10% of
  for inhibitory connections. The average weights and probabilities of connections are specified in Table3.
Heterogeneity of neurons within each population is provided by random distributions of the leakage reversal potentials ELiO (see mean values ± SD for each i-th population in Table1) and initial conditions for the values of membrane potential and channel kinetics variables. The initial values of ELiO and all initial conditions are assigned before simulations from the defined average values and variances using a random number generator, and a settling period of 10–200 s is allowed in each simulation before data collection.
Simulations of changes in the locomotor frequency by neuroactive drugs
To simulate changes in frequency of rhythmic oscillations, which in the isolated rodent spinal cords were obtained by changing the concentrations of neuroactive drugs such as N-methyl-d-aspartate (NMDA; Talpalar & Kiehn, 2010), we introduced a parameter α, that defined a NMDA-evoked increase in the basal level of excitability (membrane depolarization) in all neurons of population i:
| 7 |
where  is the average basal value of the neuronal leakage reversal potential in this population at α = 0.
By introducing this parameter we did not intend to simulate the exact mechanisms of NMDA actions on individual spinal neurons, which are currently unknown. Instead, this parameter was used to simulate the general effects of NMDA in the isolated spinal cord preparations, i.e. an increase in both neuronal activity and locomotor frequency (Talpalar & Kiehn, 2010).
To represent and analyse the results of changes in α, we used two methods. In the first method, time series of key model characteristics (e.g. the values of integrated population activity) are computed continuously during slow ramp increases of α (with a rate selected depending on the oscillation frequency). In the second method, α is changed by fixed steps, and simulations are run at each fixed value of α. In each simulation, the first 10–20 transitional cycles are omitted to allow stabilization of model variables, and the values of key model characteristics are averaged for 10–20 consecutive cycles. The computed characteristics include the oscillation frequency, amplitudes of integrated population activity and phase difference of flexor–extensor, left flexor–right flexor and left extensor–right extensor oscillations (defined by the integrated activity of the corresponding RG centres). The timing of onsets and offsets of flexor and extensor bursts is determined at a threshold level equal to 25% of the average maximal burst value. The time interval between two consecutive flexor burst onsets is defined as the locomotor cycle period. In each cycle, the time between the onsets of the flexor and following extensor burst is defined as the flexor phase, and the time between the onset of the extensor and the next flexor burst is defined as the extensor phase. The average frequency is calculated as the inverse of the average cycle period. The calculated phase differences are normalized to the cycle period with the scale of [0, 1]. Phase differences are averaged for 10–20 consecutive cycles and estimated by circular statistics (Kjäerulff & Kiehn, 1996; Berens, 2009; Talpalar & Kiehn, 2010). Mean phase differences in the range of 0.25–0.75 are considered as indications of alternating activity, while phase differences outside this range indicate synchronization. The calculated characteristics are plotted versus the parameter α, characterizing the average neuronal excitation, or versus the average frequency of oscillations.
Simulation tools
All simulations were performed using the custom neural simulation package NSM 4.0 developed at Drexel University by S. N. Markin, I. A. Rybak and N. A. Shevtsova. This simulation package was previously used for the development of several spinal cord models (Rybak et al. 2006a,b, 2013, 2014; McCrea & Rybak, 2007, 2008; Zhong et al. 2012; Brocard et al. 2013; Jasinski et al. 2013). Differential equations were solved using the exponential Euler integration method with a step size of 0.1 ms.
Experimental data
The experimental data included for comparison with our modelling results were obtained in the previous studies by Talpalar et al. (2013) and Crone et al. (2009), with addition of some complementary data not previously published. All experiments were approved by the local ethical committees and performed in accordance with European or American guidelines for the care and use of laboratory animals. Briefly, experiments were performed in the isolated spinal cords of wild-type (control) and transgenic mice with ablated V0, V0D or V0V neurons (the detailed description of the transgenic lines of mice used can be found in Talpalar et al. 2013) or ablated V2a neurons (Crone et al. 2009). Mice aged embryonic day 18.5 (with genetically deleted V0D neurons) or newborn mice aged 1–2 days (for all other studies) were used. The isolated spinal cords were perfused with normal Ringer's solution (see Talpalar & Kiehn, 2010; Zhong et al. 2011; Talpalar et al. 2013). Locomotor-like activity was induced by the application of exogenous mixtures of serotonin (5-hydroxytryptamine) and NMDA. The locomotor frequency was controlled by changing the concentration of NMDA (Talpalar & Kiehn, 2010; Zhong et al. 2011; Talpalar et al. 2013). All recordings were performed at room temperature (20–24°C). Locomotor activity was recorded with suction electrodes attached to the L2 and L5 lumbar roots on both sides of the cord. The raw activity was band-pass filtered at 100 Hz–1 kHz. Data points for analysing cycle periods and phases were taken after the locomotor activity had stabilized 10–15 min after the initial burst of activity. All details of recordings and data processing can be found in Talpalar et al. (2013).
Results
Modelling of rhythm-generating flexor and extensor centres
The RG core in the spinal locomotor networks is thought to be composed of ipsilaterally projecting excitatory neurons (Grillner, 2006; Kiehn, 2006, 2011; Hägglund et al. 2013). In rodents, some classes of these neurons have been identified by expression of certain molecular markers (Dougherty et al. 2013). It appears that the RG populations are spatially distributed along several spinal segments on each side of the cord (Kiehn & Kjäerulff, 1998) and are able, under certain conditions, to independently generate a flexor-related or extensor-related rhythmic bursting (Hägglund et al. 2013). In our models (see Fig.1A and B), these RG populations are represented by the left (l-) and right (r-) RG-F and RG-E centres. Each such population (centre) consists of 200 neurons modelled in the Hodgkin–Huxley style. Following our previous models (Rybak et al. 2006a,b, 2013, 2014; McCrea & Rybak, 2007, 2008; Brocard et al. 2013; Jasinski et al. 2013) the intrinsic rhythmic bursting properties in these populations are based on a persistent (slowly inactivating) sodium current, INaP incorporated in each neuron and on mutual excitatory synaptic interactions within each population. The probability of connections between neurons within each population was set to 10%.
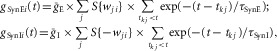
Figure 2A–D illustrates the results of modelling the behaviour of a single, isolated RG centre during a slow ramp increase of neuronal excitation, defined by the average neuronal leakage reversal potential  changing from –70 to –58 mV. At low values of
  the population was silent (Fig.2A and B). Bursting emerged as
  depolarized (Fig.2A and B, see also the blue area in Fig.2G). With a further increase of
  , the burst frequency monotonically increased (Fig.2B and C). In contrast, the burst amplitude initially went up (Fig.2B and D), because of the increasing synchronization of bursts generated by individual neurons (Fig.2A). Then, with further increasing neuronal depolarization, the amplitude progressively decreased (Fig.2B and D) due to INaP inactivation in each neuron leading to a reduction of spike frequency in neuronal bursts (Butera et al. 1999; Rybak et al. 2004). Finally, for the larger (most depolarized) values of
  , bursting switched into sustained or tonic activity (Fig.2A and B, see also the yellow area in Fig.2G). The simulated effects of the increase of neuronal excitation on the population burst frequency and amplitude (Fig.2C and D) were qualitatively similar to the reported effects of increased concentration of neuroactive drugs, such as NMDA, on the frequency and amplitude of locomotor oscillations in the isolated cord (Talpalar & Kiehn, 2010). In these experiments, the bursting frequency recorded from the flexor ventral root (L2) increased with increased drug concentration, while the amplitude initially increased and then decreased (Fig.2E and F). This correspondence between experimental and modelling data provided an additional validation for using the changes in neuronal excitation as a tool to reliably mimic changes in frequency corresponding to different speeds of locomotion. In addition, because these changes in burst amplitude and frequency in the model were defined by the INaP kinetics (see Butera et al. 1999; Rybak et al. 2003, 2004), this correspondence may also support the suggestion that locomotor-like bursting in the isolated spinal cord involves INaP-dependent mechanisms.
Figure 2.
Modelling of isolated rhythm-generating population
A, raster plot of activity of 50 neurons from the 200 neuron population (each horizontal line represents a neuron and each dot represents a spike). B, integrated population activity represented by the average histogram of population activity [spikes/(neuron × s), bin = 100 ms]. A and B,  was linearly increased from –70 to –58 mV for 400 s. Voltage regions of silence, bursting and tonic activity are denoted at the bottom. Bursting emerges at lower values of
  in a limited number of neurons. With increasing
  more neurons become involved and the population bursting becomes strongly synchronized. Further increase of
  leads to a transition to tonic activity. C and D, burst frequency of population activity (C) and burst amplitude (D) as a function of
  . E and F, frequency (E) and amplitude (F) of locomotor activity recorded in vitro from the flexor ventral root as a function of NMDA (red cycles) or d-glutamate (black squares). The amplitude was normalized with respect to the maximal amplitude). Graphs display means ± SD (n = 20 each). Data from Talpalar & Kiehn (2010, fig. 2C,D). G, changes of
  for flexor (
 , red line) and extensor (
 , blue line) rhythm-generating centres during increasing neuronal excitation (α) across areas for silence (white), bursting (blue) and tonic (yellow) population activity.
As shown in Fig.2A and B, a population of neurons with INaP-dependent bursting properties and mutually excitatory synaptic interconnections can be silent, generate intrinsic bursting or exhibit sustained (tonic) activity, which depends on external excitatory drive to the population and/or on an average level of neuronal excitation (see Butera et al. 1999; Smith et al. 2000; Rybak et al. 2003, 2004, 2014; Jasinski et al. 2013). In our models, the RG population was used for simulation of both flexor and extensor centres. Therefore, under certain conditions, e.g. at a particular range of neuronal excitation, each RG-F and RG-E centre can generate rhythmic bursting. However, we assumed that, under the considered experimental conditions, only flexor centres operate in a bursting mode, whereas the extensor centres, if isolated, operate in the mode of tonic activity (Zhong et al. 2012). In our models this occurred if the neurons of the RG-E centres were initially more excited (yellow area in Fig.2G) than neurons of the RG-F centres (blue area in Fig.2G). To provide alternating flexor–extensor activity on each side, the RG-F and RG-E centres were connected reciprocally via inhibitory populations (Inrg-E and Inrg-F, respectively, see Fig.1A and B). Therefore, the RG-E centres also exhibited rhythmic bursting, but this bursting resulted from the rhythmic inhibition by the corresponding ipsilateral flexor centres. Such asymmetric operation of RG-F and RG-E centres allowed the model to reproduce the specific patterns of motor activity in the spinal cord observed during spontaneous, non-resetting burst deletions, showing that missing flexor bursts were always accompanied by sustained ipsilateral extensor activity, whereas missing extensor bursts occurred without an effect on flexor bursting (Zhong et al. 2012).
Layout of left–right coordinating circuits
Computational models of the spinal circuits described in this study have been developed with a primary goal to reproduce and interpret the results of the recent experimental studies of left–right coordination of rhythmic activity in the rodent spinal cord and its dependence on locomotor speed. Therefore, in addition to the neuronal circuits mediating reciprocal inhibition between the RG-F and RG-E centres on each side, our models included left–right coordinating circuits. The basis of the proposed connectivity came from electrophysiological experiments in rodents that showed the presence of dual inhibitory CIN pathways to contralateral motoneurons, involving both inhibitory CINs acting monosynaptically and excitatory CINs acting through local inhibitory neurons (Kjärulff & Kiehn, 1997; Butt & Kiehn, 2003; Quinlan & Kiehn, 2007), as well as excitatory CIN pathways to these motoneurons (Kjärulff & Kiehn, 1997; Quinlan & Kiehn, 2007). The role of genetically identified V0 CINs in left–right coordination was recently revealed using selective ablation of these neurons or their inhibitory, V0D, or excitatory, V0V, subtypes and investigating the speed-dependent contribution of each subtype to left–right alternation (Talpalar et al. 2013). Also, the excitatory V3 neurons were suggested to participate in left–right synchronization (Zhang et al. 2008; Rabe et al. 2009; Borowska et al. 2013). In addition, a subset of excitatory ipsilaterally projecting V2a interneurons was shown to maintain left–right alternation at high locomotor frequencies and some of these neurons were found to project to V0V neurons (Crone et al. 2008, 2009; Zhong et al. 2011).
Two slightly distinct models have been considered in our study, Model 1 and Model 2 (see Fig.1A and B). Each model contains left and right RGs consisting of RG-F and RG-E centres reciprocally inhibiting each other via inhibitory neural populations, Inrg-E and Inrg-F, respectively. In both models, the inhibitory l-CINi-F and r-CINi-F populations, simulating the V0D CINs, mediate mutual inhibition between left and right flexor centres. The excitatory l-CINe-F and r-CINe-F populations, simulating the excitatory V3 CINs, mediate mutual excitation between these centres (Fig.1A and B). In addition, both models have CIN pathways that include the ipsilaterally projecting excitatory populations (l-Ine-F and r-Ine-F in Model 1, and l-Ine-E and r-Ine-E in Model 2), simulating the V2a neurons that project to the corresponding excitatory populations, simulating the V0V CINs (l-CINe1-F and r-CINe1-F, respectively, in Model 1, and l-CINe-E and r-CINe-E, respectively, in Model 2) (Fig.1A and B).
The only difference between the models is in the organization of the V2a–V0V pathways. In Model 1, the left and right V2a populations (l-Ine-F and r-Ine-F) receive excitatory inputs from the ipsilateral flexor centres (l-RG-F and r-RG-F), and the corresponding V0V populations (l-CINe1-F and r-CINe1-F) project to the contralateral populations of inhibitory interneurons (r-Ini-F and l-Ini-F) that inhibit the contralateral flexor centres (see Fig.1A). In Model 2, the left and right V2a populations (l-Ine-E and r-Ine-E) receive excitatory inputs from the ipsilateral extensor centres (l-RG-E and r-RG-E), and the corresponding V0V populations (l-CINe-E and r-CINe-E) directly project to and excite the contralateral flexor centres (see Fig.1B). Our goal was to investigate each of the two suggested V2a–V0V pathways separately. However, we do not exclude the possibility that both pathways are present in the real spinal cord network, which would result in a simple merging of both models into a single united model.
V2a neurons and their recruitment with increasing neuronal excitation
In both our models, V2a neurons play a specific role in coordinating left–right activity through their direct activation of V0V CINs. This suggested connection was based on experimental findings that a subset of V2a neurons project to Evx1-expressing V0V CINs (Crone et al. 2008) and that these neurons are necessary for left–right alternation at high speeds of locomotion (Crone et al. 2009). In addition, a subset of V2a neurons is recruited and increases firing activity with increased locomotor frequency (Zhong et al. 2011, see Fig.3A).
Figure 3.
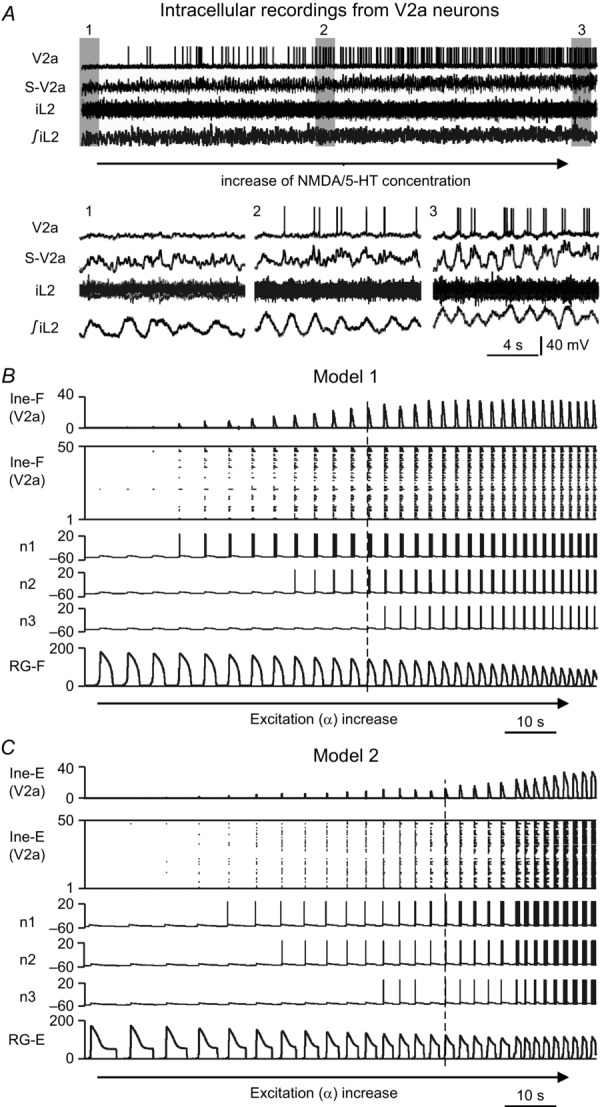
Recruitment of V2a neurons with increasing neuronal excitation
A, intracellular recording from a V2a neuron during a NMDA/5-HT-evoked fictive locomotion. The drugs were slowly added to the preparation by bath application. Bursting of the neuron was initiated and accelerated during gradually increasing frequency of rhythmic activity. Insets 1, 2 and 3 show expanded recordings indicated by grey bars in the upper diagram. S-V2a trace represents smoothed and filtered V2a activity; iL2, activity of the ipsilateral ventral root; ∫iL2, integrated and rectified iL2 activity. Reproduced from Zhong et al. (2011, fig. 4a–d). B and C, V2a population activity in Model 1, Ine-F (B), and in Model 2, Ine-E (C), which increases during slow gradual elevation of neuronal excitation α. α was increased from 0.04 to 0.09 in Model 1 (B) and from 0.03 to 0.09 in Model 2 (C) for 100 s. Each panel shows (from top to bottom): integrated activity of the corresponding V2a populations, raster plot of all 50 neurons, membrane potentials of three selected V2a neurons (n1, n2 and n3), and integrated activity of RG-F (B) or RG-E (C) populations. Integrated population activity in the top and bottom traces of (B) and (C) represent the average histogram of population activity [spikes/(neuron × s), bin = 100 ms]. -E, extensor; -F, flexor; 5-HT, 5-hydroxytryptamine; RG, rhythm generator.
The recruitment and increase in firing activity in some V2a neurons with increased locomotor frequency were reproduced in our models when the neuronal excitation α was progressively increased (Fig.3B and C) to simulate an increase in NMDA concentration. In Model 1, there are two V2a populations (l-Ine-F and r-Ine-F) that receive inputs from the left and right flexor centres, respectively (see Fig.1A). The integrated activity of one of these populations and the corresponding raster plot are shown in two top traces in Fig.3B. The integrated activity of the ipsilateral flexor centre is shown at the bottom. Changes in the membrane potentials of three V2a neurons (n1, n2 and n3) with different initial levels of excitation selected from this population are shown in the middle. The V2a neurons are sequentially recruited to participate in the population activity despite a reduction of the amplitude of the activity in the corresponding flexor centre. This strong dependence of neuronal activity and recruitment of V2a neurons on α in the model was provided by a high value of leakage conductance (gL) in these neurons, relative to other interneurons and V0 CINs (except for the V3 neurons, see Table1).
Model 2 also has two V2a populations (l-Ine-E and r-Ine-E), but in contrast to Model 1, they receive inputs from the extensor centres (Fig.1B). The behaviour of one of these populations and three selected neurons are shown in Fig.3C. Similar to Model 1, the individual V2a neurons in Model 2 are sequentially recruited to participate in the V2a population activity, which dramatically increases with an increase in excitation and bursting frequency.
Performances of the intact models
To evaluate the performance of the two models at different locomotor frequencies, and the speed-dependent contribution of different CIN pathways and neuron types to maintenance of left–right coordination, we simulated the effects of increasing NMDA concentration on the frequency of locomotor oscillations in the isolated spinal cord (Talpalar & Kiehn, 2010). This was done by progressive or stepwise changes of the parameter α that characterized an increase of average neuronal excitation in all populations of the model (see Methods).
The results of simulations using Model 1 and Model 2 are shown in Fig.4A and B, respectively. For each model, the integrated activity of all four RG centres (l-RG-E, l-RG-F, r-RG-F and r-RG-E) and all left CIN populations [l-CINe-F (V3), l-CINi-F (V0D), and l-CINe1-F (V0V) for Model 1, and l-CINe-F (V3), l-CINi-F (V0D), and l-CINe-E (V0V) for Model 2] are shown while the average neuronal excitation (α) was slowly increased. In each panel, the right CIN populations behaved similarly to the left ones and are not shown. In both models, increasing neuronal excitation resulted in acceleration of rhythmic bursting and reduction of the amplitudes of activity of RG centres with maintenance of left–right and flexor–extensor alternation throughout the whole range of α values.
Figure 4.
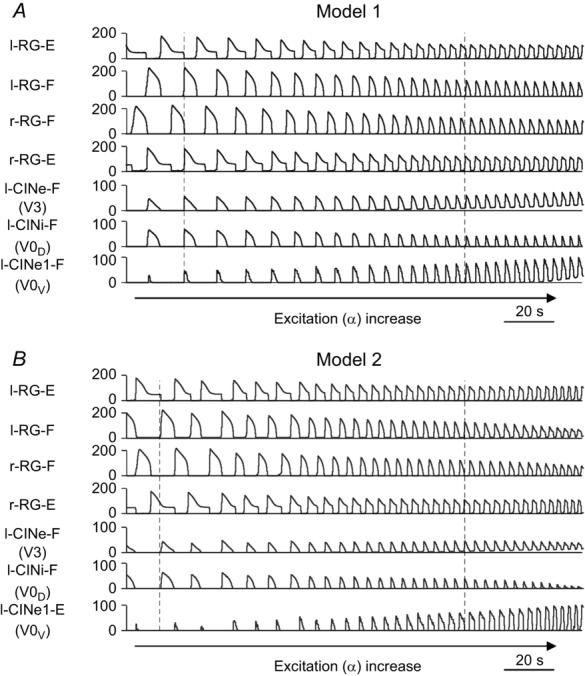
Model performances in response to slow ramp increase of neuronal excitation
A, Model 1. B, Model 2. In both (A) and (B), the activity of all four RG centres (left and right RG-F and RG-E populations) and left CIN populations are shown as average histograms of population activity [spikes/(neuron × s), bin = 100 ms] in response to slow ramp increase of neuronal excitation α. α increased from 0.03 to 0.1 in Model 1 (A) and from 0.02 to 0.09 in Model 2 (B) for 100 s. Note the maintenance of left–right and flexor–extensor alternation and acceleration of rhythmic activity in both models. The vertical dashed lines indicate the beginning of the left flexor phases at a lower (the left lines) and higher (the right lines) values of α. CIN, commissural interneuron; -E, extensor; -F, flexor; l-, left; r-, right; RG, rhythm generator.
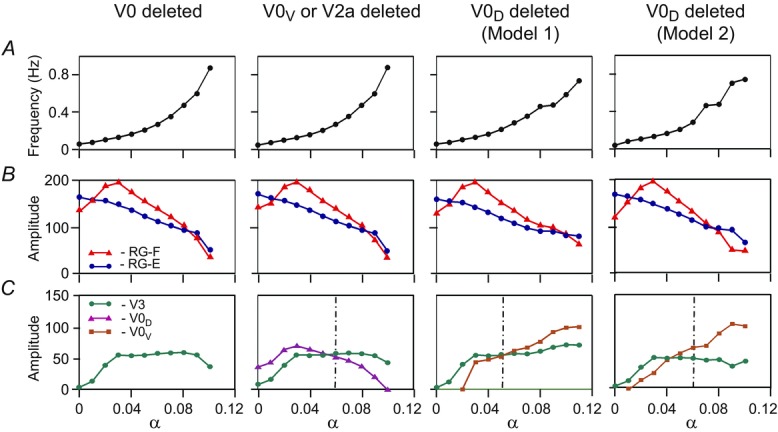
The simulations in Fig.4 demonstrate the behaviour of Models 1 and 2 in response to a slow ramp increase of α. However, it is difficult to estimate which rate of α increase is ‘slow enough’ to avoid transient effects in a numerical solution of the system of multiple non-linear differential equations representing our models. To confirm the accuracy of our conclusions using slow ramp increases in α, we also ran sequential simulations with stepwise changes of α, allowing the system to stabilize at each step before computing values of key variables (see Methods). Figure 5 shows the results of such simulations for both models when α was changed with a step of 0.01. The results of these simulations are qualitatively similar to those obtained with a slow ramp increase. There is a monotonic increase in the frequency with an increase of α (Fig.5A). The amplitude of activity of the RG-F centres in both models (Fig.5B, red lines) initially goes up and then decreases, resembling the amplitude changes in the isolated population (Fig.2D) as well as in experimental recordings from the flexor (L2) ventral root (Fig.2F). In contrast, the amplitude of activity of the RG-E centres (blue lines) monotonically decreases during an increase of α (Fig.5B).
Figure 5.
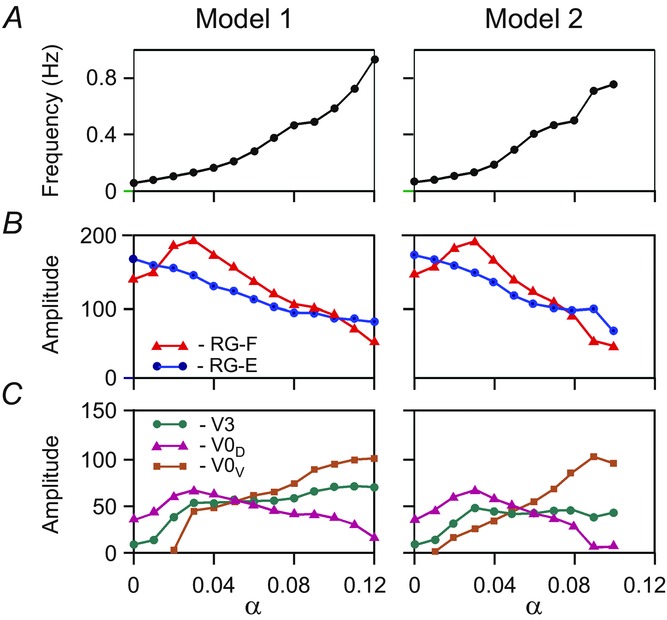
Changes of the key model characteristics in response to stepwise increase of neuronal excitation
Left column, Model 1. Right column, Model 2. In both columns: A, frequency of oscillation; B, amplitude of activity of flexor (l-RG-F, red) and extensor (l-RG-E, blue) RG centres; C, amplitude of activity of V3 (l-CINe-F, green), V0D (l-CINi-F, purple), and V0V (l-CINe1-F in Model 1 or CINe-E in Model 2, brown) CIN populations. CIN, commissural interneuron; -E, extensor; -F, flexor; l-, left; RG, rhythm generator.
Analysis of activity of the three CIN populations shows different changes in the amplitude of their activity with an increase of α. These changes finally define the changes in the relative contribution of each population to left–right coordination at different levels of neuronal excitation. With an increase of α, the amplitude of activity of each CIN population in both models is affected by the two processes opposing each other. On the one hand, the increase of intrinsic neuronal excitation per se should increase the amplitude of CIN output activity. On the other hand, the reduction of the amplitudes of activity of RG centres providing synaptic inputs to these populations should decrease the amplitude of their output activity.
In the inhibitory V0D CIN populations (Fig.4A and B), the synaptic process dominates, due to the relatively low leakage conductance in these neurons (see Table1) defining the low sensitivity of their membrane potentials to changes in α (imitating drug concentration). Therefore, the amplitude of their activity reduces similarly to that of the ipsilateral RG-F centres that provide direct synaptic inputs to these populations (Fig.4A and B and Fig.5C, purple lines). Consequently, V0D populations strongly contribute to left–right alternation at low levels of excitation in the network when RG-F output is maximal, whereas at high levels of excitation their role is significantly reduced as RG-F amplitude decreases.
In the excitatory V3 CIN populations (CINe-F in both models), the two opposing processes partly compensate each other, as these neurons have leakage conductance larger than V0 neurons (see Table1), and hence the amplitude of their activity (after an initial increase) remains relatively constant and does not depend much on α and oscillation frequency (Fig.4A and B and Fig.5C, green lines).
The amplitudes of activity of the excitatory V0V populations (CINe1-F in Model 1 and CINe-E in Model 2) are zero at small values of α and monotonically increase with α, despite the reduction of the amplitudes of activity in the corresponding RG centres (Fig.4A and B and Fig.5C, brown lines). This increase in V0V activity is due to neuron recruitment and strong increase in activity in the V2a populations (Fig.3) mediating the RG inputs to V0V CINs (Fig.1A and B). Therefore, in both models, the excitatory V0V CINs contribute more strongly to left–right alternation at higher levels of α. In Model 1, this contribution occurs because V0V CINs inhibit the contralateral flexor centres via inhibitory interneurons (Fig.1A). In Model 2, this contribution is because the V0V CINs mediate excitation from each extensor centre to the contralateral flexor centre (Fig.1B). Hence, in our two models, both V2a and V0V populations are critically involved in providing left–right alternation at high levels of excitation and high oscillation frequencies.
In both intact models, left–right alternation is maintained at all levels of excitation (Fig.4A and B), because the synchronizing action of V3 CINs is overcome by alternating actions of V0D CINs at lower levels of excitation and V0V CINs at higher levels of excitation (Fig.5C).
Modelling the results of genetic ablations of V0, V0D, V0V/V2a and V3 neurons
Our simulations show that left–right alternating activity under normal conditions can be secured by a balance in interactions between the three CIN pathways. The premises in the model are that these CIN pathways are mediated by genetically identified classes of neurons. Therefore, we were particularly interested in simulating the effects of experimental ablation of specific V0 CINs (Talpalar et al. 2013), or V2a neurons (Crone et al. 2008, 2009).
Figure 6 shows how our models change after removal of all V0 CIN populations (6A), or only the V0V or V2a populations (6B) from either model, or after removal of only the V0D populations from Model 1 (6C) or from Model 2 (6D).
Figure 6.

Schematics of reduced models
A, reduced model schematic after removal of both V0 (V0V and V0D) CIN populations from any of the two models. B, reduced model schematic after selective removal of V0V or V2a populations from any of the two models. C and D, reduced model schematic after selective removal of V0D populations from Model 1 (C) or Model 2 (D). CIN, commissural interneuron; -E, extensor; -F, flexor; l-, left; r-, right; RG, rhythm generator.
Figure 7 shows traces of integrated activity of all RG centres and (left) CIN populations remaining after ablation when neuronal excitation (α) was slowly increased. Figure 8 demonstrates how steady-state values of main control variables in all ablation cases depend on the parameter α being changed stepwise with a step of 0.01. The changes of average frequency and amplitudes of activity of all RG centres and remaining CIN populations with stepwise increases in α were similar to those in the intact models (compare Fig.8A–C with Fig.5A–C).
Figure 7.
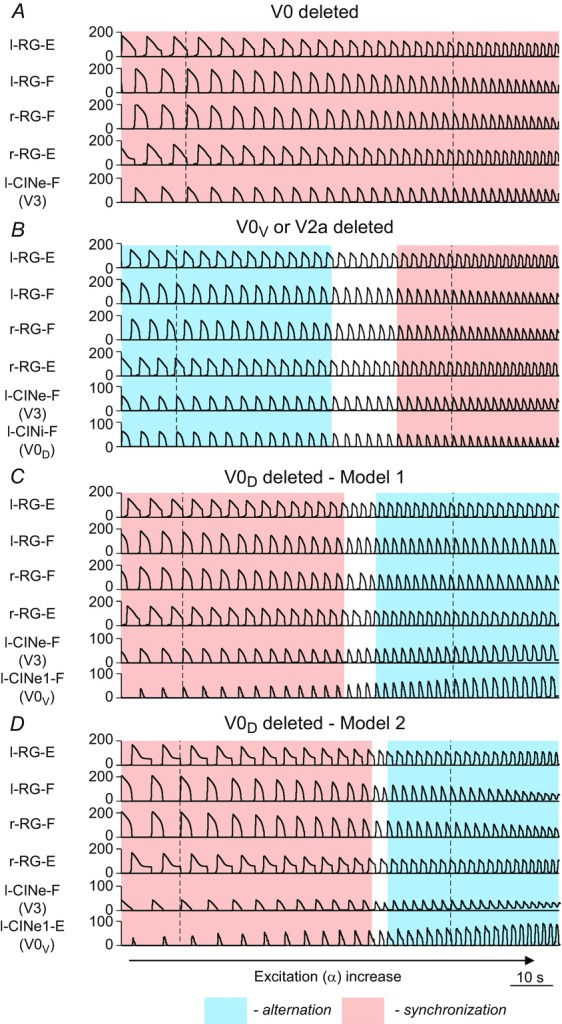
Performance of the reduced models in response to slow ramp increase of neuronal excitation
A, performance of both models after removal of both V0 (V0V and V0D) CIN populations. B, performance of both models after selective removal of V0V CIN or V2a populations. C and D, performance Model 1 (C) and Model 2 (D) after selective removal of V0D CIN populations. Parameter α was increased for 200 s from 0.03 to 0.09 in A, from 0.05 to 0.09 in B, from 0.04 to 0.09 in C, and from 0.02 to 0.09 in D. In all panels, the activity of all centres and remaining (left) CIN populations is shown as average histogram of neuron activity [spikes/(neuron × s), bin = 100 ms]. The vertical dashed lines indicate the beginning of the left flexor phases at lower and higher values of α (and oscillation frequency). The regions of left–right alternating and left–right synchronized activity are highlighted by the blue and pink rectangles, respectively. CIN, commissural interneuron; -E, extensor; -F, flexor; l-, left; r-, right; RG, rhythm generator.
Figure 8.
Changes of the key characteristics in the reduced models in response to a stepwise increase of neuronal excitation
The left column shows the results for both models after removal of both V0 CIN populations. The second column represents the results for both models after selective removal of V0V CIN or V2a populations. The third and the fourth columns show the results for Model 1 and Model 2, respectively, after selective removal of V0D CIN populations. Each column shows: A, frequency of oscillation; B, amplitude of activity of flexor (l-RG-F, red) and extensor (l-RG-E, blue) centres; C, amplitude of activity of V3 (l-CINe-F, green), V0D (l-CINi-F, purple), and V0V (l-CINe1-F in Model 1 or CINe-E in Model 2, brown) CIN populations. The dash-dotted vertical lines indicate transitions between left–right alternation and left–right synchronization phase transitions. CIN, commissural interneuron; -E, extensor; -F, flexor; l-, left; r-, right; RG, rhythm generator.
If only V2a–V0V-mediated (Fig.6B) or only V0D-mediated (Fig.6C and D) pathways are selectively deleted, the model behaviour depends on the interplay between the V3-mediated left–right synchronization and the remaining V0 populations that support left–right alternation.
Figure 7B and the second column in Fig.8 show that when either the V0V or the V2a populations are deleted from either model (Fig.6B), the left and right RG-F centres, as well as the left and right RG-E centres, exhibit alternating activity at lower values of α and synchronous activity at higher values of α. The amplitude of activity of the remaining inhibitory V0D CIN populations (l-CINi-F and r-CINi-F) decreases with increasing α. In contrast, the amplitude of the excitatory V3 CIN populations (l-CINe-F and r-CINe-F), after an initial increase, remains relatively constant (see Fig.7B and Fig.8C, second column). As a result, at some value of excitation (at α ≈ 0.05 in our simulation), the activity of the V3 populations becomes stronger than the activity of the V0D populations, leading to the cross-cord synchronization of activity of the left and right flexor and of the left and right RG-E centres.
Figure 7C and D, demonstrates the results of our simulations using Model 1 (Fig.6C) and Model 2 (Fig.6D), respectively, after removal of the V0D populations. In both models, left and right homonymous RG centres exhibit synchronous activity at lower values of α and switch to alternating activity at higher values of α. The amplitude of activity of the V0V CIN populations in either model increases with increasing α (Fig.7C and D and the third and fourth columns in Fig.8C) because of the dramatic increase of the activity of V2a populations exciting these V0V CIN populations (see Fig.3). At the same time, the amplitude of the V3 CIN populations (l-CINe-F and r-CINe-F) remains relatively constant (Fig.7C and D and Fig.8C, third and fourth columns). Eventually, the amplitude of activity of the V0V CIN populations promoting alternation becomes stronger than the amplitude of V3 CIN populations promoting synchronization (Fig.8C, third and fourth columns). Therefore, in both our models, removal of V0D CIN populations leads to left–right synchronization of neuronal activity at lower levels of neuronal excitation and left–right alternation at higher levels of excitation.
We have also simulated the removal of the V3 CIN populations, to study their possible effects on intact network performance in both our models. However, because excitatory, synchronizing interactions between left and right RG-F centres mediated by V3 CINS are always overcome by the V0D-mediated (at lower values of α) and V0V-mediated (at higher levels of α) pathways supporting left–right alternation (see Fig.5C), the removal of V3 CINs in both our models did not disturb this alternation at any level of α. The only observed effect in both models was a slight decrease of frequency, reaching a 15% reduction at the maximal value of α.
Frequency-dependent asymmetry of flexor–extensor phase durations
One important goal of our study was to understand how the spinal locomotor network operation, including coordination of left–right activity, varies with locomotor frequency. In the modelling studies described above, we focused primarily on model performance during changes in neuronal excitation imitating the effects of increasing concentrations of neuroactive drugs, but did not consider the possible effects of changes in the oscillation frequency/locomotor speed. To investigate frequency-dependent changes in model performance, we needed to consider explicitly how different aspects of network operation depend on locomotor frequency. As basic locomotor parameters, we looked at changes in the durations of flexor and extensor phases resulting from changes in the locomotor frequency.
The dependence of flexor (red) and extensor (blue) phase durations on the locomotor frequency in Models 1 and Model 2 are shown in Fig.9A and B, respectively. Each plot was built using series of simulations in which we varied the neuron excitation parameter α and calculated average values of flexor and extensor phase durations and locomotor frequency. In both models, at higher frequencies (above 0.5 Hz), the locomotor pattern was symmetric, with approximately equal flexor and extensor phase durations. However, as the frequency was reduced below 0.5 Hz, the difference between the durations of extensor and flexor phases monotonically increased (Fig.9A and B). This occurred because the decrease of frequency was accompanied by a progressive increase of the duration of the extensor phase at a relatively fixed duration of the flexor bursts driving the rhythm. These simulated frequency-dependent changes in the duration of flexor and extensor phases fit well to the frequency-dependent changes in the duration of extensor bursts relative to flexor bursts observed in vitro (Fig.9C).
Figure 9.
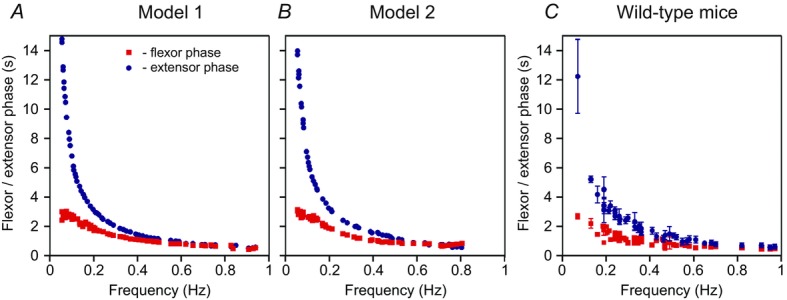
Changes in flexor and extensor phase durations as a function of locomotor frequency
A, Model 1. B, Model 2. C, experimental studies in wild-type mice. In all panels, red filled squares and blue filled circles show average flexor or extensor phase lengths. A and B, data for 62 simulations are shown. In each simulation, parameter α was randomly chosen from a corresponding range α ( [0, 0.12] for Model 1 and
  [0, 0.1] for Model 2) and all model parameters and initial conditions were randomly redistributed. The settling period allotted before data were collected varied from 10 s (for the highest values of α) up to 100 s (for the lowest values of α). For each set of data, the oscillation frequency and flexor and extensor phase durations were averaged for 10–20 cycles. The graph in C was generated from data sampled in Talpalar et al. (2013).
Model validation: frequency-dependent effects of selective deletions of V0 commissural interneurons or their V0V and V0D subtypes
To investigate the frequency-dependent role of different V0 CIN subtypes in left–right coordination and to validate our models, we needed to represent the results of our simulations in a form that could explicitly relate the left–right phase relationships to changes in locomotor frequency after selective removal of all V0 CINs and each of their subtypes. The results of these simulations, together with the corresponding experimental data from the Talpalar et al. (2013) study, are shown in Figs 10-13. The left column in each panel shows examples of the population activity of four RG centres from our simulations or the recordings from the left and right L2 and L5 ventral roots during fictive locomotion in the isolated spinal cord for two (low and high) locomotor frequencies. The right columns in each panel show phase differences between flexor and extensor activity (LF and LE or flexor–extensor), left flexor and right flexor (LF and RF or lL2 and rL2) and left extensor and right extensor (LE and RE or lL5 and rL5) vs. average locomotor frequency. The experimental results reproduced in Figs 3 were described in detail in Talpalar et al. (2013). The vertical dashed lines in these plots separate areas for conditionally defined low, medium and high frequencies.
Figure 10.
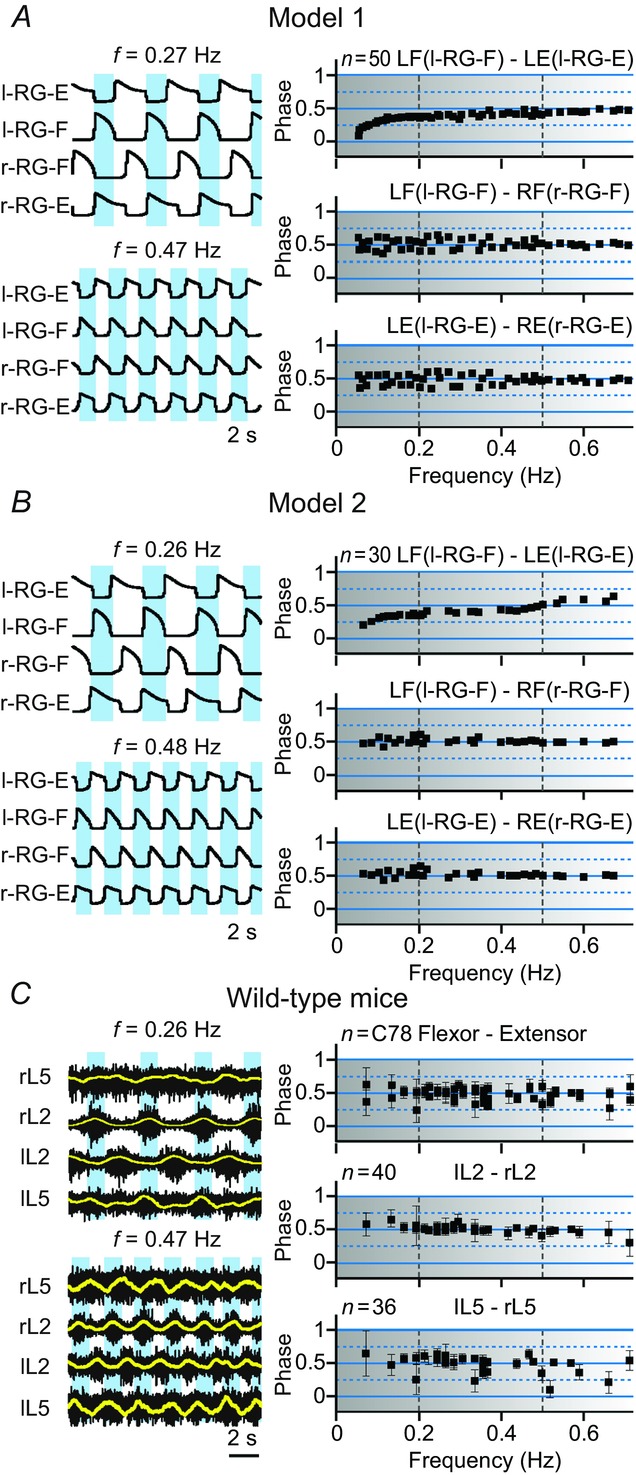
Intact systems: maintenance of left–right alternation at any locomotor frequency
A and B, results of simulations using Model and Model 2, respectively. Left column in both panels shows two examples of activity (integrated histograms) of all four RG centres of the models that correspond to two (one low and one high) oscillation frequencies. The right column in each panel exhibits the phase differences between the activity of: (left) flexor (l-RG-F) and (left) extensor (l-RG-E) centres (top), left (l-RG-F) and right (r-RG-F) flexor centres (middle), and left (l-RG-E) and right (r-RG-E) extensor centres (bottom) as a function of oscillation frequency. Each black square (n = 50) represents a separate simulation. In each simulation, α was randomly chosen from a range of α ( [0, 0.12] for Model 1 and
  [0, 0.1] for Model 2) and model parameters and initial conditions were randomly redistributed. C, experimental results from wild-type mice from studies by Talpalar et al. (2013) presented in the same style (previously unpublished data). The left column shows two examples of raw recordings (black) from four lumbar ventral roots (flexor rL2 and lL2, and extensor rL5 and lL5) superimposed with the rectified and integrated (yellow) traces, that exhibit oscillations at two (one low and one high) locomotor frequencies. The right column shows flexor–extensor (top), lL2-rL2 flexor (middle) and lL5-rL5 extensor (bottom) phase differences for each preparation/episode (black squares) plotted against locomotor frequency. Error bars show angular dispersion. The vertical dashed lines separate the lower, medium and higher frequencies. Note that in both intact models (A and B) and in experimental studies on wild-type mice (C), the black squares representing left–right flexor and left–right extensor phase differences are concentrated around 0.5 indicating left–right alternating activity over the whole range of frequencies. In this and following figures, the blue bars highlight left–right alternating activity. -E, extensor; -F, flexor; l, left; r, right; RG, rhythm generator.
Figure 13.
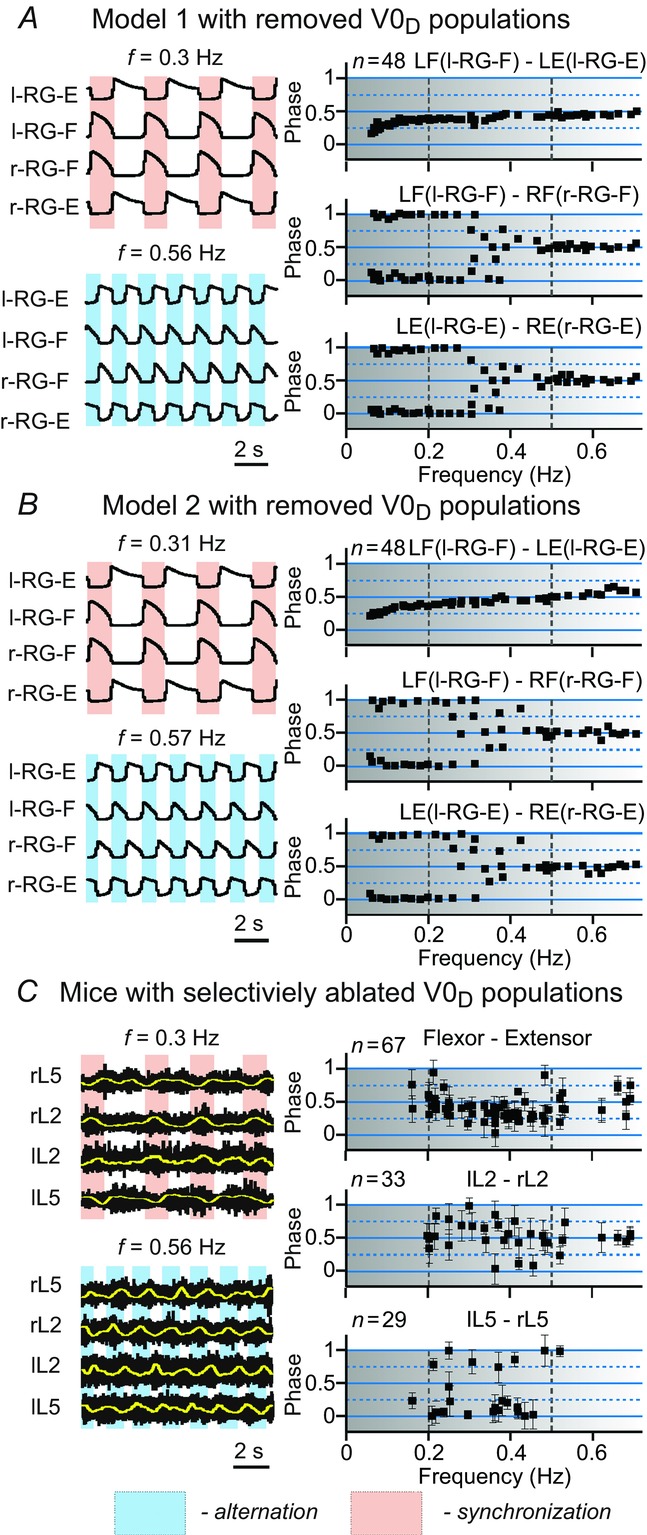
Frequency-dependent left–right coordination of activity after selective removal of V0D CIN populations
The results of modelling (A, Model 1; B, Model 2) and experimental (C) studies are presented in the same style as in Fig.10A and B, simulation results from Model 1 and Model 2, respectively, after selective removal of V0D populations. C, experimental data collected from mutant mouse embryos with genetically ablated V0D neurons. Reproduced from Talpalar et al. (2013, fig. 3d,e). In our simulations at low frequencies (<0.2 Hz), the black squares representing left–right flexor and left–right extensor phase differences are concentrated around 0 and 1 (A and B) indicating left–right synchronized pattern. At high locomotor frequencies (>0.5 Hz), left–right flexor phase differences in both simulations and experimental studies are concentrated around 0.5 indicating left–right alternation. At intermediate frequencies (between 0.2 and 0.5 Hz) the flexor–extensor phase differences are evenly distributed between 0 and 1, making left–right phase relationships uncertain. CIN, commissural interneuron; E, extensor; F, flexor; l, left; r, right; RG, rhythm generator.
In both Model 1 (Fig.10A) and Model 2 (Fig.10B) with all neuron populations intact, the phase differences between the activity of left and right RG-F centres and left and right RG-E centres concentrated around 0.5 throughout the range of locomotor frequencies. This was fully consistent with experimental data from wild-type mice (Fig.10C). Both the isolated spinal cords from wild-type mice and our two intact models exhibited left–right alternation at any locomotor frequency.
Removal of all V0 CIN populations in our models (Fig.11A) changed the phase differences between left and right flexor and left and right RG-E centres to concentrate around 0 and 1, indicating left–right synchronization of activity throughout the range of locomotor frequencies. This simulation result is consistent with experimental data obtained from mice with genetic ablation of all V0 interneurons (Fig.11B; Talpalar et al. 2013), confirming that removal of all V0 CINs leads to left–right synchronization at any locomotor frequency.
Figure 11.
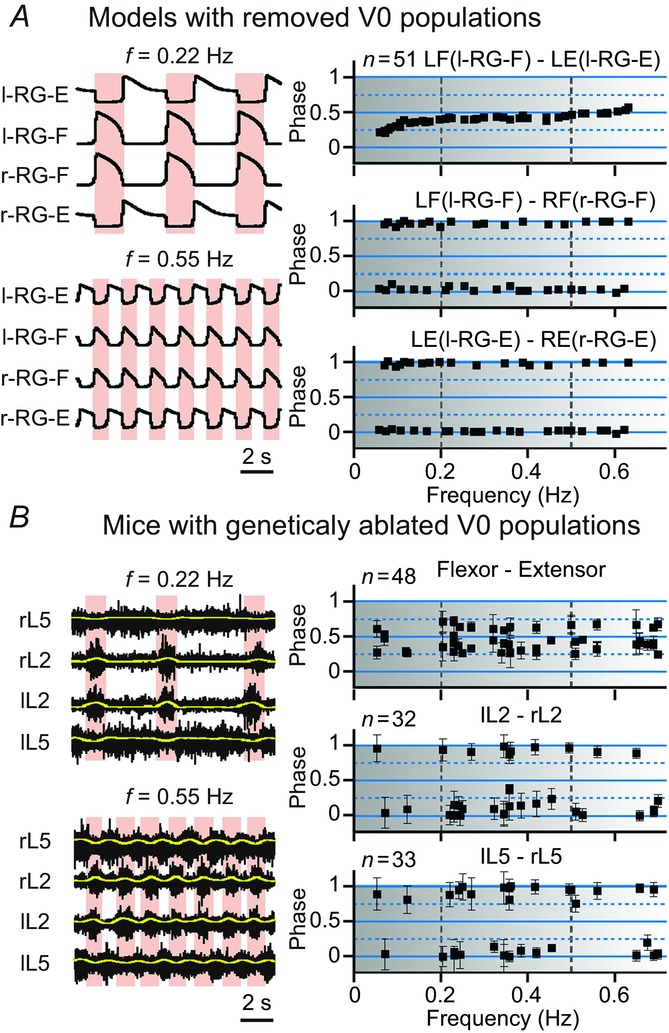
Left–right coordination of activity after removal of both V0 (V0V and V0D) CIN populations
The results of modelling (A) and experimental (B) studies are presented in the same style as in Fig. 10A, simulation results from our models after removal of both V0 populations. B, experimental data collected from mutant mice with genetically ablated V0 neurons. Reproduced from Talpalar et al. (2013, fig. 2c,d). In both our simulations (A and B) and in experimental studies (C), the black squares representing left–right flexor and left–right extensor phase differences are concentrated around 0 and 1 indicating left–right synchronized activity throughout the whole range of frequencies. In this and following figures, the pink bars highlight left–right synchronized activity. CIN, commissural interneuron; E, extensor; F, flexor; l, left; r, right; RG, rhythm generator.
Following selective removal of the V0V or V2a populations from any of our models (Fig.12A), the phase differences between left and right flexor and left and right RG-E centres concentrated around 0.5 at low frequencies (<0.2 Hz) and around 0 and 1 at high locomotor frequencies (>0.45–0.5 Hz). At intermediate frequencies (between 0.2 and 0.45–0.5 Hz), these phase differences were almost evenly distributed between 0 and 1. These simulations are consistent with the experimental data of Talpalar et al. (2013) (Fig.12B) obtained after genetic ablation of V0V neurons, and of Crone et al. (2009) after selective ablation of V2a interneurons (data not shown). Hence in both our simulations and experimental studies, selective removal of V0V CINs or V2a interneurons did not affect left–right alternation at low locomotor frequencies, caused distributed phase relationships at medium frequencies and switched to left–right synchronization at high locomotor frequencies.
Figure 12.
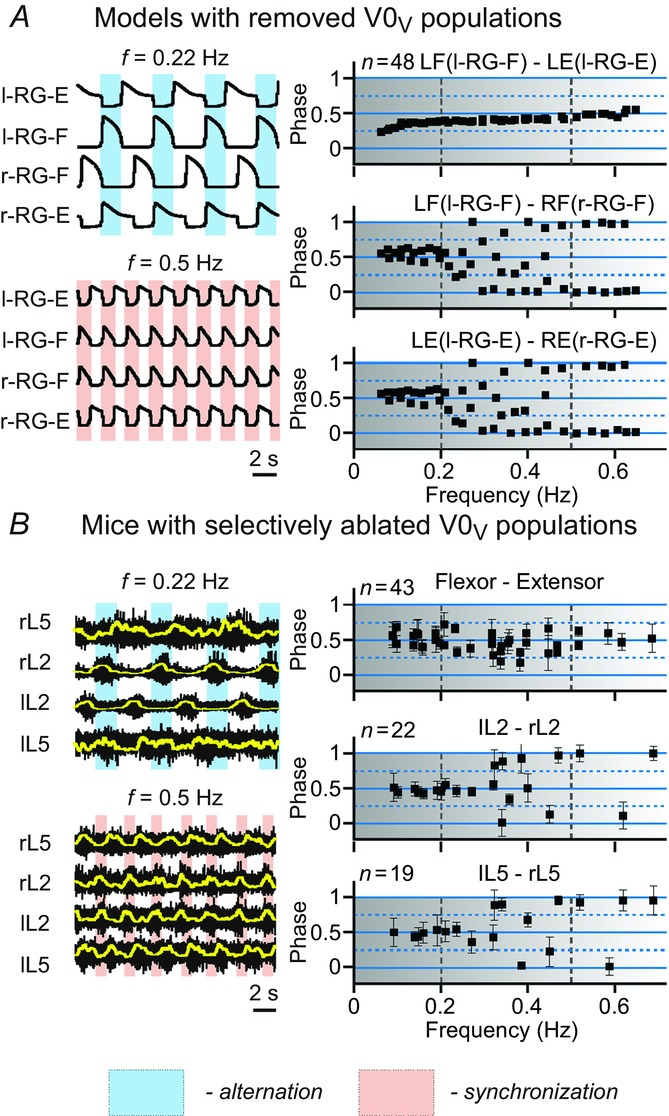
Frequency-dependent left–right coordination of activity after selective removal of V0V CIN populations
The results of modelling (A) and experimental (B) studies are presented in the same style as in Fig.10A, simulation results from our models after selective removal of V0V or V2a populations. B, experimental data collected from mutant mice with genetically ablated V0V neurons. Reproduced from Talpalar et al. (2013, fig. 4d,e). In both simulations (A) and in experimental studies (B), the black squares representing left–right flexor and left–right extensor phase differences are concentrated around 0.5 at low frequencies (<0.2 Hz), indicating left–right alternating pattern, and around 0 and 1 at high frequencies (>0.45 Hz) indicating left–right synchronized activity. At medium frequencies (between 0.2 and 0.45–0.5 Hz) the flexor–extensor phase differences are evenly distributed between 0 and 1, making left–right phase relationships uncertain. CIN, commissural interneuron; E, extensor; F, flexor; l, left; r, right; RG, rhythm generator.
Following selective removal of V0D CINs in either Model 1 (Fig.13A) or Model 2 (Fig.13B), phase differences between left and right RG-F and left and right RG-E centres concentrated around 0 and 1 at low frequencies (<0.25–0.3 Hz), indicating left–right synchronization, and around 0.5 at high locomotor frequencies (>0.45–0.5 Hz), indicating left–right alternation. At intermediate frequencies (between 0.25–0.3 and 0.45–0.5 Hz) these differences were almost evenly distributed between 0 and 1. The corresponding experimental studies using mutants with selectively ablated V0D neurons (Fig.13C) were performed on spinal cords from embryos (Talpalar et al. 2013), as these mutants die at birth from impaired breathing. These preparations could not generate organized locomotor output at low frequencies (<0.2 Hz, see Fig.13C). However, V0D ablated mice exhibited left–right alternating flexor activity at high locomotor frequencies (≥0.5 Hz) and uncertain phase relationships at medium frequencies, similar to that seen in our models. Extensor activity in this mutant mouse was more variable, primarily showing left–right synchrony at middle frequencies and poorly organized activity at high frequencies.
Bistability in model behaviour at medium locomotor frequencies
In both experimental data and our simulations after selective elimination of either V0V (Fig.12) or V0D (Fig.13) populations, the left–right phase relationships at medium frequencies (0.2–0.5 Hz) became uncertain and ranged from pure alternation to pure synchronization in different simulations and in different experimental preparations. Moreover, spinal cord preparations from mouse mutants lacking V0V (Fig.14A) or V0D (Fig.14B) neurons while generating locomotor activities at these frequencies exhibited spontaneous switching between left–right alternation and synchronization. These observations suggest the presence of bistability in the activity regimes in these mutants at medium frequencies. To investigate the nature of such bistability in our models, we performed additional simulations with V0V-deleted (Fig.14C) or V0D-deleted (Model 1: Fig.14D; Model 2: Fig.14E) populations. The parameter α was changed with a step of 0.05. For each value of α, two simulations were performed that differed by the initial conditions for the slow INaP inactivation variable (h, see neuron model description in Methods) in the neurons of all RG centres, so that the initial phase differences between left and right homonymous RG centres were either close to 0.5 (initial alternating activity) or to zero (initial synchronous activity). In each simulation, a settling period was provided to allow the system to complete its transition from the initial to a stable regime. The stable regimes for simulations with initial conditions corresponding to left–right alternation are shown in Fig.14C–E by black squares, and stable regimes for simulations with initial conditions corresponding to left–right synchronization are shown by red squares. When these symbols overlapped there was only one stable regime (alternation or synchronization), and when they diverged in two branches there was a coexistence of both stable regimes, i.e. bistability. Figure 14C–E shows that for lower and higher values of α, there was only a single stable behaviour (left–right alternation or synchronization), while at intermediate values of α (highlighted by yellow) both behaviours coexisted.
Figure 14.
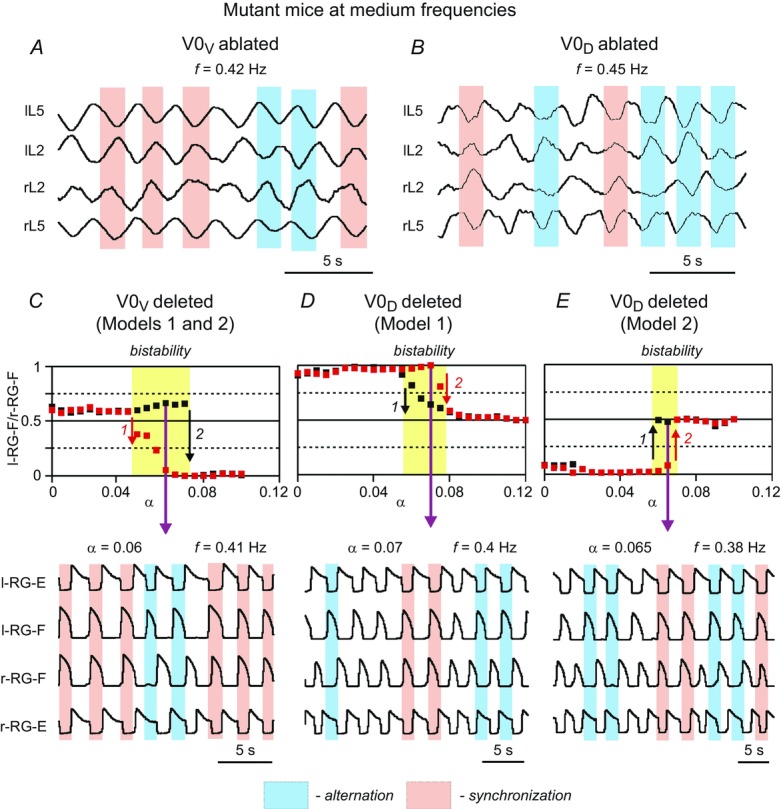
Bistablity in left–right coordination at medium locomotor frequencies
A and B, examples of uncertain phase relationships and spontaneous switching between alternation and synchronization at medium frequencies (0.2–0.5 Hz) locomotor activity recorded from the cords of mutant mice lacking V0V (A) or V0D (B) neurons (previously unpublished data from Talpalar & Kiehn). C–E, results of simulations with V0V populations removed (in both models; C) and V0D populations removed in Model 1 (D) and Model 2 (E). The simulations show bistability at medium values of α, when the black and red squares representing simulations with different initial conditions diverge (highlighted by yellow). The bottom traces correspond to the particular values of α indicated by magenta arrows. In these simulations, a 10% noise added to the leakage reversal potential of all neurons resulted in spontaneous switching between left–right alternating and synchronous oscillations. E, extensor; F, flexor; l, left; r, right; RG, rhythm generator.
In the areas characterized by bistability, a small disturbance or noise could result in spontaneous switching of system behaviour from one steady-state regime to the other. Simulations with such spontaneous switching are shown at the bottom of C–E in Fig.14 and indicated by magenta arrows. In these simulations, 10% noise was added to the leakage reversal potential in all neuron populations. As a result, spontaneous transitions between synchronization and alternation appeared. Notable in both the experimental (Fig.14A and B) and modelling (Fig.14C and D) cases, spontaneous switching occurred at intermediate frequencies (0.38–0.45 Hz), i.e. within the range of frequencies exhibiting uncertain phase relationships (see Fig.2A and B and Fig.13A–C). These findings suggest that the locomotor output after selectively ablating V0V or V0D neurons at these intermediate locomotor frequencies is characterized by bistability and can spontaneously switch left–right coordination between alternation and synchrony.
Discussion
Organization and operation of rhythm generating circuits
Our models include left and right rhythm generators consisting of RG-F and RG-E centres interacting bilaterally via several CIN pathways. These centres represent the excitatory RG core in the vertebrate spinal cord (Grillner, 2006; Kiehn, 2011; Dougherty et al. 2013). The rhythm-generating properties of RG populations are based on the persistent sodium current, INaP, incorporated in each neuron and mutual excitation within these populations. The possible involvement of INaP in spinal oscillations was suggested in previous models (Rybak et al. 2006a,b; McCrea & Rybak, 2007; Zhong et al. 2012; Rybak et al. 2014) and gained indirect support from experimental studies (Tazerart et al. 2007, 2008; Zhong et al. 2007; Ziskind-Conhaim et al. 2008; Brocard et al. 2010, 2013).
The INaP-dependent bursting in RG neurons allowed our models to reproduce several essential features of the in vitro fictive locomotion, including a monotonic increase of burst frequency and an initial increase followed by progressive decrease of burst amplitude with increasing neuronal excitation (Talpalar & Kiehn, 2010). Thus we predict that these or similar INaP-dependent mechanisms operate in RG spinal neurons, such as the recently discovered Shox2 neurons (Dougherty et al. 2013). The presence and role of INaP in these neurons can be experimentally tested using patch clamp recordings during pharmacological blockade of different ionic currents, including INaP.
The rhythm in our models is generated by the left and right RG-F centres operating in an intrinsic bursting regime. The idea of asymmetric, flexor-dominated rhythm generation was initially suggested by Pearson and Duysens (Pearson & Duysens, 1976; Duysens, 1977; Duysens et al. 2013). The extensor centres in our models can also generate intrinsic bursting under certain conditions, e.g. when their neurons receive less excitation. Hence, our models do not contradict experimental data that locomotor-like activity can be induced independently in flexor and extensor networks (Hägglund et al. 2013). However, we suggest that, at least under the experimental conditions in which neuroactive drugs are used to induce locomotor-like activity in the isolated spinal cord, the extensor-related neurons do not operate in a bursting regime and exhibit rhythmic activity due to inhibition from the corresponding flexor-related RG neurons.
This suggestion led to the asymmetric frequency-dependent changes in the duration of flexor and extensor phases in our models shown in Fig.9A and B, which fit well to the frequency-dependent changes in the duration of extensor bursts relative to flexor bursts observed in vitro (Fig.9C) and in vivo (Halbertsma, 1983; Frigon & Gossard, 2009; Frigon et al. 2013), hence providing an implicit validation of our models.
Previous experimental studies (Zhong et al. 2012) showed that deletions of flexor bursts were accompanied by a sustained ipsilateral extensor activity whereas the deletions of extensor bursts could occur without disturbance of ipsilateral flexor rhythmic activity. This prediction can be further tested experimentally by analysis of spontaneous deletions of bursting activity in ipsilateral flexor (L2) and extensor (L5) ventral roots, and in the activity of flexor- and extensor-related Shox2 neurons, considered candidates for the RG CPG neurons (Dougherty et al. 2013).
The other prediction from our models is that the flexor burst duration should be relatively constant, less variable and less dependent on the neuroactive drug concentration and locomotor cycle period than the extensor duration (Fig.9); the duration and variability of extensor activity should dramatically increase when fictive locomotion is slowed by lowering the drug concentrations.
Left–right coordination of locomotor-like oscillations in the isolated spinal cord
Physiological experiments in mammals have indicated that left–right coordination in the spinal cord is provided by parallel commissural excitatory and inhibitory pathways (Kjärulff & Kiehn, 1997; Bannatyne et al. 2003, Butt & Kiehn, 2003; Quinlan & Kiehn, 2007; Jankowska et al. 2008; Restrepo et al. 2009; Kiehn, 2011). Our intention was to simulate and explain the consequences of selective removal of V0D, V0V or V2a neurons observed experimentally in mutants with selectively ablation of these neuron types (Crone et al. 2008, 2009; Talpalar et al. 2013).
The role of V0 CINs in left–right alternation of spinal cord activity was initially studied using mutant mice with the Dbx1 transcription factor knocked out (Lanuza et al. 2004). Deletion of Dbx1 in these experiments led to respecification of the V0 population and its transdifferentiation into other neuron types, such as V1 (V0D) and dI6 (V0V) (Pierani et al. 2001; Lanuza et al. 2004). This V0 transdifferentiation caused complex effects on left–right alternation, including spontaneous drift between left–right alternation and synchronization (Lanuza et al. 2004). Such Dbx1 knock-out dependent respecification of the V0 population would be difficult to model due to its complexity and a lack of detailed understanding of the transdifferentiation mechanism.
In contrast to the Lanuza et al. (2004) study, Talpalar et al. (2013) used spinal cords of mutants with genetically ablated all V0 neurons or their particular subtypes (V0D or V0V). As a consequence, the corresponding populations were completely removed from the locomotor spinal networks. Our objective was to directly simulate the Talpalar et al. (2013) experiments and find plausible mechanistic explanation for their results. To explicitly simulate the effects of genetic ablation of these populations, we simply removed the corresponding populations from the models. Our modelling study confirmed the general concept that left–right coordination depends on a balance between neural pathways mediated by different CIN classes. We were able to closely reproduce the speed-dependent changes in left–right coordination after genetic elimination of all V0 CINs, or their V0V or V0D subclasses (Talpalar et al. 2013), or the V2a neurons (Crone et al. 2009).
Removal of the excitatory V3 CIN populations from our models did not disturb left–right alternation at any level of neuronal excitability, because the excitatory, synchronizing interactions between left and right RG-F centres mediated by V3 CINs were overcome by the V0D-mediated (at lower values of α) and V0V-mediated (at higher levels of α) pathways supporting left–right alternation (see Fig.5C). The maintenance of left–right alternation after V3 removal was consistent with experimental data of Zhang et al. (2008), who studied the effects of blocking V3-mediated neurotransmission. However, our simulations could not reproduce the complex, destabilizing effects of the V3 blockade on locomotor rhythm and pattern described by Zhang et al. (2008). These effects are poorly understood and may arise from the neuronal heterogeneity of physiological properties of the V3 neurons, as well as the existence of ipsilateral projections from some V3 neurons (Zhang et al. 2008; Borowska et al. 2013), which we did not consider in our models.
In the in vitro experiments, changes in locomotor frequency were obtained by changing the concentration of locomotion-inducing drugs, such as NMDA (Crone et al. 2009; Talpalar & Kiehn, 2010; Zhong et al. 2011; Talpalar et al. 2013). Increasing drug concentrations produced an increase in the locomotor frequency, which was accompanied by a decrease in the amplitude of locomotor output (Talpalar & Kiehn, 2010). Similarly, in our models, a progressive increase of neuronal excitation (imitating the drug effect) led to an increase in the oscillation frequency and a decrease in the amplitude of RG centre activity that provided synaptic inputs to the CINs and V2a neurons. Under these conditions, the activity of V0D, V0V and V3 CIN populations was dependent on the interplay between increasing neuronal excitation, decreasing synaptic inputs and increasing activity of the V2a neurons mediating excitation to the V0V populations. This interplay defined a speed-dependent balance between V0D, V0V and V3 pathways and frequency-dependent contributions of each pathway to left–right coordination.
Our simulations support the earlier suggestion that left–right alternation is provided by dual commissural pathways involving the inhibitory V0D and excitatory V0V CINs (Talpalar et al. 2013); the contribution to left–right alternation of the V0D pathway is dominant at low frequencies and reduces as locomotor frequency increases, whereas the contribution of the V2a–V0V pathway is weak at low frequencies but increases as frequency increases. Our models predict that these important features are based on the following: (a) relatively weak dependence of excitation of the V0 CINs on neuroactive drug concentration, which leads to a net reduction of V0D activity due to the reduction of amplitude of RG activity when the drug concentration and frequency increase; (b) strong dependence of V2a neuron activity and recruitment on the neuroactive drug concentration (Crone et al. 2009; Zhong et al. 2011); these neurons mediate input to V0V CINs, hence providing a net increase of their activity with frequency. These predictions can be experimentally tested by further investigating the sensitivity of V0D, V0V and V2a neuronal characteristics to changes in the neuroactive drug concentrations.
The two models described in this study show very similar behaviour. In both models, the V0D populations receive input from the RG-F centre and inhibit the contralateral RG-F centre. Based on this, our models predict that V0D CINs should exhibit flexor-related rhythmic activity, which can be tested in future experiments. The two models differ by the organization of V2a–V0V pathways and the phase of activity of these neurons. Specifically, the V2a–V0V neurons may either (a) operate between left and right flexor centres via inhibitory interneurons as predicted by Model 1, or (b) mediate connections from each extensor centre to the contralateral flexor centre as predicted by Model 2, or (c) include both these pathways. The choice between these models can be made in the future based on recordings from V0V neurons, and will depend on whether their activity is mostly in phase with the flexors (confirming Model 1), or with extensors (confirming Model 2), or both types are present (confirming option c). It is certainly possible that the two V2a–V0V pathways are both present in the spinal network, because V2a neurons with both flexor- and extensor-related rhythmic activity have been previously described (Zhong et al. 2010; Dougherty & Kiehn, 2013).
Interestingly, the left–right phase relationships in knockout mice lacking V0V or V0D CINs become variable at intermediate frequencies (Talpalar et al. 2013; Figs 2B and 3C) leading to spontaneous switching between left–right synchronized and alternating bursts. A clear prediction from our models is that at these frequencies the spinal network operates in a bistable mode allowing coexistence of alternating and synchronizing regimes (see Fig.4C–E). Similar bistable behaviour was seen in the mutants during walking in vivo (Crone et al. 2009; Talpalar et al. 2013).
Possible control of locomotor gait via activation or suppression of particular commissural interneuron pathways
The premise for our modelling attempts has been to reproduce and suggest explanations for the in vitro locomotor experiments with ubiquitous activation of all neurons, including CINs. However, intact animals have additional neural circuits allowing them to select appropriate left–right coordination and gait depending on the locomotor task and behavioural conditions. Such a selection can be easily mimicked in the model by providing additional selective excitation or inhibition of the V0D-, V0V- or V3-mediated pathways, imitating the descending or afferent control signals. The functional role of such microcircuits may be the selection of and switching between alternating and synchronous gaits as necessary during locomotion.
Conclusion
Our modelling study synthesizes a large body of experimental data and proposes connectivity schemes for the spinal circuit organization that provides left–right motor coordination at different speeds of locomotion. The models propose a series of predictions that provide the basis for further studies of the organization and operation of the mammalian spinal locomotor network.
Acknowledgments
This work was supported by the National Institutes of Health (NIH) grant R01 NS081713 to I.A.R. and R.M.H-W, NIH grant R01 NS090919 to I.A.R. and O.K., and research grants from the Torsten and Ragnar Söderberg Foundations, Swedish Medical Research Council, and European Research Council (No 268628) to O.K.
Additional information
Author contributions
N.A.S., O.K., and I.A.R. designed research; N.A.S., and S.N.M., performed simulations; A.E.T., R.M.H-W., and O.K. contributed experimental data and their analysis; N.A.S., O.K., R.M.H-W, and I.A.R. wrote the paper.
References
- Bannatyne BA, Edgley SA, Hammar I, Jankowska E. Maxwell DJ. Networks of inhibitory and excitatory commissural interneurons mediating crossed reticulospinal actions. Eur J Neurosci. 2003;18:2273–2284. doi: 10.1046/j.l460-9568.2003.02973.x. [DOI] [PMC free article] [PubMed] [Google Scholar]
- Berens P. CircStat: A MATLAB toolbox for circular statistics. J Stat Software. 2009;31:1–21. [Google Scholar]
- Borowska J, Jones CT, Zhang H, Blacklaws J, Goulding M. Zhang Y. Functional subpopulations of V3 interneurons in the mature mouse spinal cord. J Neurosci. 2013;33:18553–18565. doi: 10.1523/JNEUROSCI.2005-13.2013. [DOI] [PMC free article] [PubMed] [Google Scholar]
- Brocard F, Tazerart S. Vinay L. Do pacemakers drive the central pattern generator for locomotion in mammals? Neuroscientist. 2010;16:139–155. doi: 10.1177/1073858409346339. [DOI] [PubMed] [Google Scholar]
- Brocard F, Shevtsova NA, Bouhadfane M, Tazerart S, Heinemann U, Rybak IA. Vinay L. Activity-dependent changes in extracellular Ca2+ and K+ reveal pacemakers in the spinal locomotor-related network. Neuron. 2013;77:1047–1054. doi: 10.1016/j.neuron.2013.01.026. [DOI] [PMC free article] [PubMed] [Google Scholar]
- Butera RJ, Rinzel JR. Smith JC. Models of respiratory rhythm generation in the pre-Bötzinger complex: II. Populations of coupled pacemaker neurons. J Neurophysiol. 1999;82:398–415. doi: 10.1152/jn.1999.82.1.398. [DOI] [PubMed] [Google Scholar]
- Butt SJ. Kiehn O. Functional identification of interneurons responsible for left–right coordination of hindlimbs in mammals. Neuron. 2003;38:953–963. doi: 10.1016/s0896-6273(03)00353-2. [DOI] [PubMed] [Google Scholar]
- Crone SA, Quinlan KA, Zagoraiou L, Droho S, Restrepo CE, Lundfald L, Endo T, Setlak J, Jessell TM, Kiehn O. Sharma K. Genetic ablation of V2a ipsilateral interneurons disrupts left-right locomotor coordination in mammalian spinal cord. Neuron. 2008;60:70–83. doi: 10.1016/j.neuron.2008.08.009. [DOI] [PubMed] [Google Scholar]
- Crone SA, Zhong G, Harris-Warrick R. Sharma K. In mice lacking V2a interneurons, gait depends on speed of locomotion. J Neurosci. 2009;29:7098–109. doi: 10.1523/JNEUROSCI.1206-09.2009. [DOI] [PMC free article] [PubMed] [Google Scholar]
- Dougherty KJ. Kiehn O. Functional organization of V2a-related locomotor circuits in the rodent spinal cord. Ann N Y Acad Sci. 2010;1198:85–93. doi: 10.1111/j.1749-6632.2010.05502.x. [DOI] [PubMed] [Google Scholar]
- Dougherty KJ, Zagoraiou L, Satoh D, Rozani I, Doobar S, Arber S, Jessell TM. Kiehn O. Locomotor rhythm generation linked to the output of spinal shox2 excitatory interneurons. Neuron. 2013;80:920–933. doi: 10.1016/j.neuron.2013.08.015. [DOI] [PubMed] [Google Scholar]
- Duysens J. Reflex control of locomotion as revealed by stimulation of cutaneous afferents in spontaneously walking premammillary cats. J Neurophysiol. 1977;40:737–751. doi: 10.1152/jn.1977.40.4.737. [DOI] [PubMed] [Google Scholar]
- Duysens J, De Groote F. Jonkers I. The flexion synergy, mother of all synergies and father of new models of gait. Front Comput Neurosci. 2013;7:14. doi: 10.3389/fncom.2013.00014. [DOI] [PMC free article] [PubMed] [Google Scholar]
- Frigon A. Gossard JP. Asymmetric control of cycle period by the spinal locomotor rhythm generator in the adult cat. J Physiol. 2009;587:4617–4628. doi: 10.1113/jphysiol.2009.176669. [DOI] [PMC free article] [PubMed] [Google Scholar]
- Frigon A, Hurteau MF, Thibaudier Y, Leblond H, Telonio A. D'Angelo G. Split-belt walking alters the relationship between locomotor phases and cycle duration across speeds in intact and chronic spinalized adult cats. J Neurosci. 2013;33:8559–8566. doi: 10.1523/JNEUROSCI.3931-12.2013. [DOI] [PMC free article] [PubMed] [Google Scholar]
- Grillner S. Control of locomotion in bipeds, tetrapods, and fish. In: Mountcastle VB, editor; Brookhart JM, editor. Handbook of Physiology. The Nervous System. Motor Control. Vol. 2. Bethesd a, MD: American Physiological Society; 1981. pp. 1179–1236. [Google Scholar]
- Grillner S. Biological pattern generation: the cellular and computational logic of networks in motion. Neuron. 2006;52:751–766. doi: 10.1016/j.neuron.2006.11.008. [DOI] [PubMed] [Google Scholar]
- Halbertsma JM. The stride cycle of the cat: the modelling of locomotion by computerized analysis of automatic recordings. Acta Physiol Scand. 1983;521(Suppl):1–75. [PubMed] [Google Scholar]
- Hägglund M, Kimberly J, Dougherty KJ, Borgius L, Itohara S, Iwasato T. Kiehn O. Optogenetic dissection reveals multiple rhythmogenic modules underlying locomotion. Proc Natl Acad Sci USA. 2013;110:11589–1194. doi: 10.1073/pnas.1304365110. [DOI] [PMC free article] [PubMed] [Google Scholar]
- Jankowska E. Spinal interneuronal networks in the cat: elementary components. Brain Res Rev. 2008;57:46–55. doi: 10.1016/j.brainresrev.2007.06.022. [DOI] [PMC free article] [PubMed] [Google Scholar]
- Jasinski PE, Molkov YI, Shevtsova NA, Smith JC. Rybak IA. Sodium and calcium mechanisms of rhythmic bursting in excitatory neural networks of the pre-Bötzinger complex: a computational modelling study. Eur J Neurosci. 2013;37:212–230. doi: 10.1111/ejn.12042. [DOI] [PMC free article] [PubMed] [Google Scholar]
- Kiehn O. Locomotor circuits in the mammalian spinal cord. Annu Rev Neurosci. 2006;29:279–306. doi: 10.1146/annurev.neuro.29.051605.112910. [DOI] [PubMed] [Google Scholar]
- Kiehn O. Development and functional organization of spinal locomotor circuits. Curr Opin Neurobiol. 2011;21:100–109. doi: 10.1016/j.conb.2010.09.004. [DOI] [PubMed] [Google Scholar]
- Kiehn O. Kjaerulff O. Distribution of central pattern generators for rhythmic motor outputs in the spinal cord of limbed vertebrates. Ann N Y Acad Sci. 1998;860:110–129. doi: 10.1111/j.1749-6632.1998.tb09043.x. [DOI] [PubMed] [Google Scholar]
- Kjäerulff O. Kiehn O. Distribution of networks generating and coordinating locomotor activity in the neonatal rat spinal cord in vitro: a lesion study. J Neurosci. 1996;16:5777–5794. doi: 10.1523/JNEUROSCI.16-18-05777.1996. [DOI] [PMC free article] [PubMed] [Google Scholar]
- Kjäerulff O. Kiehn O. Crossed rhythmic synaptic input to motoneurons during selective activation of the contralateral spinal locomotor network. J Neurosci. 1997;17:9433–9447. doi: 10.1523/JNEUROSCI.17-24-09433.1997. [DOI] [PMC free article] [PubMed] [Google Scholar]
- Lanuza GM, Gosgnach S, Pierani A, Jessell TM. Goulding M. Genetic identification of spinal interneurons that coordinate left-right locomotor activity necessary for walking movements. Neuron. 2004;42:375–386. doi: 10.1016/s0896-6273(04)00249-1. [DOI] [PubMed] [Google Scholar]
- McCrea DA. Rybak IA. Modeling the mammalian locomotor CPG: insights from mistakes and perturbations. Prog Brain Res. 2007;165:235–253. doi: 10.1016/S0079-6123(06)65015-2. [DOI] [PMC free article] [PubMed] [Google Scholar]
- McCrea DA. Rybak IA. Organization of mammalian locomotor rhythm and pattern generation. Brain Res Rev. 2008;57:134–146. doi: 10.1016/j.brainresrev.2007.08.006. [DOI] [PMC free article] [PubMed] [Google Scholar]
- Pearson KG. Duysens J. Function of segmental reflexes in the control of stepping in cockroaches and cats. In: Stuart DG, editor; Herman RM, Grillner S, Stein PSG, editors. Neural Control of Locomotion. New Yo rk, NY: Plenum Press; 1976. pp. 519–537. [Google Scholar]
- Pierani A, Moran-Rivard L, Sunshine MJ, Littman DR, Goulding M. Jessell TM. Control of interneuron fate in the developing spinal cord by the progenitor homeodomain protein Dbx1. Neuron. 2001;29:367–384. doi: 10.1016/s0896-6273(01)00212-4. [DOI] [PubMed] [Google Scholar]
- Quinlan KA. Kiehn O. Segmental, synaptic actions of commissural interneurons in the mouse spinal cord. J Neurosci. 2007;27:6521–6530. doi: 10.1523/JNEUROSCI.1618-07.2007. [DOI] [PMC free article] [PubMed] [Google Scholar]
- Rabe N, Gezelius H, Vallstedt A, Memic F. Kullander K. Netrin-1-dependent spinal interneuron subtypes are required for the formation of left– right alternating locomotor circuitry. J Neurosci. 2009;29:15642–15649. doi: 10.1523/JNEUROSCI.5096-09.2009. [DOI] [PMC free article] [PubMed] [Google Scholar]
- Restrepo CE, Lundfald L, Szabó G, Erdélyi F, Zeilhofer HU, Glover JC. Kiehn O. Transmitter-phenotypes of commissural interneurons in the lumbar spinal cord of newborn mice. J Comp Neurol. 2009;517:177–192. doi: 10.1002/cne.22144. [DOI] [PubMed] [Google Scholar]
- Rybak IA, Shevtsova NA, St-John WM, Paton JF. Pierrefiche O. Endogenous rhythm generation in the pre-Bötzinger complex and ionic currents: modelling and in vitro studies. Eur J Neurosci. 2003;18:239–257. doi: 10.1046/j.1460-9568.2003.02739.x. [DOI] [PubMed] [Google Scholar]
- Rybak IA, Shevtsova NA, Ptak K. McCrimmon DR. Intrinsic bursting activity in the pre-Bötzinger Complex: Role of persistent sodium and potassium currents. Biol Cyber. 2004;90:59–74. doi: 10.1007/s00422-003-0447-1. [DOI] [PubMed] [Google Scholar]
- Rybak IA, Shevtsova NA, Lafreniere-Roula M. McCrea DA. a Modelling spinal circuitry involved in locomotor pattern generation: insights from deletions during fictive locomotion. J Physiol. 2006;577:617–639. doi: 10.1113/jphysiol.2006.118703. [DOI] [PMC free article] [PubMed] [Google Scholar]
- Rybak IA, Stecina K, Shevtsova NA. McCrea DA. b Modelling spinal circuitry involved in locomotor pattern generation: insights from the effects of afferent stimulation. J Physiol. 2006;577:641–658. doi: 10.1113/jphysiol.2006.118711. [DOI] [PMC free article] [PubMed] [Google Scholar]
- Rybak IA, Shevtsova NA. Kiehn O. Modelling genetic reorganization in the mouse spinal cord affecting left–right coordination during locomotion. J Physiol. 2013;591:5491–5508. doi: 10.1113/jphysiol.2013.261115. [DOI] [PMC free article] [PubMed] [Google Scholar]
- Rybak IA, Molkov YI, Jasinski PE, Shevtsova NA. Smith JC. Rhythmic bursting in the pre-Bötzinger Complex: Mechanisms and models. Progr Br Res. 2014;209:1–25. doi: 10.1016/B978-0-444-63274-6.00001-1. [DOI] [PMC free article] [PubMed] [Google Scholar]
- Smith JC, Butera RJ, Koshiya N, Del Negro C, Wilson CG. Johnson SM. Respiratory rhythm generation in neonatal and adult mammals: the hybrid pacemaker-network model. Respir Physiol. 2000;122:131–147. doi: 10.1016/s0034-5687(00)00155-9. [DOI] [PubMed] [Google Scholar]
- Talpalar AE. Kiehn O. Glutamatergic mechanisms for speed control and network operation in the rodent locomotor CPG. Front Neural Circuits. 2010;4:3–14. doi: 10.3389/fncir.2010.00019. [DOI] [PMC free article] [PubMed] [Google Scholar]
- Talpalar AE, Bouvier J, Borgius L, Fortin G, Pierani A. Kiehn O. Dual-mode operation of neuronal networks involved in left-right alternation. Nature. 2013;500:85–88. doi: 10.1038/nature12286. [DOI] [PubMed] [Google Scholar]
- Tazerart S, Viemari J-C, Darbon P, Vinay L. Brocard F. Contribution of persistent sodium current to locomotor pattern generation in neonatal rats. J Neurophysiol. 2007;98:613–628. doi: 10.1152/jn.00316.2007. [DOI] [PubMed] [Google Scholar]
- Tazerart S, Vinay L. Brocard F. The persistent sodium current generates pacemaker activities in the central pattern generator for locomotion and regulates the locomotor rhythm. J Neurosci. 2008;28:8577–8589. doi: 10.1523/JNEUROSCI.1437-08.2008. [DOI] [PMC free article] [PubMed] [Google Scholar]
- Zhang Y, Narayan S, Geiman E, Lanuza GM, Velasquez T, Shanks B, Akay T, Dyck J, Pearson K, Gosgnach S, Fan CM. Goulding M. V3 spinal neurons establish a robust and balanced locomotor rhythm during walking. Neuron. 2008;60:84–96. doi: 10.1016/j.neuron.2008.09.027. [DOI] [PMC free article] [PubMed] [Google Scholar]
- Zhong G, Masino MA. Harris-Warrick RM. Persistent sodium currents participate in fictive locomotion generation in neonatal mouse spinal cord. J Neurosci. 2007;27:4507–4518. doi: 10.1523/JNEUROSCI.0124-07.2007. [DOI] [PMC free article] [PubMed] [Google Scholar]
- Zhong G, Droho S, Crone SA, Dietz S, Kwan AC, Webb WW, Sharma K. Harris-Warrick RM. Electrophysiological characterization of V2a interneurons and their locomotor-related activity in the neonatal mouse spinal cord. J Neurosci. 2010;30:170–182. doi: 10.1523/JNEUROSCI.4849-09.2010. [DOI] [PMC free article] [PubMed] [Google Scholar]
- Zhong G, Sharma K. Harris-Warrick RM. Frequency-dependent recruitment of V2a interneurons during fictive locomotion in the mouse spinal cord. Nat Commun. 2011;2:274. doi: 10.1038/ncomms1276. [DOI] [PMC free article] [PubMed] [Google Scholar]
- Zhong G, Shevtsova NA, Rybak IA. Harris-Warrick RM. Neuronal activity in the isolated mouse spinal cord during spontaneous deletions in fictive locomotion: insights into locomotor central pattern generator organization. J Physiol. 2012;590:4735–4759. doi: 10.1113/jphysiol.2012.240895. [DOI] [PMC free article] [PubMed] [Google Scholar]
- Ziskind-Conhaim L, Wu L. Wiesner EP. Persistent sodium current contributes to induced voltage oscillations in locomotor-related Hb9 interneurons in the mouse spinal cord. J Neurophysiol. 2008;100:2254–2264. doi: 10.1152/jn.90437.2008. [DOI] [PMC free article] [PubMed] [Google Scholar]