

Abstract
Rodents are commonly used in food restriction-refeeding studies to investigate weight regain. Mice that are rationed food every 24 hours may consume all allocated food in a short time (gorge) and therefore undergo a brief well-fed period followed by an extended fasted period until the next day’s food allotment. These exaggerated metabolic states are not typical in ad-libitum fed (nibbling) mice. The aim of the current study was to elucidate the intraday and cumulative metabolic consequences of gorging (induced by food restriction) in mice during controlled refeeding. Accordingly, following a temporary food restriction, mice were fed rations similar to intakes of ad-libitum fed controls. Temporary food restriction initiated gorging behavior that persisted during refeeding; consequently, metabolism-related measurements were obtained in the gorging mice during their daily fed and fasted metabolic states. Robust differences in adipose tissue lipogenic and inflammatory gene expression were found in the gorging mice by metabolic state (fed versus fasted). Additionally, despite a reduced cumulative food intake compared to ad-libitum fed mice, restriction-induced gorging mice had increased intra-abdominal fat accumulation, diminished hepatic and peripheral insulin sensitivity, and a gene expression profile favoring lipid deposition. Our findings highlight the intraday differences in gene expression in gorging mice before and after feeding that confound comparisons with ad-libitum fed, or nibbling, mice. The present study also provides evidence that weight regain following food restriction is associated with cumulative metabolic and behavioral abnormalities in mice.
Keywords: food restriction, refeeding, weight regain, gorging, adiposity, insulin sensitivity
1. Introduction
Most individuals that lose weight are unable to maintain the weight loss over time [1]. Adipose tissue lipid stores are efficiently repleted with weight regain [2] and a disproportionate regain in fat mass relative to lean tissue has been observed in postmenopausal women [3] and the elderly [4]. Similarly, preferential fat accumulation has been observed during catch-up growth in low-birth-weight infants [5] and following starvation [6].
Rodent models are commonly used to elucidate the biological mechanisms promoting adipose tissue regain after weight loss and accelerated fat deposition after growth arrest [7–17]. In these “refeeding” studies, rodents are calorie/food restricted to induce weight loss or arrest growth and subsequently refed at levels equivalent to intakes of matched controls or provided ad-libitum access to food. Energy utilization or expression and activity of genes and proteins involved in lipid metabolism are then examined to characterize the mechanisms promoting fat accumulation after cessation of food restriction.
A potential confounding factor in rodent refeeding studies is the effect of feeding behavior on gene and protein expression, whole-body metabolism, and lipid stores. When daily food rations are restricted below what would be consumed ad-libitum (e.g. food restriction) or rationed to levels consumed by matched controls (e.g. refeeding), rodents may exhibit a gorging pattern of food intake where all allotted food is ingested shortly after it is presented [18–20]. This feeding behavior contrasts with the nibbling pattern of food intake in rodents fed ad-libitum where food is consumed intermittently mostly throughout the dark hours and in short periods during light hours [18]. As a result of these eating patterns, the daily metabolic states of gorging rodents on a rationed diet include a brief fed state and an extended fasted state until the following day’s food allotment [18] which contrasts with nibbling rodents that effectively remain in a constant fed state. Consequently, metabolism-related gene and protein expression levels, metabolic responses, and lipid stores in gorging rodents may vary considerably in a daily feeding cycle and be at extremes immediately before and after feeding.
To our knowledge, no study has examined intraday metabolism-related changes consequent to restriction-induced gorging during weight regain. Accordingly, in the current studies, mice were subjected to a short-term food restriction that triggered gorging and subsequently refed rations similar to daily intakes of ad-libitum fed control mice. Lipid stores, metabolites and hormones, and expression of genes involved in adipose tissue metabolism and inflammation were then measured in the gorging mice during their daily fed period (gorging) and at the end of their daily fasted period. Additionally, using hyperinsulinemic-euglycemic clamps, insulin sensitivity was investigated in gorging mice subjected to similar food restrictions/rations. Our aims were to capture intraday oscillations in lipid stores and adipose tissue gene expression in gorging mice and to identify metabolic consequences of gorging precipitated by food restriction during weight regain.
2. Materials and methods
2.1 Animals and study design
Two studies, almost identical in design, were used to meet the objectives of this paper. The primary differences between the studies were location of housing and data collected (see subsequent paragraphs). Study 1 was conducted at The Ohio State University (OSU) and Study 2 at Yale University. All study procedures were approved by the Institutional Animal Care and Use Committees at the respective institutions.
In study 1, five-week-old male CD2F1 mice (BALB/c x DBA/2, Charles River Laboratories, Wilmington, MA, USA) were randomized by weight into two groups: Control (n=10) and Restricted (n=20). Mice were individually housed at a temperature of 22 ± 0.5°C on a 12:12-h light-dark cycle and provided free access to water. Control mice were fed ad-libitum with AIN-93G semi-purified pelleted diet (Research Diets, New Brunswick, NJ, USA). Restricted mice were rationed AIN-93G diet early in the light cycle (0830 – 1000). Food rations were restricted 30 – 75 % (average ~50%) relative to Control mice over the first 5 days of the study and approximated Control group intake the remaining 13 days. This feeding regimen was based on a pair-feeding schedule that resembles food provisions in refeeding studies and is known to trigger gorging in mice (unpublished observation). All mice were sacrificed after 18 days at the same time of day (0900 – 1200). Control mice were fed ad-libitum until sacrifice. Refed Restricted mice gorge all allotted food shortly after presentation and therefore undergo a brief fed period and an extended fasted period every 24 h feeding cycle (Fig. 1A). On the day of sacrifice, one half the Restricted mice were fed at 0730 and then sacrificed ~3–4 h after food provision (during gorging). The other half of Restricted mice were not fed and were sacrificed at the end of their usual daily extended fast. These groups were designated Restricted (Gorging) and Restricted (Post-gorging) respectively. Mice were anesthetized with isoflurane and blood was collected by cardiac puncture into EDTA-treated tubes. Tubes were centrifuged at 1500 x g for 20 min at 4 C and plasma was collected and frozen at −80 C until analysis. Tissues were excised, weighed, frozen in liquid nitrogen and stored at −80°C until analysis except sections of epididymal white adipose tissue (eWAT) that were fixed in 4% paraformaldehyde for paraffin embedding.
Fig. 1.

Metabolic state, food intake, and body weight differences between Restricted mice and ad-libitum fed Controls (A) Metabolic states of Control and Restricted mice in 24 h feeding cycle. Restricted mice gorge all food rations shortly after presentation and therefore experience a brief “fed” period and an extended “fasted” period until food is provided the following day. Control mice nibble throughout dark hours and in short bouts during light hours and therefore effectively remain in a constant “fed” state. (B) Food intakes and (C) Body weights during food restriction (first 5 days) and refeeding. Values represent means ± s.e.m. (Control, n=10; Restricted, n=20). Food intakes were evaluated by Mann-Whitney test and body weights by Student’s t-test. Asterisks indicate statistically significant differences, p < 0.05.
In study 2, five-to-seven-week-old male CD2F1 mice (BALB/c x DBA/2, Charles River Laboratories) were randomized by weight into two groups: Control (n=12) and Restricted (n=12). Housing (except location), diet, and feeding schedule were the same as study 1. Food for Restricted mice was restricted ~50% compared to intake of Control mice over the first 5 days of the study and approximated Control group intake (81–106%) until mice were clamped on days 14–17. Tissues were collected as described in the clamp procedures.
2.2 Food intake, body weight, and behavior
Food intake and body weight were measured daily early in the light cycle. In study 1, feeding behavior was observed when food was presented and cages of Restricted mice were observed daily near the end of the light cycle (1630 – 1730) for food remnants to confirm gorging behavior. In study 2, gorging behavior in Restricted mice was observed when food was presented.
2.3 Quantitative real-time PCR
Total RNA was extracted from epididymal and brown adipose tissue in study 1 using the RNeasy® Lipid Tissue Mini Kit (Qiagen, Valencia, CA, USA) according to manufacturer instructions. RNA was reverse transcribed to cDNA using the High Capacity cDNA Archive Kit (Applied Biosystems, Foster City, CA, USA). Using real-time PCR, cDNA was amplified with predesigned primers and probes (TaqMan Gene Expression Assays, Applied Biosystems) in an Applied Biosystems 7300 instrument. Target gene expression was normalized to 18S rRNA and expressed as 2−ΔΔCT relative to the Control group [21].
2.4 Histology
Sections of eWAT (5 μm) from each mouse in study 1 were mounted on glass slides and stained with hematoxylin and eosin (H&E) by the Histology Core Laboratory, Ohio State College of Veterinary Medicine. Images were captured using a light microscope (Olympus, Center Valley, PA, USA) equipped with a Pixera Pro 150ES digital camera (Pixera, Los Gatos, CA, USA). Three to five fields per slide were randomly chosen by one blinded evaluator for imaging. Images were analyzed using ImageJ software (NIH, Bethesda, MD, USA) to measure cross-sectional area of 150 randomly chosen adipocytes per mouse [22].
2.5 Liver lipids
Total lipids were extracted from ~50 mg sections of livers from each mouse in study 1 using the Folch method [23]. Lipid extraction was accomplished using a 2:1 v/v solution of chloroform and methanol and a 0.88% KCl solution wash. To facilitate phase separation, samples were centrifuged at 1000 x g. The lower phase (organic) was transferred into a pre-weighed tube and subsequently dried under nitrogen. After drying, tubes were weighed again to calculate total lipid weight per sample.
2.6 Plasma measurements
Plasma leptin and adiponectin were measured by ELISA (Millipore, Billerica, MA, USA) according to manufacturer instructions. Plasma β-hydroxybutyrate was quantified by colorimetric assay (Sigma Aldrich, St. Louis, MO, USA).
2.7 Hyperinsulinemic-euglycemic clamp
In study 2, indwelling catheters were placed into the internal jugular vein of mice 7–8 days prior to clamp experiments. Mice were fasted overnight (food was removed 1 h after lights off), a standard procedure to assess glucose utilization during clamp experiments [24]. Restricted mice, however, had consumed all daily rations prior to food removal for fasting. Thus, the eating pattern and extended fast of Restricted mice were undisturbed by the clamp experiments. Basal whole-body glucose turnover was measured by infusing [3-3H]-glucose at a rate of 0.05 μCi/min for 120 min. After basal measurements, the hyperinsulinemic-euglycemic clamp was conducted for 140 min with a 4-min primed infusion (20 mU/kg) followed by continuous infusion (3 mU/kg/min) of human insulin (Novolin R, Novo Nordisk, Princeton, NJ, USA). [3-3H] glucose was continuously infused at 0.1 μCi/min and a variable infusion of 20% dextrose was used to maintain euglycemia (~120 mg/dl). Plasma samples were obtained from the tail at set time points. 2-deoxy-d-[1-14C] glucose was injected as a bolus (10 μCi) at 85 min to measure tissue-specific glucose uptake. At study completion, mice were anesthetized with pentobarbital sodium injection (150 mg/kg) and tissues were excised, snap-frozen in liquid nitrogen, and stored at −80°C until analysis.
2.8 Clamp biochemical analysis and calculations
Plasma glucose was measured using a YSI 2700D glucose analyzer (YSI Life Sciences, Yellow Springs, OH, USA). Plasma insulin was determined by radioimmunoassay kit (Millipore). To measure plasma 3H-glucose and 2-deoxy-d-[1-14C]-glucose, plasma was deproteinized with ZnSO4 and Ba(OH)2, dried to remove 3H2O, resuspended in water, and counted in scintillation fluid using a Beckman Coulter (Brea, CA, USA) scintillation counter. Glucose turnover rates were calculated as the ratio of the [3-3H]-glucose infusion rate to the specific activity of plasma glucose at the end of the basal period and during the final (on average) 30 min of steady state of the clamp. Endogenous glucose production was determined by subtracting glucose infusion rate from whole-body insulin-stimulated glucose disposal. Basal hepatic insulin resistance index was calculated as basal endogenous glucose production × fasting plasma insulin [25]. To measure tissue-specific glucose disposal, tissue samples were homogenized and supernatants subjected to an ion-exchange column (Bio-Rad, Hercules, CA, USA) to separate tissue 2-deoxy-d-[1-14C]-glucose-6-phosphate from 2-deoxy-d-[1-14C]-glucose. Tissue glucose uptake was calculated from area under curve of plasma 2-deoxy-d-[1-14C]-glucose and tissue 2-deoxy-d-[1-14C]-glucose-6-phosphate content [26].
2.9 Statistics
Data are expressed as means ± s.e.m. Statistical analyses consisted of two-tailed unpaired Student’s t-test, Mann-Whitney test, one-way ANOVA with post-hoc Tukey’s test, or ANCOVA as noted in figure legends. Data not meeting test assumptions were transformed for analysis as indicated in figure legends; however, un-transformed means are presented for relevance. MINITAB 16 (State College, PA, USA), Microsoft Excel (Microsoft Inc., Redmond, WA, USA), and SPSS v21 (IBM, Somers, NY, USA) were used for data analysis. P-value < 0.05 was considered significant.
3. Results
3.1 Food intake, behavior, and body weight
Over the first 5 days of study 1, Restricted mice were rationed and consumed an average of ~50% less food than ad-libitum fed Control mice (daily reductions ranged from 30 – 75%, Fig. 1B). After day 5, food intake of Restricted mice ranged from 98 to 122% of Control group intake (Fig. 1B). Cumulative food intake was decreased in Restricted mice (Control, 51.0 ± 1.1 g; Restricted, 45.6 ± 0.3 g, p < 0.01).
Mice were fed between ~0830–1000 h daily and Restricted mice had consumed all rations when cages were observed between 1630–1730 h. At feeding, all Restricted mice were observed to rapidly ingest the food presented (gorge). This behavior was not observed in Control mice. For necropsy, Restricted (Gorging) mice were fed at 0730 h and were observed during necropsy (~3–4 h later) to have fully distended stomachs filled with food lending support that gorging behavior persisted until study end. This was not observed in Control mice.
At the start of study 1, Restricted and Control groups had similar body weights. During the 5 days of food restriction, Restricted mice lost 21% body weight compared to Control mice (Fig. 1C). After day 5, Restricted mice began gaining weight and by study’s end body weight of Restricted mice was 4% lower than Control mice (p < 0.05) (Fig. 1C).
3.2 Adipose tissue mass and adipocyte size
To determine the extent to which adipose lipid storage is affected by a temporary food restriction and intraday changes in metabolic state consequent to gorging during refeeding, we compared adipose depots of Restricted mice during gorging and at the end of their extended fast. eWAT mass of Restricted (Gorging) and Restricted (Post-gorging) mice were significantly higher, 21 and 31% respectively, than in Control mice and were not different from each other (Fig. 2A). A plot of eWAT mass by body weight for individual mice is presented in Figure 2B. Consistent with eWAT weights, cross-sectional area of epididymal adipocytes of Restricted (Gorging) and Restricted (Post-gorging) mice were also significantly higher, 31 and 27% respectively, than in Control mice and were not different from each other (Fig. 2C, D). Inguinal fat pad weights were not significantly different among groups (Fig. 2A).
Fig. 2.

Adipose tissue mass and adipocyte size in refed Restricted mice by metabolic state and relative to ad-libitum fed Controls. (A) White adipose tissue weights, n=10 per group. (B) eWAT mass by body weight. eWAT mass was significantly higher in both Restricted groups compared to Control mice by ANCOVA with body weight as a covariate (p < 0.001, post hoc LSD tests; n=10 per group). (C) eWAT adipocyte cross-sectional area, 150 cells/mouse x 8–10 mice per group. (D) Representative images of H&E stained eWAT revealing effects of restriction-triggered gorging on adipocyte morphology. Magnification: 200x; Scale Bar: 50μm. Data in A and C were analyzed using one-way ANOVA with post hoc Tukey’s test. Different letters indicate statistically significant differences among groups, p < 0.05. eWAT, epididymal white adipose tissue; iWAT, inguinal white adipose tissue.
3.3 Intraday changes in liver lipid stores
Given that fasting may induce hepatic steatosis [27], we measured hepatic lipids in all groups. Total liver lipids were ~24% higher in Restricted (Post-gorging) mice compared to Control and Restricted (Gorging) groups, which were not different from each other (Fig. 3A). To gauge the degree of fasting in each group, we measured plasma β-hydroxybutyrate, the major ketone formed during fasting. Plasma β-hydroxybutyrate levels were 213% higher in Restricted (Post-gorging) mice compared to Control mice (ANOVA, p=0.081) (Fig. 3B).
Fig. 3.

Liver lipid stores in refed Restricted mice by metabolic state and relative to ad-libitum fed Controls. (A) Total liver lipids (n=9–10 per group). (B) Plasma β-hydroxybutyrate (n=4–7 per group) was measured to assess degree of fasting. Values represent means ± s.e.m. Data were analyzed using one-way ANOVA with post hoc Tukey’s test. Different letters indicate statistically significant differences among groups, p < 0.05.
3.4 Intraday changes in brown adipose tissue gene expression
Brown adipose tissue (BAT) thermogenesis is accomplished by uncoupling protein 1 (UCP1) which uncouples mitochondrial respiration from ATP synthesis resulting in heat production (thereby promoting energy expenditure) [28]. To determine whether BAT thermogenic capacity is altered by restriction-induced gorging, mRNA expression of thermogenesis-related genes were measured in interscapular BAT (iBAT) in all groups. Expression of UCP1 was significantly decreased in both Restricted groups compared to Control mice (Fig. 4). Gene expression of peroxisome proliferator activated receptor gamma coactivator 1α (PGC1α), a transcriptional co-activator crucial to thermogenesis [29], was also significantly decreased in Restricted (Gorging) mice relative to Control mice (Fig. 4). There were no significant differences in expression of either gene between Restricted groups (Fig. 4).
Fig. 4.
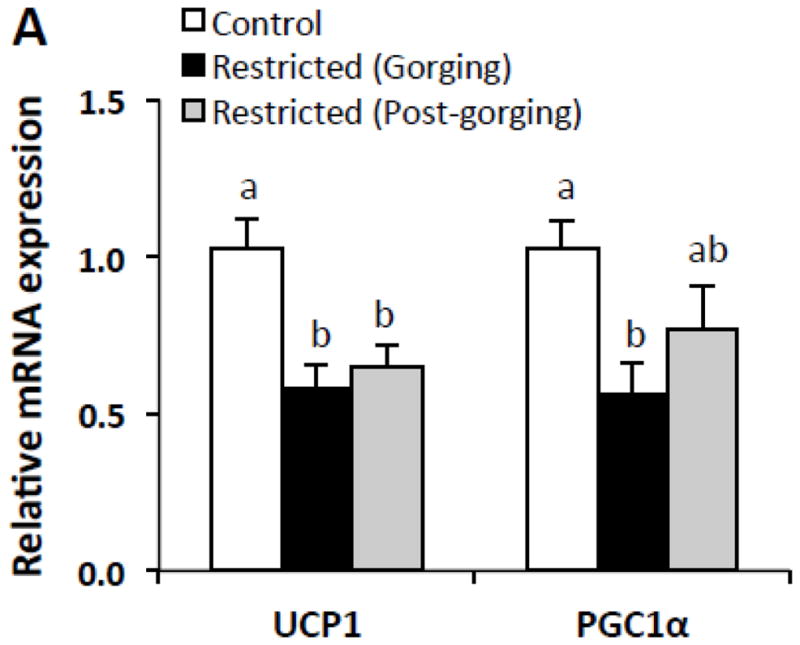
Expression of thermogenesis-related genes in brown adipose tissue in refed Restricted mice by metabolic state and relative to ad-libitum fed Control mice. Values represent means ± s.e.m., n=7–10 per group. Data were analyzed using one-way ANOVA with post hoc Tukey’s test. Different letters indicate statistically significant differences among groups, p < 0.05.
3.5 Intraday changes in lipid metabolism-related gene expression
Because genes promoting lipid storage and mobilization would likely be affected by consumption of a large amount of food and/or an extended fast, we measured expression of genes involved in adipo/lipogenesis and lipolysis in all groups. Gene expression of key enzymes and transcription factors promoting de novo lipogenesis [fatty acid synthase (FAS), sterol-regulatory element binding protein-1 (SREBP-1), stearoyl-CoA desaturase 1 (SCD1)], adipogenesis [peroxisome proliferator activated receptor γ (PPARγ)], and lipid uptake [lipoprotein lipase (LPL)] in eWAT were significantly higher in Restricted (Gorging) mice compared to Control mice (Fig. 5A).
Fig. 5.

Gene expressions in epididymal white adipose tissue in refed Restricted mice by metabolic state and relative to ad-libitum fed Controls. (A) Adipo/lipogenic and lipolytic mRNA expression. (B) Adipokines and inflammatory marker mRNA expression and plasma adipokines. Values represent means ± s.e.m., n=7–10 per group. Data were analyzed using one-way ANOVA with post hoc Tukey’s test. SCD1, LPL, SREBP-1, PPARγ, TNF-α, CD68, and LEP were transformed for statistical analysis. Untransformed means are presented for relevance. Different letters indicate statistically significant differences among groups, p < 0.05. ADIPOQ, adiponectin; ATGL, adipose triglyceride lipase; CD36, fatty acid translocase, cluster of differentiation 36; CD68, cluster of differentiation 68; F4/80, EGF-like module-containing mucin-like hormone receptor-like 1; FAS, fatty acid synthase; HSL, hormone-sensitive lipase; IL-6, interleukin 6; LEP, leptin; LPL, lipoprotein lipase; PLIN1, perilipin-1; PPARγ, peroxisome proliferator-activated receptor gamma; SCD1, stearoyl-CoA desaturase-1; SREBP-1, sterol regulatory element-binding protein-1; TNF-α, tumor necrosis factor α.
With the exception of SCD1, mRNA levels of these genes were significantly decreased in Restricted (Post-gorging) mice compared to Restricted (Gorging) mice (Fig. 5A). Of interest, expression of FAS and LPL were not different and SCD1 was increased in Restricted (Post-gorging) compared to Control mice (Fig. 5A). No differences in gene expression were detected among groups for adipose triglyceride lipase (ATGL), hormone sensitive lipase (HSL), or the lipid droplet protein perilipin (PLIN1), which play a role in regulating lipolysis [30] (Fig. 5A).
3.6 Intraday changes in adipokine gene expression
Adipokine circulating levels generally correlate positively with adiposity [31]. Given eWAT mass and adipocyte size were similar in Restricted groups but increased compared to Control mice, we measured adipokine gene expression in all groups to determine whether expression paralleled fat mass. Despite no difference in adipose mass, gene expression of pro-inflammatory adipokines [interleukin-6 (IL-6), tumor necrosis factor α, (TNF-α)] and leptin in eWAT were significantly higher (2–6 fold) in Restricted (Gorging) mice compared to Restricted (Post-gorging) mice (Fig. 5B). Expression of markers of macrophage infiltration (F4/80, CD68) and plasma leptin were similarly higher. Although eWAT weight of Restricted (Post-gorging) mice was 31% higher than the Control group, gene expression of TNF-α and leptin in this group was significantly decreased (Fig. 5B).
3.7 Insulin sensitivity
To assess whether insulin sensitivity is altered in restriction-induced gorging mice during refeeding, we used hyperinsulinemic euglycemic clamps to assess whole-body, hepatic, muscle, and adipose tissue insulin sensitivity. Eight Control mice (body weight: 18.3 ± 0.2 g) and seven Restricted mice (body weight: 19.0 ± 0.2 g) were successfully clamped on study days 14–17. Glucose infusion rates to maintain euglycemia (Fig. 6A) during the experiment were approximately 1.5 fold lower in Restricted mice than in Control mice (Fig. 6B) indicating whole-body insulin resistance. Clamp insulin levels were increased in Restricted mice (Fig. 6C). Whole-body glucose uptake during the clamp was significantly decreased (24%) in Restricted mice (Fig. 6D) although no significant differences in glucose disposal in gastrocnemius muscle or eWAT (Fig. 6E) were detected. Basal endogenous glucose production (EGP) was 77% higher (Fig. 6F) and the basal hepatic insulin resistance index was significantly increased (Control, 65.1 ± 13.8; Restricted, 194.2 ± 40.0, p < 0.05) in Restricted mice. Insulin-stimulated EGP was not different between groups.
Fig. 6.

Hyperinsulinemic-euglycemic clamp measurements of refed Restricted mice compared to ad-libitum fed Controls. (A) Time course of arterial glucose. (B) Glucose infusion rates during hyperinsulinemia. (C) Basal and clamp insulin levels. (D) Whole- body glucose uptake. (E) Muscle and white adipose tissue glucose disposal. (F) Endogenous glucose production (EGP) during basal and hyperinsulinemic conditions. Values represent means ± s.e.m., (Control, n=7–8; Restricted, n=6–7). Differences between Control and Restricted groups were analyzed by Student’s t-test. Asterisks indicate statistically significant differences, p < 0.05. eWAT, epididymal white adipose tissue; gastroc, gastrocnemius.
4. Discussion
In the present study, temporary food restriction triggered gorging behavior that persisted even when the mice were subsequently rationed food at levels approximating diet amounts provided to age-matched controls. We observed enhanced intra-abdominal fat accumulation despite controlled refeeding in restriction-induced gorging mice compared to mice fed ad-libitum which may be partially explained by suppressed BAT thermogenic capacity and a gene expression profile favoring lipid deposition. Additionally, we found robust intraday changes in adipose tissue gene expression and diminished insulin sensitivity in restriction-induced gorging mice during weight regain.
Accelerated rates of fat recovery resulting in excess adiposity have been reported in adults and children during nutritional recovery after starvation [6] and in a rat model of controlled refeeding following semi-starvation [12, 14–16]. Moreover, during weight regain in women with anorexia nervosa, body fat was disproportionately redeposited centrally [32, 33]. Consistent with these studies, we observed Restricted mice gained significantly more intra-abdominal fat (eWAT) during weight regain despite a lower cumulative food intake and lower final body weight compared to ad-libitum fed Control mice. Analogous increases in adipocyte cross-sectional area substantiate this finding. Intra-abdominal adipose tissue mass and adipocyte size of refed Restricted mice, however, did not vary by metabolic state. Thus, intraday changes in adipose tissue mass, if they exist, were not detectable as early as 3–4 h into gorging relative to mice that were 16–18 h post-gorging. In contrast to differences in eWAT, we found no differences in subcutaneous fat mass after weight regain in refed Restricted mice compared to age-matched Control mice, a finding also consistent with weight regain in women with anorexia nervosa [33].
Increased intra-abdominal adiposity in the face of reduced cumulative food intake would be possible with a sustained reduction in energy expenditure. Although we did not measure resting energy expenditure, we presume energy expenditure was decreased in Restricted mice following food restriction. Additionally, food restriction has been shown to decrease energy expenditure beyond what would be expected from loss of body mass by suppressing thermogenesis and therefore increasing efficiency of energy utilization [34]. Conversely, conditions such as overfeeding (e.g. gorging) have been shown to activate thermogenesis, including brown adipose tissue (BAT) thermogenesis [34, 35]. Despite gorging meals, mRNA expression of UCP1, the mitochondrial protein determining thermogenic capacity in BAT, was significantly decreased in both Restricted groups (Gorging and Post-gorging) compared to Control mice. This apparent sustained suppression of thermogenic capacity (hence energy expenditure) may partially explain the excess adiposity in Restricted mice after refeeding. In fact, in studies of catch-up growth [16] and weight regain following weight loss [11] in rats, spared energy from suppressed thermogenesis (increased metabolic efficiency) was shown to be preferentially directed to fat deposition.
In the present study we captured intraday changes in expression of lipid metabolism-related genes. That gene expression of key enzymes and transcription factors promoting de novo lipogenesis, adipogenesis, and lipid uptake in intra-abdominal adipose tissue were increased in Restricted mice during gorging was not surprising. However, at the end of the daily extended fast (Post-gorging), with the exception of SREBP-1, expression of lipogenic genes in Restricted mice remained elevated or were equivalent to fed controls suggesting fat storage is favored throughout the feeding cycle. This enhanced expression of lipogenic genes is consistent with a mouse model of catch-up growth following low birth weight [17] but varies slightly from a rat model of semistarvation-refeeding where both adipogenic and lipogenic gene expression were enhanced [15] although metabolic state was not reported in these studies.
In addition to intraday oscillations in adipo/lipogenic genes, adipokine gene expression also varied by metabolic state in the gorging mice following restriction, but did not parallel fat mass. In general, circulating levels of adipokines are positively related to fat mass [31], yet gene expression of pro-inflammatory adipokines and leptin during Restricted mice’s daily extended fast were negatively associated with fat mass relative to Control mice. This may best be explained by the fact that gene transcription of many adipokines is acutely regulated by nutrient availability and catecholamines. IL-6 and TNF-α mRNA expressions in adipose are positively regulated by glucose and glucosamine [36] while leptin transcription is negatively regulated by catecholamines and positively by nutrient availability [37]. During Restricted mice’s daily extended fast, when plasma ketones trended higher, nutrient availability presumably would be decreased and catecholamines increased. This would explain reduced IL-6, TNF-α, and leptin mRNA expressions as well as decreased plasma leptin levels. Altogether, these intraday variations in expression of lipid metabolism-related genes and adipokines demonstrate the exaggerated “fed” and “fasted” metabolic states consequent to gorging behavior – extremes that may confound comparisons with nibbling mice.
A key study objective was to identify whole-body, sustained metabolic consequences of restriction-induced gorging in mice during weight regain. Data from the hyperinsulinemic-euglycemic clamp experiments demonstrate that Restricted mice developed hepatic insulin resistance. In addition, although our findings were not statistically significant in gastrocnemius muscle, total glucose disposal was decreased in Restricted mice suggesting peripheral insulin sensitivity was compromised. Differences in insulin sensitivity between Restricted and Control groups may be the result of differences in fasting status [24]. Restricted mice consumed their entire daily food allotment prior to overnight fasting for clamp experiments. In contrast, because Control mice (fed ad-libitum) consume most of their food in the dark phase [18], it is likely that compared to Restricted mice, Control mice consumed significantly less total food in the 24 hours preceding the clamp experiments due to overnight fasting. Differences in experimental factors may explain the differences in insulin sensitivity between groups.
Apart from the possible effects of fasting status on insulin sensitivity, the initial food restriction imposed on Restricted mice may have altered peripheral insulin sensitivity. In rats refed after semi-starvation to promote catch-up growth, glucose disposal in skeletal muscles was decreased while uptake in adipose tissue was increased [14]. We measured glucose uptake in gastrocnemius muscle and detected no difference between groups. However, because skeletal muscle is the major site of insulin-stimulated glucose disposal [38], our finding that whole-body glucose uptake is significantly decreased suggests glucose disposal in other skeletal muscles was diminished. Interestingly, the fold increase in glucose uptake in eWAT in our Restricted mice was similar to that observed in refed rats after semi-starvation [14]. Thus, our refed Restricted mice may be similar to a rat model of catch-up growth where a state of hyperinsulinemia (detected during the clamp in our study) and muscle insulin resistance directs glucose to adipose tissue [14]. In our mice, however, increased glucose uptake in adipose tissue did not completely compensate for decreased muscle disposal.
Deleterious consequences of prolonged fasting and/or refeeding after food restriction offer potential explanations for diminished insulin sensitivities observed in our mice. During fasting, fatty acids released from adipose tissue for energy are stored in the liver for conversion to ketones. Therefore, a consequence of an extended fast is hepatic lipid accumulation which we observed in refed Restricted mice. Intra-hepatic lipid accumulation is associated with hepatic insulin resistance which is postulated to be mediated by lipid intermediaries [39]. Similarly, a consequence of refeeding following food restriction is enhanced accumulation of intra-abdominal fat [32, 33] – also observed in our mice – which itself is associated with hepatic and extrahepatic insulin resistance [40, 41]. Thus, extended fasts and refeeding after food restriction both result in ectopic accumulation of lipids associated with increased risk of insulin resistance.
Although the initial food restriction and/or gorging behavior may explain increased eWAT mass and decreased insulin sensitivity in Restricted mice, it is also possible that a disruption of circadian rhythms caused by allocating food to the Restricted mice during the light hours may account for these deleterious effects. Mice are nocturnal feeders and consume most of their calories during the dark phase [18]. When mice consume food only during light hours, there is a “disconnect between the light-entrained rhythms and the food-entrained rhythms” [42]. This disconnect may explain why mice consuming a high fat diet only during the light period gained more weight than mice fed only during the dark period [43]. Thus, disrupted circadian timekeeping may have played a role in the adverse metabolic consequences observed in Restricted mice.
In summary, in the present study we show intra-abdominal fat accumulation is enhanced in mice during controlled refeeding following food restriction and suggest this may be partially explained by suppressed BAT thermogenic capacity and a gene expression profile favoring lipid deposition. We also demonstrate intraday oscillations in adipose tissue gene expressions in restriction-induced gorging mice reflecting the exaggerated metabolic states consequent to gorging behavior. Importantly, we show diminished hepatic and peripheral insulin sensitivity are metabolic consequences of restriction-induced gorging. Future studies should determine whether changes in adipose tissue gene expressions, lipid stores, and whole-body metabolism in our study can be attributed to the initial food restriction, circadian disturbances, and/or gorging eating pattern.
Highlights.
When mice are temporarily restricted (‘Restricted’) to ~ 70% energy needs, a gorging behavior persists for at least two weeks after adequate food energy is restored.
Restricted mice displayed enhanced intra-abdominal fat accumulation and diminished hepatic insulin sensitivity.
Gene expression in intra-abdominal adipose favors lipid deposition in Restricted mice.
Diurnal gene expression varies significantly in adipose tissues of Restricted vs. Control mice.
Acknowledgments
This research was supported by the Carol S. Kennedy endowment, Ohio Agricultural Research and Development Center, Pelotonia Graduate Fellowship, and by grants from the National Institute of Health (R01 DK-40936, U24 DK-059635).
Footnotes
Conflict of Interest:
The authors declare no conflict of interest.
Publisher's Disclaimer: This is a PDF file of an unedited manuscript that has been accepted for publication. As a service to our customers we are providing this early version of the manuscript. The manuscript will undergo copyediting, typesetting, and review of the resulting proof before it is published in its final citable form. Please note that during the production process errors may be discovered which could affect the content, and all legal disclaimers that apply to the journal pertain.
References
- 1.Kraschnewski JL, Boan J, Esposito J, Sherwood NE, Lehman EB, Kephart DK, et al. Long-term weight loss maintenance in the United States. Int J Obes (Lond) 2010;34:1644–54. doi: 10.1038/ijo.2010.94. [DOI] [PMC free article] [PubMed] [Google Scholar]
- 2.Maclean PS, Bergouignan A, Cornier MA, Jackman MR. Biology’s response to dieting: the impetus for weight regain. Am J Physiol Regul Integr Comp Physiol. 2011;301:R581–600. doi: 10.1152/ajpregu.00755.2010. [DOI] [PMC free article] [PubMed] [Google Scholar]
- 3.Beavers KM, Lyles MF, Davis CC, Wang X, Beavers DP, Nicklas BJ. Is lost lean mass from intentional weight loss recovered during weight regain in postmenopausal women? Am J Clin Nutr. 2011;94:767–74. doi: 10.3945/ajcn.110.004895. [DOI] [PMC free article] [PubMed] [Google Scholar]
- 4.Lee JS, Visser M, Tylavsky FA, Kritchevsky SB, Schwartz AV, Sahyoun N, et al. Weight loss and regain and effects on body composition: the Health, Aging, and Body Composition Study. J Gerontol A Biol Sci Med Sci. 2010;65:78–83. doi: 10.1093/gerona/glp042. [DOI] [PMC free article] [PubMed] [Google Scholar]
- 5.Ibanez L, Ong K, Dunger DB, de Zegher F. Early development of adiposity and insulin resistance after catch-up weight gain in small-for-gestational-age children. J Clin Endocrinol Metab. 2006;91:2153–8. doi: 10.1210/jc.2005-2778. [DOI] [PubMed] [Google Scholar]
- 6.Dulloo AG, Jacquet J, Montani JP. Pathways from weight fluctuations to metabolic diseases: focus on maladaptive thermogenesis during catch-up fat. Int J Obes Relat Metab Disord. 2002;26 (Suppl 2):S46–57. doi: 10.1038/sj.ijo.0802127. [DOI] [PubMed] [Google Scholar]
- 7.Ozelci A, Romsos DR, Leveille GA. Influence of initial food restriction on subsequent body weight gain and body fat accumulation in rats. J Nutr. 1978;108:1724–32. doi: 10.1093/jn/108.11.1724. [DOI] [PubMed] [Google Scholar]
- 8.Brownell KD, Greenwood MR, Stellar E, Shrager EE. The effects of repeated cycles of weight loss and regain in rats. Physiol Behav. 1986;38:459–64. doi: 10.1016/0031-9384(86)90411-7. [DOI] [PubMed] [Google Scholar]
- 9.Fried SK, Hill JO, Nickel M, DiGirolamo M. Novel regulation of lipoprotein lipase activity in rat brown adipose tissue: effects of fasting and caloric restriction during refeeding. J Nutr. 1983;113:1870–4. doi: 10.1093/jn/113.9.1870. [DOI] [PubMed] [Google Scholar]
- 10.MacLean PS, Higgins JA, Johnson GC, Fleming-Elder BK, Donahoo WT, Melanson EL, et al. Enhanced metabolic efficiency contributes to weight regain after weight loss in obesity-prone rats. Am J Physiol Regul Integr Comp Physiol. 2004;287:R1306–15. doi: 10.1152/ajpregu.00463.2004. [DOI] [PubMed] [Google Scholar]
- 11.MacLean PS, Higgins JA, Jackman MR, Johnson GC, Fleming-Elder BK, Wyatt HR, et al. Peripheral metabolic responses to prolonged weight reduction that promote rapid, efficient regain in obesity-prone rats. Am J Physiol Regul Integr Comp Physiol. 2006;290:R1577–88. doi: 10.1152/ajpregu.00810.2005. [DOI] [PubMed] [Google Scholar]
- 12.Dulloo AG, Girardier L. Adaptive changes in energy expenditure during refeeding following low-calorie intake: evidence for a specific metabolic component favoring fat storage. Am J Clin Nutr. 1990;52:415–20. doi: 10.1093/ajcn/52.3.415. [DOI] [PubMed] [Google Scholar]
- 13.Dulloo AG, Calokatisa R. Adaptation to low calorie intake in obese mice: contribution of a metabolic component to diminished energy expenditures during and after weight loss. Int J Obes. 1991;15:7–16. [PubMed] [Google Scholar]
- 14.Cettour-Rose P, Samec S, Russell AP, Summermatter S, Mainieri D, Carrillo-Theander C, et al. Redistribution of glucose from skeletal muscle to adipose tissue during catch-up fat: a link between catch-up growth and later metabolic syndrome. Diabetes. 2005;54:751–6. doi: 10.2337/diabetes.54.3.751. [DOI] [PubMed] [Google Scholar]
- 15.Summermatter S, Marcelino H, Arsenijevic D, Buchala A, Aprikian O, Assimacopoulos-Jeannet F, et al. Adipose tissue plasticity during catch-up fat driven by thrifty metabolism: relevance for muscle-adipose glucose redistribution during catch-up growth. Diabetes. 2009;58:2228–37. doi: 10.2337/db08-1793. [DOI] [PMC free article] [PubMed] [Google Scholar]
- 16.Crescenzo R, Samec S, Antic V, Rohner-Jeanrenaud F, Seydoux J, Montani JP, et al. A role for suppressed thermogenesis favoring catch-up fat in the pathophysiology of catch-up growth. Diabetes. 2003;52:1090–7. doi: 10.2337/diabetes.52.5.1090. [DOI] [PubMed] [Google Scholar]
- 17.Isganaitis E, Jimenez-Chillaron J, Woo M, Chow A, DeCoste J, Vokes M, et al. Accelerated postnatal growth increases lipogenic gene expression and adipocyte size in low-birth weight mice. Diabetes. 2009;58:1192–200. doi: 10.2337/db08-1266. [DOI] [PMC free article] [PubMed] [Google Scholar]
- 18.Ellacott KL, Morton GJ, Woods SC, Tso P, Schwartz MW. Assessment of feeding behavior in laboratory mice. Cell Metab. 2010;12:10–7. doi: 10.1016/j.cmet.2010.06.001. [DOI] [PMC free article] [PubMed] [Google Scholar]
- 19.Russell JC, Proctor SD, Kelly SE, Brindley DN. Pair feeding-mediated changes in metabolism: stress response and pathophysiology in insulin-resistant, atherosclerosis-prone JCR:LA-cp rats. Am J Physiol Endocrinol Metab. 2008;294:E1078–87. doi: 10.1152/ajpendo.90257.2008. [DOI] [PubMed] [Google Scholar]
- 20.Hambly C, Simpson CA, McIntosh S, Duncan JS, Dalgleish GD, Speakman JR. Calorie-restricted mice that gorge show less ability to compensate for reduced energy intake. Physiol Behav. 2007;92:985–92. doi: 10.1016/j.physbeh.2007.07.005. [DOI] [PubMed] [Google Scholar]
- 21.Livak KJ, Schmittgen TD. Analysis of relative gene expression data using real-time quantitative PCR and the 2(−Delta Delta C(T)) Method. Methods. 2001;25:402–8. doi: 10.1006/meth.2001.1262. [DOI] [PubMed] [Google Scholar]
- 22.Tian M, Kliewer KL, Asp ML, Stout MB, Belury MA. c9t11-Conjugated linoleic acid-rich oil fails to attenuate wasting in colon-26 tumor-induced late-stage cancer cachexia in male CD2F1 mice. Mol Nutr Food Res. 2011;55:268–77. doi: 10.1002/mnfr.201000176. [DOI] [PubMed] [Google Scholar]
- 23.Folch J, Lees M, Sloane Stanley GH. A simple method for the isolation and purification of total lipides from animal tissues. J Biol Chem. 1957;226:497–509. [PubMed] [Google Scholar]
- 24.Ayala JE, Samuel VT, Morton GJ, Obici S, Croniger CM, Shulman GI, et al. Standard operating procedures for describing and performing metabolic tests of glucose homeostasis in mice. Dis Model Mech. 2010;3:525–34. doi: 10.1242/dmm.006239. [DOI] [PMC free article] [PubMed] [Google Scholar]
- 25.Matsuda M, DeFronzo RA. Insulin sensitivity indices obtained from oral glucose tolerance testing: comparison with the euglycemic insulin clamp. Diabetes Care. 1999;22:1462–70. doi: 10.2337/diacare.22.9.1462. [DOI] [PubMed] [Google Scholar]
- 26.Youn JH, Buchanan TA. Fasting does not impair insulin-stimulated glucose uptake but alters intracellular glucose metabolism in conscious rats. Diabetes. 1993;42:757–63. doi: 10.2337/diab.42.5.757. [DOI] [PubMed] [Google Scholar]
- 27.Guan HP, Goldstein JL, Brown MS, Liang G. Accelerated fatty acid oxidation in muscle averts fasting-induced hepatic steatosis in SJL/J mice. J Biol Chem. 2009;284:24644–52. doi: 10.1074/jbc.M109.034397. [DOI] [PMC free article] [PubMed] [Google Scholar]
- 28.Cannon B, Nedergaard J. Brown adipose tissue: function and physiological significance. Physiol Rev. 2004;84:277–359. doi: 10.1152/physrev.00015.2003. [DOI] [PubMed] [Google Scholar]
- 29.Puigserver P, Wu Z, Park CW, Graves R, Wright M, Spiegelman BM. A cold-inducible coactivator of nuclear receptors linked to adaptive thermogenesis. Cell. 1998;92:829–39. doi: 10.1016/s0092-8674(00)81410-5. [DOI] [PubMed] [Google Scholar]
- 30.Zechner R, Zimmermann R, Eichmann TO, Kohlwein SD, Haemmerle G, Lass A, et al. FAT SIGNALS--lipases and lipolysis in lipid metabolism and signaling. Cell Metab. 2012;15:279–91. doi: 10.1016/j.cmet.2011.12.018. [DOI] [PMC free article] [PubMed] [Google Scholar]
- 31.Deng Y, Scherer PE. Adipokines as novel biomarkers and regulators of the metabolic syndrome. Ann N Y Acad Sci. 2010;1212:E1–E19. doi: 10.1111/j.1749-6632.2010.05875.x. [DOI] [PMC free article] [PubMed] [Google Scholar]
- 32.Grinspoon S, Thomas L, Miller K, Pitts S, Herzog D, Klibanski A. Changes in regional fat redistribution and the effects of estrogen during spontaneous weight gain in women with anorexia nervosa. Am J Clin Nutr. 2001;73:865–9. doi: 10.1093/ajcn/73.5.865. [DOI] [PubMed] [Google Scholar]
- 33.Mayer L, Walsh BT, Pierson RN, Jr, Heymsfield SB, Gallagher D, Wang J, et al. Body fat redistribution after weight gain in women with anorexia nervosa. Am J Clin Nutr. 2005;81:1286–91. doi: 10.1093/ajcn/81.6.1286. [DOI] [PubMed] [Google Scholar]
- 34.Dulloo AG, Seydoux J, Jacquet J. Adaptive thermogenesis and uncoupling proteins: a reappraisal of their roles in fat metabolism and energy balance. Physiol Behav. 2004;83:587–602. doi: 10.1016/j.physbeh.2004.07.028. [DOI] [PubMed] [Google Scholar]
- 35.Richard D, Picard F. Brown fat biology and thermogenesis. Front Biosci (Landmark Ed) 2011;16:1233–60. doi: 10.2741/3786. [DOI] [PubMed] [Google Scholar]
- 36.Einstein FH, Atzmon G, Yang XM, Ma XH, Rincon M, Rudin E, et al. Differential responses of visceral and subcutaneous fat depots to nutrients. Diabetes. 2005;54:672–8. doi: 10.2337/diabetes.54.3.672. [DOI] [PubMed] [Google Scholar]
- 37.Lee MJ, Fried SK. Integration of hormonal and nutrient signals that regulate leptin synthesis and secretion. Am J Physiol Endocrinol Metab. 2009;296:E1230–8. doi: 10.1152/ajpendo.90927.2008. [DOI] [PMC free article] [PubMed] [Google Scholar]
- 38.DeFronzo RA, Jacot E, Jequier E, Maeder E, Wahren J, Felber JP. The effect of insulin on the disposal of intravenous glucose. Results from indirect calorimetry and hepatic and femoral venous catheterization. Diabetes. 1981;30:1000–7. doi: 10.2337/diab.30.12.1000. [DOI] [PubMed] [Google Scholar]
- 39.Birkenfeld AL, Shulman GI. Non alcoholic fatty liver disease, hepatic insulin resistance and type 2 diabetes. Hepatology. 2013 doi: 10.1002/hep.26672. [DOI] [PMC free article] [PubMed] [Google Scholar]
- 40.Lebovitz HE, Banerji MA. Point: visceral adiposity is causally related to insulin resistance. Diabetes Care. 2005;28:2322–5. doi: 10.2337/diacare.28.9.2322. [DOI] [PubMed] [Google Scholar]
- 41.Miles JM, Jensen MD. Counterpoint: visceral adiposity is not causally related to insulin resistance. Diabetes Care. 2005;28:2326–8. doi: 10.2337/diacare.28.9.2326. [DOI] [PubMed] [Google Scholar]
- 42.Arble DM, Ramsey KM, Bass J, Turek FW. Circadian disruption and metabolic disease: findings from animal models. Best Pract Res Clin Endocrinol Metab. 2010;24:785–800. doi: 10.1016/j.beem.2010.08.003. [DOI] [PMC free article] [PubMed] [Google Scholar]
- 43.Arble DM, Bass J, Laposky AD, Vitaterna MH, Turek FW. Circadian timing of food intake contributes to weight gain. Obesity (Silver Spring) 2009;17:2100–2. doi: 10.1038/oby.2009.264. [DOI] [PMC free article] [PubMed] [Google Scholar]