

Abstract
OBJECTIVES
Immunogenic gluten proteins implicated in celiac disease (CD) largely resist degradation by human digestive enzymes. Here we pursued the isolation of gluten-degrading organisms from human feces, aiming at bacteria that would digest gluten under acidic conditions, as prevails in the stomach.
METHODS
Bacteria with gluten-degrading activities were isolated using selective gluten agar plates at pH 4.0 and 7.0. Proteins in concentrated bacterial cell sonicates were separated by diethylaminoethanol chromatography. Enzyme activity was monitored with chromogenic substrates and gliadin zymography. Elimination of major immunogenic gluten epitopes was studied with R5 and G12 enzyme-linked immunosorbent assays.
RESULTS
Gliadin-degrading enzyme activities were observed for 43 fecal isolates, displaying activities in the ~150–200 and <50 kDa regions. The active strains were identified as Pseudomonas aeruginosa. Gliadin degradation in gel was observed from pH 2.0 to 7.0. Liquid chromatography–electrospray ionization–tandem mass spectrometry analysis identified the enzyme as pseudolysin (lasB), a metalloprotease belonging to the thermolysin (M4) family proteases. Its electrophoretic mobility in SDS–polyacrylamide gel electrophoresis and gliadin zymogram gels was similar to that of a commercial lasB preparation, with tendency of oligomerization. Pseudolysin eliminated epitopes recognized by the R5 antibody, while those detected by the G12 antibody remained intact, despite destruction of the nearby major T-cell epitope QPQLPY.
CONCLUSIONS
Pseudolysin was identified as an enzyme cleaving gluten effectively at extremely low as well as near-neutral pH values. The potential to degrade gluten during gastric transport opens possibilities for its application as a novel therapeutic agent for the treatment of CD.
INTRODUCTION
Celiac disease (CD) is an inflammatory disorder that manifests itself in the small intestine in genetically predisposed individuals expressing HLA-DQ2 and/or HLA-DQ8 (1). CD is distinct from other inflammatory disorders of the intestine, as the trigger of the inflammation is known, i.e., the storage proteins contained in wheat, rye, and barley. When presented on HLA-DQ2/DQ8, they elicit an adaptive immune response leading to T-helper (Th)-1-mediated intestinal inflammation, tissue remodeling, and ultimately duodenal villous atrophy and crypt hyperplasia, a reaction that is potentiated by the autoantigen tissue transglutaminase (2–5). Ever since gluten were discovered as the causative agent (6,7), the disease has become manageable for celiac patients by virtue of adherence to a gluten-free diet, although inadvertent gluten ingestion remains common. The prevalence of CD is high—ranging between 0.5% and 2.5% in most western and developing countries (8,9). Notably, CD is defined as the most common genetically determined inflammatory disorder of the gastrointestinal system.
The fact that gluten proteins are the known triggers opens up opportunities for targeted therapeutic interventions. Efforts have been geared toward the genetic manipulation of wheat cultivars to knockout immunogenic gluten sequences (10), which is complicated by the existence of numerous such epitopes in each variant of modern hexaploid wheat (11,12). More viable approaches to abolish immunogenic domains focus on exogenous proteases that can more thoroughly degrade the incompletely digested gluten proteins (13–15).
Immunogenic gluten domains are highly enriched in proline and glutamine residues. As trypsin requires Arg or Lys at P1, chymotrypsin prefers Phe, Tyr, and Trp at P1 and pepsin prefers Phe, Tyr, Thp, or Leu at P1 or P1’, the major enzymes of the human gastrointestinal tract are not very effective in digesting gluten. Enzymes with appreciable activities toward gluten are prolyl endopeptidases from bacteria (noticeably Myxococcus xanthus, Sphyngomonas capsulata and Flavobacterium meningosepticum) (16), from fungi (Aspergillus niger) (17,18), and a glutamine endoprotease called EP-B2 from germinating barley (19). In addition, genetically engineered proteases based on kumamolisin produced by Alicyclobacillus sendaiensis have been developed and explored with the intention to cleave gluten (20).
Our recent efforts have identified natural resident bacteria with gluten-degrading properties. These were associated with the oral cavity, representing the most proximal part of the human digestive tract (21). The presence of gluten-degrading microbes in the proximal digestive tract would be meaningful from an evolutionary perspective to complement mammalian enzyme systems to digest gluten effectively. Thus, we found seven oral microbial species that cleave immunogenic gluten and/or gluten-derived substrates with activities at neutral or near-neutral pH (22,23).
Identification of an enzyme with activity at low pH is highly desired from a therapeutic perspective, as it would enable gluten digestion during gastric passage, before immunogenic epitopes reach the duodenum, where immune destruction begins. Such activities are of particular interest if they are associated with natural colonizers of the gastrointestinal tract. Here we report on the isolation and identification of a gluten-degrading microbial species from human feces and the isolation and characterization of its aciduric protease.
METHODS
Fecal sample collection and bacterial culture
Fecal samples were collected from three healthy adults using the Easy Sampler Stool Collection Kit (Alpco Diagnostics, Salem, NH) and a sterile BBL CultureSwab (Becton Dickinson, Franklin Lakes, NJ) in 1 ml phosphate-buffered saline. Tenfold serial dilutions were plated on gluten agar (GA), which was prepared as described (24), with the modification that the pH of the GA before sterilization was adjusted to either pH 4.0 or left unadjusted (pH 7.0). Plates were incubated at 37 °C under aerobic conditions or in an anaerobic jar with a Gaspak pouch (Becton Dickinson). After incubation for 24–72 h, individual colonies were subcultured onto Brucella agar containing hemin and vitamin K (Hardy Diagnostics, Santa Maria, CA), re-cultured on GA, and cells were collected and stored in a mixture of 20% glycerol/80% brain heart infusion (BHI) (Beckton Dickinson) at −80 °C. Strains were named FA (fecal aerobic) or FAN (fecal anaerobic) followed by an ID number.
Gliadin degradation in gel
Zymogram gels (6% or 8%) containing gliadin from wheat (Sigma, St Louis, MO) as the incorporated substrate were prepared as previously described (23,24). Bacterial cell suspensions, diethylaminoethanol (DEAE) fraction F4, or purified pseudolysin (Elastin Products Company, Owensville, MO), isolated by a published method (25), were tested for activity. Electrophoresis was carried out at 100 V at 4 °C. Gels were renatured and developed in Novex buffers at pH 7.0 (InVitrogen, Carlsbad, CA) as described (21,23). For some gels, the renaturing and developing buffers were adjusted to pH 4.0, 3.0, and 2.0, with HCl. For other gels, 5 mm EDTA was added to both buffers at pH 7.0. After 48 h of development at 37 °C, gels were stained with 0.1% Coomassie blue in 40% (v/v) methanol and 10% (v/v) acetic acid, and destained.
Gliadin degradation in solution
Mixed gliadins (final concentration 250 μg/ml) were incubated with bacterial cells (final OD620 of 1.2) suspended in 25 mm potassium phosphate buffer (PPB) at pH 2.0, 4.0, and 7.0, or with DEAE fraction F4 (final concentration 17.5 μg/ml) in 50 mm potassium phosphate buffer at pH 2.0, 3.0, 4.0, and 7.0. Gliadin degradation was assessed in samples incubated for 0, 2, and 5 h, by 4–12% SDS–polyacrylamide gel electrophoresis (SDS–PAGE) as described (22).
Preparation of bacterial extract
Strain FA-10 was cultured for 16 h in 2 l of BHI, cells were collected, and resuspended in 50 mm Tris-HCl, pH 8.0 (OD620 22). The cell suspension was frozen at −20 °C, thawed, and then sonicated while placed on ice, using a Branson sonifier 450 (VWR Scientific, Bridgeport, NJ) with a macro tip and output control set at 7. Sonication was performed in cycles of 2 min in 4-min time intervals. Cell lysis was monitored spectrophotometrically until the OD620 had decreased by 70% (typically after 15 sonication cycles). The homogenate supernatant containing the cell extract was used for enzyme purification.
DEAE anion-exchange chromatography
A 10-ml aliquot of homogenate supernatant in 50 mm Tris-HCl, pH 8.0 (buffer A), containing 64 mg proteins was loaded on a DEAE sepharose fast-flow column containing the exchange group diethylaminoethyl [-O-CH2CH2N+H(C2H3C2H3)2] (GE Healthcare, Björkgatan, Sweden). The column size was 2.6 cm×34 cm with a column volume (CV) of 180 ml. The chromatographic separation of proteins was achieved using an FPLC system (AKTApurifier 10, GE Healthcare, Piscataway, NJ) at a flow rate of 1 ml/min. Proteins were eluted with buffer B containing 50 mm Tris-HCl, 1 M NaCl (pH 8.0), using two gradient methods: (1) 0% buffer B for 1 CV, 0%–30% buffer B in 5 CV, 30%–100% buffer B in 0.5 CV, followed by 100% buffer B for 1.5 CV and (2) 0%, 8%, 30%, and 100% buffer B for 1.5 CV each. The absorbance was monitored at 219 nm and the eluate was collected in 10-ml fractions. The active fractions were pooled, concentrated, and desalted using Amicon Ultra-15 Centrifugal Filter Units (EMD Millipore, Billerica, MA). The protein concentration was determined using the BCA method (Pierce Biotechnology, Rockford, IL) with bovine serum albumin as the standard.
SDS–polyacrylamide gel electrophoresis
SDS–PAGE was performed in a discontinuous gel system under reducing conditions on a pre-cast NuPAGE 4%–12% and 12% Bis-Tris Mini Gel, 1.5 mm×10 well (Invitrogen, Novex by Life Technologies, Carlsbad, CA). Electrophoresis was carried out at a constant voltage (120 V). Gels were silver stained as described previously (26).
Degradation of the 33-mer peptide
A synthetic highly immunogenic 33-mer peptide comprising residues 57–89 of α2-gliadin (LQLQPFPQPQLPYPQPQLPYPQ PQLPYPQPQPF) was synthesized at 95% purity (21st Century Biochemicals, Marlboro, MA) and dissolved in deionized water to 10 mg/ml. The peptide was added to a final concentration of 250 μg/ml to DEAE fraction F4 containing 17.5 μg/ml protein. After incubation, 100 μl sample aliquots were removed, heat inactivated, mixed with 900 μl 0.1% (v/v) trifluoroacetic acid, and analyzed by reversed-phase high performance liquid chromatography (HPLC).
Reversed-phase HPLC
Reversed-phase HPLC was carried out as described (21,23), using an HPLC Model 715 (Gilson, Middleton, WI) and a C-18 (TSK-GEL 5 μm, ODS-120T column, 4.6×250 mm, Tosoh Bioscience LLC, King of Prussia, PA). Peptides were eluted using a linear gradient from 0% to 55% buffer B containing 80% (v/v) acetonitrile and 0.1% (v/v) trifluoroacetic acid over a 75-min time interval at a flow rate of 1.0 ml/min. Degradation of the 33-mer was determined from the peak height, which was expressed in mVolt and quantitated using UniPoint 3.3 version software (Gilson).
Native PAGE and casein zymography
Aliquots of DEAE fraction F4 were subjected to native PAGE (6%). The composition of this gel is identical to a 6% gliadin zymogram gel (23), but without the added gliadin. One half of the gel was silver stained as described above and the other half was developed as a zymogram gel to reveal enzyme activity. For the latter, the gel was washed twice for 30 min in renaturing buffer containing 2.5% Triton X-100 and twice for 30 min in developing buffer containing 20 mm Tris-HCl (pH 7.5). Next, the gel was transferred to developing buffer containing 1% casein for 1 h at 37 °C, stained with 0.1% (w/v) Coomassie Brilliant Blue in 40% (v/v) methanol/10% (v/v) acetic acid for 24 h, and destained in the same solution without dye.
Liquid chromatography–electrospray ionization–tandem mass spectrometry
The 6% gels that was either silver stained or casein incubated were aligned and bands with activity and matching electrophoretic mobilities in the two gel halves were excised for liquid chromatography–electrospray ionization–tandem mass spectrometry (LC–ESI–MS/MS). Proteins were in-gel digested with sequencing-grade trypsin (Promega, Madison, WI) (27). Peptide extracts were dried and reconstituted in 5–10 μl of HPLC solvent A (2.5% acetonitrile and 0.1% formic acid). A nanoscale reversed-phase-HPLC capillary column contained 5 μm C18 spherical silica beads in a fused silica capillary of 100 μm inner diameter ×~12 cm length (28). Peptides were eluted with increasing concentrations of solvent B (97.5% acetonitrile and 0.1% formic acid). Eluting peptides were subjected to ESI and then entered into an LTQ Orbitrap mass spectrometer (ThermoFinnigan, San Jose, CA). Eluting peptides were detected, isolated, and fragmented to produce a tandem mass spectrum of specific fragment ions for each peptide. Proteins were identified by matching protein or translated nucleotide databases of P. aeruginosa NCGM2.S1, with the acquired peptide fragmentation pattern using the software program Sequest (ThermoFinnigan).
FRET substrate hydrolysis
A fluorescence resonance energy transfer (FRET) substrate was used to test the cleavage activity of lasB toward QPQLPY. In this experiment, a highly pure lasB preparation was used that was isolated in our laboratory using established methods (25,29). The synthetic peptide substrate 488-QPQLPY-K(QXL520) (Anaspec, Fremont, CA) was incubated at a final concentration of 100 μm with lasB enzyme at a final concentration of 0.65 μg/ml in 50 mm Tris-HCl (pH 8.0) supplemented with 2.5 mm CaCl2. Samples were incubated at 37 °C and fluorescence was measured every 5 min for 1 h at λex 485 nm and λem 520 nm, using a Genios microtiter plate reader in the kinetic mode.
R5 and G12 ELISA assays
Sandwich enzyme-linked immunosorbent assays (ELISAs) were carried out employing the R5 monoclonal antibody (RIDA-SCREEN Gliadin, R-Biopharm, Darmstadt, Germany) and G12 monoclonal antibody (AgraQuant ELISA Gluten G12, Romer Labs, Union, MO). The R5 and G12 ELISA assays have detection limits of 3 and 2 ppm for gluten, respectively. Experiments were performed according to the manufacturer’s instructions.
For the R5 ELISA, samples were diluted 1:1,000-fold with dilution buffer. Aliquots of 100 μl were added to the R5-coated microtiter plate. The plates were incubated for 30 min at room temperature, washed, and incubated with 100 μl of peroxidase-conjugated secondary antibody for 30 min at room temperature. After washing, substrate solution containing tetramethylbenzidine was added, followed by the addition of 100 μl stop reagent. After 30 min, the absorbance was measured at 450 nm. For the G12 ELISA, samples were diluted 1:300-fold in dilution buffer and 100 μl aliquots were added to the G12-coated microtiter plate. After incubation for 20 min, plates were washed, 100 μl of the conjugate was added for 20 min, followed by substrate solution for 20 min, addition of 100 μl stop solution, and measurement of the absorbance at 450 nm.
RESULTS
Fecal bacteria isolation on GA
Fecal samples were collected from three healthy human subjects, diluted, and plated on GA at pH 4.0 and 7.0. A total of 278 strains were obtained: 138 from subject 1, 61 from subject 2, and 79 from subject 3. Of these, 127 were cultured under aerobic and 151 under anaerobic conditions; 93 were obtained on GA plates at pH 4.0 and 185 from GA plates at pH 7.0.
Gliadin degradation in gel
The 278 strains were evaluated for enzyme activities by gliadin zymography developed at pH 7.0. Initially, we focused on strains that demonstrated a clear zone around the colonies when cultured on GA (Supplementary Figure S1A–C online). However, gliadin zymography results of those (mostly anaerobic) strains showed that none could cleave gliadins in gel (Supplementary Figure S1D). All 287 strains were thus analyzed by gliadin zymography, and 43 did produce an active enzyme band in the ~150–250 kDa region and/or in the low-molecular-weight region (<50 kDa). A selection of active and non-active strains are shown in Supplementary Figure S2.
Gliadin degradation in solution at acidic pH
Strains FA-10 and FA-13, obtained on acidic GA agar, were further evaluated for gliadin degradation in solution at pH 7.0, 4.0, and 2.0. Cell-associated proteases of both strains effectively cleaved gliadins at pH 7.0 and 4.0, but not at pH 2.0, during the 5 h time span examined (Figure 1).
Figure 1.

Gliadin degradation in solution by strains FA-10 and FA-13. Strains FA-10 and FA-13 were collected from Brucella agar, and suspended to an OD620 1.2 in 25 mM PPB at pH 2.0, 4.0, and 7.0. Mixed gliadins were added to a final gliadin concentration of 250 μg/ml. After t=0, 2, and 5 h incubation at 37 °C, aliquots of 100 μl were removed, heat-in-activated, and analyzed by SDS–PAGE. Lane 1: MW standard (5 μl); lanes 2–4: bacteria+gliadin mixtures incubated for t=0, 2, and 5 h; lanes 5–7: bacteria only t=0, 2, and 5 h; lanes 8–10: gliadins only t=0, 2, and 5 h. Left panels (a, c, and e): strain FA-10; right panels (b, d, and f): strain FA-13.
Strain identification
Twenty-two of the 43 active strains, including strains FA-10 and FA-13, were speciated by 16S rDNA analysis (SeqWright, Houston, TX). The 22 strains all produced enzyme bands in the ~150–250 kDaand/orlowmolecularweight(MW)regionsasshown in Supplementary Figure S2. The 16S rDNA regions sequenced varied in length from 470 to 496 bp and showed a 99.5%–99.9% match with the identified taxa. Despite differences in apparent MW of the enzymes, all 22 strains were speciated as P. aeruginosa. Further validation of the correct identification of the strains was derived from GA plate coloration, showing vivid blue, green, red, and brown colors consistent with pyocyanin, pyoverdin, pyorubin, and pyomelanin pigments, respectively, produced by P. aeruginosa (Supplementary Figure S3).
Semi-purification of the gluten-degrading protease
Proteins in the cell sonicate supernatant of P. aeruginosa strain FA-10 were separated by DEAE anion-exchange chromatography and eluted using a linear gradient (Figure 2a) or a step gradient (Figure 2b) of increasing NaCl concentration. Fractions of 10 ml each were pooled based on the peak patterns obtained. Aliquots of each of the pooled fractions were analyzed by SDS–PAGE, to assess protein composition. Fractions were also assayed for enzyme activity by casein zymography, which showed a very good consistency in activity pattern with gliadin zymography (data not shown). Activities could not be monitored with paranitroanilide-derivatized substrates used previously (22), as these were not or very slowly hydrolyzed by the P. aeruginosa enzyme(s). As a result, enzyme-activity monitoring was qualitative and not quantitative. The SDS–PAGE results of proteins eluted with the linear gradient is shown in Supplementary Figure S3 and the result for the step gradient is shown in Figure 3. With either gradient method, the active fractions eluted just after the first main peak, with most activity detected in fractions 3–6. DEAE fraction 4 (F4) was selected for further enzyme characterization and identification, as it represented a center fraction with the highest activity.
Figure 2.
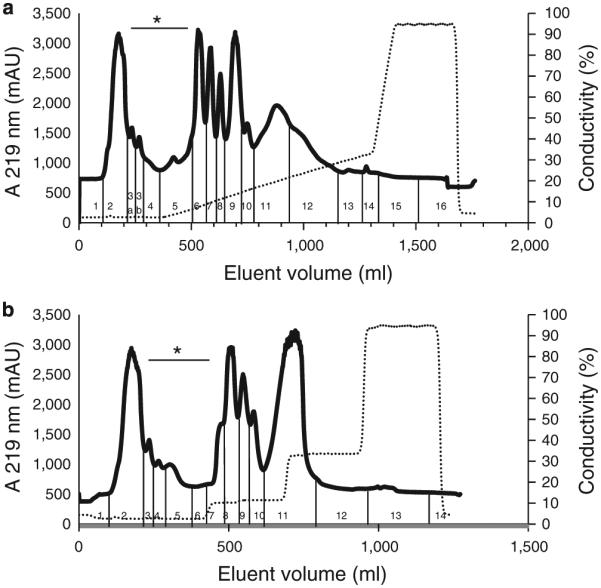
Diethylaminoethanol (DEAE) chromatography of proteins contained in P. aeruginosa cell extract. P. aeruginosa cells were suspended in 50 mM Tris-HCl, pH 8.0, to an OD620 of 22. A 160 ml aliquot was sonicated and centrifuged. An aliquot of the supernatant containing 64 mg protein in 10 ml was loaded onto a DEAE (2.6×34 cm) column. Proteins were eluted with buffer B containing 50 mM Tris-HCl, 1 M NaCl, pH 8.0, and using either (a) linear gradient or (b) a multi-step gradient. The flow rate was 1 ml/min. Fractions of 10 ml each were collected, which were pooled according to the peak patterns obtained as indicated. The traces shown for the linear gradient are representative of two experiments and for the step gradient of 14 experiments. Fractions indicated with an asterisks exhibited anti-gliadin enzyme activity.
Figure 3.

SDS–PAGE and casein zymography of P. aeruginosa proteins separated by DEAE (step gradient). (a) SDS–PAGE (4–12%) of 200 μl aliquots of the fractions shown in Figure 1b. (b) Casein zymogram gel (6%) of 200 μl aliquots of the fractions shown in Figure 1b. The SDS gel was silver stained and the zymogram gel was stained with Coomassie Brilliant Blue. Fractions indicated with an asterisk contained the enzyme. C, aliquot of the whole P. aeruginosa cell sonicate (pre-DEAE) (5 μl); M, MW standard.
Gliadin degradation by DEAE fraction F4 at acidic pH
Gliadin degradation experiments were carried out with DEAE fraction F4 as in Figure 1, but adding an additional evaluation time point (t=24 h) and pH value (3.0). Results confirmed enzyme activity in F4 at pH 7.0 and 4.0. Degradation was already observed in the t=0 (~1 min incubation) samples. Activity at pH 3.0 or 2.0 could not be observed in this assay over the 24 time period examined (Figure 4).
Figure 4.

Gliadin degradation in solution by the P. aeruginosa enzyme in DEAE fraction F4. Mixed gliadins (G) and fraction F4 were mixed to final concentrations of 250 and 17.5 μg/ml, respectively, in PPB at pH 7.0 (a), 4.0 (b), 3.0 (c), and 2.0 (d). The mixture was incubated in a 37 °C water bath, and at t=0, 2, 5, and 24 h, aliquots of 100 μl were removed, heat-inactivated, and analyzed for gliadin degradation by SDS–PAGE (left four lanes). Control gliadins were incubated without enzyme (right four lanes). (e) Gliadin zymography of the P. aeruginosa enzyme in F4 at different pH. Aliquots of F4 containing 0.04 μg/lane were loaded in duplicate along with MW standards (M) in two gliadin zymogram gels (6%). After electrophoresis, each gel was divided in two, and the four gel pieces were then each renatured and developed in buffers adjusted to pH 7.0, 4.0, 3.0, and 2.0, followed by staining with Coomassie Brilliant Blue.
Gliadin degradation was also assessed in gel by gliadin zymography (Figure 4e). Aliquots of F4 were loaded onto the gel in duplicate and gels were developed at pH 7.0, 4.0, 3.0, and 2.0. Initially, 4 μg aliquots were analyzed per lane. The resultant gel developed at pH 7.0 was entirely clear, suggesting that all incorporated gliadin had degraded due to excessive enzymatic activity (not shown). Only when substantially lower amounts of F4 were loaded (0.04 μg per lane), a band could be discerned. Enzyme activity in gel was noted at pH 4.0 and also at pH 3.0 and 2.0 (Figure 4e). The results indicated that DEAE fraction F4 contains an aciduric enzyme with a very-high specific activity.
33-mer degradation at acidic pH
The isolated enzyme in F4 was also evaluated for activity toward a highly immunogenic 33-mer peptide derived from α-gliadin. The peptide was stable in the absence of fraction F4 (Figure 5a,b) for up to 24 h but degraded over time in the presence of F4 (Figure 5c,d), as evidenced by a reduction in peak height and appearance of degradation fragments. The 33-mer peak heights in chromatograms a–d were plotted in e and f. The 33-mer was effectively degraded at pH 7.0 and 4.0, but not at pH 3.0 and 2.0 (data not shown).
Figure 5.

Kinetics of 33-mer degradation by the enzyme in F4. Synthetic gliadin-derived 33-mer peptide and F4 fraction were mixed to final concentrations of 250 and 17.5 μg/ml, respectively, in PPB at pH 7.0 and 4.0. After t=0, 2, 5, and 24 h incubation, aliquots of 100 μl were removed, heat-inactivated, and analyzed for degradation by reversed-phase high performance liquid chromatography. Shown is the part of the chromatogram containing the 33-mer (indicated with arrow) and degradation peaks. (a and b) 33-mer peptide incubated without F4 at pH 7.0 and 4.0, respectively (controls); (c and d) 33-mer peptide incubated with F4 at pH 7.0 and 4.0, respectively. Arrows point to the 33-mer peak height; (e and f) plot of 33-mer peak height over time in PPB at pH 7.0 and 4.0, respectively.
Native PAGE to visualize protein content and enzyme activity
We next determined which of the few proteins in fraction F4 represented the enzyme. An experiment was designed by which protein content and enzyme activities could be directly compared. A 6% SDS gel was prepared to separate proteins in fraction F4. After electrophoresis, the gel was divided in two and one half was silver stained (Figure 6a) while the other half was developed as a zymogram with casein as the substrate (Figure 6b). Both gels were aligned and four protein bands with enzyme activity ~200 kDa were excised from both the silver-stained and zymogram gel for mass spectrometric analysis, as indicated in Figure 6c,d.
Figure 6.

Native PAGE of fraction F4 and excision of bands for LC–ESI–MS/MS. (a) Native PAGE (6%) silver stained; (b) native PAGE (6%) followed by renaturing and developing in the presense of casein and Coomassie Blue staining, to visualize bands with enzyme activity. Lanes 1–4, purified enzyme sample F4 at 1.8, 8.8, 18, and 35 μg, respectively. (c and d) The same gels indicating the bands that were excised for compositional analysis by LC–ESI–MS/MS.
Protease identification in F4
Proteins contained in the excised gel bands were in-gel digested and analyzed by LC–ESI–MS/MS. Table 1 shows the proteins identified by multiple peptides in excised gel bands 1–4. The two most prominent proteins identified by numerous (>9) peptides were an elastase (lasB) and a nitrate reductase (nirS). Only the former represents a proteolytic enzyme. The elastase, also called “pseudolysin” has a molecular weight of 53 kDa in the preproenzyme form and of 33 kDa in the mature enzyme form (25,29). Although the MW of mature lasB did not match the ~200 kDa band in which it was identified, protein complex formation cannot be excluded in native PAGE. The 33 kDa of the mature enzyme did match the <50 kDa band observed in the gliadin zymogram for some P. aeruginosa strains (Supplementary Figure S2). Noticeably, we found that the <50 kDa band could not always be detected in repeat analyses of the same strain, in contrast to the higher MW bands, suggestive of complex formation by pseudolysin.
Table 1.
Proteins identified in excised gel bands
| UniProt/TrEMBL | Gene symbol | Description | MW (Da) | # Unique peptides (% coverage) |
|||
|---|---|---|---|---|---|---|---|
| Band 1 | Band 2 | Band 3 | Band 4 | ||||
| G4LSY0_PSEAI | lasB | Elastase | 53,567.42 | 9 (20.3) | 17 (26.5) | 10 (17.9) | 16 (22.9) |
| G4LG18_PSEAI | nirS | Nitrite reductase | 62,630.15 | 10 (14.4) | 11 (18.8) | 9 (20.9) | 16 (34.5) |
| G4LFZ8_PSEAI | NCGM2_5657 | Uncharacterized protein | 22,166.62 | 0 | 5 (31.2) | 3 (20.3) | 2 (11.9) |
| G4LQK0_PSEAI | NCGM2_1915 | Uncharacterized protein | 15,639.22 | 2 (23.4) | 2 (23.4) | 3 (29.2) | 2 (23.4) |
| G4LKH5_PSEAI | NCGM2_1105 | ABC transporter binding protein | 60,087.33 | 0 | 2 (5.6) | 3 (7.6) | 3 (8.6) |
Confirmation of the identification of pseudolysin
Pseudolysin is a zinc metalloprotease. To confirm metal ion dependence for activity, F4 was analyzed on a gliadin zymogram which was renatured and developed in the absence and the presence of EDTA (Supplementary Figure S5). The results clearly demonstrated complete loss of activity when metal ions were complexed by EDTA. We compared the composition and activity of F4 with a commercially obtained pseudolysin (lasB) preparation. Figure 7 shows that the major band in this preparation is around 33 kDa and matches the major protein in the F4 preparation. Furthermore, as for F4 the activity of the commercially obtained enzyme was observed in the higher MW regions of the gel, further lending support to the correct identification of lasB in the F4 sample and suggesting oligomerization. Subsequently, we isolated the lasB enzyme from P. aeruginosa strain FA-10 culture supernatant as described (25). A single band with a molecular weight of ~33 kDa was observed and the identity of the protein was confirmed with LC–ESI–MS/MS (Supplementary Figure S6).
Figure 7.
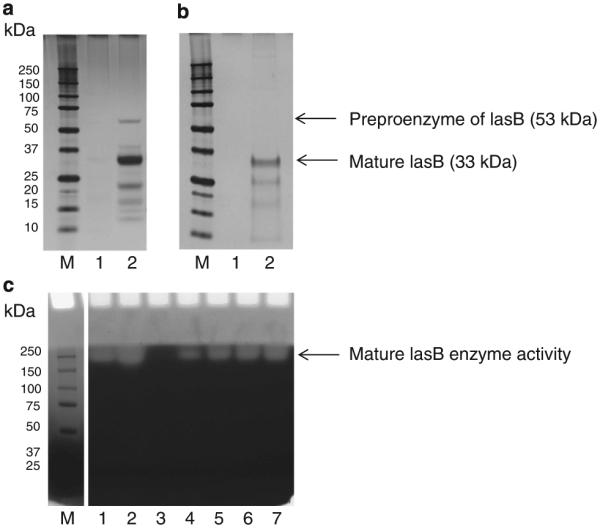
Comparison of P. aeruginosa pseudolysin (lasB) in the F4 isolation prep and commercially obtained lasB. (a and b) SDS–PAGE (4%–12%), silver stained; C, gliadin zymogram (8%); M, MW standard. (a) Lane 1: empty, lane 2: F4 (4 μg); (b) lane 1: empty, lane 2: commercially obtained lasB (20 μg); (c) lanes 1–2: F4 (0.04 and 0.08 μg, respectively), lane 3: empty; lanes 4–7: commercially obtained lasB (0.5, 1, 1.5, and 2 μg, respectively).
Elimination of immunogenic gliadin epitopes
To finally determine whether pseudolysin was able to destroy immunogenic epitopes in gliadins, we designed a fluorescent FRET substrate comprising the sequence QPQLPY contained as the central immunogenic epitope in the 33-mer peptide, and employed two ELISA kits with monoclonal antibodies R5 and G12 recognizing QQPFP(30) and QPQLPY (31,32), respectively. Gliadin degradation by pseudolysin was confirmed (Figure 8a). Incubation reduced the binding by the R5 antibody over time (Figure 8c). On the other hand, G12 epitopes were not abolished by pseudolysin treatment (Figure 8d). In contrast, the major epitope recognized by the G12 antibody, QPQLPY, was efficiently hydrolyzed by pseudolysin (Figure 8b).
Figure 8.

Epitope neutralization by lasB. Mixed gliadins (250 μg/ml) were incubated with 2.5 μg/ml lasB isolated in our laboratory. The mixture was incubated for 0, 0.5, and 2 h in 50 mM Tris-HCl (pH 8.0) buffer supplemented with 2.5 mM CaCl . Aliquotes were analyzed by SDS–PAGE (a) and the same aliquots were tested for epitope survival in R5 and G12 ELISA assays (c and d). In b, the hydrolysis of the FRET substrate QPQLPY (pep) (final 100 μM) by lasB (0.65 μg/ml) is shown. After 20 min incubation, the fluorescence had reached the maximum value that could still be read experimentally, indicating rapid substrate hydrolysis.
DISCUSSION
The objectives of this study were to isolate and identify gluten-degrading microorganisms from human feces that are active under acidic conditions and to isolate the aciduric gluten-degrading enzyme. A total of 43 strains degraded gluten in gel, all belonging to one species, P. aeruginosa. The gluten-degrading enzyme that was isolated represented pseudolysin, or lasB. The P. aeruginosa enzyme was active in gel at pH 2.0, which, to our knowledge, is the lowest pH for gluten-degrading activity currently reported.
P. aeruginosa is a member of the proteobacteria representing <10% of the gut colonizers, of which 90% comprises Bacteroidetes and Firmicutes species (33). Pseudomonas is effective in forming a biofilm and is an opportunistic pathogen in immunocompromised patients. Together with Escherichia coli and Klebsiella pneumonia, it is the most frequently observed infectious agent in cases of Gram-negative bacteremia (34). When it colonizes the gut, it resides in the small and large intestine. Levels in healthy individuals are typically low (4%) and can increased to >20% in patients with various gastrointestinal diseases (35). Antibiotics that are ineffective against P. aeruginosa have been shown to significantly increase the risk of colonization with this species in intensive care units (36). In our studies P. aeruginosa was isolated from one of the three donors, who had no history of gastrointestinal disease or antibiotics use in the last 24 months.
The gluten-degrading aciduric enzyme pseudolysin, or lasB, from P. aeruginosa identified by LC–ESI–MS/MS belongs to the family of thermolysin metalloproteases (M4). Pseudolysin complexes with zinc in the active center and requires calcium for protease stability (37). The prepro- and the mature enzyme have MW values of 53 and 33 kDa, and comprise 498 and 301 amino acids, respectively. It should be pointed out that the source of the enzyme in the first part of our studies was the extract of a cell sonicate, not the culture media, explaining detection of a significant proportion of the preproenzyme apart from the mature form (Figure 7). The presence of lasB in the ~53 kDa band was confirmed by LC–ESI–MS/MS (data not shown). Activities reported here toward, e.g., the immunogenic 33-mer α-gliadin peptide and total gliadins in solution may be an underestimation of the actual activities, as no calcium ions were added to the buffers, which are needed for its stability. However, the gliadin zymogram development buffer does contain calcium, which may explain the high gliadin-degradative activities observed in gel. As calcium is naturally present in saliva, and thus in the chyme, it can be expected to promote enzymatic activity of pseudolysin in vivo.
In bacterial physiology the secreted extracellular metalloenzymes play a role in the degradation of complex protein substrates into peptides to support bacterial cell growth. In thermolysin-like metalloproteases, two histidines (H337 and H341) and a glutamic acid residue (E361) surround a zinc ion in the active site (highlighted in grey in Supplementary Figure S7). The active site residues are E338 and H420. The X-ray crystallography structure of the pseudolysin enzyme obtained at 1.5 Å(37) is shown in Supplementary Figure S7. Phosphoramidon and Zincov are specific inhibitors of the thermolysins, and these enzymes are also inhibited by EDTA, consistent with our findings.
It will be of interest to predict and determine the cleavage specificities of lasB for a broader range of immunogenic gluten epitopes. The theoretical cleavage specificities of the enzyme, based on 70 cleavages, are shown in Supplementary Figure S8. The enzyme prefers a glycine residue in the P1 position and a leucine in the P1’ position. Second, the enzyme prefers an alanine in the P1 position and a phenylalanine in the P1’ position. To predict in silico specificity of lasB for a range of primary immunogenic epitopes of gluten (38), the leucine (L, red) and phenylalanines (F, purple), as well as the glycine residues (G, blue) and alanine residues (A, orange) were highlighted (Supplementary Table 1). We demonstrated experimentally that the enzyme can cleave the 33-mer peptide, containing multiple of such immunogenic epitopes in its sequence. This was further confirmed using a FRET substrate containing QPQLPY, a key immunogenic epitope occurring 3× in the sequence of the α-gliadin 33-mer. Although sensitivity of the other epitopes to hydrolysis by pseudolysin has to be confirmed, only four epitopes of the ones listed in Supplementary Table 1, glia-a3, glia-g3, hor-3, and glia-g1b, are devoid of residues preferred by pseudolysin in the P1 or P1’ position. Actual abilities of the enzyme to cleave the listed epitopes could be investigated, e.g., with additional FRET enzyme substrates derivatized at the N and C terminus with quenching groups.
For the applicability of pseudolysin enzymes in vivo, it should be noted that these enzymes are considered virulence factors, as during infection they degrade a broad range of host tissue proteins and biomolecules, part of them involved in innate immunity such as complement factors, immunoglobulins, cytokines, and antimicrobial peptides. The pathogenic properties of the enzymes in host tissues during infection do not imply detrimental effects to the host when these enzymes would be ingested to act strictly in the digestive tract. Nevertheless, studies investigating effects of pseudolysins on host tissues during gastric and intestinal transport are warranted.
It will be necessary to further study efficient immunogenic epitope elimination by lasB. Significant reduction of the epitopes recognized by R5 was observed. With regard to epitopes detected by G12, results were discrepant in that lasB did not reduce binding by G12 (either without or with pretreatement of gliadin with pepsin and trypsin; not shown), while one of its epitopes in the form of a FRET substrate, QPQLPY, was hydrolyzed efficiently. Another substrate, PQPQPQ, not being a target for lasB, was not hydrolyzed by lasB (data not shown), indicating that the observed hydrolysis of QPQLPY was specific. It is therefore likely that apart from QPQLPY, the G12 antibody detects another sequence in gliadin that was not sufficiently degraded by lasB. Cross-reactivity with other epitopes is not unlikely and has been demonstrated for the monoclonal R5 antibody (30,39) as well as the G12 antibody (40). It remains to be established whether the other epitope(s) recognized concur with immunogenic gliadin domains. Yet overall, the lasB enzyme shows a remarkable ability to cleave and neutralize major immunogenic gluten peptides.
Enzyme therapy in CD is actively being pursued. It is already recognized that the use of combination of enzymes is the most effective way to achieve thorough gluten digestion (41). High speed and efficiency of gluten digestion is a prerequisite for any enzyme preparation to be clinically effective in CD. The furthest along on the path toward product development is the combination of enzymes comprising the bacterial prolyl endopeptidase SC-PEP and EP-B2 of germinating barley (ALV003). In a Phase 2 clinical trial, ALV003 was demonstrated to prevent mucosal deterioration on ingestion of low doses (2 g) of gluten (42). Although comparative data are not yet available for the lasB enzyme, its gluten-degrading activity seems to be exceptionally high. With the ongoing efforts in enzyme discovery and design, superior enzymes and enzyme combinations should become available. It can be envisioned that two to five enzymes from various origins could be combined, with complimentary cleavage specificities and some, such as pseudolysin, with resistance to low pH conditions.
Supplementary Material
Study Highlights.
WHAT IS CURRENT KNOWLEDGE
✔ Gluten peptides contain immunogenic epitopes that resist degradation by mammalian digestive enzymes.
✔ Luminal enzyme therapy is aimed at achieving a more complete digestion of such domains.
✔ Prolyl endopeptidases, alone or in combination with glutamyl endoproteases, are being pursued as therapeutic drugs.
WHAT IS NEW HERE
✔ A new protease was identifi ed from P. aeruginosa that can cleave gliadin immunogenic domains effectively.
✔ The enzyme is active at pH 2.0–4.0, establishing it as a novel aciduric gluten-degrading enzyme.
✔ The cleavage specifi city of the enzyme is different from the enzymes that are currently being pursued for clinical development.
✔ Its unique properties make it a promising candidate to aid in gluten digestion during gastric passage.
ACKNOWLEDGMENTS
These studies were supported by NIH/NIAID grants AI087803 (E.J.H.) and AI101067 (E.J.H.), and an appointment grant to D.S.
Guarantor of the article: Eva J. Helmerhorst, MS, PhD.
Financial support: None.
Footnotes
SUPPLEMENTARY MATERIAL is linked to the online version of the paper at http://www.nature.com/ajg
CONFLICT OF INTEREST
Potential competing interests: None.
REFERENCES
- 1.Lundin KE, Gjertsen HA, Scott H, et al. Function of DQ2 and DQ8 as HLA susceptibility molecules in celiac disease. Hum Immunol. 1994;41:24–7. doi: 10.1016/0198-8859(94)90079-5. [DOI] [PubMed] [Google Scholar]
- 2.Jabri B, Sollid LM. Mechanisms of disease: immunopathogenesis of celiac disease. Nat Clin Pract Gastroenterol Hepatol. 2006;3:516–25. doi: 10.1038/ncpgasthep0582. [DOI] [PubMed] [Google Scholar]
- 3.Green PH, Cellier C. Celiac disease. N Engl J Med. 2007;357:1731–43. doi: 10.1056/NEJMra071600. [DOI] [PubMed] [Google Scholar]
- 4.Meresse B, Malamut G, Cerf-Bensussan N. Celiac disease: an immunological jigsaw. Immunity. 2012;36:907–19. doi: 10.1016/j.immuni.2012.06.006. [DOI] [PubMed] [Google Scholar]
- 5.Schuppan D, Junker Y, Barisani D. Celiac disease: from pathogenesis to novel therapies. Gastroenterology. 2009;137:1912–33. doi: 10.1053/j.gastro.2009.09.008. [DOI] [PubMed] [Google Scholar]
- 6.Van De Kamer JH, Weijers HA, Dicke WK. Coeliac disease. IV. An investigation into the injurious constituents of wheat in connection with their action on patients with coeliac disease. Acta Paediatr. 1953;42:223–31. doi: 10.1111/j.1651-2227.1953.tb05586.x. [DOI] [PubMed] [Google Scholar]
- 7.van Berge-Henegouwen GP, Mulder CJ. Pioneer in the gluten free diet: Willem-Karel Dicke 1905-1962, over 50 years of gluten free diet. Gut. 1993;34:1473–5. doi: 10.1136/gut.34.11.1473. [DOI] [PMC free article] [PubMed] [Google Scholar]
- 8.Sapone A, Bai JC, Ciacci C, et al. Spectrum of gluten-related disorders: consensus on new nomenclature and classification. BMC Med. 2012;10:13. doi: 10.1186/1741-7015-10-13. [DOI] [PMC free article] [PubMed] [Google Scholar]
- 9.Dieterich W, Ehnis T, Bauer M, et al. Identification of tissue transglutaminase as the autoantigen of celiac disease. Nat Med. 1997;3:797–801. doi: 10.1038/nm0797-797. [DOI] [PubMed] [Google Scholar]
- 10.van den Broeck HC, van Herpen TW, Schuit C, et al. Removing celiac disease-related gluten proteins from bread wheat while retaining technological properties: a study with Chinese Spring deletion lines. BMC Plant Biol. 2009;9:41. doi: 10.1186/1471-2229-9-41. [DOI] [PMC free article] [PubMed] [Google Scholar]
- 11.Sollid LM. Coeliac disease: dissecting a complex inflammatory disorder. Nat Rev Immunol. 2002;2:647–55. doi: 10.1038/nri885. [DOI] [PubMed] [Google Scholar]
- 12.van den Broeck HC, de Jong HC, Salentijn EM, et al. Presence of celiac disease epitopes in modern and old hexaploid wheat varieties: wheat breeding may have contributed to increased prevalence of celiac disease. Theor Appl Genet. 2010;121:1527–39. doi: 10.1007/s00122-010-1408-4. [DOI] [PMC free article] [PubMed] [Google Scholar]
- 13.Shan L, Molberg O, Parrot I, et al. Structural basis for gluten intolerance in celiac sprue. Science. 2002;297:2275–9. doi: 10.1126/science.1074129. [DOI] [PubMed] [Google Scholar]
- 14.Shan L, Qiao SW, Arentz-Hansen H, et al. Identification and analysis of multivalent proteolytically resistant peptides from gluten: implications for celiac sprue. J Proteome Res. 2005;4:1732–41. doi: 10.1021/pr050173t. [DOI] [PMC free article] [PubMed] [Google Scholar]
- 15.Bethune MT, Khosla C. Oral enzyme therapy for celiac sprue. Methods Enzymol. 2012;502:241–71. doi: 10.1016/B978-0-12-416039-2.00013-6. [DOI] [PMC free article] [PubMed] [Google Scholar]
- 16.Gass J, Khosla C. Prolyl endopeptidases. Cell Mol Life Sci. 2007;64:345–55. doi: 10.1007/s00018-006-6317-y. [DOI] [PMC free article] [PubMed] [Google Scholar]
- 17.Stepniak D, Spaenij-Dekking L, Mitea C, et al. Highly efficient gluten degradation with a newly identified prolyl endoprotease: implications for celiac disease. Am J Physiol Gastrointest Liver Physiol. 2006;291:G621–9. doi: 10.1152/ajpgi.00034.2006. [DOI] [PubMed] [Google Scholar]
- 18.Tack GJ, van de Water JM, Bruins MJ, et al. Consumption of gluten with gluten-degrading enzyme by celiac patients: a pilot-study. World J Gastroenterol. 2013;19:5837–47. doi: 10.3748/wjg.v19.i35.5837. [DOI] [PMC free article] [PubMed] [Google Scholar]
- 19.Gass J, Vora H, Bethune MT, et al. Effect of barley endoprotease EP-B2 on gluten digestion in the intact rat. J Pharmacol Exp Ther. 2006;318:1178–86. doi: 10.1124/jpet.106.104315. [DOI] [PubMed] [Google Scholar]
- 20.Gordon SR, Stanley EJ, Wolf S, et al. Computational design of an alphagliadin peptidase. J Am Chem Soc. 2012;134:20513–20. doi: 10.1021/ja3094795. [DOI] [PMC free article] [PubMed] [Google Scholar]
- 21.Helmerhorst EJ, Zamakhchari M, Schuppan D, et al. Discovery of a novel and rich source of gluten-degrading microbial enzymes in the oral cavity. PLoS One. 2010;5:e13264. doi: 10.1371/journal.pone.0013264. [DOI] [PMC free article] [PubMed] [Google Scholar]
- 22.Fernandez-Feo M, Wei G, Blumenkranz G, et al. 2013;19:E386–94. doi: 10.1111/1469-0691.12249. [DOI] [PMC free article] [PubMed] [Google Scholar]
- 23.Zamakhchari M, Wei G, Dewhirst F, et al. Identification of Rothia bacteria as gluten-degrading natural colonizers of the upper gastro-intestinal tract. PLoS One. 2011;6:e24455. doi: 10.1371/journal.pone.0024455. [DOI] [PMC free article] [PubMed] [Google Scholar]
- 24.Wei G, Helmerhorst EJ. Experimental strategy to discover microbes with gluten-degrading enzyme activities. SPIE Proc. 2014;9221:91120D1–11. doi: 10.1117/12.2058730. [DOI] [PMC free article] [PubMed] [Google Scholar]
- 25.Morihara K, Tsuzuki H, Oka T, et al. Pseudomonas aeruginosa elastase. Isolation, crystallization, and preliminary characterization. J Biol Chem. 1965;240:3295–304. [PubMed] [Google Scholar]
- 26.Chevallet M, Luche S, Rabilloud T. Silver staining of proteins in polyacrylamide gels. Nat Protoc. 2006;1:1852–8. doi: 10.1038/nprot.2006.288. [DOI] [PMC free article] [PubMed] [Google Scholar]
- 27.Shevchenko A, Wilm M, Vorm O, et al. Mass spectrometric sequencing of proteins silver-stained polyacrylamide gels. Anal Chem. 1996;68:850–8. doi: 10.1021/ac950914h. [DOI] [PubMed] [Google Scholar]
- 28.Peng J, Gygi SP. Proteomics: the move to mixtures. J Mass Spectrom. 2001;36:1083–91. doi: 10.1002/jms.229. [DOI] [PubMed] [Google Scholar]
- 29.Morihara K. Production of proteinase on noncarbohydrate carbon sources by Pseudomonas aeruginosa. Appl Microbiol. 1965;13:793–7. doi: 10.1128/am.13.5.793-797.1965. [DOI] [PMC free article] [PubMed] [Google Scholar]
- 30.Osman AA, Uhlig HH, Valdes I, et al. A monoclonal antibody that recognizes a potential coeliac-toxic repetitive pentapeptide epitope in gliadins. Eur J Gastroenterol Hepatol. 2001;13:1189–93. doi: 10.1097/00042737-200110000-00011. [DOI] [PubMed] [Google Scholar]
- 31.Moron B, Bethune MT, Comino I, et al. Toward the assessment of food toxicity for celiac patients: characterization of monoclonal antibodies to a main immunogenic gluten peptide. PLoS One. 2008;3:e2294. doi: 10.1371/journal.pone.0002294. [DOI] [PMC free article] [PubMed] [Google Scholar]
- 32.Moron B, Cebolla A, Manyani H, et al. Sensitive detection of cereal fractions that are toxic to celiac disease patients by using monoclonal antibodies to a main immunogenic wheat peptide. Am J Clin Nutr. 2008;87:405–14. doi: 10.1093/ajcn/87.2.405. [DOI] [PubMed] [Google Scholar]
- 33.Turnbaugh PJ, Ley RE, Hamady M, et al. The human microbiome project. Nature. 2007;449:804–10. doi: 10.1038/nature06244. [DOI] [PMC free article] [PubMed] [Google Scholar]
- 34.Sievert DM, Ricks P, Edwards JR, et al. Antimicrobial-resistant pathogens associated with healthcare-associated infections: summary of data reported to the National Healthcare Safety Network at the Centers for Disease Control and Prevention, 2009-2010. Infect Control Hosp Epidemiol. 2013;34:1–14. doi: 10.1086/668770. [DOI] [PubMed] [Google Scholar]
- 35.Stoodley BJ, Thom BT. Observations on the intestinal carriage of Pseudomonas aeruginosa. J Med Microbiol. 1970;3:367–75. doi: 10.1099/00222615-3-3-367. [DOI] [PubMed] [Google Scholar]
- 36.Thuong M, Arvaniti K, Ruimy R, et al. Epidemiology of Pseudomonas aeruginosa and risk factors for carriage acquisition in an intensive care unit. J Hosp Infect. 2003;53:274–82. doi: 10.1053/jhin.2002.1370. [DOI] [PubMed] [Google Scholar]
- 37.Thayer MM, Flaherty KM, McKay DB. Three-dimensional structure of the elastase of Pseudomonas aeruginosa at 1.5-A resolution. J Biol Chem. 1991;266:2864–71. doi: 10.2210/pdb1ezm/pdb. [DOI] [PubMed] [Google Scholar]
- 38.Sollid LM, Qiao SW, Anderson RP, et al. Nomenclature and listing of celiac disease relevant gluten T-cell epitopes restricted by HLA-DQ molecules. Immunogenetics. 2012;64:455–60. doi: 10.1007/s00251-012-0599-z. [DOI] [PMC free article] [PubMed] [Google Scholar]
- 39.Kahlenberg F, Sanchez D, Lachmann I, et al. Monoclonal antibody R5 for detection of putatively coeliac-toxic gliadin peptides. Eur Food Res Technol. 2006;222:78–82. [Google Scholar]
- 40.Moron B, Bethune MT, Comino I, et al. Toward the assessment of food toxicity for celiac patients: characterization of monoclonal antibodies to a main immunogenic gluten peptide. PloS One. 2008;3:e2294. doi: 10.1371/journal.pone.0002294. [DOI] [PMC free article] [PubMed] [Google Scholar]
- 41.Gass J, Bethune MT, Siegel M, et al. Combination enzyme therapy for gastric digestion of dietary gluten in patients with celiac sprue. Gastroenterology. 2007;133:472–80. doi: 10.1053/j.gastro.2007.05.028. [DOI] [PubMed] [Google Scholar]
- 42.Lahdeaho ML, Kaukinen K, Laurila K, et al. Glutenase ALV003 attenuates gluten-induced mucosal injury in patients with celiac disease. Gastroenterology. 2014;146:1649–58. doi: 10.1053/j.gastro.2014.02.031. [DOI] [PubMed] [Google Scholar]
Associated Data
This section collects any data citations, data availability statements, or supplementary materials included in this article.