Abstract
Fenretinide is an anticancer drug with low water solubility and poor bioavailability. The goal of this study was to develop biodegradable polymeric nanoparticles of fenretinide with the intent of increasing its apparent aqueous solubility and intestinal permeability. Three biodegradable polymers were investigated for this purpose: two different poly lactide-co-glycolide (PLGA) polymers, one acid terminated and one ester terminated, and one poly lactide-co-glycolide/polyethylene glycol (PLGA/PEG) diblock copolymer. Nanoparticles were obtained by using an emulsification solvent evaporation technique. The formulations were characterized by differential scanning calorimetry (DSC), scanning electron microscopy (SEM), and particle size analysis. Dissolution studies and Caco-2 cell permeation studies were also carried out for all formulations. Ultra high performance liquid chromatography coupled with mass spectrometry (UPLC/MS) and ultraviolet detection was used for the quantitative determination of fenretinide. Drug loading and the type of polymer affected the nanoparticles’ physical properties, drug release rate, and cell permeability. While the acid terminated PLGA nanoparticles performed the best in drug release, the ester terminated PLGA nanoparticles performed the best in the Caco-2 cell permeability assays. The PLGA/PEG copolymer nanoparticles performed better than the formulations with ester terminated PLGA in terms of drug release but had the poorest performance in terms of cell permeation. All three categories of formulations performed better than the drug alone in both drug release and cell permeation studies.
Keywords: fenretinide, formulation, biodegradable, nanoparticles
Graphical Abstract
Introduction
Cancer is a major health concern worldwide. In the United States alone, the National Cancer Institute estimates 1,665,540 new cases of cancer and an accompanying 585,720 deaths in 2014 [1]. Correspondingly, a large number of compounds, both natural and synthetic, are screened for their ability to treat cancer. The National Institute of Health has estimated that it has screened over 80,000 compounds since 1990 [2]. The screenings have focused on compounds intended to treat specific cancers, such as lung [3], breast [4], and prostate cancer [5], and they have focused on general anti-tumor effects. While these tests reveal anti-tumor effects, in most cases they do not reveal whether the compound may be useful for treating cancer from a practical standpoint. Many of these potential therapeutic agents have low intrinsic aqueous solubility (over 40% of all new substances are considered insoluble in water) [6], have low bioavailability, or a combination of both. Therefore, the solubility of these compounds must be altered through chemical modification or through formulation. While chemical modification has been used for many years as a viable method for increasing a compound’s solubility [7], this method presents a serious regulatory problem because these compounds may not be considered equivalent to the parent compound. For compounds which have been shown to have some effectiveness in treating cancer, chemical modification will certainly require reexamination of the new compound. Drug formulation does not inherently change the chemical state of the drug and may be considered, if successful, a superior method of modifying a drug’s bioavailability. While many specific formulation approaches exist, the main modification methods used to date include modifying the local environment of the drug, reducing the drug’s particle size, and encapsulating the drug in a soluble form [6]. The encapsulation method can include emulsions, self-emulsifying systems, or encapsulation in a rigid system. The approach in this study focuses on drug encapsulation in a rigid nanoparticle system.
Nanoparticle formulations can enhance the bioavailability of poorly water soluble drugs by addressing drug dissolution and/or permeability. Tuning the physicochemical properties of nanoparticle carriers can alter the drug absorption, distribution, and elimination during gut transit [8]. Nanoparticles and microparticles can enhance the transcellular and paracellular transport of drugs in the GI tract [9,10]. Particularly, carrier chemical composition, size, and morphology have been shown to be important determining factors of nanoparticle transport across the intestine following oral administration [11]. Particle size, specifically in the nanometer range, can also improve drug dissolution for poorly water soluble drugs [12].
Poly lactide-co-glycolide (PLGA) polymers are biodegradable polymers which have been used for several years as a means of encapsulating drugs for controlled release and targeted delivery. They have low intrinsic toxicity, readily form encapsulating matrices, and degrade at a reasonable rate into harmless byproducts. PLGA and modified PLGA polymers have been used to form nanoparticles as a means of increasing the dissolution and bioavailability of poorly water soluble compounds [13,14]. In these formulations, the PLGA not only serves as a means of reducing the particle size of the drug but also controls the release rate of the drug itself and reduces its intrinsic toxicity [15,16]. In addition, these polymers can be modified to alter a formulation’s pharmacokinetic and biodistribution properties; polyethylene glycol (PEG)/PLGA copolymers can enhance the bioavailability of nanoparticles by increasing drug residence time [13]. Overall, the combination of increased dissolution of the compound, increased residence time, and reduced toxicity make a nanoparticle formulation of PLGA with the cancer drug fenretinide an attractive pharmaceutical formulation.
Fenretinide (N-4-hydroxyphenyl retinamide, 4-HPR) is a synthetic retinoid investigated for the treatment of breast cancer as early as 1979 due to is ability to accumulate in breast tissue [17]. Its investigative use has expanded beyond its initial application in breast cancer to include cancer chemoprevention [18], the treatment of macular degeneration [19], and the treatment of obesity-related type 2 diabetes [20]. However, oral administration of fenretinide has shown poor therapeutic efficacy in clinical trials. This poor performance is most often attributed to its low bioavailability [21–23]. The reformulation of fenretinide into a more readily soluble, and hence more bioavailable dosage form, is necessary to further its clinical utility. In this study, biodegradable fenretinide polymeric nanoparticles have been prepared and characterized. The release of fenretinide from the formulations and the in vitro intestinal cellular transport of fenretinide have been evaluated.
Materials and Methods
Materials
The two PLGA polymers, Resomer RG502 (ester terminated) and Resomer RG502H (acid terminated), and the PLGA/PEG copolymer (RGP d50105) were obtained from Boehringer Ingelheim (Ingelheim am Rhein, Germany). Dichloromethane, ethanol, methanol, 30,000–70,000 MW polyvinyl alcohol (PVA), bovine serum albumin (BSA), HEPES, glucose, sodium chloride, potassium chloride, calcium chloride, magnesium chloride, sodium phosphate monobasic, potassium phosphate dibasic, sodium hydroxide, hydrochloric acid, formic acid, Hanks’ Balanced Salt Solution (HBSS), and Lucifer yellow were obtained from Sigma Aldrich (St. Louis, MO). Fenretinide was purchased from R&D Systems, Inc. (Minneapolis, MN). All cell culture media were purchased from Thermo Fisher Scientific (Waltham, MA).
Preparation of Nanoparticles
Two 7,000–17,000 MW PLGA polymers, one ester terminated (Resomer RG502, R1) and one acid terminated (Resomer RG502H, R2), and one PLGA/PEG di-block copolymer (R3) were used as the polymers in the formulation of nanoparticles by an emulsification solvent evaporation technique. Nanoparticles of each of the three biodegradable polymers were prepared containing 0, 5%, 10%, and 20% fenretinide (w/w) in the formulation (Table 1).
Table 1.
Nanoparticle Formulations
| Formulation Designationa | Drug Content (%) | Fenretinide (mg) | Polymer R1 (mg)b | Polymer R2 (mg)c | Polymer R3 (mg)d |
|---|---|---|---|---|---|
| R1-B | 0 | - | 150 | - | - |
| R1-5 | 5 | 7.89 | 150 | - | - |
| R1-10 | 10 | 16.67 | 150 | - | - |
| R1-20 | 20 | 37.50 | 150 | - | - |
| R2-B | 0 | - | - | 150 | - |
| R2-5 | 5 | 7.89 | - | 150 | - |
| R2-10 | 10 | 16.67 | - | 150 | - |
| R2-20 | 20 | 37.50 | - | 150 | - |
| R3-B | 0 | - | - | - | 150 |
| R3-5 | 5 | 7.89 | - | - | 150 |
| R3-10 | 10 | 16.67 | - | - | 150 |
| R3-20 | 20 | 37.50 | - | - | 150 |
B = Blank formulation; 5 = 5% drug loading; 10 = 10% drug loading; 20 = 20% drug loading
7,000–17,000 MW PLGA polymer ester terminated
7,000–17,000 MW PLGA polymer acid terminated
di-block copolymer containing an ester terminated PLGA (10,000 MW) and 10% PEG (5,000 MW)
For each of the 12 formulations, 150 mg of polymer was dissolved in 1.5 mL of dichloromethane. After complete dissolution of the polymers, 95.6 μL of ethanol was added to the batch prior to the addition of the drug. This sequence of addition was used because the solubility of the drug in the dichloromethane/ethanol combination was much greater than in either of the solvents individually [24]. No drug was added to the blank formulations. Once the polymer and drug were dissolved, 1 mL of a 1% aqueous solution of PVA (30,000–70,000 MW) was added to the organic solution, and the mixture was sonicated for 20 seconds at 40 W with a Vibra-Cell™ ultrasonic probe (Sonic &Materials Inc., Newton, CT). This pre-emulsion was placed in an Emulsiflex C3 homogenizer (Avestin, Inc., Ottawa, Ontario, Canada) along with 20 mL of the 1% aqueous solution of PVA. The mixture was homogenized for 15 minutes at 15,000 psi. During the homogenization process, the mixture was circulated through a heat exchange coil immersed in an ice bath to prevent heating of the sample. The homogenized mixture was then transferred to a beaker containing 59 mL of the 1% PVA solution, the homogenizer was rinsed with 20 mL of the PVA solution which was transferred to the beaker, and the resulting mixture (100 mL) was magnetically stirred overnight to facilitate complete evaporation of the organic solvents. The product was centrifuged in an ultracentrifuge (Beckman Coulter Indianapolis, IN) at 35,000 RPM. The supernatant was removed, and the pellet was rinsed with deionized water and was centrifuged again. This process was repeated four times for complete removal of the PVA. The pellet was dispersed in 5 mL of deionized water and freeze-dried at −30°C for 48 hours. This process was repeated for each of the three polymers with the three drug loadings and corresponding blank batches (batch without drug) for comparison.
Nanoparticle Characterization
The nanoparticle formulations were studied for particle morphology, particle size distribution, and thermal behavior.
Particle morphology
Samples of the powder products were characterized using a S4800 field emission scanning electron microscope (SEM) (Hitachi High Technologies America Inc., Gaithersburg, MD). The samples were dispersed in a minimum amount of water, and a drop was placed on carbon tape on an aluminum stub and allowed to dry in a desiccator. All samples were sputter-coated (K550X Sputter Coater, Quorum Technologies Ltd, West Sussex, UK) with gold prior to analysis. The samples were imaged at 5 kV with a working distance of 6 mm.
Particle size distribution
Particle size distribution of the formulations was determined by a Mastersizer 2000 fitted with a Hydro SM small volume unit (Malvern Instruments Ltd., Worcestershire, UK). For each sample, a background run of deionized water was performed. After subtraction of the background, the particle size distribution calculation was performed with deionized water as the dispersing medium. Samples were pre-dispersed in a small volume of deionized water by means of gentle mixing and pipetted into the Hydro SM unit to achieve an obscuration between 10% and 20%. Each measurement was performed in triplicate.
Thermal analysis
The thermal behavior of the formulations was studied using differential scanning calorimetry (Q200 DSC; TA Instruments, New Castle, DE). Analysis was carried out in conventional MDSC mode, heating only. The samples were equilibrated at 0.0°C with a modulation of +/− 1.0°C every 60 seconds and isothermal heating for 5 minutes. A heating ramp of 3.0°C/min to 225.0°C was used. Analyses of the scans, including determination of glass transition (Tg) and melt temperature (Tm), were performed using TA Instruments Universal Analysis software (TA Instruments, New Castle, DE).
Encapsulation Efficiency
Drug encapsulation efficiency (ratio of actual drug content to theoretical loading) was determined by mixing 2 mg of each sample with 5 mL of methanol. The samples were set aside for 5 minutes to allow for dissolution and then filtered through a 0.2 μm polypropylene filter. Triplicates of each formulation were prepared. Analysis was performed by ultrahigh performance liquid chromatography/mass spectrometry (UPLC/MS) using an Acquity® UPLC (Waters Corporation, Milford, MA) fitted with a photodiode array detector and a single quad mass spectrometry detector. The method was adapted from Lee et al. [25]. Two-component gradient chromatography was performed using an aqueous 0.1% formic acid solution as the aqueous component and methanol as the organic component. The flow rate was 0.4 mL/min with an initial condition of 40% aqueous component and 60% organic component. The system was run isocratically under these conditions for 0.5 minutes, ramped by a linear gradient to 10% aqueous component over 1.5 minutes, and was maintained at 10% aqueous for an additional 2 minutes. Finally, the system was reconditioned at 40% aqueous for 0.5 minutes prior to the next injection cycle. The column used in the analyses was a Kinetex® C18 1.7 μm 50 × 2.1 mm (Phenomenex Inc., Torrance, CA) which was maintained at 30°C. Under these conditions the retention time for fenretinide was 2.5 minutes. Detection by UV spectrometry was obtained at 364 nm. For the mass spectrometry, atmospheric pressure chemical ionization (APCI) was employed using a corona voltage of 3.5 kV, a cone voltage of 30 V, an extractor voltage of 2 V, an RF lens voltage of 0.5 V, a source temperature of 150°C, and an APCI probe temperature of 650°C. Nitrogen was utilized for desolvation at 500 L/h and for the cone gas at 30 L/h. Single ion monitoring at 392.3 m/z was used for the detection of fenretinide. Prior to analysis of the samples, a series of standards was prepared ranging in concentration from 0.2 ng/mL to 20 ng/mL. For samples where only UV detection was utilized, the standards ranged from 10 ng/mL to 200 ng/mL. Samples which were found to be more concentrated than 200 ng/mL were diluted with methanol and reanalyzed.
Drug Release Studies
Drug release studies were performed using a seven station flow through dissolution apparatus, Sotax CE7 (SOTAX Corp., Westborough, MA). The CE7 was in closed loop mode using 5 mL flow cells and 500 mL sample bottles. For each test, 500 mL of simulated intestinal fluid (SIF), which consisted of 100 mM potassium phosphate monobasic adjusted to pH 6.8 with sodium hydroxide, was used. The SIF was heated to 37°C. Five milligrams of each formulation and of pure drug as a control were pre-measured in the flow cells prior to the start of each test. Samples were collected at 0.25, 0.5, 1, 3, 6, and 24 h. The samples were immediately filtered with a 0.2 μm polypropylene filter and diluted four times by volume with methanol to stabilize the samples. The diluted samples were analyzed using the same UPLC-MS procedure employed for encapsulation efficiency analysis. All release studies were done in triplicate.
Caco-2 Cell Culture
Caco-2 cells were grown at 37°C, 5% CO2, and 90% relative humidity and were seeded onto 12-well, 3.0 μm pore size Transwell® inserts (Corning Incorporated, Corning, NY) at a density of 6.7×10⁴ cells/cm2 after passage 58–61. The culture medium was Dulbecco’s Modified Eagle Medium (DMEM), high glucose, with 10% fetal bovine serum, 1% L-glutamine, 1% sodium pyruvate, 1% non-essential amino acids, and 1% antibiotics. The cells were allowed to differentiate for 22–23 days before conducting the permeation studies. Transepithelial electrical resistance (TEER) of the monolayer was measured using an epithelial volt-ohmmeter (EVOM, WPI Inc., USA), and Lucifer yellow rejection assays were used to confirm cell monolayer integrity. Only those monolayers with an apparent permeability for Lucifer yellow of ≤ 12 nm/s after 1 hour were utilized for permeation studies.
Caco-2 Cell Permeability Assay
Following a 30 minute incubation with a transport buffer containing 25 mM HEPES, 5 mM glucose, 145 mM NaCl, 3 mM KCl, 1 mM CaCl2, 0.5 mM MgCl2·6H2O, and 1 mM NaH2PO4 (pH 7.4) [26], the donor chamber was loaded with 0.5 mL transport buffer containing approximately 50 μM fenretinide, while transport buffer with 4% bovine serum albumin (BSA) was loaded into the receiving chamber. The drug concentration for the cell permeation study was selected based on information obtained from the literature about fenretinide experimental concentrations in Caco-2 cell models [27]. BSA in the receiver compartment was used to improve sink conditions and reduce non-specific binding [28]. Samples were taken from the receiver compartment at 1, 2, 3, and 4 h, replacing the media in the receiver compartment with fresh transport buffer containing 4% BSA. Throughout the experiment, the Transwell plates were incubated at 37°C and shaken at 100 RPM. The TEER reading of the monolayer was monitored at each sample collection time point during the experiment. All experiments were done in triplicate.
Fenretinide Extraction
At the conclusion of the permeability assay, the contents of the donor compartment and receiver compartment were completely removed. Aliquots from the donor compartment and receiver compartment were incubated with four times their volume of ethanol overnight to precipitate the BSA and to solubilize all fenretinide in the sample. The receiver compartment was incubated with 2.0 mL of ethanol overnight. The cells were rinsed with 0.5 mL ice-cold Hank’s Buffered Saline Solution (HBSS), and the cells were scraped from the filter. A final rinse with 0.5 mL ice-cold HBSS was done to ensure that all cells were collected. The cells were subjected to two freeze-thaw cycles and centrifuged at 13,000 RPM for 10 minutes. The supernatant was removed (representing the drug content in the cell cytosol), stabilized with ethanol (20% sample, 80% ethanol), and allowed to incubate overnight. The pellet remaining in the centrifuge tube (representing the drug content in the cell membrane) was also incubated with 1.5 mL of ethanol overnight [27]. Additionally, the Transwell® filter, now devoid of cells, was incubated overnight with 2.0 mL of ethanol. On the following day, all samples were centrifuged at 13,000 RPM for 10 minutes, and the supernatants were analyzed for fenretinide. Fenretinide quantification was done by the same UPLC/MS procedure employed for the dissolution and encapsulation efficiency studies except with isocratic flow at 20% aqueous component and 80% organic component rather than gradient flow, which provided sufficient separation of components while reducing run time. Mass balance was calculated for all experiments to ensure complete accounting of fenretinide within the system. The apparent permeability coefficient (Papp) for each formulation was calculated as follows:
where ΔQ/Δt is the rate of the appearance of the drug in the receiver compartment (μg/sec), A is the membrane growth area (cm2), and Co is the initial concentration in the donor compartment (μg/mL) [29].
Results and Discussion
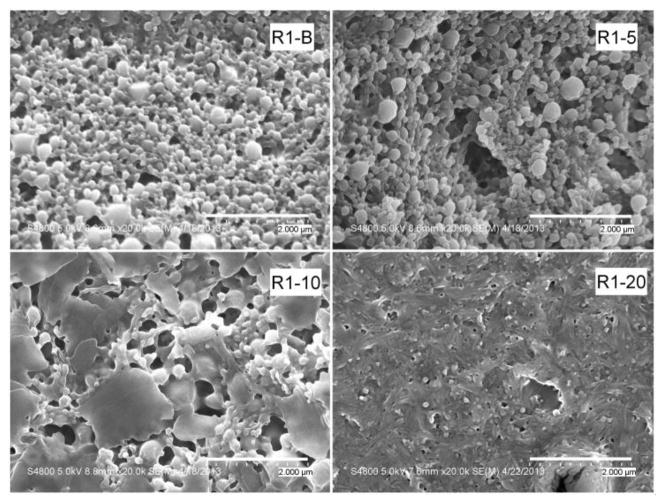
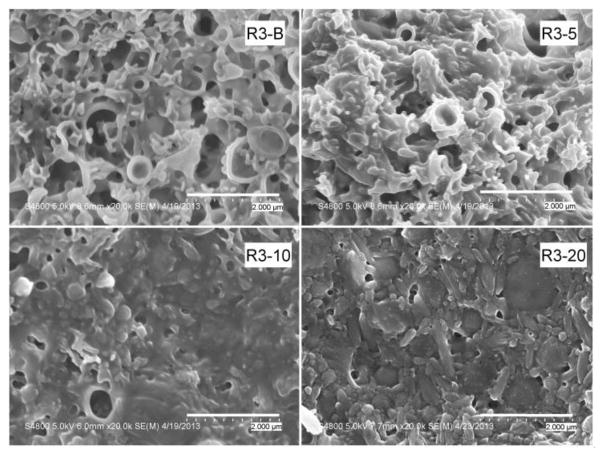
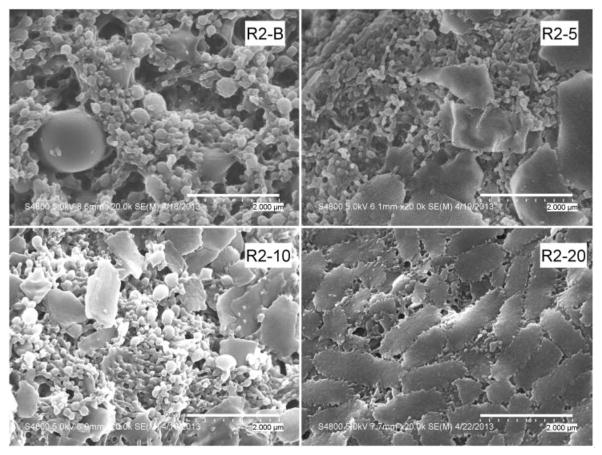
Figures 1–3 show the SEM photographs of the nanoparticle formulations. Both PLGA polymers, R1 and R2, produced spherical, uniform blank particles (Figures 1 and 2). However, the blank nanoparticles produced using the copolymer R3 contained some irregular and broken particles (Figure 3). This result was consistent with the previous observation during the homogenization process of this batch (R3-B), when some particle precipitation was observed visually.
Figure 1.
SEM micrographs of R1 formulations (ester terminated PLGA). Sample magnification is 20,000. The four micrographs show an increasing percentage of plate-like agglomerates with increasing drug content.
Figure 3.
SEM micrographs of R3 formulations (PLGA/PEG copolymer). Sample magnification is 20,000. Unlike the PLGA formulations, the copolymer formulations contain numerous large, broken, and hollow particles.
Figure 2.
SEM micrographs of R2 formulations (acid terminated PLGA). Sample magnification is 20,000. As with the R1 formulations, the appearance of agglomerations in the sample increases with increasing drug content. Magnification of the R2-20 sample shows these plate-like structures to be agglomerates of smaller particles.
Upon the addition of the drug, a decrease in the homogeneity of the particles was observed for all three polymers. Agglomeration of the particles and some larger plate-like structures were observed. For all formulations, more irregularities in particle size and morphology appeared as the drug content increased. Magnification of the agglomerates for the R2-20 formulation showed that these plate-like structures were an agglomeration of very small particles. The R3 batches (prepared with the PLGA/PEG copolymer) with 5%, 10%, and 20% drug displayed the presence of large, irregular particles in addition to the large plate-like structures. However, the positive correlation between occurrence of large particles and drug content was not supported by the particle size measurements, which are presented in Table 2. Because the samples were dispersed in water prior to their placement on the SEM stubs, the observed agglomerates are either a transient result from drying on the stub or permanent structures present in the lyophilized formulations. Agglomerate formation during lyophilization could be reduced by the addition of cryoprotectants [30]. However, the addition of cryoprotectants results in a decrease in drug loading, causes physical alterations in the formulations [31], and may affect the transport process [32]. Since the goal of this study was to evaluate the use of PLGA polymers in formulating fenretinide, cryoprotectants were not used, so as not to introduce artifacts resulting from their inclusion in the formulation.
Table 2.
Particle size distribution of the nanoparticle formulations
| Formulation | Particle Size Distribution (nm)
|
||
|---|---|---|---|
| D (10%) (mean ± SD) | D (50%) (mean ± SD) | D (90%) (mean ± SD) | |
| R1-B | 175 ± 3 | 349 ± 8 | 1230 ± 16 |
| R1-5 | 110 ± 6 | 273 ± 11 | 893 ± 75 |
| R1-10 | 132 ± 4 | 328 ± 3 | 1134 ± 11 |
| R1-20 | 92 ± 1 | 243 ± 2 | 996 ± 17 |
| R2-B | 116 ± 1 | 287 ± 1 | 1030 ± 1 |
| R2-5 | 81 ± 1 | 211 ± 4 | 930 ± 47 |
| R2-10 | 181 ± 1 | 362 ± 1 | 994 ± 1 |
| R2-20 | 73 ± 1 | 167 ± 2 | 375 ± 2 |
| R3-B | 95 ± 2 | 605 ± 54 | 9127 ± 503 |
| R3-5 | 160 ± 13 | 455 ± 53 | 7626 ± 127 |
| R3-10 | 207 ± 2 | 382 ± 1 | 2431 ± 7 |
| R3-20 | 220 ± 2 | 405 ± 1 | 2313 ± 79 |
The median particle size measurements for all batches, regardless of polymer choice, ranged approximately from 165 to 600 nm, and no relationship between drug content and particle size was observed. Thus, the effect of drug content on morphology and particle size of the nanoparticles in the solid form does not affect the particle size of the dispersed form. However, the morphology and particle size of the formulations in the solid form can still impact release rates, dispersibility, and wettability of the formulations. Together, the qualitative SEM micrographs of the solid particles and the quantitative size measurements of the dispersed particles give a more complete understanding of the physical characteristics of the nanoparticles. These results also suggest that lower drug content and polymers R1 and R2 are preferable if particle size is the principal metric of optimization.
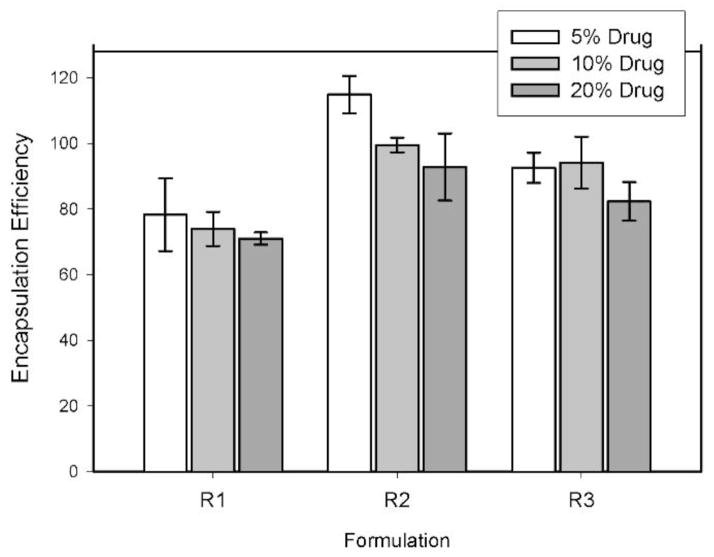
Generally, the encapsulation efficiency of the nanoparticles was very good (exceeding 70%) for all samples (Figure 4). The R1 formulations (ester terminated PLGA polymer) displayed the lowest efficiency for all three drug loadings, ranging from a high of 78.3% for the 5% drug formulation to 71.0% for the 20% drug formulation, and the R2 formulations (acid terminated PLGA polymer) exhibited the highest drug encapsulation overall. Formulation R2-5 resulted in an encapsulation efficiency greater than 100%, 114% ± 6%. Encapsulation efficiency is determined by the ratio of measured amount of entrapped drug in the sample to the theoretical weight of drug in the formulation. However, this calculation assumes an equal loss of drug and polymer during the washing process, and this might not be the case in some instances. For example, formulations with high polydispersity may result in loss of ultrafine particles during the rinsing process, and these particles may have a higher or lower drug to polymer ratio than larger particles due to differences in surface area and volume, resulting in disproportionate loss of one component compared to the other. In this study, the encapsulation efficiency of formulation R2-5 that exceeds 100% could be attributed to a differential loss of polymer during the sample washing process. The R3 formulations (PLGA/PEG copolymer) resulted in intermediate encapsulation efficiencies, ranging from 82.3% to 92.6%, which, while less than those of the R2 formulations, were still excellent. For each of the three polymer groups, the encapsulation efficiencies were lower for those formulations with the highest drug loading.
Figure 4.
Encapsulation efficiency of the fenretinide nanoparticle formulations. Error bars represent standard deviations for n = 3.
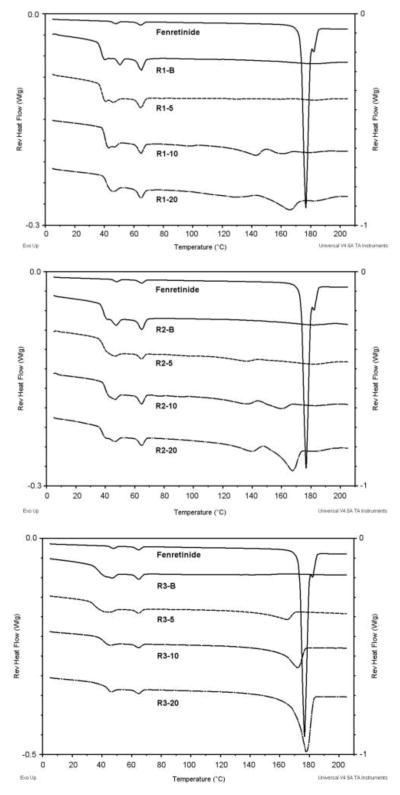
As seen in Figure 5, thermal analysis of fenretinide alone showed a doublet peak with onset temperatures of 173.3°C and 180.0°C. The peak with an onset temperature of 173.3°C represents the melting endotherm reported by Shealy et al., and the peak with an onset temperature of 180°C is similar to the melting endotherm of the polymorph reported by Moon et al. [19,33]. The two peaks represent the melting of two polymorphic modifications of fenretinide. This was further confirmed by performing a non-modulated DSC scan on the drug alone by heating until the first peak (174.0°C), isocratic heating at this temperature for 5 minutes, cooling to room temperature, and subsequently heating the sample to 200.0°C. This scan showed a more prominent peak with onset at 180.0°C, indicating a larger abundance of this polymorph which resulted from the recrystallization of the other polymorph upon cooling (Figure 6). The glass transition temperatures and the melting temperatures for the formulations are presented in table 3.
Figure 5.
Reversing MDSC plots of fenretinide alone and the fenretinide nanoparticle formulations.
Figure 6.
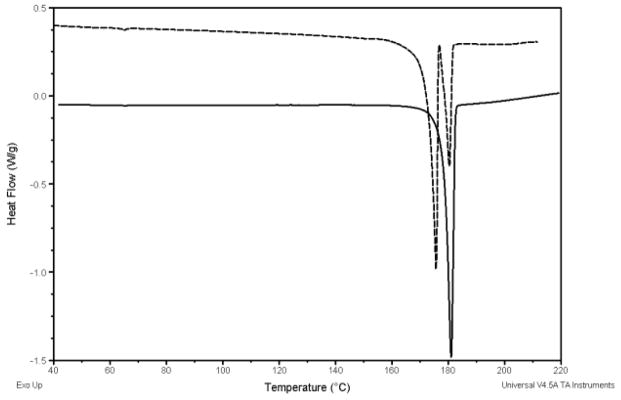
DSC plots of fenretinide polymorphs after heating to 200°C (dash line) and fenretinide after heating to 174°C, isocratic heating for 5 minutes, cooling to room temperature, and reheating to 200°C (solid line).
Table 3.
Glass transition temperatures and drug melting temperatures observed in the formulations
| Formulation | Tg (°C) | Tm (°C) |
|---|---|---|
| R1-B | 38.3 | N/A |
| R1-5 | 38.2 | BDLa |
| R1-10 | 40.2 | 129.5 |
| R1-20 | 41.9 | 149.4 |
| R2-B | 39.1 | N/A |
| R2-5 | 38.4 | 164.7 |
| R2-10 | 39.8 | 145.8 |
| R2-20 | 38.4 | 155.9 |
| R3-B | 37.4 | N/A |
| R3-5 | 35.5 | 146.8 |
| R3-10 | 42.1 | 160.3 |
| R3-20 | 43.8 | 170.0 |
BDL = below detectable limit
The formulations with 5% drug loading showed that fenretinide was not in its crystalline form in the formulations, as evidenced by the absence of the characteristic endotherm for the melting of crystalline fenretinide. At 5% loading, fenretinide appears to form a solid solution with the polymer or is present in the amorphous form. The plasticizing effect of the drug on the polymer is evidenced by a slight decrease in the glass transition temperature at 5% loading. At higher drug loadings (10% and 20%), the drug is increasingly present in the crystalline form as evidenced by the increase in the size of the melting endotherm with increasing drug loading.
Table 4 lists the results from the release studies. The determination of fenretinide release from the formulations was based on the measurement of dissolved drug (i.e. in the molecular state) as well as drug-containing particles smaller than 200 nm, which is the cut-off size of the filters used in the dissolution study. The latter could include suspended nano-sized particles of drug and drug/polymer nanoparticles. These release studies do not measure true dissolution, where the solute is in the molecular state, but rather drug particles, whether molecular or colloidal. The R2 (acid-terminated PLGA polymer) formulations resulted in the highest amounts of drug in solution for all three drug loadings and the highest drug concentrations at 24 hours for all three drug loadings. The R3 formulations slightly outperformed the R1 formulations, having a higher maximum amount of released drug even though the R3 formulations had more irregular morphologies in the SEM micrographs. All of the R2 formulations dispersed readily in the test solution, indicating that redispersibility played a role in enhancing drug release. When drug release studies were conducted using pure drug, the amounts of drug released were below detectable limits at all time points.
Table 4.
Drug release characteristics of the nanoparticle formulations
| Formulation | Drug Release Characteristics
|
||
|---|---|---|---|
| Amax a | Tmax b | A24 c | |
| Control (Pure Drug) | BDL d | N/A | BDL |
| R1-5 | BDL | N/A | BDL |
| R1-10 | 3.24% | 15 | BDL |
| R1-20 | 2.87% | 15 | 2.16% |
| R2-5 | 9.97% | 30 | 1.70% |
| R2-10 | 6.34% | 60 | 2.58% |
| R2-20 | 6.14% | 180 | 3.56% |
| R3-5 | BDL | N/A | BDL |
| R3-10 | 5.21% | 180 | BDL |
| R3-20 | 5.04% | 15 | 1.93% |
Amax = maximum amount (μg) released as a percentage of the initial amount of drug (μg)
Tmax = time period (minutes) at which maximum amount measured
A24 = amount (μg) released at the 24 hour time period as a percentage of the initial amount (μg) of drug
BDL = below detectable limit
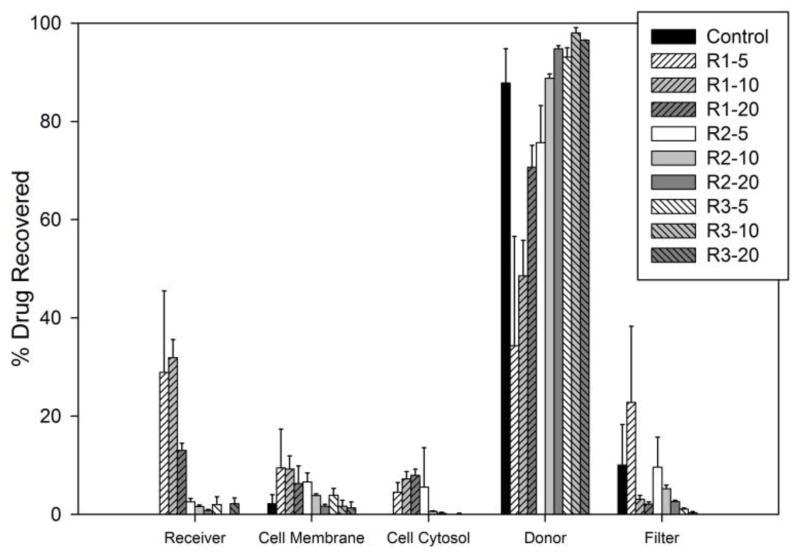
Ultimately the success of a formulation is determined by its ability to enhance the absorption of fenretinide within the intestines following oral administration, and Caco-2 permeability assays were conducted to assess the in vitro cellular transport of fenretinide. PLGA polymers have a well-documented record of biodegradability and biocompatibility in vivo [34], and PLGA polymers have been previously evaluated in Caco-2 cell models [35–37]. The results of the Caco-2 permeability assays are shown in Figure 7. The donor compartment measurement includes the total drug found in that compartment at the conclusion of the assay (i.e. receiving chamber wash and cumulative drug removed at each time point). Because of the low aqueous solubility of fenretinide, BSA was used in the receiving compartment to improve sink conditions and reduce non-specific binding [28]. For all formulations, the mass balance of fenretinide was greater than 65%, which is considered the criterion for reliable results [38], except for formulation R2-20 and the control, which show suboptimal recovery levels of 58% ± 2% and 43% ± 6%, respectively, yet are still above the threshold for poor recovery (defined as < 40%) [39]. Of the three polymers, R1 was superior to R2 and R3 in drug transport across the Caco-2 monolayer because the R1 formulations had the most drug recovered in the receiver compartment, cell membrane, and cell cytosol after 4 hours (Figure 7). An appreciable amount of fenretinide was found in the cell membrane for both the formulations and the fenretinide control. Considering the hydrophobicity of fenretinide, accumulation is expected in the lipid membrane of the cells, which has been observed for other lipophilic compounds [40,41]. Additionally, drug was found accumulated on the Transwell® filter rather than within the receiver compartment. Thus, while 4% BSA in the receiver compartment was sufficient to solubilize some of the permeated drug, poor partitioning among the cell membrane, filter, and receiving compartment appears to be a factor in the permeability of fenretinide.
Figure 7.
Percentage of drug recovered in each compartment (relative to the total drug recovered) after Caco-2 cell incubation for 4 hours. Error bars represent standard deviations.
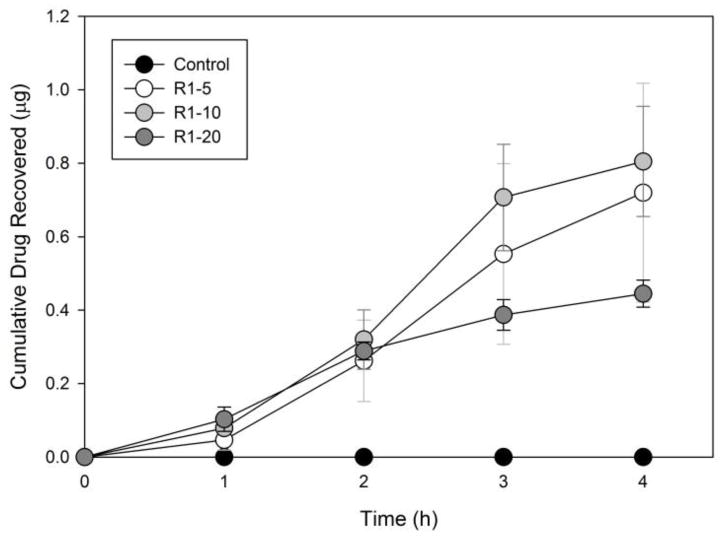
Only the R1 formulations had appreciable amounts of drug in the receiver compartment and exhibited steady-state transport over time (from 1 hour to 3 hours) to warrant calculation of Papp. The correlation coefficients for steady state transport of the drug in the R1 formulations were above 0.95 for all of the Papp calculations (from 1 hour to 3 hours). Figure 8 depicts the cumulative transport of drug through the Caco-2 monolayers for the R1 formulations. Papp for R1-5, R1-10, and R1-20 were 18.58 ± 16.10, 22.03 ± 8.44, and 7.64 ± 0.30 (×10−6 cm/s), respectively, which are in the range of the 10−5 to 10−6 cm/sec value required as a criterion for “high permeability” [42]. A Papp value greater than 10 × 10−6 cm/s is correlated with 80–100% human intestinal absorption in vivo [38]. These Papp calculations do not account for the drug found attached to the Transwell filter or the drug within the cell monolayer, and, therefore, could be an underestimation of the permeability of the formulated drug. Further study is needed to determine the contribution of the polymers to the improved permeability of fenretinide but could be attributed to factors such as the particle size of the formulations, the enhanced release characteristics, the amorphous drug content, and/or the relatively more lipophilic nature of the R1 polymer compared to the more hydrophilic R2 and R3 polymers.
Figure 8.
Cumulative drug recovered in the receiver compartment over the 4 hour assay period for polymer R1. The control sample was below the detection limit of analysis. Error bars represent standard errors.
Conclusions
All three polymers produced nano-sized particles with improved release characteristics when compared to fenretinide alone. While all three polymers resulted in observable differences in the release characteristics of the nanoparticles, the permeation of the drug across the Caco-2 monolayer is the ultimate determinant of the best polymer formulation for improving the oral bioavailability of fenretinide [43]. Taking this into account, the nanoparticle formulations utilizing the ester terminated PLGA (R1) appear to be the best choice for formulating fenretinide nanoparticles to increase its cellular permeability in the gut. The results of this study also indicate that several factors including polymer composition, drug loading, particle size, and formulation dispersibility play a role in the ultimate performance of the nanoparticle formulations. Several modifications could further improve the performance of the formulations. Further studies would include optimization of the formulations using other solvent systems to improve the physical characteristics of the particles [44], the addition of a cryoprotectant or dispersing aid to assist in the redispersion of the particles and eliminate agglomeration [45], and in vivo bioavailability studies to determine the effectiveness of the formulations after oral administration.
Acknowledgments
This publication was made possible by funding from NIH Grants #5SC3GM102050 and #2G12MD007595-06, and the Louisiana Cancer Research Consortium.
Footnotes
The contents are solely the responsibility of the authors and do not necessarily represent the official views of the NIH or the Louisiana Cancer Research Consortium.
Publisher's Disclaimer: This is a PDF file of an unedited manuscript that has been accepted for publication. As a service to our customers we are providing this early version of the manuscript. The manuscript will undergo copyediting, typesetting, and review of the resulting proof before it is published in its final citable form. Please note that during the production process errors may be discovered which could affect the content, and all legal disclaimers that apply to the journal pertain.
References
- 1.Howlader N, Noone AM, Krapcho M, Garshell J, Miller D, Altekruse SF, Kosary CL, Yu M, Ruhl J, Tatalovich Z, Mariotto A, Lewis DR, Chen HS, Feuer EJ, Cronin KA, editors. SEER Cancer Statistics Review, 1975–2011. National Cancer Institute; Bethesda, MD: Apr, 2014. http://seer.cancer.gov/csr/1975_2011/, based on November 2013 SEER data submission, posted to the SEER web site. [Google Scholar]
- 2.National Cancer Institute. Fact Sheet: Drug Discovery at the National Cancer Institute. National Institute of Health; Jun 6, 2006. [Accessed 23 Sept 2014]. http://www.cancer.gov/cancertopics/factsheet/NCI/drugdiscovery. [Google Scholar]
- 3.Daoud A, Song J, Xiao F, Shang J. B-9-3, a novel β-carboline derivative exhibits anti-cancer activity via induction of apoptosis and inhibition of cell migration in vitro. Eur J Pharmacol. 2014 Feb 5;724:219–30. doi: 10.1016/j.ejphar.2013.12.038. [DOI] [PubMed] [Google Scholar]
- 4.Koval AV, Vlasov P, Shichkova P, Khunderyakova S, Markov Y, Panchenko J, Volodina A, Kondrashov FA, Katanaev VL. Anti-leprosy drug clofazimine inhibits growth of triple-negative breast cancer cells via inhibition of canonical Wnt signaling. Biochem Pharmacol. 2014 Feb 15;87(4):571–8. doi: 10.1016/j.bcp.2013.12.007. [DOI] [PubMed] [Google Scholar]
- 5.Ding C, Zhang Y, Chen H, Yang Z, Wild C, Chu L, Liu H, Shen Q, Zhou J. Novel nitrogen-enriched oridonin analogues with thiazole-fused A-ring: protecting group-free synthesis, enhanced anticancer profile, and improved aqueous solubility. J Med Chem. 2013 Jun 27;56(12):5048–58. doi: 10.1021/jm400367n. [DOI] [PMC free article] [PubMed] [Google Scholar]
- 6.Savjani KT, Gajjar AK, Savjani JK. Drug solubility: importance and enhancement techniques. ISRN Pharm. 2012;2012:195727. doi: 10.5402/2012/195727. [DOI] [PMC free article] [PubMed] [Google Scholar]
- 7.Patel A, Jones SA, Ferro A, Patel N. Pharmaceutical salts: a formulation trick or a clinical conundrum? Br J Cardiol. 2009;16(6):281–6. [Google Scholar]
- 8.Li SD, Huang L. Pharmacokinetics and biodistribution of nanoparticles. Mol Pharm. 2008 Jul-Aug;5(4):496–504. doi: 10.1021/mp800049w. [DOI] [PubMed] [Google Scholar]
- 9.Gamboa JM, Leong KW. In vitro and in vivo models for the study of oral delivery of nanoparticles. Adv Drug Deliv Rev. 2013 Jun 15;65(6):800–10. doi: 10.1016/j.addr.2013.01.003. [DOI] [PMC free article] [PubMed] [Google Scholar]
- 10.Mathiowitz E, Jacob JS, Jong YS, Carino GP, Chickering DE, Chaturvedi P, Santos CA, Vijayaraghavan K, Montgomery S, Bassett M, Morrell C. Biologically erodable microspheres as potential oral drug delivery systems. Nature. 1997 Mar 27;386(6623):410–4. doi: 10.1038/386410a0. [DOI] [PubMed] [Google Scholar]
- 11.Bhardwaj V, Naga M, Kumar VR. Polymeric nanoparticles for oral drug delivery. In: Gupta RB, Kompella UB, editors. Nanoparticle Technology for Drug Delivery. Taylor & Francis Group; New York, US: 2006. pp. 231–71. [Google Scholar]
- 12.Möschwitzer J, Müller RH. Drug nanocrystals – the universal formulation approach for poorly soluble drugs. In: Thassu D, Dellers M, Pathak Y, editors. Nanoparticulate Drug Delivery Systems. Informa Healthcare USA, Inc; New York, US: 2007. pp. 71–88. [Google Scholar]
- 13.Khalil NM, do Nascimento TC, Casa DM, Dalmolin LF, de Mattos AC, Hoss I, Romano MA, Mainardes RM. Pharmacokinetics of curcumin-loaded PLGA and PLGA-PEG blend nanoparticles after oral administration in rats. Colloids Surf B Biointerfaces. 2013 Jan 1;101:353–60. doi: 10.1016/j.colsurfb.2012.06.024. [DOI] [PubMed] [Google Scholar]
- 14.Teixeira M, Alonso MJ, Pinto MM, Barbosa CM. Development and characterization of PLGA nanospheres and nanocapsules containing xanthone and 3-methoxyxanthone. Eur J Pharm Biopharm. 2005 Apr;59(3):491–500. doi: 10.1016/j.ejpb.2004.09.002. [DOI] [PubMed] [Google Scholar]
- 15.Imbuluzqueta E, Gamazo C, Lana H, Campanero MÁ, Salas D, Gil AG, Elizondo E, Ventosa N, Veciana J, Blanco-Prieto MJ. Hydrophobic gentamicin-loaded nanoparticles are effective against Brucella melitensis infection in mice. Antimicrob Agents Chemother. 2013 Jul;57(7):3326–33. doi: 10.1128/AAC.00378-13. [DOI] [PMC free article] [PubMed] [Google Scholar]
- 16.Swami A, Shi J, Gadde S, Votruba AR, Kolishetti N, Farokhzad OC. Nanoparticles for targeted and temporally controlled drug delivery. In: Svenson S, Prudhomme RK, editors. Multifunctional Nanoparticles for Drug Delivery. Springer Science+Business Media; New York, US: 2012. pp. 9–29. [Google Scholar]
- 17.Moon RC, Thompson HJ, Becci PJ, Grubbs CJ, Gander RJ, Newton DL, Smith JM, Phillips SL, Henderson WR, Mullen LT, Brown CC, Sporn MB. N-(4-Hydroxyphenyl)retinamide, a new retinoid for prevention of breast cancer in the rat. Cancer Res. 1979 Apr;39(4):1339–46. [PubMed] [Google Scholar]
- 18.Decensi A, Robertson C, Guerrieri-Gonzaga A, Serrano D, Cazzaniga M, Mora S, Gulisano M, Johansson H, Galimberti V, Cassano E, Moroni SM, Formelli F, Lien EA, Pelosi G, Johnson KA, Bonanni B. Randomized double-blind 2 × 2 trial of low-dose tamoxifen and fenretinide for breast cancer prevention in high-risk premenopausal women. J Clin Oncol. 2009 Aug 10;27(23):3749–56. doi: 10.1200/JCO.2008.19.3797. [DOI] [PMC free article] [PubMed] [Google Scholar]
- 19.Mata NL, Lichter JB, Vogel R, Han Y, Bui TV, Singerman LJ. Investigation of oral fenretinide for treatment of geographic atrophy in age-related macular degeneration. Retina. 2013 Mar;33(3):498–507. doi: 10.1097/IAE.0b013e318265801d. [DOI] [PubMed] [Google Scholar]
- 20.Graham TE, Yang Q, Blüher M, Hammarstedt A, Ciaraldi TP, Henry RR, Wason CJ, Oberbach A, Jansson PA, Smith U, Kahn BB. Retinol-binding protein 4 and insulin resistance in lean, obese, and diabetic subjects. N Engl J Med. 2006 Jun 15;354(24):2552–63. doi: 10.1056/NEJMoa054862. [DOI] [PubMed] [Google Scholar]
- 21.Reynolds CP, Wang Y, Melton LJ, Einhorn PA, Slamon DJ, Maurer BJ. Retinoic-acid-resistant neuroblastoma cell lines show altered MYC regulation and high sensitivity to fenretinide. Med Pediatr Oncol. 2000 Dec;35(6):597–602. doi: 10.1002/1096-911x(20001201)35:6<597::aid-mpo23>3.0.co;2-b. [DOI] [PubMed] [Google Scholar]
- 22.Vaishampayan U, Heilbrun LK, Parchment RE, Jain V, Zwiebel J, Boinpally RR, LoRusso P, Hussain M. Phase II trial of fenretinide in advanced renal carcinoma. Invest New Drugs. 2005 Mar;23(2):179–85. doi: 10.1007/s10637-005-5864-7. [DOI] [PubMed] [Google Scholar]
- 23.Villablanca JG, London WB, Naranjo A, McGrady P, Ames MM, Reid JM, McGovern RM, Buhrow SA, Jackson H, Stranzinger E, Kitchen BJ, Sondel PM, Parisi MT, Shulkin B, Yanik GA, Cohn SL, Reynolds CP. Phase II study of oral capsular 4-hydroxyphenylretinamide (4-HPR/fenretinide) in pediatric patients with refractory or recurrent neuroblastoma: a report from the Children’s Oncology Group. Clin Cancer Res. 2011 Nov 1;17(21):6858–66. doi: 10.1158/1078-0432.CCR-11-0995. [DOI] [PMC free article] [PubMed] [Google Scholar]
- 24.Wischke C, Zhang Y, Mittal S, Schwendeman SP. Development of PLGA-based injectable delivery systems for hydrophobic fenretinide. Pharm Res. 2010 Oct;27(10):2063–74. doi: 10.1007/s11095-010-0202-y. [DOI] [PubMed] [Google Scholar]
- 25.Lee JI, Nguyen VT, Chen ML, Adamson PC. A rapid, sensitive and selective liquid chromatography/atmospheric pressure chemical ionization tandem mass spectrometry method for determination of fenretinide (4-HPR) in plasma. J Chromatogr B Analyt Technol Biomed Life Sci. 2008 Feb 1;862(1–2):64–71. doi: 10.1016/j.jchromb.2007.10.044. [DOI] [PMC free article] [PubMed] [Google Scholar]
- 26.Dahan A, Sabit H, Amidon GL. Multiple efflux pumps are involved in the transepithelial transport of colchicine: combined effect of p-glycoprotein and multidrug resistance-associated protein 2 leads to decreased intestinal absorption throughout the entire small intestine. Drug Metab Dispos. 2009 Oct;37(10):2028–36. doi: 10.1124/dmd.109.028282. [DOI] [PubMed] [Google Scholar]
- 27.Kokate A, Li X, Jasti B. Transport of a novel anti-cancer agent, fenretinide across Caco-2 monolayers. Invest New Drugs. 2007 Jun;25(3):197–203. doi: 10.1007/s10637-006-9026-3. [DOI] [PubMed] [Google Scholar]
- 28.Buckley ST, Fischer SM, Fricker G, Brandl M. In vitro models to evaluate the permeability of poorly soluble drug entities: challenges and perspectives. Eur J Pharm Sci. 2012 Feb 14;45(3):235–50. doi: 10.1016/j.ejps.2011.12.007. [DOI] [PubMed] [Google Scholar]
- 29.Sadeghi AM, Dorkoosh FA, Avadi MR, Weinhold M, Bayat A, Delie F, Gurny R, Larijani B, Rafiee-Tehrani M, Junginger HE. Permeation enhancer effect of chitosan and chitosan derivatives: comparison of formulations as soluble polymers and nanoparticulate systems on insulin absorption in Caco-2 cells. Eur J Pharm Biopharm. 2008 Sep;70(1):270–8. doi: 10.1016/j.ejpb.2008.03.004. [DOI] [PubMed] [Google Scholar]
- 30.Mainardes RM, Evangelista RC. PLGA nanoparticles containing praziquantel: effect of formulation variables on size distribution. Int J Pharm. 2005 Feb 16;290(1–2):137–44. doi: 10.1016/j.ijpharm.2004.11.027. [DOI] [PubMed] [Google Scholar]
- 31.Abdelwahed W, Degobert G, Stainmesse S, Fessi H. Freeze-drying of nanoparticles: formulation, process and storage considerations. Adv Drug Deliv Rev. 2006 Dec 30;58(15):1688–713. doi: 10.1016/j.addr.2006.09.017. [DOI] [PubMed] [Google Scholar]
- 32.Armitage WJ, Juss BK, Easty DL. Differing effects of various cryoprotectants on intercellular junctions of epithelial (MDCK) cells. Cryobiology. 1995 Feb;32(1):52–9. doi: 10.1006/cryo.1995.1004. [DOI] [PubMed] [Google Scholar]
- 33.Shealy YF, Frye JL, O’Dell CA, Thorpe MC, Kirk MC, Coburn WC, Jr, Sporn MB. Synthesis and properties of some 13-cis- and all-trans-retinamides. J Pharm Sci. 1984 Jun;73(6):745–51. doi: 10.1002/jps.2600730610. [DOI] [PubMed] [Google Scholar]
- 34.Jain RA. The manufacturing techniques of various drug loaded biodegradable poly(lactide-co-glycolide) (PLGA) devices. Biomaterials. 2000 Dec;21(23):2475–90. doi: 10.1016/s0142-9612(00)00115-0. Review. [DOI] [PubMed] [Google Scholar]
- 35.Song Q, Wang X, Hu Q, Huang M, Yao L, Qi H, Qiu Y, Jiang X, Chen J, Chen H, Gao X. Cellular internalization pathway and transcellular transport of pegylated polyester nanoparticles in Caco-2 cells. Int J Pharm. 2013 Mar 10;445(1–2):58–68. doi: 10.1016/j.ijpharm.2013.01.060. [DOI] [PubMed] [Google Scholar]
- 36.Araújo F, Shrestha N, Shahbazi MA, Fonte P, Mäkilä EM, Salonen JJ, Hirvonen JT, Granja PL, Santos HA, Sarmento B. The impact of nanoparticles on the mucosal translocation and transport of GLP-1 across the intestinal epithelium. Biomaterials. 2014 Nov;35(33):9199–207. doi: 10.1016/j.biomaterials.2014.07.026. [DOI] [PubMed] [Google Scholar]
- 37.Joshi G, Kumar A, Sawant K. Enhanced bioavailability and intestinal uptake of Gemcitabine HCl loaded PLGA nanoparticles after oral delivery. Eur J Pharm Sci. 2014 Aug 18;60:80–9. doi: 10.1016/j.ejps.2014.04.014. [DOI] [PubMed] [Google Scholar]
- 38.Press B, Di Grandi D. Permeability for intestinal absorption: Caco-2 assay and related issues. Curr Drug Metab. 2008 Nov;9(9):893–900. doi: 10.2174/138920008786485119. Review. [DOI] [PubMed] [Google Scholar]
- 39.Cai X, Walker A, Cheng C, Paiva A, Li Y, Kolb J, Herbst J, Shou W, Weller H. Approach to improve compound recovery in a high-throughput Caco-2 permeability assay supported by liquid chromatography-tandem mass spectrometry. J Pharm Sci. 2012 Aug;101(8):2755–62. doi: 10.1002/jps.23194. [DOI] [PubMed] [Google Scholar]
- 40.Pal D, Udata C, Mitra AK. Transport of cosalane-a highly lipophilic novel anti-HIV agent-across caco-2 cell monolayers. J Pharm Sci. 2000 Jun;89(6):826–33. doi: 10.1002/(SICI)1520-6017(200006)89:6<826::AID-JPS15>3.0.CO;2-4. [DOI] [PubMed] [Google Scholar]
- 41.Sawada GA, Barsuhn CL, Lutzke BS, Houghton ME, Padbury GE, Ho NF, Raub TJ. Increased lipophilicity and subsequent cell partitioning decrease passive transcellular diffusion of novel, highly lipophilic antioxidants. J Pharmacol Exp Ther. 1999 Mar;288(3):1317–26. [PubMed] [Google Scholar]
- 42.Le Ferrec E, Chesne C, Artusson P, Brayden D, Fabre G, Gires P, Guillou F, Rousset M, Rubas W, Scarino ML. In vitro models of the intestinal barrier. The report and recommendations of ECVAM Workshop 46. European Centre for the Validation of Alternative methods. Altern Lab Anim. 2001 Nov-Dec;29(6):649–68. doi: 10.1177/026119290102900604. Review. [DOI] [PubMed] [Google Scholar]
- 43.Martinez MN, Amidon GL. A mechanistic approach to understanding the factors affecting drug absorption: a review of fundamentals. J Clin Pharmacol. 2002 Jun;42(6):620–43. doi: 10.1177/00970002042006005. [DOI] [PubMed] [Google Scholar]
- 44.Sahana DK, Mittal G, Bhardwaj V, Kumar MN. PLGA nanoparticles for oral delivery of hydrophobic drugs: influence of organic solvent on nanoparticle formation and release behavior in vitro and in vivo using estradiol as a model drug. J Pharm Sci. 2008 Apr;97(4):1530–42. doi: 10.1002/jps.21158. [DOI] [PubMed] [Google Scholar]
- 45.Abdelwahed W, Degobert G, Stainmesse S, Fessi H. Freeze-drying of nanoparticles: formulation, process and storage considerations. Adv Drug Deliv Rev. 2006 Dec 30;58(15):1688–713. doi: 10.1016/j.addr.2006.09.017. [DOI] [PubMed] [Google Scholar]


