
Figure 7.
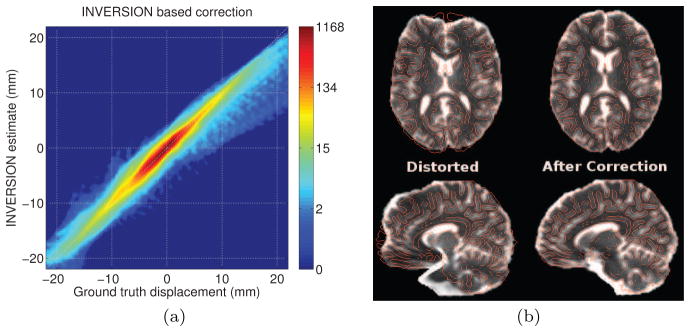
Performance of INVERSION-based distortion correction in the simulated BrainWeb dataset. The scatterplot of estimated displacement versus ground true displacement (calculated from the applied fieldmap) is shown as a joint histogram in (a). Note that the colorbars use a logarithmic scale to enhance visualization of the results for both minimally and severely distorted voxels. (b) Qualitative result of the INVERSION based correction in (top) an axial and (bottom) a sagittal slice. T2W-EPI images are overlaid with edge maps from the T1-weighted MPRAGE image in red.