

Abstract
Data gathered from six independent samples (n = 1,729) that assessed men’s masculine gender role stress in college and community males were aggregated used to determine the reliability and validity of an abbreviated version of the Masculine Gender Role Stress Scale (MGRS scale). The 15 items with the highest item-to-total scale correlations were used to create an abbreviated MGRS scale. Psychometric properties of each of the 15-items were examined with Item Response Theory (IRT) analysis, using the discrimination and threshold parameters. IRT results showed that the abbreviated scale may hold promise at capturing the same amount of information as the full 40-item scale. Relative to the 40-item scale, the total score of the abbreviated MGRS scale demonstrated comparable convergent validity using the measurement domains of masculine identity, hyper-masculinity, trait anger, anger expression, and alcohol involvement. An abbreviated MGRS scale may be recommended for use in clinical practice and research settings to reduce cost, time, and patient/participant burden. Additionally, IRT analyses identified items with higher discrimination and threshold parameters that may be used to screen for problematic gender role stress in men who may be seen in routine clinical or medical practice.
Keywords: Masculine gender role stress, psychometrics, classical test theory, item response theory
Research has indicated that the psychological strain of traditional, restrictive male gender roles is a robust predictor of a number of negative and health-risk behaviors, including drug and alcohol use, partner violence and aggression, depression, marital discord, cardiovascular problems, and lower rates of help-seeking behavior (Eisler, 1995; Eisler & Skidmore, 1987). Among other domains, one major inquiry that has facilitated our understanding of the risk factors related to men’s health outcomes is masculine gender role stress (MGRS). MGRS is conceptualized as a man’s subjective appraisal of meeting (or not meeting) society’s expectations linked to traditional male norms (Thompson & Pleck, 1995). Importantly, recent literature has found MGRS to be a contributing cause of the cognitive and affective distress experienced by men who rigidly adhere to masculine role norms (Jakupcak, Lisak, & Roemer, 2002). Research has consistently established that men who endorse higher levels of MGRS are motivated to avoid stereotypic female behavior, exhibit a desire to behave or appear dominant and assertive, experience conflicts about balancing their role in the family and at work, and are reluctant to display or express emotions to others. These aspects of masculinity may prominently influence men’s positive and negative mental and physical health outcomes.
One of the most widely used assessment instruments of MGRS is Eisler and Skidmore’s (1987) Masculine Gender Role Stress Scale1. The MGRS scale is a self-report questionnaire that was designed to measure the stress that men experience in situations in which they breach traditional masculine standards of behavior. Participants are asked to rate the degree of stress they would anticipate experiencing in 40 different situations that are hypothesized to violate masculine norms, such as feeling physically inadequate, expressing “tender” emotions, being subordinate to women, and failing at work or at sex. The MGRS scale is comprised of five subscales that measure men’s perceptions of physical inadequacy, comfort with emotional expression, subordination to women, intellectual inferiority, and fear of performance failure. Prior studies have shown that the five scales reflect a single latent MGRS construct (McCreary, Newcomb, & Sadava, 1998; 1999); and both the total scale score and the five component parts of the MGRS scale have been linked to a variety of health-related behaviors (Cohn & Zeichner, 2006; Eisler, Franchina, Moore, Honeycutt, & Rhatigan, 2000; Eisler & Skidmore, 1987; Eisler et al., 1988; Efthim, Mahalik, & Kenny, 2001; Jakupcak et al., 2002; Jakupcak, 2003; Lash, Copenhaver, & Eisler, 1998; McCreary, Wong, Weiner, Carpenter, Engle, & Nelson, 1996; Monk & Ricciardelli, 2003; Moore et al., 2008; Saurer & Eisler, 1990; Watkins, Eisler, Carpenter, Schectman, & Fisher 1991).
Thus far, the construct validity of the MGRS scale has been based on studies showing that (1) men evidence higher MGRS scores than do women (Eisler & Skidmore, 1987), (2) MGRS scores effectively identify men who are more or less vulnerable to perceiving and reacting negatively to threats to their masculinity (Moore & Stuart, 2004), and (3) MGRS scores in men are uniquely related to certain negative health-risk behaviors relative to women (Eisler, Skidmore, & Ward, 1988; Isenhart, 1993; Lash et al., 1990; McDermott, Tull, Soenke, Jakupcak, & Gratz, 2010). Findings from the literature have consistently demonstrated that MGRS scores are related to men’s perpetration of violence and aggression (Eisler et al., 1988; Franchina, Eisler, & Moore, 2001; Jakupcak, 2003; Jakupcak et al., 2002; Moore et al., 2010; Parrott, Peterson, & Bakeman, 2011; Parrott, Peterson, Vincent, & Bakeman, 2008), alcohol involvement (Eisler, 1995; Eisler et al., 1988; Lash et al., 1998; McCreary et al., 1999; Monk & Ricciardelli, 2003), and masculinity adherence (Gallagher & Parrott, 2011; Mahalik et al., 2003; McCreary et al., 1998).
Despite widespread use of the MGRS scale, existing psychometric evaluations have focused exclusively on classical test theory (CTT), and findings have not been as robust as might be expected (McCreary et al., 1998; McCreary et al., 1996). For example, McCreary and colleagues (1996) did not find that the MGRS scale was differentially related to depression, anxiety, or hostility between men and women. In a subsequent study, McCreary and colleagues (1998) failed to detect significant gender differences on two subscales of the MGRS (Intellectual Inferiority and Performance Failure). The absence of gender differences in patterns of association on the MGRS fails to support the construct validity of the measure for two main reasons. First, a central and underlying theoretical tenet of Eisler and Skidmore’s conceptualization of MGRS is that men would appraise the situations outlined on the scale as significantly more stressful than women; thus, we would expect to see gender differences on all sub-dimensions of MGRS, including feelings of intellectual inferiority and fear of failure. Second, Eisler and Skidmore (1987) proposed that MGRS would be related to poor psychological outcomes for men but not for women. Indeed, due to more rigidly defined gender roles for men relative to women, men’s deviations from masculine norms are more likely to be punished whereas women’s deviations are more likely to be tolerated. As a result, men should be more likely to experience emotional distress when they do not adhere to particular masculine role norms (McCreary et al., 1996).
One explanation for these unexpected findings may be due to the psychometric assumptions and properties underlying CTT statistics. CTT is necessary for construct validity purposes but may be limited with regard to practical applications for individuals. That is, CTT focuses on summary-level, not item-level, statistics. Thus, it does not provide information on the quality of specific items within a measure, nor does it allow the user to test the quality or the precision of an instrument and its numerous items as it varies across different levels of the underlying latent-trait (Embretson, 1996). Item Response Theory (IRT) analysis offers advantages for evaluating the utility of a measure as it pertains to individuals’ performance and the ability of individual items to discriminate different degrees or levels of construct of interest. IRT permits the user to examine the extent to which an item is endorsed across varying levels of an underlying trait (Embretson & Reise, 2000). This is important because not every man will possess the same levels of masculine gender role stress (Eisler & Skidmore, 1987). IRT methods can also provide information about how well a particular item places an individual on a certain point along the latent-trait continuum. Factor analytic techniques, as generally applied, are useful for clustering items together; however, they cannot identify how individuals vary along this latent trait and thus do not provide specific information about how well individual items map onto the variability of the construct under consideration. As mentioned, not all features of MGRS will be present to the same degree in all men (Eisler & Skidmore, 1987). Some items on the MGRS scale may be endorsed only by men who have extreme levels of gender roles stress, whereas others may be endorsed more frequently by most if not all men. Identification of these “high-discrimination” items may prove useful for treatment planning or to determine eligibility in a research study.
Because IRT can identify whether or not items fit along the underlying latent-trait, this approach is increasingly used to assist with scale refinement and evaluation. Therefore, a major purpose of our study was to determine whether we could use IRT to develop an abbreviated MGRS scale that replicates Eisler and Skidmore’s (1987) measurement tool of men’s cognitive-behavioral gender role stress conformity. An abbreviated measure offers several advantages over the full measure while maintaining the same psychometric properties. First, it has the potential to reduce time, respondent burden, and expenses associated with administration, and can be implemented easily into a number of research and clinical settings. Second, an abbreviated MGRS scale can result in more precise measurement of the underlying construct, because only items that have the best ability to discriminate across the latent-trait continuum will be retained.
With this in mind, the present study aggregated six independent samples in which the MGRS scale was used to assess men’s masculine gender role stress. We sought to (1) develop an abbreviated MGRS scale using a diverse sample of males recruited from both college and community settings, (2) examine the psychometric properties of the abbreviated MGRS scale using IRT analysis, including item severity, discrimination, and item-fit; and (3) assess the validity of the abbreviated MGRS by examining its degree of association with several well-established correlates of MGRS and compare these associations to those of the full 40-item scale. Variables for our validity analyses were chosen based on factors that tap into precursors (masculinity) and consequences of MGRS (anger, alcohol use), and were similar to those used in the original MGRS scale validation article (Eisler & Skidmore, 1987). Given the relative dearth of research documenting item-level functioning of the MGRS scale, application of this methodology is warranted.
Method
Data from six independent samples (N = 2,053) were aggregated. Primary outcomes/main findings for two of these samples have been reported previously (Gallagher & Parrott, 2011; Parrott, 2009; Parrott et al., 2010; Parrott, Peterson, & Bakeman, 2011; Vincent, Parrott, & Peterson, 2011). Participants in each sample were recruited by the 2nd author from a large urban Southeastern location in the United States. The present investigation comprises data on males only (n = 1,729). These samples were selected for inclusion for several reasons. First, participants in each sample completed the MGRS Scale. Second, participants in each sample completed measures of meaningful correlates of MGRS, including alcohol involvement, anger, and masculinity, and which assess dimensions similar to those used in the original validation study of the MGRS scale (Eisler & Skidmore, 1987). Third, utilization of multiple samples afforded examination of the validity of an abbreviated MGRS scale across a large sample of undergraduate (n =1,235; 4 independent samples) and community-based (n = 494; 2 independent samples) males.
Participants
Participants in samples 1 through 4 were males recruited from the undergraduate research pool in the Department of Psychology at a large southeastern university. Participants in samples 5 and 6 were males recruited from the local metro community via advertisements posted on internet classifieds in an urban Southeastern location. The collective aim of obtaining these samples was to examine risk factors for violence perpetration. Participants provided informed consent and then completed self-report questionnaires (described below). Not all questionnaires listed below were included in each of the six studies.
Participants were generally in their late teens or early twenties with some post-high school education, with means ranging from 19–24 years of age and indicating approximately 14 years of education. The racial diversity of each sample was strong. The undergraduate samples were characterized by approximately 45% Caucasians (range: 43%–49%) and 30% African-Americans (range: 27%–48%), whereas the community samples were characterized by fewer Caucasians (range: 34%–38%) and more African-Americans (range: 26%–47%). Participants mean yearly family income ranged between $27,600 and $38,592. The vast majority of participants were single and never married (range: 78%–97%). Undergraduate and community participants were compensated with course credit or $10 per hour of participation, respectively. The recruitment of all six samples was approved by university’s institutional review board.
Measures2
Alcohol Dependence Scale (ADS; Skinner & Allen, 1982)
This 25-item self-report scale assesses severity of risk for alcohol dependence across several domains, including behavioral control, obsessive drinking, and psycho-perceptual and psychophysiological withdrawal. The ADS is positively correlated with social problems related to drinking, heavier alcohol consumption, and craving for and preoccupation with drinking (Doyle & Donovan, 2009; Skinner & Allen, 1982). Alpha reliability for the current sample was high (α = .89).
Anger Expression Scale (AXI; Spielberger, 1988)
This 24-item Likert scale uses a 4-point scale (1 = “almost never” to 4 = “almost always”) to assess three ways in which one tends to express feelings of anger: Anger-Out (8-items), which measures anger directed outward to others; Anger-In (8-items), which measures the tendency to express anger inwardly or suppress anger; and Anger-Control (8-items), which measures the tendency to control the experience and expression of anger. The AXI has been related to a variety of negative health behaviors, including cardiovascular disease, depression in men, and men’s physical aggression in the laboratory (Greenberg, Chuick, Shepard, & Cochran, 2009; Haukkala, Konttinen, Laatikainen, Kawachi, & Uutela, 2010; Parrott & Giancola, 2004). In the present sample, adequate alpha coefficients were obtained for each subscale (Anger-Out: α = .80, Anger-In: α = .74, Anger Control: α = .84).
The Michigan Alcoholism Screening Test – Brief Version (B-MAST; Pokorny, Miller, & Kaplan, 1972; Selzer, 1971)
This 10-item measure assesses one’s lifetime severity of alcoholism and is highly correlated with the full version (r = 0.95–0.99). The B-MAST has demonstrated adequate sensitivity and specificity at identifying harmful and hazardous alcohol use in medical and emergency room samples, clinical samples, and outpatient samples (Chan, Pristach, & Welte, 2006; MacKenzie, Langa, & Brown, 1996).
Drinking Patterns Questionnaire (DPQ)
Participants’ alcohol use during the past year was assessed using the National Institute on Alcohol Abuse and Alcoholism’s (NIAAA, 2003) recommended set of six alcohol consumption questions. Of interest to the present study were frequency and average quantity of alcohol consumption. Frequency was assessed with the question, “During the last 12 months, how often did you usually have any kind of drink containing alcohol?” A categorical response ranging from “everyday” to “I never drank alcohol in my whole life” was provided. Quantity was assessed with the question, “During the last 12 months, how many alcoholic drinks did you have on a typical day when you drank alcohol?” A categorical range of responses from “1 drink” to “25 or more drinks” was provided. In accordance with the guidelines put forth by NIAAA (2003), total scores were obtained by computing the average number of drinks in each range. This strategy reliably assesses an individual’s average quantity of alcohol consumption per drinking day over a specific period of time (for a review, see Sobell & Sobell, 2003).
Hypermasculinity Inventory (HI; Mosher & Sirkin, 1984)
This 30-item forced-choice scale assesses the extent to which the respondent endorses an exaggerated masculine personality. The HI consists of three dimensions: violence as manly, callous sexual beliefs, and danger as exciting. In the present sample, adequate alpha reliability coefficients were obtained for the full scale (α = .82), Violence as Manly subscale (α = .80), and Calloused Sexual Beliefs subscale (α = .70). A slightly weaker alpha reliability coefficient was obtained for the Danger as Exciting subscale (α = .63).3 Concurrent validity has been demonstrated with positive correlations to direct physical laboratory aggression, acceptance of interpersonal violence, and hostile attitudes toward women (Parrott & Zeichner, 2003).
Masculine Gender Role Stress Scale (MGRSS; Eisler & Skidmore, 1987)
The MGRSS is comprised of 40 items that assesses men’s experience of stress associated with events related to the male gender role, including physical inadequacy, expressing tender emotions, subordination to women, intellectual inferiority, and failure at work or sex. Respondents rate situations according to how stressful they feel each situation would be if it happened to them using a 6-point Likert scale (0 not at all stressful to 5 extremely stressful), with higher scores indicating greater masculine role stress. Concurrent validity has been demonstrated with positive correlations to anger, anxiety, interpersonal violence, and other health risk behaviors such as tobacco and alcohol use (Eisler et al., 1988; Eisler et al., 2000; Jakupcak et al., 2002; Jakupcak, 2003; Lash, Copenhaver, & Eisler, 1998). In the present sample, adequate alpha coefficients were obtained for the full scale and each subscale (Full Scale: α = .93; Physical Inadequacy: α = .75; Emotional Expressiveness: α = .70; Subordination to Women: α = .82; Intellectual Inferiority: α = .72; Performance Failure: α = .80).
Male Role Norms Inventory (MRNS; Thompson & Pleck, 1986)
The MRNS assesses three dimensions of masculine ideology on 26 items using a 7-point Likert scale (1 strongly disagree to 7 strongly agree). The first dimension is Status, which assesses the belief that men must gain the respect of others. The second dimension is Toughness, which assesses the belief that men are physically tough and have aggressive inclinations. The third dimension is Anti-femininity, which assesses the belief that men should avoid stereotypically feminine activities. Higher scores on the MRNS reflect greater adherence to the three dimensions of masculinity (Thompson & Pleck, 1986). Previous research indicates moderate associations between MRNS scores and masculine gender role stress and measures of laboratory aggression (Parrott, 2009; Parrott et al., 2011). In the present sample, alpha coefficients for each subscale were good (Full Scale: α = .90; Status: α = .82; Toughness: α = .80; Anti-femininity: α = .80).
Trait Anger Scale (TAS; Spielberger, 1988)
This 10-item Likert-type scale (1 = “not at all” to 4 = “very much”) assesses one’s enduring disposition to experience anger frequently, intensely, and for a long duration. Total scores range from 10 to 40, with higher scores indicating a tendency to become angry more frequently and intensely. Previous studies show that the TAS is positively correlated with MGRS scale scores, laboratory aggression, negative affect, and attentional bias for angry faces (Cohn, Seibert, & Zeichner, 2009; Van Honk, Tuiten, de Haan, Vann de Hout, & Stam, 2001). In the present sample, the alpha coefficient for the total scale score was .90.
Data Analytic Plan
Factor Structure of 40-item MGRS Scale
To determine whether a “best fitting” MGRS scale would be represented by the full or a shortened version, we first tested the factor structure of the original 40-item scale. To do so, we examined a general five-factor model in which the indicators were set to load onto the five subscales of MGRS using a traditional Confirmatory Factor Analysis (CFA) approach. Because we could not confirm this five-factor structure, we followed by randomly splitting the data in half and conducted an exploratory factor analysis (EFA) on the first half to determine an appropriate factor structure then a CFA on the other half to confirm this structure. Model parameters were estimated using maximum likelihood approach and a full information covariance matrix with missing data assumed to be missing at random (Muthen, Kaplan, & Hollis, 1987). The overall adequacy of model fit was determined using multiple indices (Hu & Bentler, 1999): Comparative Fit Index (CFI; ≥.90 indicates good fit), the Root Mean Square Error of Approximation (RMSEA; ≤.05 indicates good fit and values up to .08 indicate adequate fit); and the Standardized Root Mean Square Residual (SRMR; < .08 indicates adequate fit).
Polytomous IRT Models
CFAs were performed on both the 40-item and abbreviated MGRS scales to determine whether each met assumptions of uni-dimensionality needed to conduct IRT analyses (Embretson & Reise, 2000). Unidimensionality can be demonstrated when a single dominant factor is strong enough such that that estimation of a unidimensional factor solution is not affected by the presence of minor factors (Edelen & Reeve, 2007). This can be demonstrated by an eigenvalue of the first factor being significantly larger than eigenvalues of all subsequent factors (Hattie, 1985). Graded response polytomous IRT models were then conducted yielding parameters for discrimination (slope) and item thresholds. Discrimination parameters indicate an item’s ability to differentiate between individuals who are high or low on the underlying latent-trait. Larger discrimination parameters indicate that the likelihood of endorsing an item increases more rapidly as the underlying latent-trait increases – in this case, as MGRS becomes more severe. Item threshold parameters indicate the point along the latent-trait continuum at which the probability of endorsing a response option is 50%, and corresponds to the point of intersection or crossover between the lower response option and the next ordinally higher response option. The number of item threshold parameters is determined by the number of response categories minus 1.
The category response characteristic curves (CRCs) for each of the 15-items were then plotted. CRCs model the probability that a specific response category is endorsed as a function of the value of the purported underlying latent-trait continuum (i.e., degree of masculine gender role stress). Lastly, a total information curve was plotted for the abbreviated MGRS scale. This was estimated by all values from the threshold and discrimination parameters for each item and indicates the point on the latent-trait continuum where the scale is most reliable. All IRT models were analyzed using MULTILOG v 7.03 (Muraki & Bock, 2002), which estimates item parameters via a Bayesian expectation-maximization (EM) estimation procedure. For the present analyses, the criterion applied for convergence of the EM estimation procedure was 0.005.
Items Selection for Abbreviated Scale
We took an approach similar to Eisler and Skidmore (1987) and Blanchard et al. (2003) for refining the 40-item MGRS scale. We first examined item-to-total correlations with the full-scale along with discrimination parameter estimates resulting from IRT analysis of the 40-item scale (Embretson & Reise, 2000). The IRT literature indicates there is a direct positive relationship between an item’s discrimination parameter value and its corresponding item-to-total scale correlation (Reeve, 2003; Embretson & Reise, 2000; Hambleton et al., 2000). To select items for the abbreviated scale, we sorted items by item-to-total correlations and looked for points between items where a distinction could be drawn. We then examined alpha coefficients for the abbreviated version to validate the measure’s internal consistency and to ensure it did not differ greatly from the overall measure. This process resulted in an internally consistent, 15-item scale due to both a sizable drop in item-to-total correlation and non-sequential discrimination parameters thereafter.
Validity Analyses
Empirical studies of MGRS in men consistently show that the construct is positively related to anger/aggression, alcohol use, and alcohol-related problems (Eisler et al., 2000; Franchina et al., 2001; Isenhart, 1993; Jakupcak, 2003; Lash et al., 1998) and can be discriminated from measures of masculine identity via small correlations with such constructs (Eisler & Skidmore, 1987). Thus, we computed Pearson product-moment correlations to assess the degree of association between the abbreviated MGRS scale and related correlates, including alcohol use, alcohol problems, anger, and masculinity. We also compared correlations for the abbreviated 15-item and full 40-item scales to these measures using Fisher z-transformations.
Results
Factor Structure of the 40-item MGRS Scale
The five-factor MGRS model prescribed in the literature did not terminate successfully due to a non-positive definite latent variable covariance matrix. Visual analysis of the psi matrix revealed extremely high inter-factor covariances; this suggests several of the factors were indistinguishable and the five-factor CFA model did not adequately parse out meaningfully different constructs. Simply stated, we did not find the prescribed five-factor model to distinguish meaningfully different sub-subscales of MGRS.
We examined two alternative factor structures of the full MGRS scale: (1) a hierarchical model in which the five lower-order sub-scales, as modeled in the traditional CFA, are set as latent indicators of one higher-order general latent factor of masculine gender role stress, and (2) a bi-factor model in which the observed variables indicate both a general latent masculine gender role stress construct and the five latent sub-constructs, where the general factor is uncorrelated with the five latent sub-factors (Asparouhov & Muthén, 2009). In the first analysis, data from all 40 items were fit to a hierarchical factor structure with the prescribed five sub-factors informing one general factor. This analysis ultimately did not converge on a final solution either, even after allowing the model to run for 1,000,000 iterations. We followed the troubleshooting steps outlined in the Mplus user manual (Muthén & Muthén, 1998–2010). The issue was not the result of extreme differences in sample variances, as all 40 items are measured on identical scales. This was confirmed through visual analysis of the raw data and covariance matrix. Examining the iterazation history revealed the analysis did not have difficulties on any specific try. Finally, starting values informed by unsuccessful runs and preliminary models, respectively, did not lead to model convergence. We feel confident, therefore, that the model did not converge because it does not accurately represent the data. The bi-factor model used a quartimin rotation, and freed the first factor loading. The specific factors (five subscales) were allowed to freely correlate with one another, while the general and specific factors were specified to be uncorrelated. The bi-factor model suffered from the same issues as the five-factor CFA: the results were not positive definite because of a non-positive definite latent variable covariance matrix.
The overall conclusion from attempting to validate the structure of the 40-item MGRS is that the five-factor structure did not represent the data well. In response, we randomly divided the dataset into two halves to conduct an EFA on the first half and a CFA on the second. In the EFA, eigenvalues for the first two factors were 5.94 and 1.32, a ratio of 4.51, offered support for sufficient unidimensionality for subsequent IRT analysis (Embretson & Reise, 2000). EFA results for multiple-factor solutions confirmed our initial interpretation: several of the 40 indicators loaded strongly on factors other than those suggested in the literature. The CFA of the other half suggested a single-factor solution fit the 40-item data marginally well according to some indices (RMSEA = .077 [90% CI = .075, .079]; SRMR = .08), but not well according to another (CFI = .64). The overall conclusion from attempting to fit a factor structure to the 40-item MGRS data is that the prescribed five-factor structure did not represent the data well. It is possible that developing a shortened measure, by trimming items that do not discriminate well on the latent-trait continuum and have low item-to-total scale correlations, may improve fit of the single-factor solution across indices.
Selecting Abbreviated MGRS Scale Items
To ensure the accuracy of our method for selecting items for the abbreviated measure, we analyzed the 40-item MGRS using IRT methods to obtain discrimination parameters. Table 1 provides results for the item-to-total scale correlations, IRT discrimination parameter estimates, and alpha-if-deleted scores for the full 40-item MGRS scale. Using this information, the 15 items with the highest values on both discrimination and item-to-scale correlation were selected for the abbreviated scale. We set our cut-point at 15 items because there was a relatively large decrease after this point in item-to-scale correlations and these 15 items also had the highest discrimination scores. Other cut-points were considered, such as selecting the 18 items with item-to-total correlations >.5, however those three additional items have lower discrimination parameters than several items that would remain excluded. The correlation between the 15 item-to-total scale correlations and IRT discrimination parameters was r = .94, suggesting significant overlap and redundancy between both metrics. The correlation between the full 40-item MGRS scale and the abbreviated 15-item version was very high (r = .95, p < .01). The full scale demonstrated a high degree of internal consistency (α = .93), as did the abbreviated measure (α = .90).
Table 1.
IRT discrimination parameters, item-to-total scale correlations, and Cronbach’s alpha for the 40-item (full MGRS). Items in bold were selected for inclusion in the abbreviated MGRS scale.
| Item | IRT discrimination parameter | Item-to-total scale correlation | Cronbach’s alpha if item deleted |
|---|---|---|---|
| 23 | 2.04 | 0.627 | .921 |
| 29 | 1.70 | 0.607 | .921 |
| 26 | 1.64 | 0.599 | .921 |
| 3 | 1.63 | 0.595 | .921 |
| 35 | 1.33 | 0.585 | .921 |
| 31 | 1.43 | 0.571 | .921 |
| 21 | 1.51 | 0.566 | .921 |
| 18 | 1.49 | 0.562 | .921 |
| 16 | 1.46 | 0.552 | .921 |
| 24 | 1.41 | 0.551 | .921 |
| 17 | 1.41 | 0.547 | .921 |
| 9 | 1.67 | 0.546 | .921 |
| 13 | 1.66 | 0.544 | .921 |
| 22 | 1.41 | 0.538 | .921 |
| 11 | 1.35 | 0.531 | .921 |
| 14 | 1.23 | 0.507 | .921 |
| 10 | 1.11 | 0.503 | .922 |
| 12 | 1.11 | 0.503 | .922 |
| 6 | 1.18 | 0.497 | .922 |
| 34 | 1.07 | 0.492 | .922 |
| 19 | 1.23 | 0.484 | .922 |
| 38 | 1.22 | 0.481 | .922 |
| 28 | 1.11 | 0.481 | .922 |
| 25 | 1.08 | 0.474 | .922 |
| 7 | 1.08 | 0.467 | .922 |
| 32 | 1.11 | 0.458 | .922 |
| 30 | 1.01 | 0.458 | .922 |
| 37 | 1.06 | 0.426 | .922 |
| 36 | 1.01 | 0.424 | .922 |
| 39 | 0.87 | 0.407 | .922 |
| 4 | 0.85 | 0.405 | .922 |
| 40 | 0.89 | 0.393 | .923 |
| 27 | 0.89 | 0.387 | .923 |
| 33 | 0.88 | 0.366 | .923 |
| 2 | 0.88 | 0.361 | .923 |
| 5 | 0.77 | 0.354 | .923 |
| 20 | 0.63 | 0.327 | .923 |
| 15 | 0.42 | 0.269 | .924 |
| 1 | 0.3 | 0.125 | .925 |
| 8 | 0.28 | 0.104 | .926 |
Table 2 provides results for the item-to-total correlations, alpha-if-deleted scores, and factor loadings for the abbreviated 15-item MGRS scale. The abbreviated scale retained items from each of the original five sub-scales, with at least two items representing each of the sub-scales, with the exception of Performance Failure, which only had one item. Cronbach’s alphas with each item removed were computed and indicated that internal consistency remained in the moderate to high range with relatively little variation (ranging from 0.88 to 0.89). Results from the item-to-total scale correlations on the abbreviated 15-item MGRS scale showed correlations ranging from 0.67 (item #23: “Being outperformed in a game by a woman”) to 0.52 (item #31 “Being compared unfavorably to other men” and item #35 “Getting passed over for a promotion”). Overall, the correlation between the full 40-item MGRS scale and the abbreviated 15-item version was very high (r = .95, p < .01). The full scale demonstrated a high degree of internal consistency (α = .93), as did the abbreviated measure (α = .90).
Table 2.
Item-to-total scale correlations, Cronbach’s alpha, and factor loadings for the 15-item MGRS scale
| Item Number | MGRS Subscale | Item-to-total scale correlations | Cronbach’s alpha if item deleted | Item Loadings |
|---|---|---|---|---|
| 3 | Subordination to Women | 0.592 | 0.888 | 0.676 |
| 9 | Subordination to Women | 0.564 | 0.889 | 0.584 |
| 11 | Physical Inadequacy | 0.564 | 0.889 | 0.459 |
| 13 | Subordination to Women | 0.558 | 0.889 | 0.645 |
| 16 | Physical Inadequacy | 0.572 | 0.888 | 0.607 |
| 17 | Emotional Inexpressiveness | 0.544 | 0.889 | 0.557 |
| 18 | Subordination to Women | 0.547 | 0.889 | 0.642 |
| 21 | Physical Inadequacy | 0.597 | 0.887 | 0.483 |
| 22 | Emotional Inexpressiveness | 0.529 | 0.891 | 0.535 |
| 23 | Subordination to Women | 0.674 | 0.884 | 0.691 |
| 24 | Intellectual Inferiority | 0.558 | 0.889 | 0.621 |
| 26 | Physical Inadequacy | 0.591 | 0.888 | 0.637 |
| 29 | Intellectual Inferiority | 0.594 | 0.887 | 0.593 |
| 31 | Physical Inadequacy | 0.524 | 0.891 | 0.511 |
| 35 | Performance Failure | 0.524 | 0.891 | 0.512 |
IRT Analysis of the Abbreviated MGRS Scale
After ensuring the primary assumptions of IRT were met, we implemented an approach similar to that of Neal et al. (2006), in which a single-factor solution was specified for the MGRS. Results showed that the 15-item MGRS scale had high factor loadings ranging from .483 to .691 and accounted for approximately 40.80% of the variance (see Table 2). The eigenvalues for the first and second factors were 6.121 and 1.239 with the remaining eigenvalues less than one. The ratio of the first factor to the second factor was 4.94. This confirmed that the 15-item MGRS was sufficiently unidimensional (even though sub-factors may be present) to allow for IRT analysis.4 Confirmatory factor analyses demonstrated that the unidimensional factor structure fit the entire dataset well (RMSEA = .051, 90 Percent C.I. = .046, .056, CFI=.962; TLI=.952; SRMR=.034) and fit each of the six samples adequately well (RMSEA=.069–.088; CFI=.899–.924; TLI=.871–.904; SRMR=.049–.066).
Table 3 lists the IRT results for the abbreviated 15-item MGRS scale. The 15 items achieved at least moderate discrimination (a > 1.0). Item 23 “Being outperformed in a game by a woman” showed the highest discrimination parameter and item 35 “Getting passed over for a promotion” showed the lowest discrimination parameter. The percent endorsed for each rating option on the Likert scale is also provided in Table 3. Findings indicated that men in the sample were most likely to rate item 18 “Being with a woman who is more successful than you” as the least stressful compared to all other items, with an endorsement of 50% for the rating not stressful; conversely, only 3% of the sample rated this as extremely stressful. This item was followed by item 13 “Being married to someone who makes more money than you,” which 47% of the sample rated as not stressful. This item was followed by item 3 “Being outperformed at work by a woman”, which 37% of the sample rated as not stressful. The item that was endorsed most often as extremely stressful was item 11 “Being perceived by someone as ‘gay’”, which was endorsed by roughly a third of sample.
Table 3.
Percent endorsement of item response options and results of graded IRT polytomous model for abbreviated MGRS scale.
| Response Options | Discrimination Parameter | Item Thresholds | ||||||||||
|---|---|---|---|---|---|---|---|---|---|---|---|---|
|
| ||||||||||||
| 1 | 2 | 3 | 4 | 5 | 6 | a | b1 | b2 | b3 | b4 | b5 | |
|
| ||||||||||||
| Item Number | % | % | % | % | % | % | ||||||
| 3 | 37.93 | 19.22 | 14.88 | 14.01 | 8.63 | 5.33 | 1.74 | −0.45 | 0.21 | 0.76 | 1.45 | 2.23 |
| 9 | 32.89 | 19.34 | 16.62 | 15.34 | 9.51 | 6.31 | 1.57 | −0.68 | 0.05 | 0.68 | 1.43 | 2.25 |
| 11 | 15.35 | 10.14 | 8.69 | 14.89 | 17.44 | 33.49 | 1.42 | −1.59 | −0.99 | −0.59 | 0 | 0.66 |
| 13 | 47.51 | 19.12 | 13.21 | 10.78 | 5.45 | 3.94 | 1.66 | −0.11 | 0.57 | 1.14 | 1.83 | 2.52 |
| 16 | 16.81 | 13.33 | 13.38 | 18.02 | 15.99 | 22.47 | 1.54 | −1.45 | −0.78 | −0.25 | 0.41 | 1.09 |
| 17 | 26.25 | 18.66 | 15.64 | 18.48 | 11.36 | 9.62 | 1.41 | −1.02 | −0.22 | 0.39 | 1.22 | 2.01 |
| 18 | 50.23 | 17.79 | 12.51 | 9.56 | 6.84 | 3.07 | 1.65 | −0.03 | 0.61 | 1.15 | 1.78 | 2.71 |
| 21 | 14.89 | 10.89 | 11.88 | 15.47 | 15.87 | 31.01 | 1.58 | −1.53 | −0.91 | −0.41 | 0.15 | 0.73 |
| 22 | 23.23 | 10.61 | 14.95 | 17.44 | 16.05 | 17.73 | 1.32 | −1.2 | −0.67 | −0.05 | 0.66 | 1.48 |
| 23 | 27.01 | 15.87 | 15.59 | 16.51 | 11.99 | 13.04 | 2.16 | −0.78 | −0.22 | 0.26 | 0.84 | 1.41 |
| 24 | 27.74 | 18.59 | 17.31 | 19.11 | 9.51 | 7.76 | 1.51 | −0.89 | −0.15 | 0.48 | 1.38 | 2.14 |
| 26 | 27.74 | 16.33 | 18.01 | 17.83 | 12.85 | 7.24 | 1.61 | −0.88 | −0.24 | 0.41 | 1.17 | 2.11 |
| 29 | 21.95 | 15.92 | 17.83 | 21.48 | 14.42 | 8.41 | 1.59 | −1.16 | −0.46 | 0.19 | 1.05 | 1.99 |
| 31 | 17.49 | 9.51 | 15.06 | 23.91 | 19.92 | 14.13 | 1.32 | −1.57 | −1.01 | −0.32 | 0.65 | 1.72 |
| 35 | 7.47 | 6.32 | 12.69 | 24.33 | 27.29 | 21.91 | 1.28 | −2.47 | −1.82 | −1.02 | 0.06 | 1.27 |
Note: Response options re-coded 1 through 6 for IRT analyses.
The threshold values obtained from the location parameter indicated that the majority of the abbreviated MGRS scale items achieved greater precision at moderate to higher levels of the MGRS-trait dimension than at lower levels of the trait dimension. Items 18 “Being with a woman who is more successful than you” and 13 “Being married to someone who makes more money than you,” had the highest parameter thresholds. This finding suggests that those with greater levels of MGRS were more likely to endorse these items relative to those with lower levels. Conversely, item 35 “Getting passed over for a promotion” had the lowest parameter threshold. This suggests that less of the underlying trait was needed (i.e., lower MGRS scale scores) in order for this particular item to be endorsed.
Inspection of the total information curve in Figure 1 indicated that the 15-item MGRS scale had greater precision at the moderate to higher end of the MGRS-trait continuum. This was further confirmed by the CRCs for each of the 15 abbreviated MGRS items (Figure 2), which shows higher peaks towards the middle to the upper end of the continuum. Depiction of the CRCs suggested that the items were more reliable at measuring MGRS at moderate to high levels of the underlying trait. The CRCs and the total information curve took on a plateau shape, which suggests that the items are highly reliable across a large portion of the underlying trait and then steeply decline at the extreme lower and upper ends of the continuum.
Figure 1.
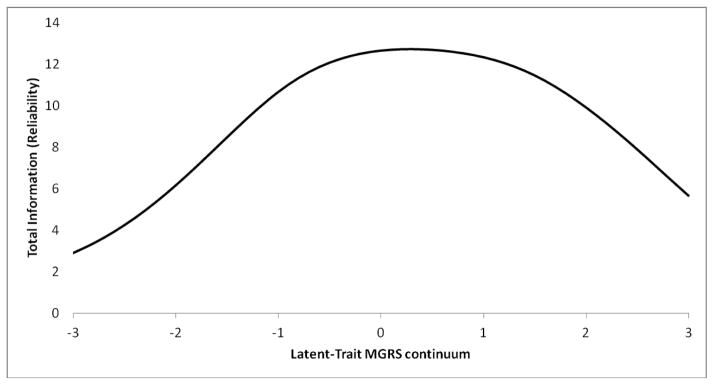
Total information curve for the abbreviated 15-item MGRS scale.
Figure 2.

Category response characteristic curves for each of the 15-items on the abbreviated MGRS scale.
Validity Analyses
With the exception of associations to alcohol use (drinks per drinking day and frequency of drinking), the abbreviated MGRS scale was significantly correlated with all the validity constructs (i.e., trait anger, individual differences in anger expression, and measures of masculinity). Results of Fisher z-transformations showed no significant differences between the total score of the 15-item and 40-item MGRS scale in their associations to any of the validity constructs, including HI and MRN subscale scores. As expected, both the abbreviated MGRS scale and the full 40-item scale were only moderately correlated to masculine identity and hypermasculinity (r’s = .37–.49). Taken together, correlational analyses provided evidence that the abbreviated MGRS scale captured approximately the same amount of information as the full 40-item version with little observable loss to convergent validity and did not overlap substantially with global measures of masculinity.
Discussion
The goal of this study was to develop and validate an abbreviated measure of the MGRS scale. We first used item-to-total correlations to identify the 15 most highly correlated items with the full scale, using an approach similar to Eisler and Skidmore (1987) and Blanchard and colleagues (2003). Items from this abbreviated measure were then submitted to a graded-response polytomous IRT analysis to examine unique item-level functioning, using the discrimination and threshold parameters, as well as the total information captured by the abbreviated measure. Next, we conducted a confirmatory factor analysis of both the full and abbreviated scales to evaluate each version’s factor structure. Finally, we examined the validity of the abbreviated MGRS scale by examining its association to several previously established correlates of MGRS. This is the first study to our knowledge that has developed an abbreviated MGRS scale and used IRT methods to investigate the unique item-level functioning of these “best fitting” items.
A CFA of the full MGRS scale suggested that the underlying factor structure of the 40-item MGRS was not represented well by the current item indicators. This finding provides some evidence that a refined measurement scale may be warranted. It may be that the types of role and norm constructs measured by the MGRS scale are evolving or have evolved since its original conception. Perhaps the five-factor structure of the 40-item scale fit data collected in the 1980’s, but not today. With the development of the abbreviated MGRS scale, it is possible that the removal of items that do not discriminate well on the latent-trait continuum has improved model fit while also retaining the validity and reliability of the original 40-item measure.
Several IRT parameters showed that the abbreviated MGRS scale items achieved maximum reliability at measuring moderate to more severe levels of MGRS. First, response frequencies indicated that the items least likely to be endorsed as stressful (the lowest level of endorsement) were items 13 “being married to someone who makes more money than you” and 18 “Being with a woman who is more successful than you.” It is noteworthy that even though these items were endorsed at very low levels of masculine gender role stress, and by nearly a third to half of the sample, results from the item information curves and item-to-total correlations confirm that these items still warrant inclusion in the questionnaire. Second, the CRCs and total information curves suggest that items included in the abbreviated MGRS scale capture important information on the underlying trait continuum of masculine gender role stress and do not detract from the psychometric reliability. These findings also suggest that not all items are equally weighted in the assessment of men’s gender role stress. Some items tap the lower and less severe end of the continuum, while others tap the higher and more severe end of the continuum.
While we cannot say for certain, the percent endorsement for each rating option may reflect the changing nature of male and female gender role norms over time, particularly as they relate to the workplace and changing roles in the family. Eisler and Skidmore (1987), who originally constructed the MGRS scale two decades ago, found that a man would perceive more stress to his masculinity by dating or marrying a woman more successful than him. However, results from the present study suggest that this may less applicable to men’s perception of gender role stress today, as this item had a very low rate of endorsement. On the other hand, the item that was endorsed most often as extremely stressful was item 11 “Being perceived by someone as “gay.” This may reflect a stable and unchanging aspect of men’s gender role stress that has not been affected by cohort or generation; or it may reflect the nature of the samples that were used in the present study. For example, all six samples included in the present investigation were drawn from an urban Southeastern location in the U.S., and societal attitudes toward gay men are known to vary by geographic location (Herek, 1984; Herek, 1994; Willis & Crawford, 2000; Yang, 1997). Taken together, perhaps some aspects of MGRS are transient and shift in response to cultural changes or societal norms, while others are static trait-like characteristics that become embedded in one’s personality over time.
The threshold parameters in the current study also varied across continuum and appeared to be more precise at the upper end of the latent-trait continuum than at the lower end of the continuum. A lower threshold parameter indicates that an item is more likely to be endorsed across the sample and that lower levels of the latent-trait are necessary for an individual to respond to that item. Conversely, a higher threshold parameter suggests that an item would only be endorsed by individuals who possess higher, or more severe levels of the underlying latent-trait. For our results, Item 18 “Being with a woman who is more successful than you” had the highest item threshold, indicating that very high levels of MGRS are needed for a man to endorse this scenario as stressful. Item 11 “being perceived by someone as gay” had the lowest threshold even at the highest level of responding. Thus, even a man who possesses very low levels of the underlying trait of MGRS appears likely to endorse this item as moderately to extremely stressful. This item may tap into a general dimension of masculine identity that is consistent across all men, and not just those who endorse high levels of MGRS.
Reliability analyses revealed that Cronbach’s coefficient alpha with each item removed and item-to-total scale correlations of the 15-item scale revealed negligible differences compared to the those of the 40-item MGRS scale (in terms of total scale comparisons). Validity analyses showed that the total score of the abbreviated 15-item MGRS scale demonstrated equal associations to alcohol use, alcohol problems, and anger. Finally, consistent with findings from the original validation article (Eisler & Skidmore, 1987), results from our study showed that the magnitude of the correlations between the 15-item MGRS to masculine identity (MRNS total scores) and hyper-masculinity (HI total scores) were in the moderate, but not high range. Further, Fisher z-transformations showed there were no significant differences between the 40-item and the 15-item scale in the magnitude of associations any of the constructs of interest.
This study has several notable strengths. First, we used IRT methods to examine the item-level properties of an abbreviated version of the widely used MGRS, which allowed us to examine which items on the abbreviated MGRS scale vary in their relationship to the underlying trait dimension of men’s gender role stress with greater precision and detail than CTT statistics allow. Second, we used a large and racially diverse sample of men recruited from both college and community settings aggregated from several independent studies. Third, while IRT methods have been used extensively for scale measurement and refinement in other fields, its application to the measurement of men’s attitudes and behavior is relatively novel.
Several limitations should be also discussed. First, we acknowledge that differences across the six studies were found and group differences were not examined as a primary aim of the study. It is important to note, however, that a fundamental component of IRT is that it does not require group comparisons to retain meaningful findings about how particular items map onto the latent-trait continuum of a construct (Embretson & Reise, 2000). In fact, a primary aspect of IRT that sets it apart from CTT statistics is that it is sample independent; meaning that replication of our analyses should remain consistent with a similarly large sample of men (Embretson & Reise, 2000). Second, we did not include Differential Item Function (DIF) analyses to examine item ability as a function of demographic factors, gender, or compare across community versus college samples. This was primarily due to small and unequal sample sizes across groups (Embretson & Reise, 2000). IRT methodologists (see Zumbo, 2007) have recently cautioned against the use of DIF in circumstances where the content of the literature is not well developed, because significant findings do not explain “why” items may vary across groups. Because no previous studies have applied IRT methods to examine the MGRS scale, we felt that more research was needed to replicate our results before including DIF analyses across subgroups. Third, this study was based on a secondary data analysis and we were thus unable to use a larger set of constructs with which to test the validity of the abbreviated MGRS. The generalizability of our findings may be limited by our use of only anger and alcohol involvement as outcomes to validate the MGRS construct, as these are only two of many other negative outcomes related to MGRS. Further, findings may only be generalizable to populations of males (for the time being) until more research is conducted. We could not examine the test-retest reliability of the abbreviated scale, or associations of the abbreviated scale to changes in men’s behaviors and attitudes over time, as the designs of the studies used in the current paper were not set up to do so.
It is important to note that, whereas the original MGRS scale has had dozens of studies to substantiate its reliability, theoretical consistency, and predictive validity, the abbreviated form, while promising, will require replication and a number of further validity studies. For instance, it will important to differentiate men and women on the abbreviated scale, an issue not addressed in the current manuscript. Also, combining all items in the abbreviated scale does lose some of the unique variance of the multiple dimensions of the MGRS, and perhaps the sensitivity of the scale. However, each dimension of MGRS was retained in the abbreviated version and thus researchers and clinicians may use individual items from the sub-scales, if they wish, to make case-by-case assessments of behavior. Future studies are required to examine the unique variance accounted for by each subscale of the abbreviated MGRS scale to constructs known to be related to MGRS.
In sum, our data are quite unique in that we used multiple data sets which included young adult college or community men from diverse racial backgrounds, comprising one of the largest samples ever to be used to examine the psychometrics of the MGRS scale. Findings suggest that not all features of MGRS may be present in every man, and that a “one-size-fits-all” approach to assessment will not capture the varying degrees of the underlying trait. Results from our IRT analyses may provide a starting point for mapping features that detect men who are high levels of masculine gender role stress and using this information for treatment matching in clinical practice or for determining eligibility in a research study. Future studies should identify clinically meaningful cut-points on the MGRS scale that indicate high risk for health-related or psychological problems. Further, creating weighted scores for items that are less frequently endorsed may also improve scale reliability and validity.
Acknowledgments
The research design and data collection were supported by NIAAA grant R01 AA015445 awarded to Dominic J. Parrott.
Appendix A. Abbreviated Masculine Gender Role Stress Scale (corresponding subscale in italics)
| 3. Being outperformed at work by a woman (Subordination to women) |
| 9. Letting a woman control the situation (Subordination to women) |
| 11. Being perceived by someone as “gay” (Physical inadequacy) |
| 13. Being married to someone who makes more money than you (Subordination to women) |
| 16. Losing in a sports competition (Physical inadequacy) |
| 17. Admitting that you are afraid of something (Emotional inexpressiveness) |
| 18. Being with a woman who is more successful than you (Subordination to women) |
| 21. Being perceived as having feminine traits (Physical inadequacy) |
| 22. Having your children see you cry (Emotional inexpressiveness) |
| 23. Being outperformed in a game by a woman (Subordination to women) |
| 24. Having people say that you are indecisive (Intellectual inferiority) |
| 26. Appearing less athletic than a friend (Physical inadequacy) |
| 29. Having others say that you are too emotional (Intellectual inferiority) |
| 31. Being compared unfavorably to other men (Physical inadequacy) |
| 35. Getting passed over for a promotion (Performance failure) |
Note: From “Masculine Gender Role Stress (MGRS) Rating Scale: Reprint of Measure, Scoring Instructions, and Conditions of Use” by J. R. Skidmore (2008; 1988), Unpublished Manuscript. Copyright (1988) Jay R. Skidmore. Reprinted with permission.
Footnotes
The MGRS scale was first printed and copyrighted in a doctoral dissertation by Jay R. Skidmore [Skidmore, J.R. (1988). Cardiovascular reactivity in men as a function of masculine gender role stress, type-A behavior and hostility. Doctoral Dissertation, Psychology Department, Virginia Tech]. The initial publication by Eisler and Skidmore (1987) included MGRS items in its appendix, but not the scale itself. Subsequently the MGRS Rating Scale has been reprinted with scoring instructions by its authors for use by other researchers, the most recent reprint being by Skidmore (2008). Both printings of the MGRS scale are identical. For permission to use the full or abbreviated MGRS scale, please contact Jay R. Skidmore, Ph.D., Professor of Clinical Psychology, Seattle Pacific University; skidmore@spu.edu.
Some participants completed these measures on a computer using MediaLab 2000 software (Jarvis, 2006).
Nunnally (1967; 1978) suggests alpha reliabilities between .70–.80 and above .80 are acceptable and good to excellent, respectively. Despite a weaker alpha reliability coefficient, the Danger as Exciting subscale was retrained to permit comprehensive analysis.
Even though sub-scales in a measure may be present, IRT assumptions state that there must be evidence that the construct being measured can be observed as a single continuous factor (i.e., a common factor). This can be demonstrated by a higher factor 1 to factor 2 ratio (Embretson & Reise, 2000). It is common practice in the IRT literature to examine uni-dimensionality of a multi-dimensional questionnaire/construct in this way (Cohn, Hagman, Graff, & Noel, 2011; Hagman & Cohn, 2011; Embretson & Reise, 2000; Neal et al., 2006; Walters, Hagman, & Cohn, 2011).
Contributor Information
Kevin M. Swartout, Georgia State University
Dominic J. Parrott, Georgia State University
Amy M. Cohn, LEGACY, The Schroeder Institute for Tobacco Research and Policy Studies
Brett T. Hagman, National Institute on Alcohol Abuse and Alcoholism
Kathryn E. Gallagher, Georgia State University
References
- Asparouhov T, Muthén B. Exploratory structural equation modeling. Structural Equation Modeling. 2009;16(3):397–438. [Google Scholar]
- Blanchard KA, Morgenstern J, Morgan TJ, Labouvie EW, Bux DA. Assessing consequences of substance use: Psychometric properties of the Inventory of Drug Use Consequences. Psychology of Addictive Behaviors. 2003;17(4):328–331. doi: 10.1037/0893-164X.17.4.328. [DOI] [PubMed] [Google Scholar]
- Chan AWK, Pristach EA, Welte JW. Detection of alcoholism in three populations by the Brief-MAST. Alcoholism: Clinical and Experimental Research. 2006;18(3):695–701. doi: 10.1111/j.1530-0277.1994.tb00933.x. [DOI] [PubMed] [Google Scholar]
- Cohn AM, Hagman BT, Graff FS, Noel NE. Modeling the severity of drinking consequences in first-year college women: an item response theory analysis of the rutgers alcohol problem index. Journal of studies on alcohol and drugs. 2011;72(6):981–990. doi: 10.15288/jsad.2011.72.981. [DOI] [PMC free article] [PubMed] [Google Scholar]
- Cohn AM, Seibert L, Zeichner A. The role of restrictive emotionality, trait anger, and masculinity threat in men’s perpetration of physical aggression. Psychology of Men and Masculinity. 2009;10(3):218–224. [Google Scholar]
- Cohn AM, Zeichner A. Effects of masculine identity and gender role stress on aggression in men. Psychology of Men & Masculinity. 2006;7:179–190. [Google Scholar]
- Doyle SR, Donovan DM. A validation study of the Alcohol Dependence Scale. Journal of studies on alcohol and drugs. 2009;70(5):689–699. doi: 10.15288/jsad.2009.70.689. [DOI] [PMC free article] [PubMed] [Google Scholar]
- Edelen MO, Reeve BB. Applying item response theory (IRT) mdoeling to questionnaire development, evaluation, and refinement. Quality of Life Research. 2007;16:5–18. doi: 10.1007/s11136-007-9198-0. [DOI] [PubMed] [Google Scholar]
- Efthim PW, Mahalik JR, Kenny ME. Gender role stress in relation to shame, guilt, and externalization. Journal of Counseling & Development. 2001;79(4):430–438. [Google Scholar]
- Eisler RM. The relationship between masculine gender role stress and men’s health risk: The validation of a construct. In: Levant R, Pollack W, editors. A new psychology of men. New York: BasicBooks; 1995. pp. 207–225. [Google Scholar]
- Eisler RM, Franchina JJ, Moore TM, Honeycutt HG, Rhatigan DL. Masculine gender role stress and intimate abuse: Effects of gender relevance of conflict situations on men’s attributions and affective responses. Psychology of Men & Masculinity. 2000;1(1):30–36. [Google Scholar]
- Eisler RM, Skidmore JR. Masculine gender role stress: Scale development and component factors in the appraisal of stressful situations. Behavior Modification. 1987;11(2):123–136. doi: 10.1177/01454455870112001. [DOI] [PubMed] [Google Scholar]
- Eisler RM, Skidmore JR, Ward CH. Masculine gender-role stress: Predictor of anger, anxiety, and health-risk behaviors. Journal of Personality Assessment. 1988;52(1):133–141. doi: 10.1207/s15327752jpa5201_12. [DOI] [PubMed] [Google Scholar]
- Embretson SE. The new rules of measurement. Psychological Assessment. 1996;8(4):341–349. [Google Scholar]
- Embretson S, Reise S. Item response theory for psychologists. Mahwah, NJ: Erlbaum; 2000. [Google Scholar]
- Franchina JJ, Eisler RM, Moore TM. Masculine gender role stress and intimate abuse: Effects of masculine gender relevance of dating situations and female threat on men’s attributions and affective responses. Psychology of Men & Masculinity. 2001;2(1):34–41. [Google Scholar]
- Gallagher KE, Parrott DJ. What accounts for men’s hostile attitudes toward women? The Influence of hegemonic male Role norms and masculine gender role stress. Violence Against Women. 2011;17(5):568–583. doi: 10.1177/1077801211407296. [DOI] [PMC free article] [PubMed] [Google Scholar]
- Greenberg ST, Chuick CD, Shepard SJ, Cochran SV. Clinical and personality features of depressed college males: An exploratory investigation. International Journal of Men’s Health. 2009;8(2):169–177. [Google Scholar]
- Hagman BT, Cohn AM. Toward DSM-V: mapping the alcohol use disorder continuum in college students. Drug and alcohol dependence. 2011;118(2):202–208. doi: 10.1016/j.drugalcdep.2011.03.021. [DOI] [PMC free article] [PubMed] [Google Scholar]
- Hambleton RK, Robin F, Xing D. Item response models for the analysis of educational and psychological test data. In: Tinsley HA, Brown SD, editors. Handbook of applied multivariate statistics and mathematical modeling. San Diego, CA: Academic Press; 2000. pp. 553–581. [Google Scholar]
- Hattie J. Methodology review: Assessing unidimensionality of tests and items. Applied Psychological Measurement. 1985;9(2):139–164. [Google Scholar]
- Haukkala A, Konttinen H, Laatikainen T, Kawachi I, Uutela A. Hostility, anger control, and anger expression as predictors of cardiovascular disease. Psychosomatic medicine. 2010;72(6):556–562. doi: 10.1097/PSY.0b013e3181dbab87. [DOI] [PubMed] [Google Scholar]
- Herek GM. Beyond “homophobia”: A social psychological perspective on attitudes toward lesbians and gay men. Journal of Homosexuality. 1984;10:1–21. doi: 10.1300/J082v10n01_01. [DOI] [PubMed] [Google Scholar]
- Herek GM. Assessing attitudes toward lesbians and gay men: A review of empirical research with the ATLG scale. In: Greene B, Herek GM, editors. Lesbian and gay psychology. Thousand Oaks, CA: Sage; 1994. pp. 206–228. [Google Scholar]
- Hu LT, Bentler PM. Cutoff criteria for fit indexes in covariance structure analysis: Conventional criteria versus new alternatives. Structural Equation Modeling. 1999;6(1):1–55. [Google Scholar]
- Isenhart CE. Masculine gender role stress in an inpatient sample of alcohol abusers. Psychology of Addictive Behaviors. 1993;7(3):177–184. [Google Scholar]
- Jakupcak M. Masculine gender role stress and men’s fear of emotions as predictors of self-reported aggression and violence. Violence and Victims. 2003;18(5):533–541. doi: 10.1891/vivi.2003.18.5.533. [DOI] [PubMed] [Google Scholar]
- Jakupcak M, Lisak D, Roemer L. The role of masculine ideology and masculine gender role stress in men’s perpetration of relationship violence. Psychology of Men & Masculinity. 2002;3(2):97–106. [Google Scholar]
- Jarvis BG. MediaLab (Version 2006.1.41) [Computer Software] New York, NY: Empirisoft Corporation; 2006. [Google Scholar]
- Lash SJ, Copenhaver MM, Eisler RM. Masculine gender role stress and substance abuse among substance dependent males. Journal of Gender, Culture, and Health. 1998;3(3):183–191. [Google Scholar]
- Lash SJ, Eisler RM, Schulnian RS. Cardiovascular reactivity to stress in men. Behavior Modification. 1990;14(1):3–20. doi: 10.1177/01454455900141001. [DOI] [PubMed] [Google Scholar]
- MacKenzie DM, Langa A, Brown TM. Identifying hazardous or harmful alcohol use in medical admissions: A comparison of audit, cage and brief mast. Alcohol and Alcoholism. 1996;31(6):591–599. doi: 10.1093/oxfordjournals.alcalc.a008195. [DOI] [PubMed] [Google Scholar]
- Mahalik JR, Locke BD, Ludlow LH, Diemer MA, Scott RPJ, Gottfried M, Freitas G. Development of the Conformity to Masculine Norms Inventory. Psychology of Men & Masculinity. 2003;4(1):3–25. [Google Scholar]
- McCreary DR, Newcomb MD, Sadava SW. Dimensions of the male gender role: A confirmatory analysis in men and women. Sex roles. 1998;39(1):81–95. [Google Scholar]
- McCreary DR, Newcomb MD, Sadava SW. The male role, alcohol use, and alcohol problems: A structural modeling examination in adult women and men. Journal of Counseling Psychology. 1999;46(1):109–124. [Google Scholar]
- McCreary DR, Wong FY, Wiener W, Carpenter KM, Engle A, Nelson P. The relationship between masculine gender role stress and psychological adjustment: A question of construct validity? Sex roles. 1996;34(7):507–516. [Google Scholar]
- McDermott MJ, Tull MT, Soenke M, Jakupcak M, Gratz KL. Masculine gender role stress and posttraumatic stress disorder symptom severity among inpatient male crack/cocaine users. Psychology of Men & Masculinity. 2010;11(3):225–232. [Google Scholar]
- Monk D, Ricciardelli LA. Three dimensions of the male gender role as correlates of alcohol and cannabis involvement in young Australian men. Psychology of Men & Masculinity. 2003;4(1):57–69. [Google Scholar]
- Moore TM, Stuart GL. Effects of masculine gender role stress on men’s cognitive, affective, physiological, and aggressive responses to intimate conflict situations. Psychology of Men and Masculinity. 2004;5(2):132–142. [Google Scholar]
- Moore TM, Stuart GL, McNulty JK, Addis ME, Cordova JV, Temple JR. Domains of masculine gender role stress and intimate partner violence in a clinical sample of violent men. Psychology of Men & Masculinity. 2008;9(2):82–89. [Google Scholar]
- Mosher DL, Sirkin M. Measuring a macho personality constellation. Journal of Research in Personality. 1984;18(2):150–163. [Google Scholar]
- Muraki E, Bock R. PARSCALE (Version 4.1)[Computer software] Lincolnwood, IL: Scientific Software International; 2002. [Google Scholar]
- Muthén B, Kaplan D, Hollis M. On structural equation modeling with data that are not missing completely at random. Psychometrika. 1987;52:431–462. [Google Scholar]
- Muthén LK, Muthén BO. Mplus (version 6) [computer software] Los Angeles, CA: Muthén & Muthén; 1998–2010. [Google Scholar]
- National Institute on Alcohol Abuse and Alcoholism. National Council on Alcohol Abuse and Alcoholism recommended sets of alcohol consumption questions. 2003 Retrieved on March 12, 2014, from http://www.niaaa.nih.gov/research/guidelines-and-resources/recommended-alcohol-questions.
- Neal D, Corbin W, Fromme K. Measurement of alcohol-related consequences among high school and college students: application of item response models to the Rutgers Alcohol Problem Index. Psychological assessment. 2006;18(4):402–414. doi: 10.1037/1040-3590.18.4.402. [DOI] [PubMed] [Google Scholar]
- Nunnally JC. Psychometric theory. 1. New York, NY: McGraw-Hill; 1967. [Google Scholar]
- Nunnally JC. Psychometric theory. 2. New York, NY: McGraw-Hill; 1978. [Google Scholar]
- Parrott DJ. Aggression toward gay men as gender role enforcement: Effects of male role norms, sexual prejudice, and masculine gender role stress. Journal of Personality. 2009;77(4):1137–1166. doi: 10.1111/j.1467-6494.2009.00577.x. [DOI] [PMC free article] [PubMed] [Google Scholar]
- Parrott DJ, Gallagher KE, Vincent W, Bakeman R. The link between alcohol use and aggression toward sexual minorities: An event-based analysis. Psychology Of Addictive Behaviors. 2010;24(3):516–521. doi: 10.1037/a0019040. [DOI] [PMC free article] [PubMed] [Google Scholar]
- Parrott DJ, Giancola PR. A further examination of the relation between trait anger and alcohol-related aggression: The role of anger control. Alcoholism: Clinical and Experimental Research. 2004;28(6):855–864. doi: 10.1097/01.alc.0000128226.92708.21. [DOI] [PubMed] [Google Scholar]
- Parrott DJ, Peterson JL, Bakeman R. Determinants of aggression toward sexual minorities in a community sample. Psychology of Violence. 2011;1(1):41–52. doi: 10.1037/a0021581. [DOI] [PMC free article] [PubMed] [Google Scholar]
- Parrott DJ, Peterson JL, Vincent W, Bakeman R. Correlates of anger in response to gay men: Effects of male gender role beliefs, sexual prejudice, and masculine gender role stress. Psychology of Men & Masculinity. 2008;9(3):167–178. [Google Scholar]
- Parrott DJ, Zeichner A. Effects of hypermasculinity on physical aggression toward women. Psychology of Men & Masculinity. 2003;4(1):70–78. [Google Scholar]
- Pokorny M, Miller B, Kaplan H. The Brief MAST: A shortened version of the Michigan Alcoholism Screening Test. American Journal of Psychiatry. 1972;129:118–121. doi: 10.1176/ajp.129.3.342. [DOI] [PubMed] [Google Scholar]
- Reeve BB. Item response theory modeling in health outcomes measurement. Expert Review of Pharmacoeconomics and Outcomes Research. 2003;3(2):131–145. doi: 10.1586/14737167.3.2.131. [DOI] [PubMed] [Google Scholar]
- Saurer MK, Eisler RM. The role of masculine gender role stress in expressivity and social support network factors. Sex Roles. 1990;23(5):261–271. [Google Scholar]
- Selzer ML. The Michigan Alcoholism Screening Test: The quest for a new diagnostic instrument. American Journal of Psychiatry. 1971;127:1653–1658. doi: 10.1176/ajp.127.12.1653. [DOI] [PubMed] [Google Scholar]
- Skidmore JR. Masculine Gender Role Stress (MGRS) Rating Scale: Reprint of Measure, Scoring Instructions, and Conditions of Use. 2008, 1988 Unpublished manuscript available from the author at skidmore@spu.edu or drskidmore@yahoo.com. [Google Scholar]
- Skinner HA, Allen BA. Alcohol dependence syndrome: measurement and validation. Journal of Abnormal Psychology. 1982;91(3):199–209. doi: 10.1037//0021-843x.91.3.199. [DOI] [PubMed] [Google Scholar]
- Sobell LC, Sobell MB. Alcohol consumption measures. In: Allen P, Wilson VB, editors. Assessing alcohol problems: A guide for clinicians and ressearchers. 2. Bethesda, MD: National Institute of Alcohol Abuse and Alcoholism; 2003. pp. 75–99. [Google Scholar]
- Spielberger C. Professional manual for the state-trait anger expression inventory (STAXI) Tampa, FL: Psychological Assessment Resources, Inc; 1988. Research. [Google Scholar]
- Thompson EH, Pleck JH. The structure of male role norms. American Behavioral Scientist. 1986;29:531–543. [Google Scholar]
- Thompson EH, Pleck JH. Masculinity ideologies: A review of research instrumentation on men and masculinities. In: Levant R, Pollack W, editors. A new psychology of men. New York, NY: Basic Books; 1995. pp. 129–163. [Google Scholar]
- Van Honk J, Tuiten A, de Haan E, Vann de Hout M, Stam H. Attentional biases for angry faces: Relationships to trait anger and anxiety. Cognition & Emotion. 2001;15(3):279–297. [Google Scholar]
- Vincent W, Parrott DJ, Peterson JL. Effects of traditional gender role norms and religious fundamentalism on self-identified heterosexual men’s attitudes, anger, and aggression toward gay men and lesbians. Psychology Of Men & Masculinity. 2011;12(4):383–400. doi: 10.1037/a0023807. [DOI] [PMC free article] [PubMed] [Google Scholar]
- Walters GD, Hagman BT, Cohn AM. Toward a hierarchical model of criminal thinking: Evidence from item response theory and confirmatory factor analysis. Psychological Assessment. 2011;23:925–936. doi: 10.1037/a0024017. [DOI] [PubMed] [Google Scholar]
- Watkins PL, Eisler RM, Carpenter L, Schechtman KB, Fisher EB. Psychosocial and physiological correlates of male gender role stress among employed adults. Behavioral Medicine. 1991;17(2):86–90. doi: 10.1080/08964289.1991.9935163. [DOI] [PubMed] [Google Scholar]
- Wills G, Crawford R. Attitudes toward homosexuality in Shreveport-Bossier City, LA. Journal of Homosexuality. 2000;38:97–116. doi: 10.1300/j082v38n03_06. [DOI] [PubMed] [Google Scholar]
- Yang AS. The polls-trends: Attitudes toward homosexuality. Public Opinion Quarterly. 1997;61:477–507. [Google Scholar]
- Zumbo BD. Three generations of DIF analyses: Considering where it has been, where it is now, and where it is going. Language Assessment Quarterly. 2007;4(2):223–233. [Google Scholar]