

Abstract
Modification of spatial attention via reinforcement learning (Lee and Shomstein, 2013) requires the integration of reward, attention, and executive processes. Corticostriatal pathways are an ideal neural substrate for this integration because these projections exhibit a globally parallel (Alexander et al., 1986), but locally overlapping (Haber, 2003), topographical organization. Here we explore whether there are unique striatal regions that exhibit convergent anatomical connections from orbitofrontal cortex, dorsolateral prefrontal cortex, and posterior parietal cortex. Deterministic fiber tractography on diffusion spectrum imaging data from neurologically healthy adults (N = 60) was used to map frontostriatal and parietostriatal projections. In general, projections from cortex were organized according to both a medial–lateral and a rostral–caudal gradient along the striatal nuclei. Within rostral aspects of the striatum, we identified two bilateral convergence zones (one in the caudate nucleus and another in the putamen) that consisted of voxels with unique projections from orbitofrontal cortex, dorsolateral prefrontal cortex, and parietal regions. The distributed cortical connectivity of these striatal convergence zones was confirmed with follow-up functional connectivity analysis from resting state fMRI data, in which a high percentage of structurally connected voxels also showed significant functional connectivity. The specificity of this convergent architecture to these regions of the rostral striatum was validated against control analysis of connectivity within the motor putamen. These results delineate a neurologically plausible network of converging corticostriatal projections that may support the integration of reward, executive control, and spatial attention that occurs during spatial reinforcement learning.
Keywords: diffusion imaging and fMRI, executive function, reinforcement learning, reward, spatial attention, striatum
Introduction
It is well known that contextual factors, such as cue/target proximity within the same bounded object, can bias bottom-up visuospatial attention (Posner et al., 1980; Egeth and Yantis, 1997). Recent research has shown that placing a high reward on certain targets can override this intrinsic spatial attention bias (Della Libera and Chelazzi, 2006; Kristjánsson et al., 2010; Lee and Shomstein, 2013, 2014). The abrogating influence of reward feedback on intrinsic spatial attention is consistent with the idea that reinforcement learning (Sutton and Barto, 1998) alters the bottom-up influences of stimulus features on attentional allocation during spatial decision making.
Functionally, reinforcement learning depends on the striatum (Graybiel, 1995; Knutson et al., 2000; Dayan and Abbott, 2001; O'Doherty, 2004; Daw and Doya, 2006). Although many studies focus on the role of the ventral striatum in reinforcement learning (Pagnoni et al., 2002; O'Doherty et al., 2003; McClure et al., 2004; Rodriguez et al., 2006), evidence of dorsomedial caudate involvement in reward-based responses suggests a more global involvement of striatal systems in behavioral updating (Delgado et al., 2003, 2005; Knutson and Cooper, 2005; Kuhnen and Knutson, 2005; Lohrenz et al., 2007). This recruitment of distributed striatal systems may reflect an integration of multiple, disparate signals during learning. Indeed, although the striatum is generally viewed as a central integration point of cortical information within strictly closed, but parallel, circuits (Alexander et al., 1986), there is a growing body of evidence for overlap from spatially disparate cortical areas (Haber, 2003; Averbeck et al., 2014). This diffuse overlap of corticostriatal projections has been proposed as an explicit substrate for reinforcement learning that directly integrates reward and executive control signals from the orbitofrontal cortex (OFC) and dorsolateral prefrontal cortex (DLPFC), respectively (for review, see Haber and Knutson, 2010).
Introducing signals from regions that support visuospatial processing into this striatal integration process may be one mechanism by which reinforcement learning can be applied to spatial attention. Visuospatial attention is generally associated with the posterior parietal cortex in humans and nonhuman primates (for review, see Critchely, 1953; Colby and Goldberg, 1999; Silver et al., 2005). Nonhuman primate histology research has shown a topography of parietostriatal connectivity in which posterior parietal projections terminate in distributed clusters along the caudate nucleus, proximal to OFC and DLFPC projection termination sites (Selemon and Goldman-Rakic, 1985, 1988; Cavada and Goldman-Rakic, 1991). This proximity of DLPFC and parietal connectivity has also recently been confirmed functionally in humans (Di Martino et al., 2008; Choi et al., 2012); however, the specific pattern of convergent inputs from parietal, DLPFC, and OFC areas has yet to be confirmed.
To this end, we used diffusion spectrum imaging (DSI) and resting state fMRI to explore a neurologically plausible network of converging projections in the striatum that may support the integration of information from OFC, DLPFC, and posterior parietal areas. The presence of convergent corticostriatal inputs would provide necessary evidence for a structurally and functionally integrative network that underlies mechanisms of spatial reinforcement learning.
Materials and Methods
Participants.
Sixty participants (28 male, 32 female) were recruited locally from the Pittsburgh, Pennsylvania area as well as the Army Research Laboratory in Aberdeen, Maryland. Participants were neurologically healthy adults with no history of head trauma, neurological or psychological pathology. Participant ages ranged from 18 to 45 years old (mean age, 26.5 years). Informed consent, approved by the Institutional Review Board at Carnegie Mellon University and in compliance with the Declaration of Helsinki, was obtained for all participants. Participants were all financially compensated for their time.
MRI acquisition.
All 60 participants were scanned at the Scientific Imaging and Brain Research Center at Carnegie Mellon University on a Siemens Verio 3T magnet fitted with a 32-channel head coil. An MPRAGE sequence was used to acquire a high-resolution (1 mm3 isotropic voxels, 176 slices) T1-weighted brain image for all participants. DSI data was acquired following fMRI sequences using a 50 min, 257-direction, twice-refocused spin-echo EPI sequence with multiple q values (TR = 11,400 ms, TE = 128 ms, voxel size = 2.4 mm3, field of view = 231 × 231 mm, b-max = 5000 s/mm2, 51 slices). Resting state fMRI (rsfMRI) data consisting of 210 T2*-weighted volumes were collected for each participant with a BOLD contrast with echo planar imaging (EPI) sequence (TR = 2000 ms, TE = 29 ms, voxel size = 3.5 mm3, field of view = 224 × 224 mm, flip angle = 79°). Head motion was minimized during image acquisition with a custom foam padding setup designed to minimize the variance of head motion along the pitch and yaw rotation directions. The setup also included a chin restraint that held the participant's head to the receiving coil itself. Preliminary inspection of EPI images at the imaging center showed that the setup minimized resting head motion to ∼1 mm maximum deviation for most subjects.
Diffusion MRI reconstruction.
DSI Studio (http://dsi-studio.labsolver.org) was used to process all DSI images using a q-space diffeomorphic reconstruction method (Yeh and Tseng, 2011). A nonlinear spatial normalization approach (Ashburner and Friston, 1999) was implemented through 16 iterations to obtain the spatial mapping function of quantitative anisotropy (QA) values from individual subject diffusion space to the FMRIB 1 mm fractional anisotropy (FA) atlas template. QA is an orientation distribution function (ODF) based index that is scaled with spin density information that permits the removal of isotropic diffusion components from the ODF to filter false peaks, facilitating deterministic fiber tractography resolution. For a detailed description and comparison of QA with standard FA techniques, see Yeh et al. (2013). The ODFs were reconstructed to a spatial resolution of 2 mm3 with a diffusion sampling length ratio of 1.25. Whole-brain ODF maps of all 60 subjects were averaged to generate a template image of the average tractography space.
Fiber tractography and analysis.
Fiber tractography was performed using an ODF-streamline version of the FACT algorithm (Yeh et al., 2013) in DSI Studio (September 23, 2013 and August 29, 2014 builds). All fiber tractography was initiated from seed positions with random locations within the whole-brain seed mask with random initial fiber orientations. Using a step size of 1 mm, the directional estimates of fiber progression within each voxel were weighted by 80% of the incoming fiber direction and 20% of the previous moving direction. A streamline was terminated when the QA index fell below 0.05 or had a turning angle >75°.
Fiber tractography was performed in several stages. First, using the group averaged template brain, we tracked 100,000 streamlines that terminated anywhere within a striatal region of interest mask (ROI). To generate this mask, caudate nucleus and putamen masks from the SRI24 multichannel atlas (Rohlfing et al., 2010) were merged and then expanded by one voxel (2 mm) in all directions. This tractography experiment was performed to visualize the gradients of connectivity within the striatum (see Topography of corticostriatal projections).
After this analysis, we performed ROI-based tractography to isolate streamlines between pairs of ipsilateral cortical and striatal masks. All cortical masks were selected from the SRI24 multichannel atlas. Diffusion-based tractography has been shown to exhibit a strong medial bias (Croxson et al., 2005) due to partial volume effects and poor resolution of complex fiber crossings (Jones and Cercignani, 2010). To counter the bias away from more lateral cortical regions, tractography was generated for each cortical surface mask separately. Twenty-six cortical surface masks (13 per hemisphere) in the frontal and parietal lobes were selected from the SRI24 multichannel atlas as targets for corticostriatal tractography, including: gyrus rectus (Rectus); ventromedial prefrontal cortex (Frontal_Med_Orb); opercular, orbital, and triangular parts of the inferior frontal gyrus (Frontal_Inf_Oper, Frontal_Inf_Orb, Frontal_Inf_Tri); dorsal and orbital middle and superior frontal gyri (Frontal_Mid, Frontal_Mid_Orb, Frontal_Sup, Frontal_Sup_Orb); superior and inferior parietal lobules (Parietal_Sup, Parietal_Inf); angular gyrus (Angular) and supramarginal gyrus (SupraMarginal). The same striatal ROI mask was used as in the first tractography run. The QA threshold was set to 0.04 for tracking streamlines from the dorsal middle frontal gyri (Frontal_Mid) due to detection of significantly fewer corticostriatal projections than expected (Verstynen et al., 2012). Each cortical surface ROI mask was paired with an ipsilateral striatum ROI mask, which were both designated as ends in DSI Studio, and whole-brain seeded tractography continued for 3 × 10⁸ seeds (∼3000 samples per voxel in the whole-brain mask). To be included in the final dataset, streamlines had to (1) have a length <120 mm and (2) terminate in the cortical surface mask at one end and within the ipsilateral striatum mask at the other. All cortical surface ROI masks were also paired with the contralateral striatum masks. Streamlines were generated for all datasets using the same tracking parameters previously described and a maximum length constraint of 180 mm to capture longer interhemispheric projections.
Then, to facilitate further analyses, streamlines from the ROI pairings in each hemisphere were combined into three meta-regions. The OFC meta-region was comprised of streamlines from medial and lateral OFC, including: gyrus rectus (Rectus), the orbital part of the inferior frontal gyrus (Frontal_Inf_Orb) and middle (Frontal_Mid_Orb) and superior frontal (Frontal_Sup_Orb) gyri. The DLPFC meta-region consisted of streamlines from opercular (Frontal_Inf_Oper) and triangular (Frontal_Inf_Tri) parts of the inferior frontal gyrus, as well as middle (Frontal_Mid) and superior frontal (Frontal_Sup) gyri. Streamlines from the superior (Parietal_Sup) and inferior parietal lobules (Parietal_Inf), angular gyrus (Angular), and supramarginal gyrus (SupraMarginal) constituted the parietal meta-region. For a more complete assessment of the cortical and striatal topographic organization of the endpoint distributions of the OFC, DLPFC and parietal meta-regions were reconstructed.
To confirm the pattern of connectivity observed through the constrained ROI-based approach, a final tractography (see Fig. 4) analysis was performed by reseeding from a whole-brain mask with each convergence zone designated as an end. This was repeated separately for all four convergence zone masks across all 60 datasets. Tracking proceeded until a total of 50,000 fibers were detected, rather than 3 × 10⁸ seeds.
Figure 4.

Cortical endpoint density maps of tractography into each convergence zone mask on template brain. Streamlines were tracked from a whole-brain seed to individual three-way convergence zone masks. Maps show cortical and subcortical regions with consistent (all t(59) values > 2.75, uncorrected p < 0.004) endpoint projections into each convergence zone across all subjects: blue represents left caudate; red represents left putamen; yellow represents right caudate; cyan represents right putamen. Connections with the putamen convergence zone originate from a much larger and more distributed set of cortical areas than those with caudate convergence zone. Overlapping structural connectivity from ipsilateral caudate and putamen convergence zones in OFC, DLPFC, and parietal cortex areas is shown as purple in the left hemisphere and white in the right hemisphere.
Approximate motor projections into the striatum were used as a control pathway. These were estimated using the precentral gyrus (Precentral) masks from the SRI24 multichannel atlas. The precentral gyrus masks were designated as endpoint masks paired with ipsilateral and contralateral striatum masks for tracking streamlines using the same parameters described above, across all individual datasets. A single cluster of contiguous voxels was isolated from each putamen in all datasets to create mean striatal precentral clusters.
Striatal and cortical endpoint distribution analysis.
The primary tractography variable of interest was the distribution of streamline endpoints. We looked at these endpoints in two separate ways. First, to capture the major gradients of corticostriatal pathway organization, we labeled each of the 100,000 streamlines from the first tractography run based on the position of its endpoint within the striatum mask according to two gradients: medial–lateral (x position) and rostral–caudal (y position). Each streamline was then color-coded according to its position in each gradient separately and visualized at the whole-brain level (see Fig. 1).
Figure 1.
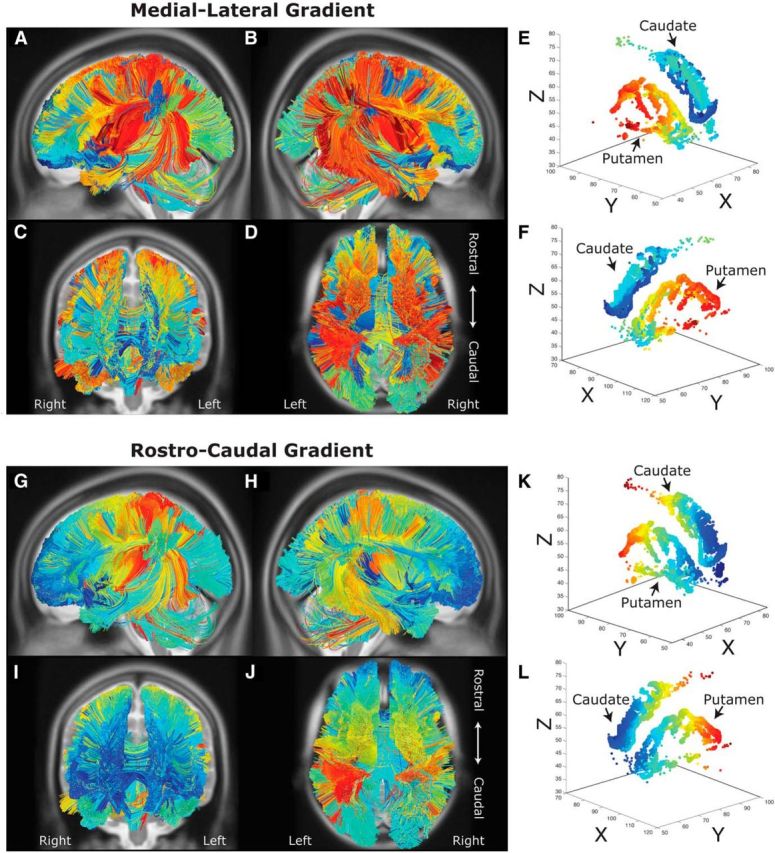
Tractography analysis of medial–lateral (A–F) and rostral–caudal (G–L) striatal topography in the average participant template brain. Streamlines were tracked from whole-brain seeds to caudate and putamen masks. A–F, Cooler colors represent streamlines that terminate more medially, whereas warmer colors represent those that terminate more laterally. Along medial–lateral orientation, spatially proximal cortical areas project to similar locations within the striatum. G–L, Cooler colors represent streamlines that terminate in more rostral areas, whereas warmer colors represent streamlines that terminate in more caudal striatal areas.
Next, we looked at the distribution of densities of endpoints, across datasets, within each voxel at the subcortical and cortical levels. Custom MATLAB functions were used to generate four striatal endpoint density maps (i.e., convergence zones; see Figs. 3 and 4) where all cortical meta-regions yielded overlapping projections within ipsilateral striatum. First, the 3D coordinates of the streamline projection endpoints from each meta-region in the caudate nucleus and putamen within each hemisphere were extracted. To obtain matrices of striatal endpoint coordinates for each meta-region for all datasets, a mask for each caudate nucleus and putamen were loaded separately into MATLAB with streamlines from each ipsilateral cortical region. A one-sample t test was used to calculate maps of endpoint densities for each set of streamlines from the individual density maps. Significance was calculated with an FDR-corrected threshold (q) <0.05 to identify striatal voxels with projection endpoints from each meta-region that were consistent across all datasets.
Figure 3.

Coronal slice images and 3D representations of mean convergence and nonconvergence zone masks within bilateral caudate nucleus and putamen. A, Coronal slice view of three-way (left column) and two-way (middle three columns) convergence zone, and striatal motor (right column) nonconvergence zone masks on T1-weighted MNI-space brain. Three-way and two-way convergence zones (four left columns) were isolated in both striatal nuclei bilaterally: blue represents left caudate; red represents left putamen; yellow represents right caudate; cyan represents right putamen. Nonconvergence zones (right column) are restricted to regions of putamen (left, red; right, cyan) that received projections from ipsilateral precentral gyrus. All striatal masks consist of single clusters of significant (all t(59) values > 2.75, FDR-corrected q < 0.05) contiguous voxels (cluster size k > 20) with streamline endpoints from the cortical areas indicated above each column. Three-way convergence zones are smaller in volume than two-way convergence zones and are located more rostrally in striatal nuclei than nonconvergence zones. B, 3D surface visualizations of three-way convergence zones.
Striatal endpoints were then extracted and saved as a new mask, resulting in a three-way convergence zone representing the total volume of contiguous voxels (cluster size k > 20) within each nucleus where termination points of projections from the OFC, DLPFC, and parietal meta-regions were detected. This was done for both caudate nuclei and putamen, resulting in four (left caudate, left putamen, right caudate, and right putamen) convergence zone masks. Convergence zone masks for each nucleus were then used to calculate maps of the mean convergence zone as well as to assess the consistency and significance of convergence zone volumes across all 60 datasets. The significance at each convergence zone was calculated using a one-sample t test with a q < 0.05. For comparison, two-way pairwise convergence zones masks (i.e., OFC + DLPFC, DLPFC + Parietal, and Parietal + OFC) were also created in the same fashion as the three-way convergence zones masks.
After the convergence zones were isolated, cortical endpoint coordinates were extracted from the reseeded tracking described in Fiber tractography and analysis. Streamlines between each convergence zone and the whole-brain seed across all datasets were loaded into MATLAB, and the endpoints were saved as masks. A one-sample t test was conducted to identify significant voxels throughout the brain that had consistent structural connectivity with each of the convergence zones.
Resting state fMRI preprocessing and analyses.
SPM8 (Wellcome Department of Imaging Neuroscience, London) was used to preprocess all rsfMRI collected from 55 of the 60 participants with DSI data. To estimate the normalization transformation for each EPI image, the mean EPI image was first selected as a source image and weighted by its mean across all volumes. Then, an MNI-space EPI template supplied with SPM was selected as the target image for normalization. The source image smoothing kernel was set to a FWHM of 4 mm, and all other estimation options were kept at the SPM8 defaults to generate a transformation matrix that was applied to each volume of the individual source images for further analyses.
The convergence zones and striatal precentral clusters obtained from the tractography analyses were used as seed points for the functional connectivity analysis. A series of custom MATLAB functions were used to do the following: (1) extract the voxel time series of activity for each convergence zone, (2) remove estimated noise from the time series by selecting the first five principle components from the SRI24 tissues white matter and CSF masks, and (3) calculate t and p values of consistent activity with corresponding significance. rsfMRI data were analyzed using AFNI (Cox, 1996) to calculate functional activity throughout the brain correlated with each convergence zone and striatal precentral cluster seed in accordance with previously used methods (Choi et al., 2012). Specifically, functional activity correlations (r) were converted to Z-scores using Fisher's r-to-Z transformation for each convergence zone and striatal precentral cluster across all 55 datasets.
First, a convergence zone or striatal precentral cluster mask was loaded into MATLAB 8.1/R2013a (MathWorks) with an individual participant's rsfMRI time series data. The time series of activity corresponding with the volume of the mask was extracted, yielding activity values for each voxel in the mask across all 210 volumes of the rsfMRI BOLD EPI sequence. Next, the time series was denoised by regressing the first five principal components of estimated noise from the white matter and CSF voxels out of the total time series activity. Once denoised, the data were smoothed with a Gaussian kernel (FWHM = 2 mm) and a one-sample t test was run to identify consistent, significant functional activity correlated with the time series across all 55 datasets. Corresponding FDR-corrected values of q < 0.05 were also calculated to create maps of significant functional activity for each convergence zone and striatal precentral cluster mask (see Fig. 5).
Figure 5.
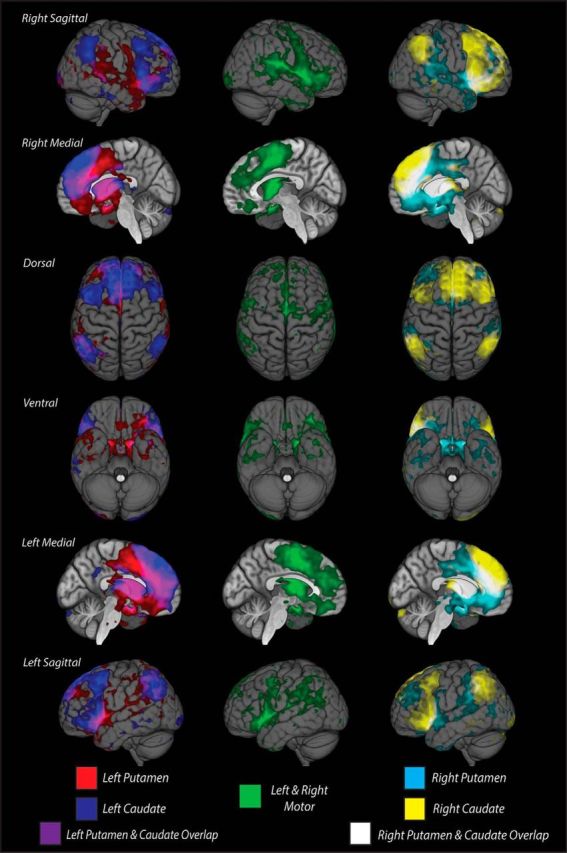
Resting state fMRI maps of functional connectivity of convergence and nonconvergence zones with the whole brain after adjusting for multiple comparisons. Correlations from individual resting state datasets (N = 55) were normalized using Fisher's r-to-Z transformation, and group maps were calculated using a one-sample t test with an FDR-corrected q value < 0.05. Both caudate convergence zone maps were thresholded at Z(r) = 0.03–0.10, and putamen convergence and nonconvergence zone maps were thresholded at Z(r) = 0.05–0.10. Overlaid cortical activity patterns show correlated functional connectivity with the left (left column; blue represents caudate; red represents putamen) and right (right column; yellow represents caudate; cyan represents putamen) convergence zones and bilateral nonconvergence zones in striatal motor regions of the putamen (middle column; green) separately. Significant functional connectivity of ipsilateral caudate and putamen convergence zones overlap in OFC, DLPFC, and parietal areas laterally, and in anterior cingulate cortex medially. Nonconvergence zone functional connectivity is primarily restricted to precentral gyrus and insular cortex laterally, and some anterior cingulate cortex and caudal superior frontal gyrus medially.
Structural and functional connectivity overlap analysis.
Using a custom MATLAB function, t-maps of consistent structural connectivity from the DSI data, and Z-transformed correlation (r) maps from the fMRI data were used to calculate the percentage of structurally significant voxels (i.e., a cortical voxel that had significant structural connectivity with a striatal convergence zone) that were also functionally significant. For this, the DSI t-map data were thresholded at q < 0.05 to yield all significant voxels with structural connections that were consistent across all 60 DSI datasets. Corresponding rsfMRI data were also thresholded at q < 0.05, resulting in maps of voxels with significant functional connectivity across all 55 fMRI datasets. For each convergence zone, t-maps and Z-maps of structural and functional connectivity, respectively, were loaded into MATLAB. A voxel was considered to have significant structural or functional connectivity if the one-sample t test to find consistent connections across all DSI or rsfMRI datasets resulted in a significant q value. The maps of significant structural and functional connectivity for each convergence zone were binarized such that all voxels with a q < 0.05 were set to 1, and all other voxels were set to 0. After transforming the binary data into single-column vectors, the dot product of significant structural and functional voxels was summed and divided by the number of significant structural voxels. This calculation yielded the percentage of cortical voxels that had significant structural and functional connectivity with a striatal convergence zone, aggregated across all voxels within a given zone.
Finally, a permutation test was conducted to determine the chance levels of overlap between the structural and functional measures of connectivity. For each convergence zone, a random permutation of the resulting binary data vector of significant functional voxels was generated, and the percentage overlap with the significant structural voxels was recalculated. This process was repeated for 1000 iterations for each convergence zone ROI to construct the 95% confidence interval of chance overlap between structural and functional connectivity (i.e., to construct the null distribution of structurally connected voxels to the convergence zone that randomly overlapped with functionally connected voxels).
Results
Topography of corticostriatal projections
We first set out to characterize the major topographic gradients of the corticostriatal pathways. Whereas previous animal work using viral tracers (Kemp and Powell, 1970; Selemon and Goldman-Rakic, 1985; Haber, 2003; Utter and Basso, 2008) shows a primarily medial–lateral organization of corticostriatal projections, recent human imaging work suggests a second rostral-to-caudal organization of these pathways (Draganski et al., 2008; Badre and Frank, 2012; Verstynen et al., 2012; Verstynen, 2014). Here, we evaluate the global structural connectivity of the left and right striatum, respectively, on the average template brain. The streamlines are coded according to their position along either a medial–lateral axis (Fig. 1A–F) or rostral–caudal axis (Fig. 1G–L). Along the medial–lateral axis, we find a gross parcellation between caudate and putamen fibers, with the former receiving projections from rostral prefrontal and OFC, medial wall areas, and dorsal parietal regions, and the latter receiving projections primarily from somatosensory, primary motor, premotor, and caudal prefrontal areas. Within these major nuclear segmentations, there is a somewhat consistent medial–lateral organization such that more medial areas of cortex project to more medial regions in the subcortical nuclei (Fig. 1A–F, cooler colors), and more lateral areas of cortex project to more lateral striatal regions (Fig. 1A–F, warmer colors). For example, medial orbitofrontal and ventromedial prefrontal areas project to more medial caudate regions (dark blue) than lateral orbitofrontal cortical streamlines (light blue) (see Fig. 1C,D). This is largely consistent with previously reported dichotomies of caudate and putamen projections (Alexander et al., 1986) and suggests that, at the gross macroscopic level of major cortical regions, the primary gradient of organization is in a medial-to-lateral plane.
The global medial-to-lateral gradient across striatal nuclei is consistent with previous animal imaging studies; however, there is a strong local rostral–caudal organization within the nuclei themselves. Qualitative inspection of Figure 1G, L reveals a rostral–caudal gradient that appears to be isolated within major functionally defined regions. For example, within the lateral prefrontal cortex, which generally projects to the putamen (Fig. 1A–D), more rostral regions of cortex tend to terminate in more rostral ends of the striatum. However, even this gradient along the sagittal plane segregates some major cortical regions. Motor and somatosensory areas tend to terminate in more caudal regions of the striatum (Fig. 1G–L, warmer colors), whereas prefrontal and orbitofrontal areas terminate in more rostral regions of the striatum (Fig. 1G–L, cooler colors). More interestingly, however, parietal projections extend to the more rostral part of the striatum near the location of lateral frontal projection. This is largely consistent with previous animal tracer studies (Selemon and Goldman-Rakic, 1988; Cavada and Goldman-Rakic, 1991) and inconsistent with a pure, global rostral–caudal organization of corticostriatal systems (for review, see Utter and Basso, 2008).
These results show that two strong organizational gradients exist in corticostriatal pathways. First, there is a strong macroscopic gradient in a medial–lateral orientation that segregates major functional cortical regions and is moderately driven by spatial proximity. For example, lateral motor areas terminate in the lateral striatal nucleus (i.e., the putamen) and medial motor areas terminate in the more medial nucleus (i.e., the caudate; see Fig. 1D). Second, there is a more local gradient in a rostral–caudal direction that is not driven by pure spatial proximity but appears to reflect local convergence of inputs from disparate cortical regions. An interesting break of this pure rostral–caudal gradient, however, is the observation that parietal streamlines (Fig. 1G–L, cyan and light green streamlines) project to rostral portions of the striatum in similar regions as prefrontal and orbitofrontal areas. The location of these parietal projections within both gradients of organization is consistent with parietal inputs converging in similar areas of the striatum as frontal cortex.
To determine the gross topographic organization across the three major ROIs for this study, we examined the common regions of endpoint densities in the striatum for all 60 DSI datasets. Thirteen cortical ROIs were tracked and then collapsed into three meta-region maps: OFC, DLPFC, and parietal cortex (for more details, see Fiber tractography and analysis). Figure 2 shows the endpoint fields for each meta-region cluster. As expected, the endpoint clusters of projections from the three meta-regions exhibit similar topographical distributions as what is shown in the gradient analysis in Figure 1. Specifically, OFC (yellow) areas project most heavily in the most anterior and medial aspects of the striatum, primarily in the caudate nucleus (Fig. 2A). DLPFC (Fig. 2B, blue) regions most consistently project just caudal to the OFC clusters and more laterally, although with some visible overlap between the two clusters. Finally, parietal regions (Fig. 2C, violet) most densely project to areas slightly more caudal than the DLFPC projections, with a bias toward slightly more lateral striatal regions. This rich, topographical organization of cortical projection endpoints along the striatum demarcates a distinct spatial segmentation of cortical inputs while also providing evidence of some local overlap of corticostriatal projections from adjacent cortical networks.
Figure 2.

Group statistical maps of common endpoint locations from three cortical meta-regions: OFC (A, yellow), DLPFC (B, blue), and parietal cortex (C, violet). Voxels indicate regions with significant endpoint densities from cortex determined using a one-sample t test and corrected for multiple comparisons.
Convergence of corticostriatal projections
Close inspection of Figure 2 reveals several common regions with apparent overlapping projections from OFC, DLPFC, and parietal cortical areas. To quantify these overlapping projections, we used a conjunction analysis to identify voxels with significant endpoint densities from OFC, DLPFC, and parietal masks (see Materials and Methods). Clusters of these conjunction voxels (k > 20) were isolated bilaterally within the caudate nucleus and putamen separately and were consistent across all 60 datasets (all t(59) values > 2.75, q < 0.05). Each nucleus contains a distinct cluster of these convergent fields that appear to be relatively symmetric across hemispheres (Fig. 3A, left column, B). In the caudate, the convergence zones are isolated along the rostral portion of the body of the caudate. In the putamen, the convergence zones are found on the dorsal and rostral aspects of the nucleus. These three-way convergence zones are smaller than any of pairwise convergence zones between OFC, DLPFC, and parietal cortex. In general, pairwise overlaps with DLPFC are widespread and found across large portions the rostral striatum (Fig. 3A, second and third columns). The pairwise overlap of OFC and parietal projections is much smaller (Fig. 3A, fourth column), suggesting that the three-way convergence zones are restricted by the limited overlap of parietal and orbitofrontal connections within the striatum. It is important to note that the parietal and OFC overlap areas are away from ventral striatal regions that are typically thought of as the main termini of OFC projections (Haber, 2003). For reference, we also mapped the projections from the precentral gyrus as a proxy for the motor inputs into the striatum, which typically terminate in the caudal putamen (Fig. 3A, right column). In all cases, the striatal areas with convergent projections from OFC, DLPFC, and parietal areas are much more rostral than areas that receive projections from precentral motor areas (i.e., the motor striatum).
To get a more complete picture of where the projections into the striatal convergence zones originate along the cortical surface, we performed a second whole-brain tractography analysis, isolating only streamlines that ended in each of the three-way convergence clusters shown in Figure 3B. Although the medial bias of the tractography process is somewhat apparent in this second analysis, we still observed significant structural connectivity from lateral prefrontal and parietal regions. Generally, both putamen convergence zones show more distributed projections (Fig. 4: left, red; right, cyan) than the caudate convergence zones projections (Fig. 4B: left, blue; right, yellow). The cortical connectivity with the putamen is much more distributed across the frontal and parietal regions than the caudate connectivity. Within OFC, there are two regions with consistent structural connectivity to the convergence zones. The first is a region along the medial wall that connects largely to the putamen convergence zone. The second is a region on the far lateral borders of the OFC, near the border between Brodmann's areas 11 and 47, that shows consistent connectivity to both the caudate and putamen convergence zones. Within the prefrontal cortex, there are two major clusters of connectivity. The first is a cluster on the rostral middle frontal gyrus, approximately at Brodmann's areas 46 and 47, that appears to be contiguous with the lateral OFC clusters and shows a high degree of connectivity with both the caudate and putamen convergence zones. The second, prefrontal cluster rests along the superior frontal gyrus and reflects primarily inputs to the putamen, although a smaller cluster of voxels sends overlapping projections to the caudate. Finally, most projections to the convergence zones from the parietal cortex appear to originate from regions along the angular gyrus and inferior parietal lobule, whereas some connections within the intraparietal sulcus itself appear to reflect the location of the connections into the caudate convergence zone cluster.
Along with connectivity to our three major ROIs, there is strong connectivity to sensorimotor regions around the precentral sulcus. This is primarily for projections to the putamen convergence zone, although some medial cortical areas show consistent projections to the caudate zone as well. Thus, consistent with the striatal maps in Figure 3A, some sensorimotor regions may also project into rostral portions of the striatal convergence zones, particularly along the putamen.
Our original tractography identifying the convergence zones is restricted to ipsilateral corticostriatal projections; however, the reseeded tractography analysis from the left caudate shows several notable interhemispheric connections, particularly with dorsal and medial superior frontal gyrus in the right hemisphere. Contralateral connectivity between left caudate convergence zone and right dorsolateral prefrontal areas is indeed consistent with nonhuman primate histology (McGuire et al., 1991) and human diffusion imaging work (Lehéricy et al., 2004). No such interhemispheric connectivity is observed from the convergence zone in the right caudate nucleus. However, the lack of strong interhemispheric structural connections may be limited by our initial tractography approach. To correct for this, we conducted a follow-up tractography analysis between convergence zones in one hemisphere and cortical areas in the contralateral hemisphere (see Fiber tractography and analysis). After adjusting for multiple comparisons (q < 0.05), we did not observe any significant convergence zones from contralateral cortical areas. This null result highlights a limitation of diffusion-weighted imaging approaches for tracking contralateral corticostriatal projections previously reported using histological approaches (Selemon and Goldman-Rakic, 1985; Cavada and Goldman-Rakic, 1989a, 1991).
Functional connectivity of convergence zones
So far, our tractography analysis has revealed converging anatomical projections from orbitofrontal, prefrontal, and posterior parietal areas into the striatum. If these do, indeed, reflect an integrative functional network, then cortical areas that show a high degree of anatomical connectivity to the convergence zones should also show significant functional connectivity to these same striatal regions. To this end, we used rsfMRI data to measure the functional connectivity between cortical areas and each of the striatal convergence zones. The functional activity of striatal convergence zones is correlated with a distributed set of bilateral cortical areas, including the DLPFC, both medial and lateral OFC, sensorimotor areas, and, most importantly, posterior parietal regions (Fig. 5). Within the OFC, we again see that medial regions are more highly connected to the putamen cluster than the caudate cluster, although the functional connectivity appears to be centered in more caudal regions than the location of structural endpoints. The lateral OFC regions, on the border of approximately Brodmann's areas 11 and 47, also show connectivity to both convergence zone clusters. This pattern is highly similar to what was observed in the structural connectivity analysis, albeit with a much more distributed cortical representation. In most frontal areas, convergence zones from both nuclei exhibit a similar pattern of functional associations throughout the cortex, particularly in the rostral aspects of the DLPFC, lateral OFC, and anterior cingulate cortex. However, there is also a moderate degree of specificity between the convergence zones on each striatal nucleus. For example, several bilateral cortical regions, including the middle frontal gyrus and medial superior frontal gyrus, show functional connectivity with only the caudate convergence zones. In contrast, aspects of the precentral gyrus, subgenual cingulate, and caudal aspects of the supplementary motor area show unique bilateral connectivity with the convergence zones in the putamen. Functional connectivity with the parietal cortex is restricted along dorsal aspects of the intraparietal sulcus and portions of the inferior parietal lobule. In this case, connectivity to the caudate convergence zone appears to reside in more caudal parietal regions, whereas connectivity to the putamen convergence zone resides in more rostral parietal areas. These regions of unique functional connectivity, along with the unique cortical regions identified in the structural connectivity analysis in Figure 4, suggest that the convergence zones in the caudate nucleus and the putamen may reflect dissociable networks for integrating information from frontoparietal networks.
Because the striatal nuclei receive some of the most convergent inputs in the brain (Selemon and Goldman-Rakic, 1985), it is possible that the distributed patterns of functional connectivity that we found to the striatal convergence zones are not unique, but that any striatal area will show a broad and distributed connectivity to many neocortical areas. To address this, we included an additional control analysis looking at the functional connectivity to the motor putamen clusters shown in Figure 3A (right column). The group-level functional connectivity to the motor putamen is shown in the middle column of Figure 5. As would be expected (Choi et al., 2012), functional connectivity from the cortex to the motor putamen is quite different from that in the convergence zones. There is a much larger representation along the precentral gyrus and central sulcus. Although there is a large cluster of connectivity along the medial wall, this cluster is centered much more caudally than the clusters connected to the convergence zones. Some areas do show overlap with the areas that also project to the striatal convergence zones, particularly along the inferior frontal gyrus, which is thought to contain the ventral premotor cortex (Rizzolatti et al., 1996), as well as some ventral medial wall and ventral parietal areas. However, despite these regions of overlap, the connectivity patterns of the motor putamen demonstrate that the frontoparietal connectivity found in the convergence zones is not a ubiquitous feature of corticostriatal connections.
Structure–function overlap
Comparing the maps in Figures 4 and 5 reveals qualitative similarities in the patterns of structural and functional connectivity to the striatal convergence zones. To better understand the similarity between these two connectivity estimates, these maps are plotted together on an inflated brain surface (Figs. 6 and 7). Given the relative symmetry of the connectivity patterns between hemispheres, here we will focus on descriptions of ipsilateral connections in the left hemisphere.
Figure 6.

Ventral surface maps of structural and functional convergence zone connectivity in OFC on an inflated brain. Clusters of significant (all t values > 2.75, uncorrected p < 0.05) structural and functional connectivity are observed to overlap throughout OFC. Warmer colors represent t > 2.75; cooler colors represent t <−2.75. Left panels, Connectivity to the caudate convergence zone. Right panels, Connectivity to the putamen convergence zone.
Figure 7.
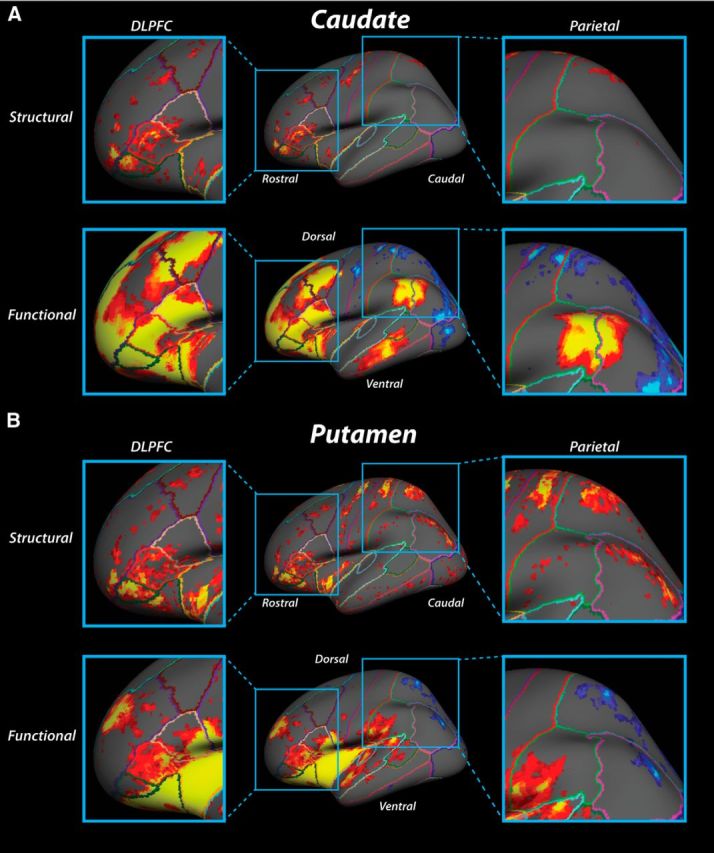
Lateral surface maps of structural and functional convergence zone connectivity in DLPFC and parietal cortex on an inflated brain. A, Connectivity to the caudate convergence zone. B, Connectivity to the putamen convergence zone. Same plotting conventions as in Figure 6.
On the ventral surface, functional and structural connectivity to the caudate convergence zone overlaps in the same rostral areas of lateral orbital gyrus and ventrolateral inferior frontal gyrus (Fig. 6, left panels). However, positive functional connectivity is adjacent to clusters of structural connections in the inferior frontal gyrus and extends caudally to regions that correspond approximately with ventral aspects of Brodmann's area 44 and 45. Functional connectivity to the caudate convergence zone also overlaps with clusters of structural connectivity in caudal regions of the orbital gyrus that extend from inferior frontal gyrus to the medial wall. This functional connectivity appears to be restricted to the same lateral orbital gyrus regions where clusters of structural connections are also present.
Ventral connectivity to the putamen convergence zone shows clusters of structural and functional connections in rostrolateral OFC that extend caudally along the ventral inferior frontal gyrus (Fig. 6, top right). Unlike connections to the caudate convergence zone, structural and functional connections overlap in more central OFC regions as well as throughout ventral aspects of the insula (Fig. 6, bottom right). Furthermore, large clusters of structural and functional connections to the putamen convergence zone are present along the gyrus rectus. Although a much larger swatch of functional connectivity is observed throughout much of the orbital gyrus until the approximate border between medial orbital gyrus and gyrus rectus (Fig. 6, bottom right), these functional clusters appear to subsume the clusters of structural connections to the putamen convergence zone.
At the lateral surface, there is a high degree of overlap between structural and functional connections to the caudate convergence zone (Fig. 7). In DLPFC regions, clusters of structural connections extend caudally from the frontal pole to encompass the rostral two-thirds of the inferior frontal gyrus. Clusters of structural connections are also present along the full extent of the middle frontal gyrus (Fig. 7A, top left). This spattering of structural connections to the caudate convergence zone overlap with clusters of strong positive functional connectivity in the DLPFC as well (Fig. 7A, bottom left). In particular, functional connections extend caudally from the frontal pole along the entire inferior frontal gyrus and the rostral third and caudal half of the middle frontal gyrus, overlapping with many of the regions that also show strong structural connections.
Connectivity to the putamen convergence zone appears to be located in similar areas of anterior prefrontal cortex and along the inferior and middle frontal gyri. The main difference between caudate and putamen convergence zone patterns is in the lateral frontal cortex where clusters of structural connections to the putamen are somewhat larger than structural connections to the caudate. Also, the putamen structural connectivity extends more ventrally in the inferior frontal gyrus (Fig. 7B, top left). In Figure 7B (lower left panel), positive functional connectivity to the putamen convergence zone overlaps with structural connections throughout the inferior frontal gyrus. Small clusters of structural connections appear to overlap with sparse functional connections located in the rostral region of the middle frontal gyrus, contiguous with functional connectivity in rostral superior frontal gyrus; however, the structural connections in this region extend much farther back along the middle frontal gyrus than the spread of functional connections.
In parietal areas, an interesting pattern emerges with regards to the specificity connections to the striatal convergence zones. Functionally, the connections to the striatal convergence zones are separated along a dorsal–ventral plane, with patches of negative connectivity present along the superior parietal lobule and dorsal aspects of the intraparietal sulcus and patches of positive connectivity in ventral parietal regions (Fig. 7A,B, top right). The dorsal negative connectivity region appears to be more distributed for connections to the caudate than to the putamen convergence zone. More importantly, the negative functional connectivity clusters overlap or are physically adjacent to regions of structural connections to both striatal convergence zones (Fig. 7A,B, bottom right).
For connections to the caudate convergence zone, the positive functional connectivity area in the ventral parietal cortex resides on the border of the supramarginal gyrus and the angular gyrus (Fig. 7A, bottom right). In contrast, for connections to the putamen convergence zone, this positive connectivity region is shifted in a rostral direction and isolated primarily within the supramarginal gyrus, near the temporal–parietal junction (Fig. 7B, bottom right). However, here the structural connections do not overlap well with the pattern of functional connections for either convergence zone. We failed to find any structural connections near the positive functional connectivity cluster for the caudate convergence zone. Although there is distributed structural connectivity to the putamen convergence zone along the supramarginal and angular gyri, only the most rostral clusters of structural connections appear proximal to the positive functional connectivity region on the supramarginal gyrus. Thus, the only region with consistent structure–function overlaps in the parietal cortex extended along the superior parietal lobule.
Given the incomplete qualitative overlap of structural and functional connectivity, we sought to determine the likelihood that this overlap is due to chance. To quantify the degree of overlapping connections, we calculated the probability that structurally connected voxels were also functionally connected (i.e., P(connectionfMRI | connectionDSI) (see Structural and functional connectivity overlap analysis) and used randomization statistics to estimate the probability of observing this overlap by chance. These results are summarized in Table 1. The highest degree of overlap was found for the caudate convergence zones. These have the highest degree of specificity of all striatal clusters (i.e., strongest overlap within pairwise maps and weakest connectivity with nonpairwise maps). The functional connectivity of the caudate convergence zones significantly overlap with the structural connectivity of the two putamen clusters, but the degree of this overlap is much smaller than the overlap with the structural connectivity estimated from the caudate convergence zone. Similarly, functional connectivity to the putamen convergence zone overlapped significantly with the structural connectivity to all three striatal clusters; however, unlike the caudate results, the overall degree of overlap was generally smaller and fairly equally distributed across all three striatal clusters. Thus, in both the convergence zone clusters and in both hemispheres, we see a greater degree of overlap in the patterns of functional and structural connectivity than would be expected by chance. In contrast, the control clusters in the motor putamen do not show this pattern. The functional connectivity to the left motor putamen does not significantly overlap with the structural connectivity from any of the striatal clusters in the ipsilateral hemisphere, although the highest degree of overlap was with the structural connectivity patterns to the same set of voxels. The functional connectivity to the right motor putamen only significantly overlapped with the structural connectivity to the same cluster of voxels, but not to the structural connectivity maps to either of the convergence zones. This overlap of functional and structural connectivity patterns in the cortex provides confirmation that voxels showing direct anatomical connections to the striatal convergence zones have a high likelihood (well above chance) of being associated in their functional dynamics. Furthermore, the cortical distribution of inputs to the convergence zones reflects a unique set of frontoparietal networks and not a general pattern of corticostriatal connectivity.
Table 1.
Observed structural and functional overlap probabilities within and across the two convergence zones and connections to putative motor regions based on connectivity with the precentral gyrusa
| Functional | Structural |
|||||
|---|---|---|---|---|---|---|
| Left hemisphere |
Right hemisphere |
|||||
| Caudate convergence zone | Putamen convergence zone | Putamen motor | Caudate convergence zone | Putamen convergence zone | Putamen motor | |
| Caudate | 70.23%* | 31.21%* | 25.70%* | 66.67%* | 61.74%* | 52.75%* |
| (0.26, 0.28) | (0.14, 0.16) | (0.1, 0.12) | (0.27, 0.36) | (0.22, 0.3) | (0.1, 0.17) | |
| Putamen | 42.42%* | 27.36%* | 21.37%* | 31.57%* | 31.29%* | 16.44%* |
| (0.27, 0.28) | (0.15, 0.16) | (0.11, 0.11) | (0.22, 0.23) | (0.17, 0.18) | (0.09, 0.1) | |
| Motor | 33.80% | 30.75% | 39.56% | 20.92% | 26.49% | 50.50%* |
| (0.36, 0.38) | (0.34, 0.35) | (0.38, 0.4) | (0.26, 0.28) | (0.28, 0.3) | (0.39, 0.4) | |
aValues in parentheses are the lower and upper bounds of the 95% confidence intervals of chance overlap based on a permutation test.
*Significant observed overlap above chance.
Discussion
Our results identify a novel set of regions in the rostral and dorsal striatum that concurrently exhibit structural and functional connectivity to orbitofrontal, lateral prefrontal, and posterior parietal regions of cortex. The location of these convergence zones is anatomically consistent with previous reports of parietal (Selemon and Goldman-Rakic, 1985, 1988; Cavada and Goldman-Rakic, 1991) and frontal (Haber et al., 1995; Averbeck et al., 2014) white matter projections, based on ex vivo nonhuman primate histology. Although the distribution of cortical regions associated with the striatal convergence zones differed to some degree between structural and functional connectivity measures, reflecting methodological limitations of each approach, a majority of cortical areas structurally connected to the convergence zones also showed strong functional connectivity. This supports the notion that these corticostriatal projections form an integrative functional circuit.
The current findings support a growing body of evidence that basal ganglia circuits are more complex and interactive than the classic independent, parallel pathways model (Alexander et al., 1986). We confirmed the presence of two previously described gradients of connectivity within the corticostriatal pathways: a global medial–lateral gradient.(Selemon and Goldman-Rakic, 1985; Haber, 2003) and a more local rostral–caudal gradient (Nauta and Whitlock, 1956; Kemp and Powell, 1970; see also Draganski et al., 2008; Verstynen et al., 2012). The complexity of these gradients highlights the fact that demarcating independent corticostriatal circuits remains a challenge (Choi et al., 2012).
Histological work has also shown that corticostriatal pathways from disparate cortical areas have some overlapping termination fields within the striatum (Selemon and Goldman-Rakic, 1985; Haber, 2003; Haber et al., 2006; Averbeck et al., 2014). Accordingly, we observed clusters of voxels (i.e., convergence zones) bilaterally within striatal nuclei where projections from several cortical areas, including OFC, DLPFC, and posterior parietal cortex, terminate. This is in line with recent work in humans showing that distinct striatal regions are functionally connected with networks of distributed cortical areas, including the frontoparietal association, default mode, and limbic networks (Choi et al., 2012). Although previous work has separately shown projections from OFC (Selemon and Goldman-Rakic, 1985; Haber et al., 2006) and posterior parietal cortex (Selemon and Goldman-Rakic, 1988; Cavada and Goldman-Rakic, 1989b, 1991) overlap with DLPFC projections, to the best of our knowledge, the present findings show the first evidence of a convergence of projections from all three cortical areas to common striatal targets.
We propose that this pattern of convergent connectivity may reflect a potential mechanism for integrating reward processing, executive control, and spatial attention during spatial reinforcement learning (Colby and Goldberg, 1999; Behrmann et al., 2004; Gottlieb, 2007). This type of learning is thought to arise from feedback signals refining behavioral action selections and strategies, to improve efficiency during visual search for highly rewarded spatial targets versus targets that are less rewarded (Della Libera and Chelazzi, 2006; Kristjánsson et al., 2010; Navalpakkam et al., 2010; Lee and Shomstein, 2014). At the neural level, performance on spatial reinforcement tasks has been shown to be associated with concurrent activity of posterior parietal and DLPFC areas (Lee and Shomstein, 2013); however, in order for feedback to bias spatial attention, signals from cortical areas linked to attention must be integrated with reinforcement learning processes (i.e., evaluating previous outcomes and using them to shape response selection). Functionally, the OFC has been implicated in providing reinforcement signals that influence behavior (O'Doherty, 2004; Hare et al., 2008; Schoenbaum et al., 2010). Thus, convergence of orbitofrontal signals into regions of the striatum that also receive projections from cortical areas linked to spatial attention and executive control could provide a substrate for adapting spatial decisions.
The dual location of the projections from the OFC into the striatal convergence zones may also help to elucidate the role of feedback control in spatial learning. Orbitofrontal areas have a well-described dual topography of representation: one for sensory modality and feedback type (i.e., reward and punishment) and another for complexity of feedback information (for complete review, see Kringelbach and Rolls, 2004). We observed two distinct clusters of orbitofrontal projections into the convergence zones that illustrate this dual topography (see Fig. 4, bottom row middle). The larger cluster of projections to both striatal nuclei was found in posterior lateral orbitofrontal areas that are linked with processing low complexity visual signals. This supports the idea that these projections are linked to processing signals necessary for visuospatial attention. The second, smaller, cluster of projections originated in anterior medial regions and terminated only within the putamen convergence zones. These may reflect subsets of projections to pure ventral striatal pathways linked directly to reward processing (e.g., the ventral parts of the putamen clusters illustrated in Fig. 3, left column), suggesting that these striatal convergence zones may reflect multiple forms of feedback processing during spatial learning.
Within the striatal nuclei, the location of the convergence zones also provides some clues as to the possible functional roles of these integrative networks. For example, we observed convergence zones that extended into the dorsomedial caudate nucleus. This area has been strongly implicated in reinforcement learning in human functional neuroimaging studies (O'Doherty et al., 2004; Delgado et al., 2005; Schönberg et al., 2007; Badre and Frank, 2012). When these previous studies are considered together with our coincidental observation of structural and functional connectivity between OFC, DLPFC, and posterior parietal cortex in the striatum, the convergence of these three corticostriatal pathways, particularly within the dorsomedial caudate, may underlie context-dependent, spatial reinforcement learning suggested in previous research (Nieuwenhuis et al., 2005a; b; Lee and Shomstein, 2013).
Of course, it is possible that at least part of the interaction between parietal, OFC, and DLPFC functions is mediated by direct intracortical structural connections (Ridderinkhof et al., 2004); however, our current findings are consistent with a model in which part of this integration may happen at the corticostriatal level (Haber et al., 2006). Similarly, histological work supports potential models of spatial attention and executive control integration via direct cortical connections between posterior parietal cortex and DLPFC (Cavada and Goldman-Rakic, 1989b), as well as overlapping corticostriatal projections (Cavada and Goldman-Rakic, 1991). Although we cannot rule out a direct corticocortical connectivity hypothesis, our findings afford some confirmation for the integration of spatial attention and executive control signals in striatal areas that also receive inputs from the OFC, which is consistent with a corticostriatal mechanism for spatial reinforcement learning.
Our conclusions about this pathway are tempered, however, by inherent methodological limitations with the neuroimaging techniques that we used. The low spatial resolution of current MRI techniques (2–3 mm3 voxels), relative to histological approaches, means that it is not possible to directly infer whether the pathways we visualized are converging on the same striatal cells or merely terminating in adjacent regions of the nucleus. Even considering that it is possible to get subvoxel resolution with tractography on diffusion imaging data (Verstynen et al., 2011, 2012), this resolution is simply not fine enough to detect true converging collaterals on the same neuron. This coarse resolution of current MRI-based approaches limits our inference to interactions that occur at the voxel level.
Another concern relates generally to rsfMRI functional connectivity analyses, which is an indirect measure of connectivity based on correlated activity throughout the brain. At the time-scale of the BOLD response, it is impossible to differentiate direct functional connections to a seed region from indirect connections (Cole et al., 2010). Thus, our inferences based on rsfMRI data can only imply that connected regions represent a functional circuit, but they cannot confirm that correlated areas are directly connected to each other. Although fiber tractography provides a more direct estimate of underlying white matter connections, this approach is still highly sensitive to various sources of noise (Jones, 2008) and suffers from several spatial biases that preclude complete identification of all underlying connectivity (Thomas et al., 2014). This bias may explain some of the discrepancies between the structural (Fig. 4) and functional (Fig. 5) connectivity patterns in the present study, particularly in DLPFC regions.
Finally, neither DSI nor rsfMRI can confirm the task relevance of the cortical areas that we examined. To directly address our hypothesis that this network reflects a neural substrate for spatial reinforcement learning, future work should look at functions of this network during tasks that require the integration of reward, executive control, and spatial attention.
Despite these limitations, the present findings provide clear evidence that projections from OFC, DLPFC, and posterior parietal cortex terminate in common striatal regions. Although our results are consistent with several independent findings in primate neuroanatomical literature, no previous study has shown the specific convergence of these three corticostriatal pathways in the human brain. This highlights a plausible structural mechanism that could allow for parietally mediated spatial attention processes to contribute to the integration of reward and response selection. Future work should explore the particular dynamics of the neural circuit that we have described here for their potential role in the integration of spatial attention information with reward and executive control processes during reinforcement learning.
Footnotes
K.J. was funded by the NIH predoctoral training grant 5T32GM081760-08 during all stages of research and manuscript submission. This work was sponsored by the Pennsylvania Department of Health Formula Award SAP4100062201 and the Army Research Laboratory Cooperative Agreement W911NF-10-2-0022. We thank Dr. Roberta Klatzky for consultation regarding data analyses used in this document. The views and conclusions contained in this document are those of the authors and should not be interpreted as representing the official policies, either expressed or implied, of the Army Research Laboratory or the U.S. Government. The U.S. Government is authorized to reproduce and distribute reprints for Government purposes notwithstanding any copyright notation herein.
The authors declare no competing financial interests.
References
- Alexander GE, DeLong MR, Strick PL. Parallel organization of functionally segregated circuits linking basal ganglia and cortex. Annu Rev Neurosci. 1986;9:357–381. doi: 10.1146/annurev.ne.09.030186.002041. [DOI] [PubMed] [Google Scholar]
- Ashburner J, Friston KJ. Nonlinear spatial normalization using basis functions. Hum Brain Mapp. 1999;7:254–266. doi: 10.1002/(SICI)1097-0193(1999)7:4<254::AID-HBM4>3.0.CO%3B2-G. [DOI] [PMC free article] [PubMed] [Google Scholar]
- Averbeck BB, Lehman J, Jacobson M, Haber SN. Estimates of projection overlap and zones of convergence within frontal-striatal circuits. J Neurosci. 2014;34:9497–9505. doi: 10.1523/JNEUROSCI.5806-12.2014. [DOI] [PMC free article] [PubMed] [Google Scholar]
- Badre D, Frank MJ. Mechanisms of hierarchical reinforcement learning in cortico-striatal circuits: 2. Evidence from fMRI. Cereb Cortex. 2012;22:527–536. doi: 10.1093/cercor/bhr117. [DOI] [PMC free article] [PubMed] [Google Scholar]
- Behrmann M, Geng JJ, Shomstein S. Parietal cortex and attention. Curr Opin Neurobiol. 2004;14:212–217. doi: 10.1016/j.conb.2004.03.012. [DOI] [PubMed] [Google Scholar]
- Cavada C, Goldman-Rakic PS. Posterior parietal cortex in rhesus monkey: I. Parcellation of areas based on distinctive limbic and sensory corticocortical connections. J Comp Neurol. 1989a;287:393–421. doi: 10.1002/cne.902870402. [DOI] [PubMed] [Google Scholar]
- Cavada C, Goldman-Rakic PS. Posterior parietal cortex in rhesus monkey: II. Evidence for segregated corticocortical networks linking sensory and limbic areas with the frontal lobe. J Comp Neurol. 1989b;287:422–445. doi: 10.1002/cne.902870403. [DOI] [PubMed] [Google Scholar]
- Cavada C, Goldman-Rakic PS. Topographic segregation of corticostriatal projections from posterior parietal subdivisions in the macaque monkey. Neuroscience. 1991;42:683–696. doi: 10.1016/0306-4522(91)90037-O. [DOI] [PubMed] [Google Scholar]
- Choi EY, Yeo BT, Buckner RL. The organization of the human striatum estimated by intrinsic functional connectivity. J Neurophysiol. 2012;108:2242–2263. doi: 10.1152/jn.00270.2012. [DOI] [PMC free article] [PubMed] [Google Scholar]
- Colby CL, Goldberg ME. Space and attention in partietal cortex. Annu Rev Neurosci. 1999;22:319–349. doi: 10.1146/annurev.neuro.22.1.319. [DOI] [PubMed] [Google Scholar]
- Cole DM, Smith SM, Beckmann CF. Advances and pitfalls in the analysis and interpretation of resting-state FMRI data. Front Syst Neurosci. 2010;4:8. doi: 10.3389/fnsys.2010.00008. [DOI] [PMC free article] [PubMed] [Google Scholar]
- Cox RW. AFNI: software for analysis and visualization of functional magnetic resonance neuroimages. Comput Biomed Res. 1996;29:162–173. doi: 10.1006/cbmr.1996.0014. [DOI] [PubMed] [Google Scholar]
- Critchely M. The parietal lobes. Oxford: Williams & Wilkins; 1953. [Google Scholar]
- Croxson PL, Johansen-Berg H, Behrens TE, Robson MD, Pinsk MA, Gross CG, Richter W, Richter MC, Kastner S, Rushworth MF. Quantitative investigation of connections of the prefrontal cortex in the human and macaque using probabilistic diffusion tractography. J Neurosci. 2005;25:8854–8866. doi: 10.1523/JNEUROSCI.1311-05.2005. [DOI] [PMC free article] [PubMed] [Google Scholar]
- Daw ND, Doya K. The computational neurobiology of learning and reward. Curr Opin Neurobiol. 2006;16:199–204. doi: 10.1016/j.conb.2006.03.006. [DOI] [PubMed] [Google Scholar]
- Dayan P, Abbott LF. Theoretical neuroscience: computational and mathematical modeling of neural systems. Ed 1. Cambridge, MA: Massachusetts Institute of Technology; 2001. [Google Scholar]
- Delgado MR, Locke HM, Stenger VA, Fiez JA. Dorsal striatum responses to reward and punishment: effects of valence and magnitude manipulations. Cogn Affect Behav Neurosci. 2003;3:27–38. doi: 10.3758/CABN.3.1.27. [DOI] [PubMed] [Google Scholar]
- Delgado MR, Miller MM, Inati S, Phelps EA. An fMRI study of reward-related probability learning. Neuroimage. 2005;24:862–873. doi: 10.1016/j.neuroimage.2004.10.002. [DOI] [PubMed] [Google Scholar]
- Della Libera C, Chelazzi L. Visual selective attention and the effects of monetary rewards. Psychol Sci. 2006;17:222–227. doi: 10.1111/j.1467-9280.2006.01689.x. [DOI] [PubMed] [Google Scholar]
- Di Martino A, Scheres A, Margulies DS, Kelly AM, Uddin LQ, Shehzad Z, Biswal B, Walters JR, Castellanos FX, Milham MP. Functional connectivity of human striatum: a resting state FMRI study. Cereb Cortex. 2008;18:2735–2747. doi: 10.1093/cercor/bhn041. [DOI] [PubMed] [Google Scholar]
- Draganski B, Kherif F, Klöppel S, Cook PA, Alexander DC, Parker GJ, Deichmann R, Ashburner J, Frackowiak RSJ. Evidence for segregated and integrative connectivity patterns in the human basal ganglia. J Neurosci. 2008;28:7143–7152. doi: 10.1523/JNEUROSCI.1486-08.2008. [DOI] [PMC free article] [PubMed] [Google Scholar]
- Egeth HE, Yantis S. Visual attention: control, representation, and time course. Annu Rev Psychol. 1997;48:269–297. doi: 10.1146/annurev.psych.48.1.269. [DOI] [PubMed] [Google Scholar]
- Gottlieb J. From thought to action: the parietal cortex as a bridge between perception, action, and cognition. Neuron. 2007;53:9–16. doi: 10.1016/j.neuron.2006.12.009. [DOI] [PubMed] [Google Scholar]
- Graybiel AM. Building action repertoires: memory and learning functions of the basal ganglia. Curr Opin Neurobiol. 1995;5:733–741. doi: 10.1016/0959-4388(95)80100-6. [DOI] [PubMed] [Google Scholar]
- Haber SN. The primate basal ganglia: parallel and integrative networks. J Chem Neuroanat. 2003;26:317–330. doi: 10.1016/j.jchemneu.2003.10.003. [DOI] [PubMed] [Google Scholar]
- Haber SN, Kunishio K, Mizobuchi M, Lynd-Balta E. The orbital and medial prefrontal circuit through the primate basal ganglia. J Neurosci. 1995;15:4851–4867. doi: 10.1523/JNEUROSCI.15-07-04851.1995. [DOI] [PMC free article] [PubMed] [Google Scholar]
- Haber SN, Kim KS, Mailly P, Calzavara R. Reward-related cortical inputs define a large striatal region in primates that interface with associative cortical connections, providing a substrate for incentive-based learning. J Neurosci. 2006;26:8368–8376. doi: 10.1523/JNEUROSCI.0271-06.2006. [DOI] [PMC free article] [PubMed] [Google Scholar]
- Haber SN, Knutson B. The reward circuit: linking primate anatomy and human imaging. Neuropsychopharmacology. 2010;35:4–26. doi: 10.1038/npp.2009.129. [DOI] [PMC free article] [PubMed] [Google Scholar]
- Hare TA, O'Doherty J, Camerer CF, Schultz W, Rangel A. Dissociating the role of the orbitofrontal cortex and the striatum in the computation of goal values and prediction errors. J Neurosci. 2008;28:5623–5630. doi: 10.1523/JNEUROSCI.1309-08.2008. [DOI] [PMC free article] [PubMed] [Google Scholar]
- Jones DK. Studying connections in the living human brain with diffusion MRI. Cortex. 2008;44:936–952. doi: 10.1016/j.cortex.2008.05.002. [DOI] [PubMed] [Google Scholar]
- Jones DK, Cercignani M. Twenty-five pitfalls in the analysis of diffusion MRI data. NMR Biomed. 2010;23:803–820. doi: 10.1002/nbm.1543. [DOI] [PubMed] [Google Scholar]
- Kemp JM, Powell TP. The cortico-striate projections in the monkey. Brain. 1970;93:525–546. doi: 10.1093/brain/93.3.525. [DOI] [PubMed] [Google Scholar]
- Knutson B, Westdorp A, Kaiser E, Hommer D. fMRI visualization of brain activity during a monetary incentive delay task. Neuroimage. 2000;12:20–27. doi: 10.1006/nimg.2000.0593. [DOI] [PubMed] [Google Scholar]
- Knutson B, Cooper JC. Functional magnetic resonance imaging of reward prediction. Curr Opin Neurol. 2005;18:411–417. doi: 10.1097/01.wco.0000173463.24758.f6. [DOI] [PubMed] [Google Scholar]
- Kringelbach ML, Rolls ET. The functional neuroanatomy of the human orbitofrontal cortex: evidence from neuroimaging and neuropsychology. Prog Neurobiol. 2004;72:341–372. doi: 10.1016/j.pneurobio.2004.03.006. [DOI] [PubMed] [Google Scholar]
- Kristjánsson A, Sigurjónsdóttir O, Driver J. Fortune and reversals of fortune in visual search: reward contingencies for pop-out targets affect. Atten Percept Psychophys. 2010;72:1229–1236. doi: 10.3758/APP.72.5.1229. [DOI] [PubMed] [Google Scholar]
- Kuhnen CM, Knutson B. The neural basis of financial risk taking. Neuron. 2005;47:763–770. doi: 10.1016/j.neuron.2005.08.008. [DOI] [PubMed] [Google Scholar]
- Lee J, Shomstein S. The differential effects of reward on space- and object-based attentional allocation. J Neurosci. 2013;33:10625–10633. doi: 10.1523/JNEUROSCI.5575-12.2013. [DOI] [PMC free article] [PubMed] [Google Scholar]
- Lee J, Shomstein S. Reward-based transfer from bottom-up to top-down search tasks. Psychol Sci. 2014;25:466–475. doi: 10.1177/0956797613509284. [DOI] [PMC free article] [PubMed] [Google Scholar]
- Lehéricy S, Ducros M, Krainik A, Francois C, Van de Moortele PF, Ugurbil K, Kim DS. 3-D diffusion tensor axonal tracking shows distinct SMA and pre-SMA projections to the human striatum. Cereb Cortex. 2004;14:1302–1309. doi: 10.1093/cercor/bhh091. [DOI] [PubMed] [Google Scholar]
- Lohrenz T, McCabe K, Camerer CF, Montague PR. Neural signature of fictive learning signals in a sequential investment task. Proc Natl Acad Sci U S A. 2007;104:9493–9498. doi: 10.1073/pnas.0608842104. [DOI] [PMC free article] [PubMed] [Google Scholar]
- McClure SM, York MK, Montague PR. The neural substrates of reward processing in humans: the modern role of fMRI. Neuroscientist. 2004;10:260–268. doi: 10.1177/1073858404263526. [DOI] [PubMed] [Google Scholar]
- McGuire PK, Bates JF, Goldman-Rakic PS. Interhemispheric integration: II. Symmetry and convergence of the corticostriatal projections of the left and the right principal sulcus (PS) and the left and the right supplementary motor area (SMA) of the rhesus monkey. Cereb Cortex. 1991;1:408–417. doi: 10.1093/cercor/1.5.408. [DOI] [PubMed] [Google Scholar]
- Nauta WJ, Whitlock DG. Subcortical projections from the temporal neocortex in Macaca mulatta. J Comp Neurol. 1956;106:183–212. doi: 10.1002/cne.901060107. [DOI] [PubMed] [Google Scholar]
- Navalpakkam V, Koch C, Rangel A, Perona P. Optimal reward harvesting in complex perceptual environments. Proc Natl Acad Sci U S A. 2010;107:5232–5237. doi: 10.1073/pnas.0911972107. [DOI] [PMC free article] [PubMed] [Google Scholar]
- Nieuwenhuis S, Heslenfeld DJ, von Geusau NJ, Mars RB, Holroyd CB, Yeung N. Activity in human reward-sensitive brain areas is strongly context dependent. Neuroimage. 2005a;25:1302–1309. doi: 10.1016/j.neuroimage.2004.12.043. [DOI] [PubMed] [Google Scholar]
- Nieuwenhuis S, Slagter HA, von Geusau NJ, Heslenfeld DJ, Holroyd CB. Knowing good from bad: differential activation of human cortical areas by positive and negative outcomes. Eur J Neurosci. 2005b;21:3161–3168. doi: 10.1111/j.1460-9568.2005.04152.x. [DOI] [PubMed] [Google Scholar]
- O'Doherty JP. Reward representations and reward-related learning in the human brain: insights from neuroimaging. Curr Opin Neurobiol. 2004;14:769–776. doi: 10.1016/j.conb.2004.10.016. [DOI] [PubMed] [Google Scholar]
- O'Doherty JP, Dayan P, Friston KJ, Critchley H, Dolan RJ. Temporal difference models and reward-related learning in the human brain. Neuron. 2003;28:329–337. doi: 10.1016/s0896-6273(03)00169-7. [DOI] [PubMed] [Google Scholar]
- O'Doherty J, Dayan P, Schultz J, Deichmann R, Friston K, Dolan RJ. Dissociable roles of ventral and dorsal striatum in instrumental conditioning. Science. 2004;304:452–454. doi: 10.1126/science.1094285. [DOI] [PubMed] [Google Scholar]
- Pagnoni G, Zink CF, Montague PR, Berns GS. Activity in human ventral striatum locked to errors of reward prediction. Nat Neurosci. 2002;5:97–98. doi: 10.1038/nn802. [DOI] [PubMed] [Google Scholar]
- Posner MI, Snyder CR, Davidson BJ. Attention and the detection of signals. J Exp Psychol. 1980;109:160–174. doi: 10.1037/0096-3445.109.2.160. [DOI] [PubMed] [Google Scholar]
- Ridderinkhof KR, van den Wildenberg WP, Segalowitz SJ, Carter CS. Neurocognitive mechanisms of cognitive control: the role of prefrontal cortex in action selection, response inhibition, performance monitoring, and reward-based learning. Brain Cogn. 2004;56:129–140. doi: 10.1016/j.bandc.2004.09.016. [DOI] [PubMed] [Google Scholar]
- Rizzolatti G, Fadiga L, Gallese V, Fogassi L. Premotor cortex and the recognition of motor actions. Cogn Brain Res. 1996;3:131–141. doi: 10.1016/0926-6410(95)00038-0. [DOI] [PubMed] [Google Scholar]
- Rodriguez PF, Aron AR, Poldrack RA. Ventral-striatal/nucleus-accumbens sensitivity to prediction errors during classification learning. Hum Brain Mapp. 2006;27:306–313. doi: 10.1002/hbm.20186. [DOI] [PMC free article] [PubMed] [Google Scholar]
- Rohlfing T, Zahr NM, Sullivan EV, Pfefferbaum A. The SRI24 multichannel atlas of normal adult human brain structure. Hum Brain Mapp. 2010;31:798–819. doi: 10.1002/hbm.20906. [DOI] [PMC free article] [PubMed] [Google Scholar]
- Schoenbaum G, Roesch MR, Stalnaker TA, Yuji K. A new perspective on the role of the orbitofrontal cortex in adaptive behaviour. Nat Neurosci Rev. 2010;10:885–892. doi: 10.1038/nrn2753. [DOI] [PMC free article] [PubMed] [Google Scholar]
- Schönberg T, Daw ND, Joel D, O'Doherty JP. Reinforcement learning signals in the human striatum distinguish learners from nonlearners during reward-based decision making. J Neurosci. 2007;27:12860–12867. doi: 10.1523/JNEUROSCI.2496-07.2007. [DOI] [PMC free article] [PubMed] [Google Scholar]
- Selemon LD, Goldman-Rakic PS. Longitudinal topography and interdigitation of corticostriatal projections in the rhesus monkey. J Neurosci. 1985;5:776–794. doi: 10.1523/JNEUROSCI.05-03-00776.1985. [DOI] [PMC free article] [PubMed] [Google Scholar]
- Selemon LD, Goldman-Rakic PS. Common cortical and subcortical targets of the dorsolateral prefrontal and posterior parietal cortices in the rhesus monkey: evidence for a distributed neural network subserving spatially guided behavior. J Neurosci. 1988;8:4049–4068. doi: 10.1523/JNEUROSCI.08-11-04049.1988. [DOI] [PMC free article] [PubMed] [Google Scholar]
- Silver MA, Ress D, Heeger DJ. Topographic maps of visual spatial attention in human parietal cortex. J Neurophysiol. 2005;94:1358–1371. doi: 10.1152/jn.01316.2004. [DOI] [PMC free article] [PubMed] [Google Scholar]
- Sutton RS, Barto AG. Introduction to reinforcement learning. Cambridge, MA: Massachusetts Institute of Technology; 1998. [Google Scholar]
- Thomas C, Ye FQ, Irfanoglu MO, Modi P, Saleem KS, Leopold DA, Pierpaoli C. Anatomical accuracy of brain connections derived from diffusion MRI tractography is inherently limited. Proc Natl Acad Sci U S A. 2014;111:16574–16579. doi: 10.1073/pnas.1405672111. [DOI] [PMC free article] [PubMed] [Google Scholar]
- Utter AA, Basso MA. The basal ganglia: an overview of circuits and function. Neurosci Biobehav Rev. 2008;32:333–342. doi: 10.1016/j.neubiorev.2006.11.003. [DOI] [PubMed] [Google Scholar]
- Verstynen TD. The organization and dynamics of corticostriatal pathways link the medial orbitofrontal cortex to future behavioral responses. J Neurophysiol. 2014;112:2457–2469. doi: 10.1152/jn.00221.2014. [DOI] [PubMed] [Google Scholar]
- Verstynen T, Jarbo K, Pathak S, Schneider W. In vivo mapping of microstructural somatotopies in the human corticospinal pathways. J Neurophysiol. 2011;105:336–346. doi: 10.1152/jn.00698.2010. [DOI] [PubMed] [Google Scholar]
- Verstynen TD, Badre D, Jarbo K, Schneider W. Microstructural organizational patterns in the human corticostriatal system. J Neurophysiol. 2012;107:2984–2995. doi: 10.1152/jn.00995.2011. [DOI] [PMC free article] [PubMed] [Google Scholar]
- Yeh FC, Tseng WY. NTU-90: a high angular resolution brain atlas contructed by q-space diffeomorphic reconstruction. Neuroimage. 2011;58:91–99. doi: 10.1016/j.neuroimage.2011.06.021. [DOI] [PubMed] [Google Scholar]
- Yeh FC, Verstynen TD, Wang Y, Fernández-Miranda JC, Tseng WY. Deterministic diffusion fiber tracking improved by quantitative anisotropy. PLoS One. 2013;8:e80713. doi: 10.1371/journal.pone.0080713. [DOI] [PMC free article] [PubMed] [Google Scholar]