Abstract
The recording of brain event-related potentials (ERPs) is a widely used technique to investigate the neural basis of sensory perception and cognitive processing in humans. Due to the low magnitude of ERPs, averaging of several consecutive stimuli is typically employed to enhance the signal to noise ratio (SNR) before subsequent analysis. However, when the temporal interval between two consecutive stimuli is smaller than the latency of the main ERP peaks, i.e., when the stimuli are presented at a fast rate, overlaps between the corresponding ERPs may occur. These overlaps are usually dealt with by assuming that there is a simple additive superposition between the elicited ERPs and consequently performing algebraic waveform subtractions. Here, we test this assumption rigorously by providing a statistical framework that examines the presence of nonlinear additive effects between overlapping ERPs elicited by successive stimuli with short interstimulus intervals (ISIs). The results suggest that there are no nonlinear additive effects due to the time overlap per se but that, for the range of ISIs examined, the second ERP is modulated by the presence of the first stimulus irrespective of whether there is time overlap or not. In other words, two ERPs that overlap in time can still be written as an addition of two ERPs but with the second ERP being different from the first. This difference is also present in the case of nonoverlapping ERPs with short ISIs. The modulation effect elicited on the second ERP by the first stimulus is dependent on the ISI value.
Keywords: ERP, EEG, mixed effects models, analysis of variance
event-related potentials (ERPs) consist in transient monophasic deections in the human electroencephalogram (EEG), elicited by fast-rising sensory, motor, or cognitive events (Luck 2005; Mouraux and Iannetti 2008). From a neurophysiological perspective, ERPs reflect synchronous changes of slow postsynaptic potentials occurring within a large number of similarly oriented cortical pyramidal neurons (Nunez and Srinivasan 2006). Because of their usually small magnitude compared with background EEG, the identification of ERPs relies on techniques that enhance their signal-to-noise ratio (SNR). Although approaches that allow estimating ERPs in single trials have been recently developed (e.g., Truccolo et al. 2003; Hu et al. 2010), the most widely used strategy to enhance their SNR is to average responses across trials in the time domain, thus disclosing ERPs that are phase locked to the stimuli (Luck 2005). For this reason, in most ERP experiments a large number of stimuli is presented.
In this case, when the interstimulus interval (ISI) is relatively long, i.e., the stimuli are presented at a slow rate (e.g., 0.5 Hz or less), the ERPs elicited by successive stimuli do not overlap in time; therefore, simple across-trial averaging of ERPs does not pose any problem, provided that identical stimuli elicit identical ERPs (no modulation occurs). However, in many cases short ISIs are necessary, e.g., where many stimuli are needed to obtain a reliable response (Luck 2005) or interactions in the processing of quickly presented successive stimuli are of physiological interest (for example processing of natural stimuli). As a result, if the ISI is shorter than the latency of the last ERP elicited by the preceding stimulus, overlap between successive ERPs may occur, with consequent distortion of the average ERP waveform. To account for this, simple ERP subtraction (Luck 2005) or more elaborate methods such as the adjacent response (Adjar) technique (Woldorff et al. 1993) have been proposed.
An implicit assumption in all the aforementioned approaches is that ERP generation is a time-invariant and linear process. The former assumption implies that single identical stimuli applied at different times elicit identical ERPs. The latter assumption implies that interactions between two or more successive stimuli are linear. In other words, the total ERP elicited by two (or more) successive stimuli is equal to the linear addition between the ERP waveforms that would have resulted if each stimulus was applied separately, irrespective of whether there is time overlap or not between the successive ERPs. Therefore, if both time invariance and linearity hold and identical stimuli are applied, the total ERP should be equal to the linear addition between identical, time-shifted ERP waveforms. However, it is known that ERPs are modulated (most usually inhibited) by the presence of preceding stimuli in block design protocols, whereby stimuli delivered at the same ISI are presented in blocks (Wang et al. 2008, 2010). To avoid this issue, stimuli delivered at different ISIs are often presented in a randomized fashion (Wang et al. 2010). Whereas it is relatively straightforward to determine whether there are nonlinear interactions (modulation) between the nonoverlapping responses evoked by two successive stimuli, this is not the case when the two responses overlap. Moreover, one may view the ERP generation process as a system with memory equal to the ERP duration. Therefore, an important question is whether this system behaves nonlinearly when multiple stimuli are occurring at ISIs that are shorter than its memory.
In the above context, we present a mixed effects statistical framework that can be used to examine the presence of nonlinear interactions between successive ERPs when there is time overlap, using both average as well as single-trial data. We subsequently apply the proposed approach to somatosensory ERPs elicited by nociceptive laser stimulation presented in pairs at different ISIs ranging from 250 to 2,000 ms. The results clearly show that the ERPs elicited by the second stimulus are modulated by the preceding stimulus, even when there is no time overlap between the two ERPs. Therefore, the interactions between successive ERPs are not linear. We also show that the ERPs elicited by the first stimulus are time invariant, i.e., that when a single stimulus is presented the same ERP waveform is generated and that the modulation on the ERP elicited by the second stimulus depends on the ISI value. Extending the last two results, we show that the interaction between successive ERPs can still be written as a sum of two waveforms, one being the ERP elicited by the first stimulus and the other being the modulated ERP elicited by the second stimulus. In other words, while linearity does not hold due to the presence of these modulations, additivity holds when the latter are taken into account.
MATERIALS AND METHODS
Experimental Methods
Eleven healthy volunteers aged from 22 to 50 yr participated in the study. All participants gave written informed consent, and the local ethics committee approved the procedures. Noxious radiant-heat stimuli were generated by an infrared neodymium yttrium aluminum perovskite (Nd: YAP) laser with a wavelength of 1.34 μm (Electronical Engineering). At this short wavelength, the skin is very transparent to the laser radiation and, consequently, the laser pulses activate directly nociceptive terminals in the most superficial skin layers (Iannetti et al. 2006). Laser pulses were directed to the dorsum of the right hand and a He-Ne laser pointed to the area to be stimulated. The laser pulse was transmitted via an optic fiber and focused by lenses to a spot diameter of ∼8 mm (50 mm2) at the target site. The duration of the laser pulses was 4 ms, and its energy was 3.5 J.
Electroencephalographic (EEG) data were collected in a single recording session, comprising 10 blocks of stimulation. In each block 30 trials were presented, with an intertrial interval (ITI) ranging between 15 and 18 s. In each trial, laser pulses were delivered to the dorsum of the right hand either as a single laser stimulus (SINGLE) or as a pair of laser stimuli (S1S2) presented at an interstimulus interval (ISI) of 250, 500, 1,000, or 2,000 ms. The ISI was randomly varied across trials, and single-stimulus trials were intermixed with paired trials. Therefore, the participants were not able to predict if and when a second laser pulse would follow the first stimulus of each trial. After each stimulus, the laser beam target was shifted by ∼20 mm in a random direction to avoid nociceptor fatigue and sensitization. The laser beam was controlled by a computer that used two servo-motors (HS-422; Hitec RCD; angular speed, 60°/160 ms) to orient the laser beam along two perpendicular axes (Lee et al. 2009).
Participants wore protective goggles and acoustic isolation was ensured using earplugs and headphones. Both the laser beam and the controlling motors were completely screened from the view of the participants. The EEG was recorded using 30 Ag-AgCl electrodes placed on the scalp according to the International 10–20 system, using the nose as reference. To monitor ocular movements and eye blinks, electrooculographic (EOG) signals were recorded from two surface electrodes, one placed over the lower eyelid and the other placed 1 cm lateral to the outer corner of the orbit. The electrocardiogram was recorded using two electrodes placed on the dorsal aspect of the left and right forearms. Signals were amplified and digitized using a sampling rate of 1,024 Hz and a precision of 12 bits, giving a resolution of 0.195 μV/digit (System Plus; Micromed).
Data Preprocessing
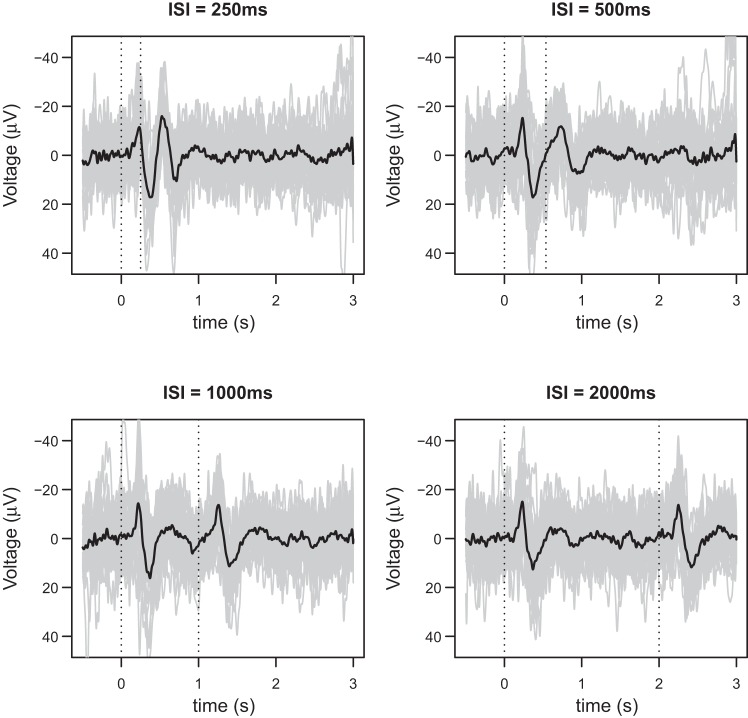
Data preprocessing was performed using Letswave (http://www.nocions.org/letswave/; Mouraux and Iannetti 2008) and Matlab (The Mathworks). Continuous EEG recordings were segmented into epochs using a time window of 3.5 s (−0.5 to +3 s relative to the onset of the 1st stimulus). Each epoch was baseline corrected using the time interval ranging from −0.5 to 0 s as reference, and bandpass filtered (1–30 Hz, fast Fourier transform filter). Electroculographic and electrocardiographic artifacts were subtracted using a validated method based on independent component analysis (Jung et al. 2000). In all datasets, independent components (ICs) related to eye movements had a large electrooculogram channel contribution and a frontal scalp distribution. Finally, epochs in which both laser stimuli were not perceived, epochs with pain ratings 2 SD above or below the average of the condition, and epochs containing artifacts exceeding ±100 μV were rejected from further analysis. In the analyses presented below, we use both the average waveforms, whereby for each subject epochs were averaged according to ISI value (SINGLE: 250, 500, 1,000, and 2,000), as well as single-trial waveforms. Figure 1 shows the single trials as well as the average waveforms of a randomly selected participant.
Fig. 1.
The single-trial (gray) and average waveforms (black) from a randomly selected participant. The four figures correspond to the four interstimulus intervals (ISIs) that were considered in the study: 250, 500, 1,000, and 2,000 ms. In each figure there are between 28 and 30 single-trial waveforms. Note the much lower signal-to-noise ratio of single-trial waveforms, compared with average waveforms.
Assessment of Nonlinear Interactions
Broadly speaking, a system is any entity that transforms an input variable into an output variable. A system can be described mathematically by a corresponding mapping S. This mapping may assume a variety of forms, such as linear/nonlinear differential or difference equations, impulse response models or Volterra/Wiener models, depending on the system properties. A continuous- or discrete-time system is said to be linear if it satisfies the superposition principle, i.e., (Oppenheim et al. 1983):
| (1) |
where x1(t) and x2(t) are any two input signals to the system and α1 and α2 are real constants. Any system that does not satisfy the above relation is termed nonlinear.
In the present case, consider the two input signals constituted by the single nociceptive laser stimuli S1 and S2, separated in time by the ISI and the elicited ERPs to be their corresponding outputs, i.e., S[x1(t)] and S[x2(t)], respectively. These two input signals x1(t) and x2(t) are identical. In this context, time invariance and linearity (or equivalently no nonlinear interaction between the 2 stimuli) respectively imply that 1) when applied separately, the two stimuli will elicit the same ERP response waveform, time shifted by the respective ISI; and 2) the total ERP, when both stimuli are applied simultaneously, will be equal to the linear addition between the ERPs elicited by each stimulus separately, even when there is overlap in time between the two (i.e., the ISI is short enough). On the other hand, if nonlinear interactions occur, the total ERP when both stimuli are applied will be different from the linear addition between the single-stimulus ERPs. This is shown schematically in Fig. 2. In the hypothetic scenario presented in this figure, there is time overlap between the two ERPs and the second ERP is smaller in magnitude than the first one by a factor of 50% (inhibitory modulation).
Fig. 2.
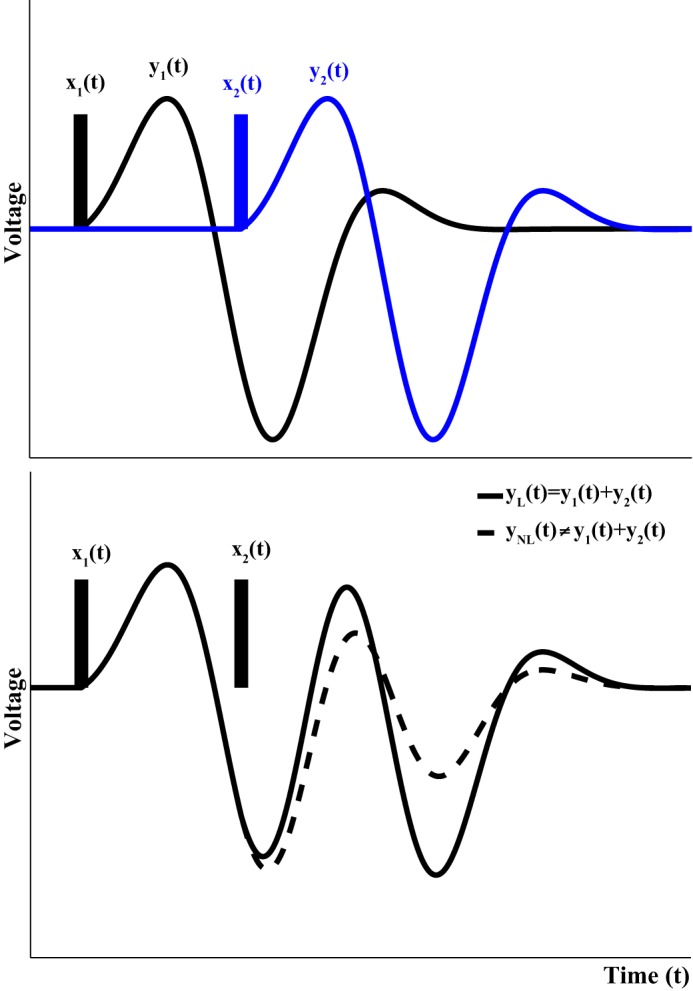
Schematic illustration of linear and nonlinear interactions between two successive impulsive-like stimuli. When applied separately, the two stimuli x1(t) and x2(t) elicit the output waveforms y1(t) and y2(t), respectively (top). When the two stimuli are applied in succession and there is no nonlinear interaction between them, the total output yL(t) is simply the addition between y1(t) and y2(t) (bottom, solid line). On the other hand, when nonlinear interactions between the two stimuli/responses occur, the total output yNL(t) is not equal to y1(t) + y2(t) (bottom, dashed line). In the hypothetical case illustrated at bottom, the response to the second stimulus is suppressed by 50% by the presence of the first stimulus. Hereby we examine if the principle of superposition holds and also if the event-related potentials (ERPs) elicited are identical, i.e., whether y1(t) = y2(t) in the case of somatosensory stimuli, for the range of ISIs considered.
Under the assumptions of time invariance and linearity, for identical impulsive stimuli, Eq. 1 can be rewritten as follows:
| (2) |
where α1 = α2 = 1, corresponding to our experimental design. In the above equation, we have assumed that, due to time invariance each (identical) stimulus results in the same output signal (ERP) when applied separately. Additionally, due to both linearity and time invariance, the second signal exhibits a delay equal to the ISI of the paired-stimulus experiment.
In the following sections we describe the statistical methodology and how it was applied to our data to test whether Eq. 2 holds. We also investigate how modulation potentially affects this relation.
Statistical methodology.
Our tests are performed on a point-by-point basis. We begin by introducing the notation that we will be using in the following sections. Let yisk(t) be a kth single trial output waveform (k = 1, . . ., nis) from the ith individual (i = 1, . . ., 11) that belongs to the sth ISI category (s = 0, . . ., 4) at time point t. Due to the employed sampling frequency, the time steps in the data are separated by 1.024−1 s temporal intervals, resulting in a total of 3,584 time points. The number of single trial ERP waveforms varies for each subject and ISI category (including the SINGLE data). In general for a given subject and an ISI group we have between 24 and 30 single trial waveforms (nis in the previous notation). The subscripts for the ISI categories correspond to s = 0 (SINGLE), s = 1 (250 ms), s = 2 (500 ms), s = 3 (1,000 ms), and s = 4 (2,000 ms).
The two tests we use, which we describe in detail below, are performing comparisons, both omnibus and post hoc, between two or more waveform groups. Specifically, the omnibus tests examine whether there are differences between any two of the examined waveforms, whereas the post hoc tests subsequently determine which of the waveforms are different in a pairwise manner, provided the corresponding omnibus test has rejected the null hypothesis. These groups are created from the data to answer questions related to time invariance and linearity of ERP interactions. In the following sections we describe in detail how we obtain the waveforms Yijk used in our tests from the measured waveforms yisk. Here j denotes the jth comparison group (j = 1, . . ., J).
The symbol “·” in the subscript is used to denote a time-locked average waveform, with respect to the symbol that it replaces. This applies to both yisk and Yijk. For example,
| (3) |
is the average measured waveform across all single trials for individual i and ISI category s.
We next describe the statistical framework we employed to compare the different waveform group; we used ANOVA for the average waveforms and mixed effects models (MEMs) for the single-trial waveforms.
ANALYSIS OF VARIANCE.
ANOVA is employed when we use the average waveforms. These waveforms are averaged across all single-trials for each participant and each comparison group. Since we have data from 11 subjects, there exist 11 average waveforms in every comparison group (i = 1, . . ., 11). Consider that there is a total of J such groups. The ANOVA formulation in this case can be written as:
| (4) |
where j = 1, . . ., J. The error term ϵij(t) is a zero mean Gaussian noise and it is assumed i.i.d. across all subjects and groups. Essentially, Eq. 4 states that at any time point, the expected value E[Yij.(t)] of a waveform is equal to a grand mean [μ(t)] plus a quantity that differentiates each group mean mj(t) [with m1(t) = 0]. The omnibus ANOVA-based test is used to determine whether all groups have equal expected values at any time point or whether there are at least two that are different. In a more formal hypothesis testing notation this can be written as
| (5) |
In addition to the omnibus test, we can perform post hoc tests for pairwise comparisons between the waveforms mj(t). These are performed when H0 from the omnibus test is rejected and we want to identify the groups that are different in a statistical sense.
MIXED EFFECTS MODEL.
Unlike the average waveforms, the single-trial waveforms are extremely noisy. Thus the error variance of whichever model we choose to employ for their analysis will be much larger compared with models for the average responses. The MEM framework allows us to incorporate random effects in the model. In the present case, this translates into decomposing the different variance components. Specifically, in addition to the error variance, we include an additional variance term that models the variation between the individuals in our experiment in terms of their ERP waveforms. The resulting MEM can be written as:
| (6) |
As before, the error ϵijk(t) is a zero-mean i.i.d. Gaussian noise. However, we now incorporate the between-subject variance term ζi(t). This term essentially allows us to assume that each subject has its own error variance, thus allowing us to model discrepancies between subjects.
The expected waveform output, E[Yijk(t)], is once again considered to be the sum of a grand mean, μ(t), and a group effect βj(t), with β1(t) = 0. Therefore, the MEM in Eq. 6 takes into account both potential differences in the expected value due to the group effect as well as variation between different subjects.
The omnibus MEM-based test is used to determine whether the group effect is zero for all groups or there is at least one group with statistically significant effect. More formally:
| (7) |
In the case where H0 is rejected, additional post hoc tests can be performed for pairwise comparisons between the waveforms βj(t).
MULTIPLE TESTING CORRECTION FOR P VALUES.
Both ANOVA and MEM tests are performed on a point-by-point basis. Thus the results from these tests are a series of P values from multiple tests. Furthermore, these tests are not independent since we expect a nonzero autocorrelation across the ERP waveforms. Therefore, we use a method that corrects the obtained P values.
Specifically, we choose the Simes method (Simes 1986; Sarkar and Chang 1997), which is a modification of the Bonferroni procedure for testing multiple hypotheses. This method is better suited to our problem and has an advantage over the classical Bonferroni procedure when several highly correlated statistics are involved. The method is straightforward and it is based on the ordered P values in a sliding window of length L with the P value we want to correct being in the center (L = 2w + 1).
Consider that we want to correct the jth P value pj. Then, we consider the P values pj−w; pj−w+1, . . .; pj, . . ., pj+w−1; pj+w and order them in an ascending order p(1), . . ., p(L). The corrected value of pj is given by
| (8) |
After trying different values for w, we present results for w = 50. This value was chosen because it removes obvious outlier P values (e.g., spikes) without oversmoothing the results. Smaller values of w roughly interpolate the existing P values while larger ones remove apparent trends in the results.
In the following three sections we describe the three testing schemes we employ to test both time invariance and linearity.
ERPs elicited from successive stimuli with no time overlap.
In this testing scheme we focus on the ERP waveforms for which there is no time overlap. We utilize the ERP waveforms from the SINGLE data, as well as those from the ISI = 1,000-ms and ISI = 2,000-ms data. The purpose of this scheme is to examine whether time invariance holds, i.e., if identical stimuli applied separately at different times result in the same response and also if there is modulation when there is no time overlap between successive ERPs. To this end we define the five comparison groups:
1) The ERPs from the SINGLE data {Yi1k(t) = yi0k(t)};
2) The first elicited ERP from the ISI = 1,000-ms data; {Yi2k(t) = yi3k(t)};
3) The second elicited ERP from the ISI = 1,000-ms data; {Yi3k(t) = yi3k(t + 1,024)};
4) The first elicited ERP from the ISI = 2,000-ms data; {Yi4k(t) = yi4k(t)}; and
5) The second elicited ERP from the ISI = 2,000-ms data; {Yi5k(t) = yi4k(t + 2,048)}.
The average waveforms Yij. are calculated from the single-trial waveforms Yijk according to Eq. 3. Figure 3 depicts the five waveforms averaged across all subjects.
Fig. 3.
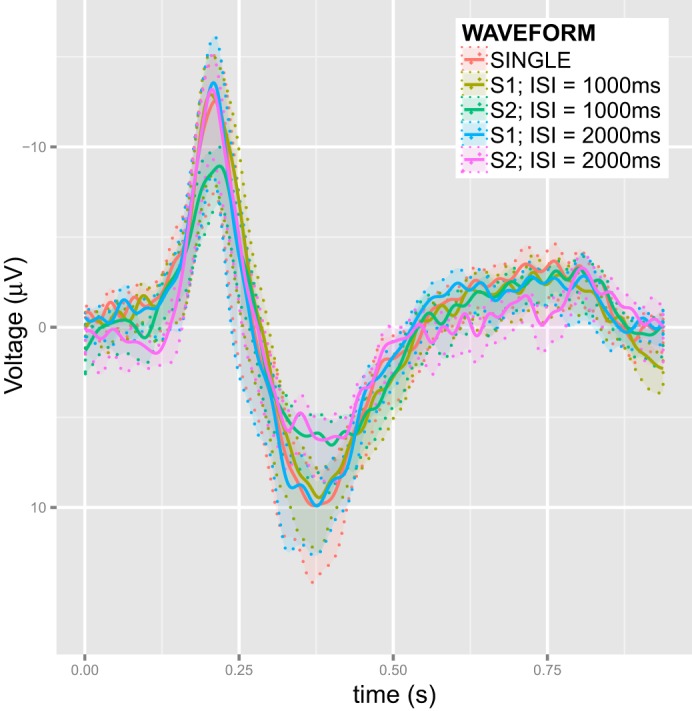
The five ERP waveforms elicited by single stimuli from the SINGLE data and the nonoverlapping ISI = 1,000-ms and ISI = 2,000-ms data. Si denotes stimulus number (i = 1, 2). The waveforms that are presented in the plot are averaged across all trials and subjects in the study. The transparent bands indicate the SE of these averages.
We apply the two statistical methods described in Statistical methodology to compare the above five groups. The statistical inference from these method is utilized to assess time invariance and modulation. If the omnibus test is not statistically significant, i.e., all groups are equal, then the time invariance principle holds and there is no modulation, at least for ISIs for which there is no time overlap. If the omnibus fails, i.e., at least one group is different, the post hoc comparisons are used for further inference. In this case the time invariance principle is either violated in general or there is modulation due to the second successive stimulus. The latter case corresponds to the ERPs elicited by the first stimulus (groups 1, 2, and 4) demonstrating no significant difference while the ERPs elicited by the second stimulus (groups 3 and 5) being statistically different than these three.
Comparison of ERPs elicited by the second stimulus.
We formulate our second testing scheme based on the results of the tests described in ERPs elicited from successive stimuli with no time overlap. According to these results, which suggest that time invariance holds as detailed below, we assume that the first of the two successive stimuli elicit the same response for all ISIs in the experiment and thus focus on the ERPs elicited by the second stimulus. Using this assumption, we examine the hypothesis that the second stimulus also elicits the same response, irrespective of ISI. Note that we do not test whether the two successive stimuli elicit identical responses but whether the response from the second stimulus is affected by the ISI. In essence, we test whether the possible modulatory effects on the second elicited ERPs are different for different ISIs.
To remove the ERP response from the first stimulus we use the average SINGLE data as reference. From every single-trial waveform and for all successive stimuli data, we subtract the average SINGLE waveform of the same subject. Thus we obtain the noisy single-trial waveform with the response from the first stimulus removed by using the smooth average SINGLE waveform, i.e., we obtain single-trial waveforms that only contain the response to the second stimulus. Our four comparison groups are as follows:
1) The ERPs from the ISI = 250-ms data, starting from the application of the second stimulus after subtracting the respective average SINGLE waveform for each subject; {Yi1k(t) = yi1k(t + 256) − yi0·(t + 256)};
2) Same as 1, for data corresponding to ISI = 500 ms; {Yi2k(t) = yi2k(t + 512) − yi0·(t + 512)};
3) Same as 1, for data corresponding to ISI = 1,000 ms; {Yi3k(t) = yi3k(t + 1,024) − yi0·(t + 1,024)}; and
4) Same as 1, for data corresponding to ISI = 2,000 ms; {Yi4k(t) = yi4k(t + 2,048) − yi0·(t + 2,048)}.
The average waveforms(Yj·) are calculated according to Eq. 3. These are presented in Fig. 4. As with all our testing schemes, the MEM framework is employed for the single-trial waveforms, while the ANOVA framework is used for the average waveforms.
Fig. 4.
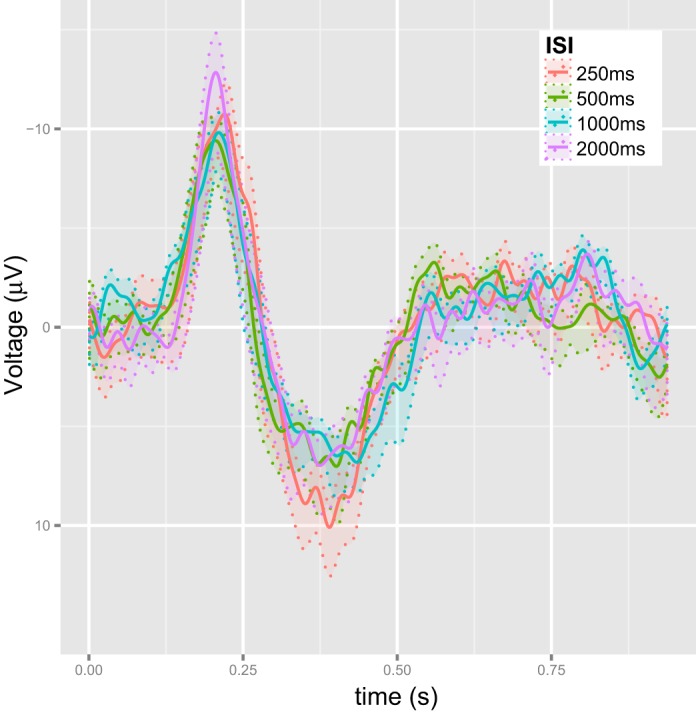
The average ERP waveforms (fi SE) elicited by the second stimulus after removing the effect of the first stimulus using the SINGLE data.
The statistical results provide an indication as to whether the modulation effect depends on the ISI. If the omnibus test is not significant and the four groups are not statistically different, then we have strong evidence against any association between modulation magnitude and ISI value. On the other hand, if the groups are statistically different, the post hoc test can be used to examine these differences. For instance, modulation could be affected by the presence of a time overlap (groups 1 and 2) or not (groups 3 and 4).
Assessment of linear addition by compairing observed and artificially created ERPs.
In our third testing scheme we examine whether additiveness between ERPs elicited by successive stimuli holds. Here, based on the results from Comparison of ERPs elicited by the second stimulus, we take into account the modulation in the ERPs elicited by the second stimulus. Specifically, we examine whether the waveform elicited by successive identical stimuli when time overlap occurs can still be written as the algebraic sum of two ERPs, with the second ERP being different to the first. By generalizing Eq. 2, this can be expressed as:
| (9) |
where SUM is the nonmodulated ERP while SMISI is the modulated ERP that depends on the specific ISI.
The challenge here is that we cannot obtain raw, single-trial waveforms that include the response to the second stimulus only. However, we can get approximate versions of these by employing the waveforms used in Comparison of ERPs elicited by the second stimulus. Specifically, we create artificial single-trial waveforms by adding the average waveforms (see Comparison of ERPs elicited by the second stimulus) to the same individual's single-trial SINGLE waveforms, time shifted according to the respective ISI. Subsequently, we compare these artificial ERPs to the observed data for the same ISI, by applying the same statistical methods described above, whereby the number of groups is equal to two in this case (artificial and measured).
We use the average rather than single-trial responses to the second stimulus because the latter are very noisy. Thus, by adding the average response of the second stimulus to the noisy waveform with only the first stimulus present, we essentially add the expected value of the second ERP without adding any further variation. Additionally, had we chosen to add two single-trial waveforms, we could run into the issue of cancelling out important components (e.g., peaks) of the resulting waveform because of the noisy oscillations of the two single-trial waveforms.
For a specific ISI, we do not create artificial ERP waveforms using only the average ERP elicited by the second stimulus that corresponds to the same ISI. Instead, for a given ISI, we create four artificial waveforms, using the average EPRs elicited by all four ISIs in our experiment and time shifting them accordingly. Note that we do not add the entire average waveform but rather the section that corresponds to the second stimulus (with total length of 0.75 s).
By doing this we have in total 16 pairs of comparison groups:
1) The measured single trial ERPs from the ISI = ISIs data, where we use the section 0.75 s after the application of the second stimulus; Yi1k(t + ISIs) = yisk(t + ISIs); and
2) The artificially created ERPs with ISI = ISIs, using the average second stimulus waveform from the ISI = ISIs′ data, added to the SINGLE ERPs; Yi2k(t + ISIs) = yi0k(t + ISIs) + yis'·(t + ISIs') − yi0·(t + ISIs').
In the previous definition, ISIs corresponds to an ISI = 250-, 500-, 1,000-, and 2,000-ms data for s = 1, 2, 3, and 4, respectively. The 16 pairs are obtain through all the combinations of s and s′, where both take the values {1, 2, 3, 4}.
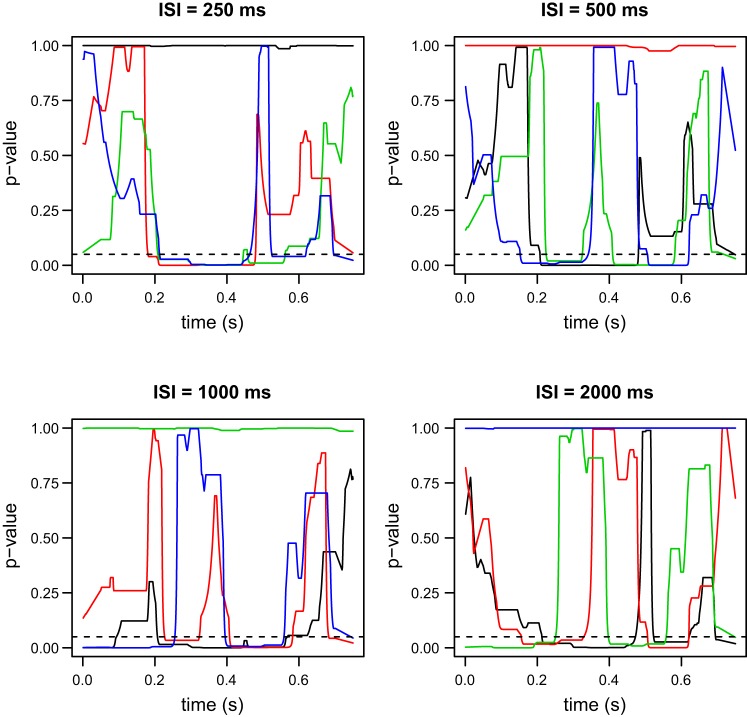
The results from the statistical comparisons in the current section can indicate whether additivity, as defined in Eq. 9, holds. In this case we do not expect any significant differences between the observed and artificial waveforms created using the average waveform from the same ISI, i.e., s = s′. Furthermore, if no significant differences are present between the two waveforms, for s ≠ s′, then we have some evidence against modulation being dependent on the ISI and all ERPs elicited by the second stimulus are the same. In other words, the mapping SMISIdoes not depend on the ISI. On the other hand if there are differences for s ≠ s′, Eq. 9 still holds but SMISI is different for different ISIs.
RESULTS
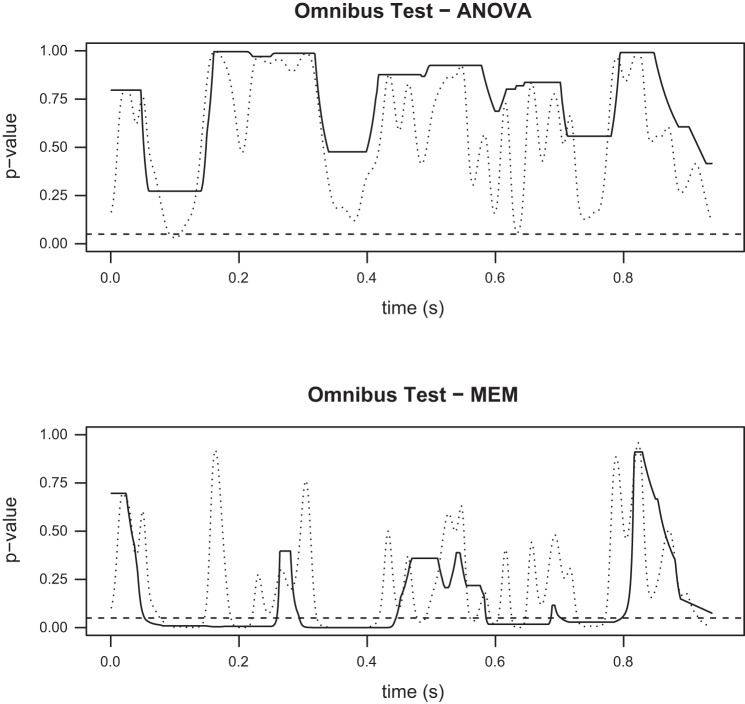
A recurrent theme in the results, after applying both statistical methods discussed in Statistical methodology, is that the ANOVA and mixed effect methods lead to different conclusions. The ANOVA-based tests are always more lenient and the null hypothesis is never rejected. On the other hand, the MEM-based tests reject the null hypotheses of the omnibus tests in all cases (for example, see Figs. 5 and 7). The MEM is designed to take into account additional sources of variability and thus leaves less unexplained variance. For this reason, in this particular case, it gives more accurate results than the ANOVA test. In other words, the MEM test is more powerful than the ANOVA test, which is more likely to lead to false negatives (larger type II error). Therefore, the conclusions we discuss in this section are mostly based on the results of the MEM framework.
Fig. 5.
P values for the omnibus tests comparing the 5 ERP waveforms, as discussed in ERPs elicited from successive stimuli with no time overlap. Top: ANOVA. Bottom: mixed effects model (MEM). Dotted lines show the raw P values obtained by the tests, while solid lines show the P values after the application of Simes' method for multiple testing correction. Although the two methods are testing the same hypothesis, the two tests lead to different conclusions. According to the ANOVA test, we cannot reject the hypothesis that all five ERP waveforms are the same, while the MEM test provides evidence against the same hypothesis. Time zero corresponds to the application of the first or second laser stimulus, when there is no time overlap between the successive elicited ERPs.
Fig. 7.
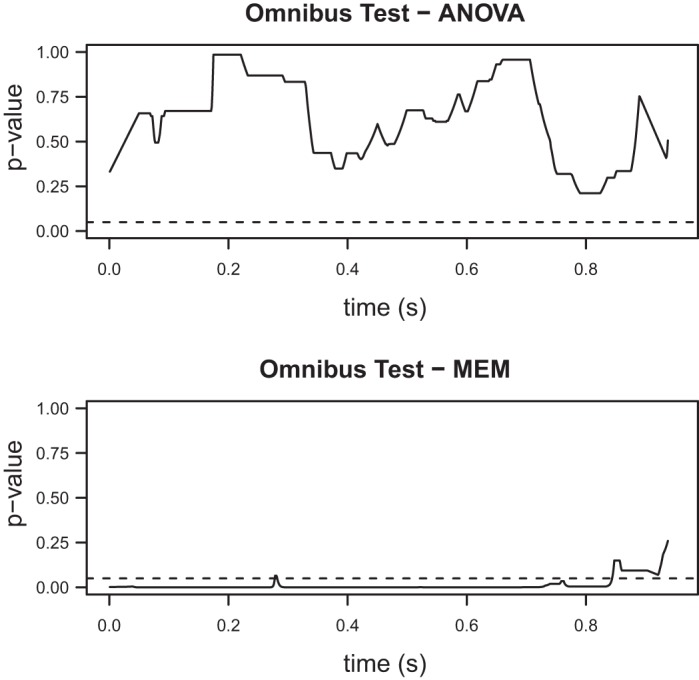
P values (corrected) for the omnibus tests comparing the four ERP waveforms discussed in Comparison of ERPs elicited by the second stimulus. Top: ANOVA; bottom: MEM. Similar to the results presented in Fig. 5, only the more suitable MEM reveals significant differences between the ERPs elicited by the second stimulus.
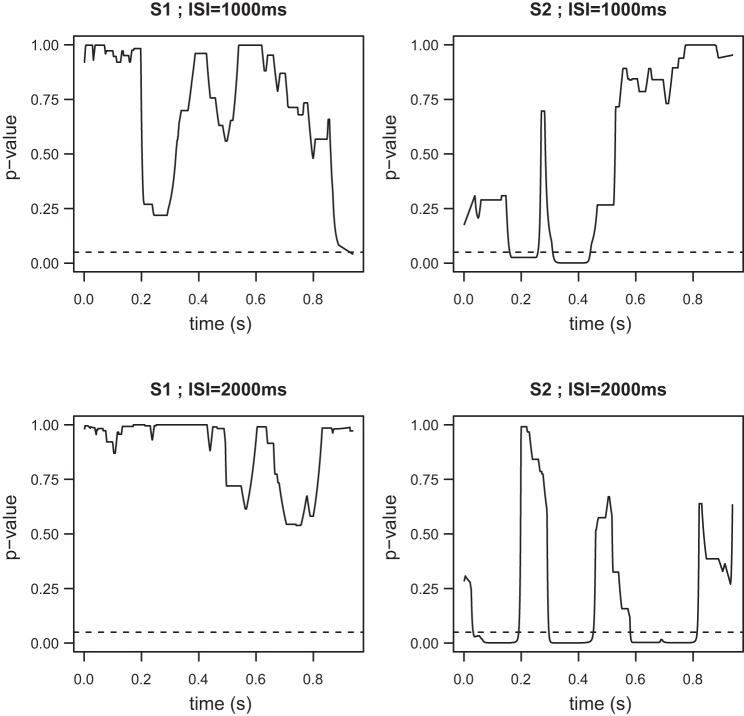
The MEM omnibus test for our first scheme (ERPs elicited from successive stimuli with no time overlap) suggests that there are significant differences between the five waveforms (Fig. 5, bottom), in contrast to the ANOVA test (Fig. 5, top). The time intervals during which these differences are statistically significant are 54–259, 295–440, and 585–796 ms. As it can be seen in Fig. 3, the first two intervals correspond to the N2 and P2 peaks of the average ERP waveforms. A common practice is to simply use these peaks for comparisons (see also the discussion); however, our approach examines the entire waveforms and provides more detailed characterizations. We note that in Fig. 5 we provide both the raw and corrected P values using Simes' method described in Statistical methodology. For the remainder of our figures we only use the corrected P values. The post hoc comparisons (Fig. 6) provide a detailed insight with regards to which specific ERPs from the successive stimuli trials with no time overlap are different from the ERPs elicited by single stimulus trials (SINGLE). Specifically, there are no differences between the SINGLE waveforms and the ERPs elicited by the first stimulus for either the ISI = 1,000-ms or ISI = 2,000-ms waveforms. However, both ERPs elicited by the second stimulus appear to be significantly different compared with the ERPs from the SINGLE data, again mostly in the regions around the N2 and P2 peaks. These results suggest that time invariance holds but that the ERPs elicited by the second stimulus are different from the first ERPs, due to modulation from the preceding stimulus, when there is no time overlap.
Fig. 6.
Post hoc tests based on the coefficients of the MEM (6) presented in ERPs elicited from successive stimuli with no time overlap. The P values (corrected) compare the ERP waveforms elicited by the first (left) and second stimulus (right) from the ISI = 1, 000-ms (top) and ISI = 2,000-ms (bottom) trials with the ERP waveforms elicited by the single stimulus trial. Whereas the ERPs elicited by the first stimulus are not statistically different to the single stimulus ERPs, the ERPs elicited by the second stimulus exhibit clear amplitude differences, mainly around the N2 and P2 peaks.
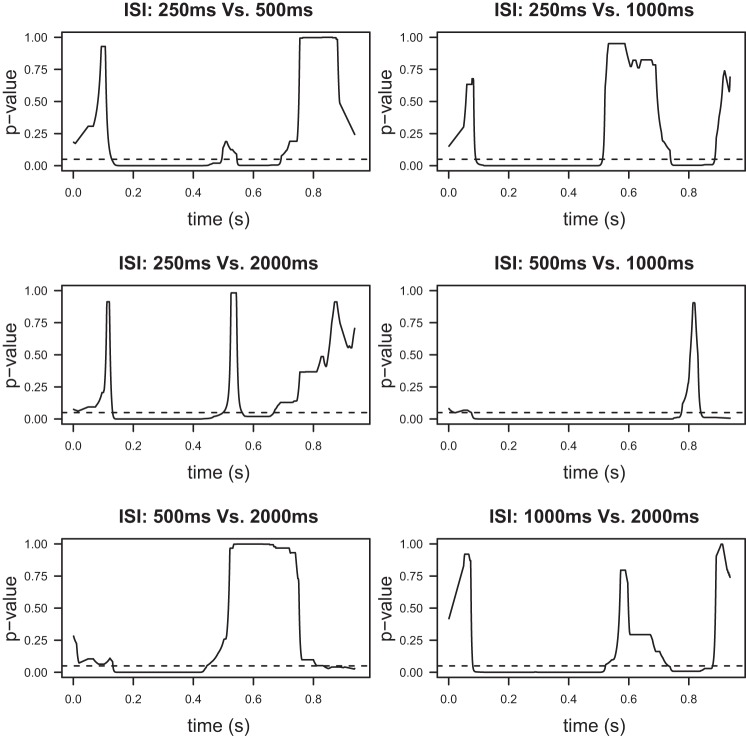
With time invariance for the first ERPs established, the testing scheme described in Comparison of ERPs elicited by the second stimulus is utilized to compare the ERPs elicited by the second stimulus. The MEM omnibus test (Fig. 7, bottom) strongly suggests that at least one of the ERPs is different, in contrast to the ANOVA test (Fig. 7, top). Therefore, either modulation depends on the ISI value or on whether there is time overlap or not. The post hoc tests (Fig. 8) that compare the four waveforms in pairs reveal that the ERPs elicited by the second stimulus for the examined ISIs are all significantly different to each other. The differences here are more pronounced when we compare the P values to the ones form our previous test. As before, the N2 and P2 peaks are included in the regions where significant differences are observed. Based on these results, we can conclude that modulation depends on the ISI value.
Fig. 8.
P values for the post hoc pairwise comparisons of the four ERP waveforms discussed in Comparison of ERPs elicited by the second stimulus. Since these tests yield significant differences for all possible ISI pairs, it can be concluded that the modulation exerted on the ERP elicited by the second stimulus depends on the value of the ISI.
The third testing scheme (see Assessment of linear addition by comparing observed and artificially created ERPs) extends our findings from the previous tests. Specifically, we examine whether linear addition as defined by Eq. 9 holds in a statistical sense. The results (Fig. 9) suggest that Eq. 9 holds only when the average ERP used to create the artificial data is constructed using data that correspond to the same ISI as the observed waveforms. This suggests that Eq. 9 holds but that the waveform SMISI depends on the ISI value (i.e., modulation depends is dependent on ISI value). Thus, even though the interactions between ERPs elicited by successive stimuli are not linear in the strict sense, given that modulation is present, the resulting waveform can still be written as a linear algebraic sum of two ERPs different to each other.
Fig. 9.
Test results (corrected P values) for the 16 tests described in Assessment of linear addition by comparing observed and artificially created ERPs. The colors indicate the dataset from which the average second elicited ERP was obtained to create the artificial waveforms. Black: ISI = 250 ms; red: ISI = 500 ms; green: ISI = 1,000 ms; and blue: ISI = 2,000 ms. The results suggest that linear addition holds but only when the ISI-dependent modulation for the second ERP waveform is taken into account.
DISCUSSION
We have developed a statistical framework to investigate the interactions between ERPs elicited by two successive stimuli at short intervals, i.e., at intervals where overlap between successive ERPs may occur, using both average and single-trial EEG data. Specifically, we formulated statistical tests to examine whether 1) ERP generation is time invariant, 2) ERPs elicited by the second stimulus are modulated by the presence of the first stimulus and this modulation depends on the ISI, and 3) the ERP waveforms add linearly when there is time overlap between them after taking into account any modulation effects. We used ANOVA-based tests for the average waveforms and MEM-based tests for the single trial waveforms.
The results from both the ANOVA and the MEM-based models (see ERPs elicited from successive stimuli with no time overlap; Fig. 6, left) suggest that time invariance holds, i.e., when a single stimulus is applied, the ERP that is generated can be considered as being constant, in a statistical sense. However, despite the randomized experimental protocol that was employed, the MEM-based tests suggest that the second ERP is partly modulated by the presence of the first stimulus and that the extent of this modulation depends on the ISI value. This can be concluded by observing that the pairwise tests between the second ERPs yield significant differences for all ISIs, which suggests that the corresponding ERP waveforms are different (Fig. 8). On the other hand, the ANOVA-based tests failed to detect these modulation effects. This is due to the fact that the ANOVA-based tests do not take into account the variability of the ERP waveform within each subject (between trials); as this variability is considerable, it influences the outcome of the statistical tests. It is well established that single-trial ERP waveforms are noisy and variable; our results suggest that it is important to incorporate this variability in the context of examining interactions between ERPs elicited by successive stimuli. Therefore, the inference and conclusions that we draw are based on the MEM-based tests.
Moreover, the MEM-based tests suggest that the modulation effect does not depend on the presence of time overlap per se as the total ERP waveform elicited by two stimuli when time overlap occurs (ISIs of 250 and 500 ms) can be written as a linear addition between two ERP waveforms, albeit with the second waveform being different than the first (Eq. 9 and Fig. 9). However, the definition of linearity requires that Eq. 1 is valid. Therefore, our overall results suggest the presence of nonlinear interactions as modulation will cause this equation not to hold. On the other hand, we show that instead of Eq. 1 (linearity) and Eq. 9 (additivity) holds. This has important implications, as superposition of ERP-type signals is rather common in sensory neurophysiology and cognitive neuroscience (including the processing of natural stimuli) and overlapping ERP signals are typically subtracted, assuming linearity and/or additivity between the two signals. Here we show that subtraction of overlapping ERP responses is a valid procedure, as long as possible modulatory effects are taken into account.
Our results agree with previous studies (Wang et al. 2008, 2010; Iannetti et al. 2008) that have suggested that for short ISIs, the second ERP is different than the first, due to modulation effects. However, the framework we develop here extends these results as it allows for examining the entire ERP waveforms from single-trial data, even when there is time overlap; in the aforementioned studies the results were solely based on the ERP peaks obtained from average waveforms. As stated above, the MEM framework results in an increasing sensitivity with respect to the detection of modulatory effects. Indeed, in those studies, a strong suppression of the N2-P2 peak-to-peak amplitude was detected when the ISI was kept constant within each simulation block but not when the ISI was varied within each block, a finding suggesting that stimulus novelty and saliency are the key modulating factors and not neural refractoriness (Wang et al. 2010). In the present study, we used experimental data obtained during the variable condition and we show that some modulation effects can still be detected. In turn, this suggests that even though novelty and saliency are the main modulating factors, there may be a less pronounced effect of neural refractoriness or, most likely, that the variable protocol does not completely reinstate the saliency/novelty of the second stimulus.
To illustrate some of these points further, we calculated the amplitude and latency values of the N2 and P2 peaks for the ERP waveforms used in our first and second testing schemes (see ERPs elicited from successive stimuli with no time overlap and Comparison of ERPs elicited by the second stimulus). The analysis was carried out using ANOVA on the values obtained from each participant's average waveform, given in Tables 1 and 2, respectively. With regards to the first testing scheme (ERP waveforms elicited from the 2 paired stimuli when there was no overlap in time; Table 1), the peak analysis did not identify any differences in the amplitude of the N2 peak (omnibus test P value = 0.227), while it resulted in a marginally significant difference for the P2 peak amplitude (P value = 0.046). However, in the latter case, the corresponding post hoc tests yielded nonsignificant P values. Furthermore, the analysis did not reveal any significant differences for the peak latencies (P values of 0.927 and 0.238 for N2 and P2, respectively). Regarding the peaks of the waveforms used in our second testing scheme (ERPs elicited by the second paired stimulus, Table 2), the peak analysis failed to identify any differences for either the amplitude or latency; the resulting P values were equal to 0.066 and 0.355 (amplitudes) and 0.897 and 0.423 (latencies) for the N2 and P2 peaks, respectively. Therefore, the peak analysis agrees overall with the ANOVA analysis of Fig. 5, top, yielding lower sensitivity compared with the MEM analysis. Importantly, note that given the highly noisy nature of single-trial waveforms it is difficult to carry out a MEM-type analysis on the peak amplitude and latency values, as it is very difficult to obtain reliable values for these quantities from single-trial waveforms.
Table 1.
Summary of the amplitude and latency values for the N2 and P2 peaks of the average ERP waveforms elicited by paired ISIs when there is no overlap in time
| Waveform | N2 Peak | P2 Peak |
|---|---|---|
| Amplitude, μV | ||
| SINGLE | −12.6 ± 2.6 | 9.9 ± 2.1 |
| S1-ISI = 1,000 ms | −12.9 ± 2.7 | 9.5 ± 1.5 |
| S2-ISI = 1,000 ms | −8.9 ± 1.1 | 6.5 ± 1.3 |
| S1-ISI = 2,000 ms | −13.6 ± 2.6 | 9.9 ± 1.4 |
| S2-ISI = 2,000 ms | −13.2 ± 1.9 | 6.3 ± 1.1 |
| Latency, ms | ||
| SINGLE | 213 ± 8.0 | 372 ± 10.4 |
| S1-ISI = 1,000 ms | 205 ± 7.0 | 381 ± 13.8 |
| S2-ISI = 1,000 ms | 220 ± 7.1 | 401 ± 20.4 |
| S1-ISI = 2,000 ms | 210 ± 8.9 | 377 ± 11.7 |
| S2-ISI = 2,000 ms | 207 ± 6.0 | 386 ± 13.9 |
Values are means± SE.
ERP, event-related potentials; ISI, interstimulus interval.
See ERPs elicited from succesive stimuli with no time overlap.
Table 2.
Summary of the amplitude and latency values for the N2 and P2 peaks of the average ERP waveforms elicited by the second paired stimulus
| Waveform | N2 Peak | P2 Peak |
|---|---|---|
| Amplitude, μV | ||
| ISI = 250 ms | −10.8 ± 1.5 | 10.1 ± 1.2 |
| ISI = 500 ms | −9.5 ± 1.1 | 7.0 ± 1.5 |
| ISI = 1,000 ms | −9.8 ± 1.0 | 6.8 ± 0.8 |
| ISI = 2,000 ms | −12.8 ± 2.0 | 7.0 ± 1.2 |
| Latency, ms | ||
| ISI = 250 ms | 220 ± 7.0 | 390 ± 13.6 |
| ISI = 500 ms | 205 ± 6.8 | 401 ± 17.5 |
| ISI = 1,000 ms | 210 ± 7.6 | 435 ± 17.5 |
| ISI = 2,000 ms | 206 ± 8.6 | 375 ± 18.3 |
Values are means± SE. See Comparison of ERPs elicited by the second stimulus.
The proposed methodology is general. As such, it is not limited to the type of data presented here (EEG somatosensory data), but it may be used to examine the presence of nonlinear interactions in any case where impulsive-like stimuli are applied. Therefore, it could be applied to any other sensory (auditory, visual) and/or imaging (functional MRI, magnetoencephalography) modality to verify the validity of time invariance, linearity, and additivity in any given experiment that involves stimulus repetition.
GRANTS
G. D. Iannetti was supported by The Royal Society.
DISCLOSURES
No conflicts of interest, financial or otherwise, are declared by the author(s).
AUTHOR CONTRIBUTIONS
C.L., G.D.I., and G.D.M. conception and design of research; G.D.I. performed experiments; C.L., A.A., and G.D.M. analyzed data; C.L., G.D.I., and G.D.M. interpreted results of experiments; C.L. prepared figures; C.L. and G.D.M. drafted manuscript; C.L., A.A., G.D.I., and G.D.M. edited and revised manuscript; C.L., G.D.I., and G.D.M. approved final version of manuscript.
REFERENCES
- Hu L, Mouraux A, Hu Y, Iannetti GD. A novel approach for enhancing the signal-to-noise ratio and detecting automatically event-related potentials (ERPs) in single trials. Neuroimage 50: 99–111, 2010. [DOI] [PubMed] [Google Scholar]
- Iannetti GD, Zambreanu L, Tracey I. Similar nociceptive afferents mediate psychophysical and electrophysiological responses to heat stimulation of glabrous and hairy skin in humans. J Physiol 577: 235–248, 2006. [DOI] [PMC free article] [PubMed] [Google Scholar]
- Iannetti GD, Hughes NP, Lee MC, Mouraux A. Determinants of laser-evoked EEG responses: pain perception or stimulus saliency? J Neurophysiol 100: 815–828, 2008. [DOI] [PMC free article] [PubMed] [Google Scholar]
- Jung TP, Makeig S, Humphries C, Lee TW, Mckeown MJ, Iragui V, Sejnowski TJ. Removing electroencephalographic artifacts by blind source separation. Psychophysiology 37: 163–178, 2000. [PubMed] [Google Scholar]
- Lee MC, Mouraux A, Iannetti GD. Characterizing the cortical activity through which pain emerges from nociception. J Neurosci 29: 7909–7916, 2009. [DOI] [PMC free article] [PubMed] [Google Scholar]
- Luck SJ. An Introduction to the Event-Related Potential Technique. Cambridge, MA: MIT Press, 2005. [Google Scholar]
- Mouraux A, Iannetti GD. Across-trial averaging of event-related EEG responses and beyond. Magn Reson Imaging 26: 1041–1054, 2008. [DOI] [PubMed] [Google Scholar]
- Nunez PL, Srinivasan R. Electric Fields of the Brain: the Neurophysics of EEG. New York: Oxford Univ. Press, 2006. [Google Scholar]
- Oppenheim AV, Willsky AS, Nawab SH. Signals and Systems. Englewood Cliffs, NJ: Prentice-Hall, 1983, vol. 2. [Google Scholar]
- Sarkar SK, Chang CK. The Simes method for multiple hypothesis testing with positively dependent test statistics. J Am Stat Assoc 92: 1601–1608, 1997. [Google Scholar]
- Simes RJ. An improved Bonferroni procedure for multiple tests of significance. Biometrika 73: 751–754, 1986. [Google Scholar]
- Truccolo W, Knuth KH, Shah A, Bressler SL, Schroeder CE, Ding M. Estimation of single-trial multicomponent ERPs: differentially variable component analysis (dVCA). Biol Cybern 89: 426–438, 2003. [DOI] [PubMed] [Google Scholar]
- Wang AL, Mouraux A, Liang M, Iannetti GD. The enhancement of the N1 wave elicited by sensory stimuli presented at very short inter-stimulus intervals is a general feature across sensory systems. PLoS One 3: e3929, 2008. [DOI] [PMC free article] [PubMed] [Google Scholar]
- Wang AL, Mouraux A, Liang M, Iannetti GD. Stimulus novelty, and not neural refractoriness, explains the repetition suppression of laser-evoked potentials. J Neurophysiol 104: 2116–2124, 2010. [DOI] [PubMed] [Google Scholar]
- Woldorff MG. Distortion of ERP averages due to overlap from temporally adjacent ERPs: analysis and correction. Psychophysiology 30: 98–98, 1993. [DOI] [PubMed] [Google Scholar]


