

Abstract
Although fine particulate matter (PM) air pollution <2.5 μm in aerodynamic diameter (PM2.5) is a leading cause of global morbidity and mortality, the potential health effects of coarse PM (2.5–10 μm in aerodynamic diameter; PM10–2.5) remain less clearly understood. We aimed to elucidate the components within coarse PM most likely responsible for mediating these hemodynamic alterations. Thirty-two healthy adults (25.9 ± 6.6 years) were exposed to concentrated ambient coarse PM (CAP) (76.2 ± 51.5 μg/m3) and filtered air (FA) for 2 h in a rural location in a randomized double-blind crossover study. The particle constituents (24 individual elements, organic and elemental carbon) were analyzed from filter samples and associated with the blood pressure (BP) and heart rate (HR) changes occurring throughout CAP and FA exposures in mixed model analyses. Total coarse PM mass along with most of the measured elements were positively associated with similar degrees of elevations in both systolic BP and HR. Conversely, total PM mass was unrelated, whereas only two elements (Cu and Mo) were positively associated with and Zn was inversely related to diastolic BP changes during exposures. Inhalation of coarse PM from a rural location rapidly elevates systolic BP and HR in a concentration-responsive manner, whereas the particulate composition does not appear to be an important determinant of these responses. Conversely, exposure to certain PM elements may be necessary to trigger a concomitant increase in diastolic BP. These findings suggest that particulate mass may be an adequate metric of exposure to predict some, but not all, hemodynamic alterations induced by coarse PM mass.
Keywords: air pollution, hypertension, blood pressure, heart rate, hemodynamics
Introduction
Fine particulate matter (PM) air pollution <2.5 μm in aerodynamic diameter (PM2.5) is a leading cause of global morbidity and mortality, commonly via the instigation of cardiovascular (CV) events.1 However, the potential health effects of coarse PM (2.5–10 μm in aerodynamic diameter; PM10–2.5) remain less clearly understood.2–6 Supporting the plausibility that this larger PM size fraction might also be capable of prompting acute CV events, we recently demonstrated that exposure to coarse concentrated ambient particles (CAP) triggers rapid alterations in systemic hemodynamics.7 Both systolic (mean difference = 0.32 mm Hg; 95% confidence interval (CI): 0.05, 0.58; P = 0.021) and diastolic (0.27 mm Hg; 95% CI: 0.003, 0.53; P = 0.05) blood pressure (BP) levels linearly increased per 10 min of exposure during the inhalation of coarse CAP when compared with changes during filtered air (FA) exposure in a randomized double-blind crossover study. Heart rate (HR) was also on average higher (4.1 (95% CI, 3.06, 5.12) beats/min, P < 0.0001) during coarse CAP inhalation. Interestingly, these CV responses were very similar to those previously observed during fine PM exposure.8
Coarse PM differs from fine PM in several important characteristics including its composition and sources. PM10–2.5 itself is a spatially heterogeneous mixture commonly generated from mechanical activities (e.g., crushing, grinding, and resuspension of ground materials). Its sources depend heavily on the local environment; however, agriculture, roadway dust, and construction activities are common for rural settings such as in our recent study.7 Its major constituents (metals, crustal material such as silicon, calcium, and bio-aerosols) also differ according to nearby activities and landscape features.2 Although National Ambient Air Quality Standards (NAAQS) exist for PM10 and PM2.5, few studies have evaluated the health effects of coarse PM and/or the particulate components responsible. As such, there is no NAAQS specific to the coarse PM size fraction (http://www.epa.gov/air/criteria.html). To optimally protect the public health and to help formulate the most informed regulations for the future, it is important to elucidate the coarse PM constituents (and potential sources) most strongly linked with adverse health effects. In this context, we aimed to provide detailed characteristics of the coarse PM exposures in our recent study and to explore the constituents most likely responsible for eliciting the observed adverse hemodynamic responses.
Materials and Methods
This current study represents an exploratory, yet prespecified, analysis of our recently completed exposure protocol.7 The main study was approved by the Institutional Review Board of the University of Michigan and all subjects signed an informed consent document during a screening visit. Inclusion criteria included non-smoking adults living in non-smoking households (self-reported) who were from 18 to 50 years of age without any established CV disease or traditional CV risk factors. To be enrolled, subjects were required to have screening BPs <140/90 mm Hg and fasting glucose levels <126 mg/dl. Subjects were excluded if they were taking medications (e.g., statins and anti-hypertensives) or over-the-counter pills (e.g., anti-oxidants and fish oil) that might alter study outcomes. Eligible subjects entered into a randomized double-blind crossover study (May 2011 to June 2012) comparing the effects of 2-h-long exposures to coarse CAP vs FA. Subjects came to the research facility on each day having fasted for >8 h with exposures occurring from 10:00 am to 12:00 pm. There was on average a 1–3-week washout period between randomized exposures. Full details of the protocol are described elsewhere.7
Cardiovascular Outcomes
Following a 10-min rest period after entering the exposure chamber, left upper arm BP and HR were measured every 10 min (n = 11 repeats per subject per exposure) with the appropriate-sized cuff whereas the arm rested supported at mid-sternal level during exposures using a Spacelabs ambulatory 90207 monitor (http://www.spacelabshealthcare.com/en/).
Exposure Facility and Air Pollution Measurements
The location for coarse PM exposures was Dexter, Michigan, as it is primarily influenced by rural sources (http://www.epa.gov/castnet/javaweb/site_pages/ANA115.html). This site is >10 km from freeways and >60 km west of the Detroit metropolitan area. The ultimate goal is to compare any CV outcome changes in this rural-setting study with those from an urban-setting study, and the results from the on-going urban study will be published later.
Coarse CAP was generated by a two-stage virtual impactor system,9,10 which concentrates ambient coarse PM (predominantly from 2.5 μm to 10 μm) without substantively altering the composition. The size cutoff is not perfect at 2.5 μm as some fine PM (typically from 1.5 μm to 2.5 μm) is concentrated; however, the enrichment above ambient levels of these particles is much less than that for the coarse size range.10 The AIRCARE mobile air research laboratory has been described elsewhere.11 Randomized, double-blind exposures were delivered to subjects resting seated within an air-tight chamber via a facemask with an air flow rate of 25–28 l/min. Gaseous pollutants (e.g., ozone and NOx) remained at or below ambient levels for both exposures, whereas CO2 was controlled by a regenerating scrubber. To generate FA a high efficiency PM filter was inserted at the inlet of the concentrator. Coarse CAP mass levels were monitored during exposures downstream of the concentrator with a DataRAM monitor (Thermo Scientific, Waltham, MA, USA). Filter samples were collected immediately upstream of the exposure chamber on 47-mm Teflon filters (Pall, Ann Arbor, MI, USA) at a flow rate of 6 l/min. In-chamber temperatures (maintained at ∼ 24°C) were monitored and did not differ between exposures. In addition, a dichotomous sequential air sampler (Rupprecht & Patashnick Model 2025) was deployed from June to August 2013 (when no exposure studies were taking place) to collect three ambient coarse PM samples (every 8 h) per day.
Physicochemical Characterization of PM
The samples were analyzed gravimetrically for particle mass using a microbalance (MT-5 Mettler Toledo, Columbus, OH, USA) in a temperature/humidity-controlled clean laboratory as described in the Federal Reference Method (USEPA, 1997. EPA 40 CFR Pat 50. Washington DC, USA). PM samples collected on quartz filters were maintained at 40 °C after sampling and were analyzed for carbonaceous aerosols by a thermal–optical analyzer using the NIOSH method (Sunset Labs, Forest Grove, OR, USA). PM samples collected on Teflon filters were wetted with ethanol and extracted in 1% nitric acid solution. The extraction solution was sonicated for 48 h in an ultrasonic bath, and then allowed to passively acid-digest for a two-week duration. Sample extracts were then analyzed for a suite of trace elements using inductively coupled plasma mass spectrometry (ELEMENT2, Thermo Finnigan, San Jose, CA, USA).
Statistical Methods
Summary statistics were computed for continuous measures as mean ± SD, as well as median (interquartile range), and for categorical variables as frequency and proportion (%). All outcomes were evaluated for normality of distribution using the Shapiro–Wilk normality test. The longitudinal health outcomes (BP and HR) measured repetitively during exposures (n = 11 times per exposure per subject) were modeled in mixed-effects models to evaluate their associations throughout the exposure periods (both CAP and FA exposures combined) with the concentrations of each of the measured particle components. Random effects, specifically random intercepts, were included to account for within-subject correlations. The Bayesian information criterion was used to check the correlation structure we chose. The health effect sizes were analyzed and presented as a function of a standardized change in each PM component concentration in order to foster relevant comparisons (per SD change in elements, organic carbon (OC), elemental carbon (EC), and total coarse PM mass). Its regression coefficient shows the marginal effect on the mean outcome with one unit increase of the corresponding PM component. Fixed effects in the final model for each PM component also included time to control for the time effect. All analyses were performed using the statistical software package R (version 2.14.1).
In this work, principal component analysis (PCA) was utilized to reduce the dimensionality of the data set and to identify major source factors that contributed to ambient coarse PM in the rural air shed. PCA is a special case of factor analysis that transforms the original set of intercorrelated variables into a smaller number of independent variables that are linear combinations of those original variables. PCA was applied independently to two particle composition data sets. One data set was comprised of 29 coarse CAP samples (2 of the 31 samples unanalyzed owing to pump failure) that were collected during the 2-h exposure periods. The other data set was comprised of 87 ambient coarse PM samples that were collected outside the exposure periods during the summer of 2013 (June–August). The first data set provided an exploratory analysis as the sample size (n = 29) did not meet the general rule regarding minimum sample size. There are numerous research findings on minimal sample sizes, but one of the smallest reported sample sizes that yielded a clear recognizable factor pattern was 50 samples.12 Others have reported that the samples-to-variables ratio needs to be no lower than five.13 As n = 29 does not meet any of these suggested requirements, the secondary PCA analysis was performed on ambient coarse PM samples (n = 87) to obtain a more robust solution for assessing the contributions of source factors.
We explored the sources of coarse PM as secondary analyses to evaluate and describe the characteristics of the pollution sources only; however, we did not link source factors with health outcomes. This was not felt to be statistically valid given the limitations of sample size for source apportionment during the controlled exposure portion of this study. As such, we only evaluated the effect of each individual specific element upon health outcomes to provide the most direct evaluation of the coarse PM component-to-health responses.
Finally, in order to evaluate the relative contributions of natural sources and anthropogenic sources of coarse PM, crustal enrichment factors (EFs) were calculated for each element observed in ambient coarse PM samples:
where aluminum (Al) is a reference element for crustal material. Information on the elemental composition of the earth's crust was obtained from a reference material in geochemistry.14
Results
Associations between Coarse CAP Mass/Components and CV Outcomes
Subjects (n = 32) completing the study were healthy (Table 1). Coarse PM mass concentrations were significantly higher during coarse CAP exposures than FA exposures (Table 2). The concentrations of the 24 measured elements, OC and EC on the filters during both exposures are displayed in Table 3. A correlation matrix of these chemical compositions is provided in Supplementary Table 1. The concentrations were highly variable; however, despite some overlap they were always on average higher during CAP compared with FA exposures. Some of the components, including 79% of EC concentrations were below the detection limit, which was consistent with our expectation for the characteristics of coarse PM. In this context, the results regarding EC are less reliable than those related to the other measured elements. As such, the associations related to EC—in particular, the reduction in HR (Figure 1)—should be interpreted with caution.
Table 1.
Subject characteristics (n = 32; 16 female subjects).
| Variable | Mean | SD | Minimum | Maximum |
|---|---|---|---|---|
| Age (years) | 25.9 | 6.6 | 18.0 | 46.0 |
| Weight (kg) | 78.4 | 16.3 | 55.9 | 111.4 |
| Height (m) | 1.7 | 0.1 | 1.6 | 2.0 |
| BMI (kg/m2) | 26.3 | 5.7 | 18.3 | 43.5 |
| Fasting glucose (mg/dl)a | 86.9 | 6.9 | 70.0 | 103.0 |
| Total cholesterol (mg/dl) | 163.9 | 31.4 | 104.0 | 244.0 |
| HDL-C (mg/dl) | 55.4 | 15.9 | 25.0 | 91.0 |
| LDL-C (mg/dl) | 88.8 | 26.1 | 49.0 | 135.0 |
| Triglycerides (mg/dl) | 106.0 | 80.9 | 40.0 | 401.0 |
Abbreviations: BMI, body mass index; HDL-C, high-density lipoprotein cholesterol; LDL-C, low-density lipoprotein cholesterol.
Missing one subject's data point.
Table 2.
Coarse CAP concentrations during exposures (n = 32).
| Exposure | Mean | SD | Minimum | Maximum |
|---|---|---|---|---|
| FA | 10.1 | 7.1 | 2.6 | 27.4 |
| Coarse CAP | 76.2a | 51.5 | 10.3 | 246.5 |
Abbreviations: CAP, concentrated ambient particle; FA, filtered air. CAP concentrations are in μg/m3 and determined by Teflon filter-based gravimetric mass measurements for the 2-h period of exposures. Mass levels below the detection limit (6.8 μg/m3) were recorded at this value for analyses (n = 15, FA exposures only).
P-values <0.01 for differences of mean or median levels between exposure types.
Table 3.
Elemental concentrations during exposures.
| CAP exposures | FA exposures | ||||||||||||
|---|---|---|---|---|---|---|---|---|---|---|---|---|---|
|
|
|
|
|||||||||||
| Components | n | Miss | Median | IQR | Minimum | Maximum | n | Miss | Median | IQR | Minimum | Maximum | |
| Rb85 | ng/m3 | 29 | 2 | 1.39 | 0.94 | 0.46 | 4.62 | 31 | 0 | 0.41 | 0.23 | 0.19 | 1.07 |
| Sr88 | ng/m3 | 29 | 2 | 15.40 | 6.27 | 2.25 | 56.21 | 31 | 0 | 3.37 | 1.73 | 1.59 | 13.02 |
| Mo95 | ng/m3 | 29 | 2 | 1.18 | 1.08 | 0.42 | 6.90 | 31 | 0 | 0.51 | 0.47 | 0.23 | 6.25 |
| Cd111 | ng/m3 | 29 | 2 | 2.32 | 1.55 | 0.41 | 7.23 | 31 | 0 | 2.01 | 3.00 | 0.19 | 7.25 |
| Sb123 | ng/m3 | 29 | 2 | 2.74 | 2.05 | 0.33 | 7.90 | 31 | 0 | 0.42 | 0.31 | 0.16 | 2.94 |
| Ba137 | ng/m3 | 29 | 2 | 43.74 | 18.09 | 1.30 | 99.85 | 31 | 0 | 2.69 | 3.73 | −1.59 | 33.62 |
| La139 | ng/m3 | 29 | 2 | 0.83 | 0.79 | 0.08 | 3.75 | 31 | 0 | 0.11 | 0.11 | 0.01 | 0.64 |
| Nd146 | ng/m3 | 29 | 2 | 0.53 | 0.48 | 0.07 | 2.53 | 31 | 0 | 0.07 | 0.06 | 0.01 | 0.31 |
| Pb208 | ng/m3 | 29 | 2 | 20.62 | 15.88 | 5.84 | 49.94 | 31 | 0 | 10.78 | 23.56 | 0.19 | 61.74 |
| Na23 | ng/m3 | 29 | 2 | 1195 | 780 | 715 | 6285 | 31 | 0 | 678 | 240 | 572 | 1407 |
| Mg24 | ng/m3 | 29 | 2 | 740 | 500 | 127 | 2241 | 31 | 0 | 141 | 89.1 | 61.3 | 587 |
| Al27 | ng/m3 | 29 | 2 | 654 | 402 | 153 | 2652 | 31 | 0 | 181 | 149 | 74.5 | 596 |
| P31 | ng/m3 | 29 | 2 | 294 | 124 | 145 | 626 | 31 | 0 | 173 | 58.0 | 116 | 307 |
| S32 | ng/m3 | 29 | 2 | 1137 | 1368 | 68.54 | 4594 | 31 | 0 | 161 | 99.0 | 3.40 | 1041 |
| Ca44 | ng/m3 | 29 | 2 | 4100 | 2707 | 984 | 8730 | 31 | 0 | 2607 | 1218 | 828 | 4958 |
| Ti47 | ng/m3 | 29 | 2 | 20.05 | 17.26 | 1.91 | 63.25 | 31 | 0 | 2.27 | 2.60 | −0.01 | 13.51 |
| V51 | ng/m3 | 29 | 2 | 2.17 | 2.01 | 0.35 | 7.50 | 31 | 0 | 0.43 | 0.26 | 0.23 | 1.29 |
| Mn55 | ng/m3 | 29 | 2 | 36.6 | 26.6 | 3.98 | 127 | 31 | 0 | 4.54 | 3.94 | 1.06 | 24.23 |
| Fe57 | ng/m3 | 29 | 2 | 963 | 556 | 124 | 3007 | 31 | 0 | 163 | 101 | 65.1 | 613 |
| Cu63 | ng/m3 | 29 | 2 | 34.2 | 33.9 | 5.88 | 111 | 31 | 0 | 19.0 | 27.7 | 3.10 | 90.4 |
| Zn66 | ng/m3 | 29 | 2 | 326 | 143 | 141 | 1052 | 31 | 0 | 314 | 166 | 158 | 987 |
| K39 | ng/m3 | 29 | 2 | 893 | 343 | 416 | 1700 | 31 | 0 | 565 | 130 | 402 | 1400 |
| As75 | ng/m3 | 29 | 2 | 1.44 | 1.53 | 0.21 | 14.98 | 31 | 0 | 0.31 | 0.21 | 0.16 | 1.81 |
| Se77 | ng/m3 | 29 | 2 | 1.59 | 2.36 | 0.05 | 8.67 | 31 | 0 | 0.11 | 0.27 | −0.12 | 2.84 |
| OC | μg/m3 | 26 | 3 | 8.43 | 8.35 | 2.06 | 29.36 | 31 | 0 | 3.08 | 2.76 | 0.38 | 16.68 |
| EC | μg/m3 | 26 | 3 | 1.45 | 0.59 | 1.03 | 2.99 | 31 | 0 | 1.27 | 0.25 | 1.19 | 1.68 |
Abbreviations: CAP, concentrated ambient particles; FA, filtered air; IQR, interquartile range; miss, number of missing samples; n, number of subjects.
Figure 1.
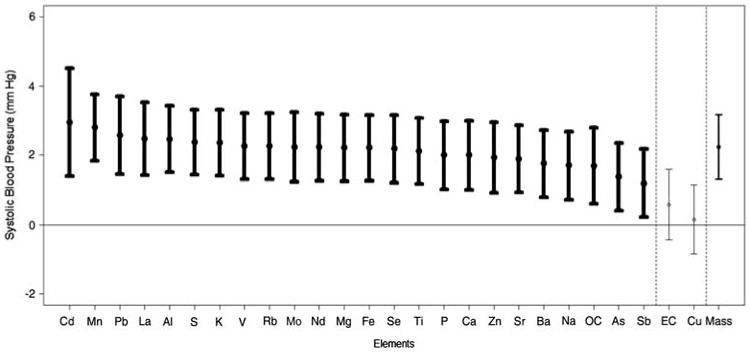
Change in systolic blood pressure in relation to the levels of each PM component. Results are provided as the association of the systolic BP levels (mean ± 95% confidence interval) throughout the exposures (CAP and FA exposures combined) with the change in each PM component (per standard deviation concentration elevation). Results in bold are statistically significant. The component ordering begins with the strongest positive association. The association with total coarse CAP mass is provided last.
There were significant concentration–response associations between the degree of exposure to total coarse PM mass with the changes in systolic (but not diastolic) BP and HR (Figures 1–3). Each SD increase in most of the measured elements (except Cu) was significantly associated with a nearly identical degree of systolic BP elevation, which closely paralleled the size of the concentration–response association observed with total coarse PM mass (Figure 2). The overall associations of the components with HR changes during exposures followed a very similar pattern to systolic BP. Albeit, the specific ordering of the elements in regards to their comparative effect sizes slightly differed and some of the associations trended positive by a similar degree but did not quite reach statistical significance. Conversely, only three elements (Mo, Cu, and Zn) were significantly associated with diastolic BP changes, with Cd and Pb showing positive but nonsignificant associations. All other elements (included total coarse PM mass) showed virtually no relationship with diastolic BP changes. Of note, Cu (higher diastolic BP but not systolic BP) and Zn (higher systolic and lower diastolic BP) were the only specific elements that had clear evidence for eliciting differential CV responses.
Figure 3.
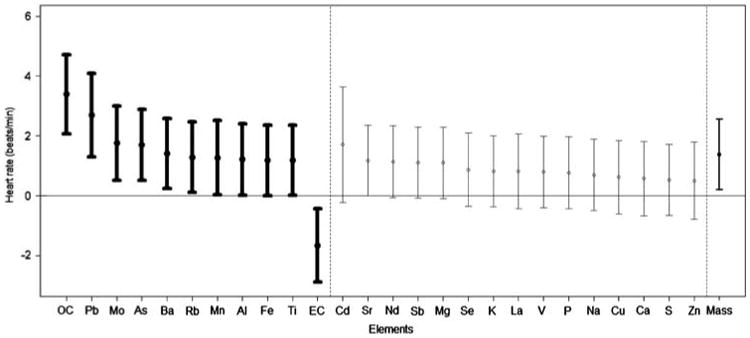
Change in heart rate in relation to the levels of each PM component. Results are provided as the association of the heart rate levels (mean ± 95% confidence interval) throughout the exposures (CAP and FA exposures combined) with the change in each PM component (per SD concentration elevation). Results in bold are statistically significant. The component ordering begins with the strongest positive association. The association with total coarse CAP mass is provided last.
Figure 2.
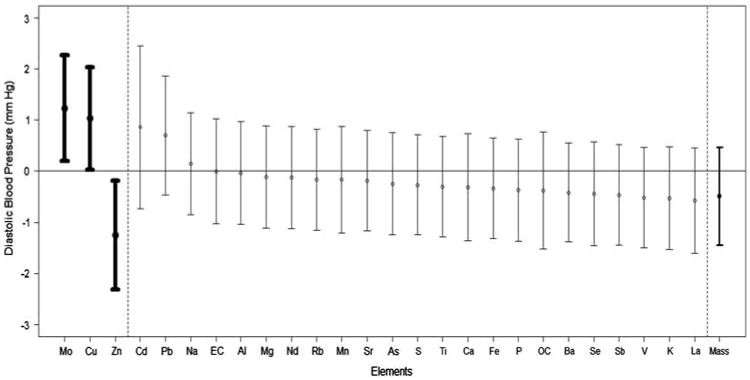
Change in diastolic blood pressure in relation to the levels of each PM component. Results are provided as the association of the diastolic BP levels (mean ± 95% confidence interval) throughout the exposures (CAP and FA exposures combined) with the change in each PM component (per SD concentration elevation). Results in bold are statistically significant. The component ordering begins with the strongest positive association. The association with total coarse CAP mass is provided last.
Sources of Coarse PM at the Rural Site
Figure 4 displays crustal EFs that were calculated for each element observed in the ambient coarse PM samples. Normally, EFs larger than 10 are indicative of anthropogenic sources.15 As shown, Na, P, Cu, Pb, As, Mo, Zn, S, Sb, Cd, and Se had EFs larger than 10.
Figure 4.

Crustal enrichment factors of elements in ambient coarse PM at Dexter, Michigan (the reference element is Al).
For identifying major source factors contributing to coarse PM, PCA was first applied to CAP samples. The results of Varimax-rotated factor analysis are presented in Table 4. The first factor was loaded with S, V, Fe, Mn, Se, Ba, and Mo. On the basis of the EF analysis, Fe, V, Mn, and Ba are likely to be derived from crustal/soil components, whereas S, Se, and Mo are likely to have originated from anthropogenic sources. High loadings of S and Se are indicative of fossil fuel combustion,16 and so this factor also includes a secondary sulfate contribution. Thus, this first factor was identified as a mixture of secondary sulfate and crustal/soil factor. The second factor has high loadings of OC, Ca, Mn, and Fe. As all of the elements except OC were likely to be associated with natural (crustal) sources based on the EF analysis described above, this factor is identified as crustal. The third factor is characterized by Cd and Pb, which is likely be associated with industrial or incinerator sources. The fourth factor has high loadings of Cu and As as well as a moderate loading of P. As copper arsenate is widely used in agriculture (e.g., insecticide),17 and the study site is surrounded by multiple agricultural operations, this factor is likely associated with agricultural activities. These four factors accounted for 81% of the total variance, with the first factor explaining over 44% of the variance.
Table 4.
Elemental factor loadings from rotated principal component analysis of coarse CAPs (n = 29).
| Element | Factor 1 Mixture secondary-crustal | Factor 2 Crustal | Factor 3 Cd/Pb | Factor 4 Agriculture |
|---|---|---|---|---|
| OC | 0.12 | 0.84 | −0.02 | 0.26 |
| P | 0.31 | 0.52 | 0.27 | 0.65 |
| S | 0.85 | 0.11 | 0.21 | 0.05 |
| Ca | 0.34 | 0.69 | −0.49 | −0.10 |
| V | 0.83 | 0.25 | 0.04 | −0.08 |
| Mn | 0.63 | 0.72 | −0.06 | −0.14 |
| Fe | 0.76 | 0.61 | 0.03 | 0.03 |
| Cu | 0.02 | 0.15 | −0.32 | 0.68 |
| As | 0.12 | −0.08 | −0.03 | 0.84 |
| Se | 0.88 | 0.14 | −0.02 | 0.18 |
| Mo | 0.79 | 0.07 | −0.14 | 0.22 |
| Cd | −0.15 | −0.03 | 0.95 | −0.13 |
| Ba | 0.82 | 0.25 | −0.19 | 0.17 |
| Pb | 0.16 | −0.06 | 0.95 | −0.08 |
| Variance % | 44 | 18 | 11 | 9 |
Loadings >0.6 are in bold.
As described in the Methods section, PCA was also applied to ambient coarse PM samples (n = 87) to obtain more robust solutions that may able to support the findings of the CAP data set analysis. The results of Varimax-rotated factor analysis are presented in Table 5. Five factors were extracted and accounted for 70% of the total variance, with the first factor explaining over 23% of the variance. The five factors included four that were similar to those identified by the CAP data set analysis—crustal (Ca, Rb, and Na), secondary (S, Mn, and Se), Cd/Pb, Fe/Mo, and agriculture activities (Cu and As).
Table 5.
Elemental factor loadings from rotated principal component analysis of ambient coarse PM (n =87).
| Element | Factor 1 Crustal | Factor 2 Secondary | Factor 3 Cd/Pb | Factor 4 Fe/Mo | Factor 5 Agriculture |
|---|---|---|---|---|---|
| Na | 0.87 | −0.07 | 0.14 | 0.33 | 0.14 |
| P | −0.10 | −0.20 | −0.58 | −0.16 | 0.09 |
| S | −0.05 | 0.87 | −0.10 | −0.03 | 0.15 |
| Ca | 0.89 | 0.24 | 0.11 | −0.09 | −0.04 |
| V | 0.16 | 0.51 | 0.16 | 0.37 | 0.09 |
| Mn | 0.14 | 0.65 | 0.19 | 0.10 | 0.10 |
| Fe | 0.31 | 0.10 | −0.02 | 0.80 | 0.13 |
| Cu | 0.09 | 0.05 | 0.01 | 0.06 | 0.85 |
| As | −0.03 | 0.32 | 0.05 | −0.14 | 0.71 |
| Se | 0.06 | 0.86 | −0.10 | −0.13 | 0.06 |
| Rb | 0.86 | −0.02 | 0.09 | 0.29 | 0.10 |
| Mo | 0.01 | −0.01 | −0.15 | 0.75 | −0.27 |
| Cd | −0.01 | −0.17 | 0.90 | −0.12 | −0.01 |
| Ba | 0.49 | 0.22 | −0.06 | −0.40 | −0.16 |
| Pb | 0.15 | 0.04 | 0.86 | −0.17 | 0.24 |
| Variance % | 23 | 16 | 14 | 9 | 8 |
Loadings >0.6 are in bold.
Discussion
Brief exposure to coarse CAP from a rural location promotes a rapid elevation in systolic and diastolic BP as well as HR. The current study provides several novel insights into the characteristics of the particle exposures responsible. First, total coarse PM mass predicted the degree of systolic BP and HR increase. This supports that there is a mass concentration– (i.e., dose–) response relationship for these two outcomes. Second, most of the individual 24 elements were associated with similar dose– response changes for systolic BP and HR. As the degree of changes per SD change of exposures of each element were highly similar and overlapped (or paralleled) that of total mass, we interpret this to mean that the specific characteristics of the particles (e.g., chemical components) are not likely relevant determinants of the capacity for coarse PM to be capable of inducing elevations in either systolic BP or HR. Inhalation of almost any element and/or coarse particles per se (regardless of their composition) appears capable of mediating these responses. Third, the changes in diastolic BP were not related to total mass and were only associated with two specific elements (Mo and Cu). Despite the fact that coarse CAP exposure was linked to elevations in diastolic BP in our main study,7 Zn levels were associated with a reduction in diastolic BP. This supports the contention that (unlike systolic BP and HR) exposures to only these few specific PM constituents are capable of eliciting alterations in diastolic BP. Fourth, the simple metric of total coarse PM mass was a valid predictor of the expected degree of some (systolic BP and HR) but not of other (diastolic BP) CV changes. This supports the broad conclusion that it is indeed important to provide detailed characterizations of PM exposures (beyond total mass) to fully understand the nature of health effects elicited by coarse PM, as some responses vary in relation to its underlying composition and/or sources.
Implications of the Exposure Characteristics
Our findings support that the specific coarse PM composition is not a vital determinant of its capacity to induce elevations in systolic BP and HR. Conversely, Cu was one of only two elements predicting a diastolic BP elevation, whereas it was the sole component not associated with a rise in systolic BP. Zn exposure was related to elevations in systolic, but contrarily a reduction in diastolic BP. This suggests that exposures to Cu and Zn might induce differential hemodynamic responses. However, despite the use of HEPA filtration and a purging period for FA exposures, it appears from the data that a trace level of coarse PM containing Zn was present during the FA exposure periods. The specific reason why Zn was associated with a reduction in diastolic BP is not entirely clear. However, we believe it is possible that any association between Zn and health outcomes may be spurious in light of the contamination of Zn-containing coarse PM during FA exposures. Regardless, our findings in this regard should be considered hypothesis generating for future studies.
Although this study was an exploratory analysis and therefore can by definition only provide hypothesis-generating information, we can speculate about the potential meaning of these findings. As expected, the PCA results from the CAP samples (n = 29) did not produce robust results as the first factor was mixtures of two sources. However, the more robust PCA results from the ambient coarse PM samples suggest that the first factor is likely to have a higher fraction of crustal/soil rather than secondary sulfate. Although coarse PM appears to be dominated by crustal/soil source factor as expected, elements that showed significant and/or positive association with diastolic BP changes (Mo, Cu, Zn, Cd, and Pb) all had anthropogenic origins based on EF analysis. PCA analysis further confirmed that these elements were associated with non-crustal (i.e., anthropogenic) sources. Although identifying the source-to-health outcome associations is beyond the scope of this study due to the small number of CAP samples, these findings illustrate the potential for differential effects of natural (i.e., crustal) vs anthropogenic elements on CV health outcomes.
Biological Mechanisms
The mechanistic pathways responsible for causing the elevations in BP and HR following coarse CAP exposures remain incompletely described. However, in our main study report we demonstrated that several metrics of heart rate variability changed in a manner supporting that PM-induced autonomic imbalance is a plausible and likely mechanism. We also did not find evidence to support other pathways such as endothelial dysfunction or impaired arterial compliance.7 Indeed, numerous reports have shown that fine PM is capable of rapidly changing HRV consistent with a reduction in parasympathetic tone and/or a favoring of sympathetic activity.
A wide array of lung nerve receptors are linked via parasympathetic afferents to coordinating centers of autonomic outflow in the central nervous system.18 We therefore posit that the deposition of coarse PM, regardless of the chemical nature, can be sensed by a subset (or many) of these receptors. For example, transient receptor potential channels can be activated by noxious stimuli by a variety of molecular mechanisms.19 This could thereafter trigger autonomic reflexes prompting an acute increase in systolic BP and HR.18 Basic science and recent animal air pollution exposure studies support this possibility.20,21 On the other hand, why only certain specific elements were capable of eliciting an increase in diastolic BP remains a mystery. We can only speculate at this point that perhaps either differing receptor subtypes are required that only a few chemicals can activate (e.g., Cu) or entirely different and ill-described pathways are involved. Follow-up experiments are required to help elucidate this issue and the underlying integrated mechanisms involved.
Strengths and Limitations
This is the first study to evaluate the effects of coarse PM on systemic hemodynamics as well as the first attempt to explore the responsible components involved by performing an extensive exposure characterization. This study represents a prespecified secondary exploratory analysis that nonetheless can only be considered hypothesis generating. We acknowledge that numerous statistical associations were evaluated without correction for multiple comparisons potentially producing some spurious significant results in regards to specific individual associations. However, no prior study of this nature has even been completed and thus we could not formulate a priori sample size calculations. In this context, we believe providing the unadjusted results and associations in an unbiased manner were appropriate. The consistency of findings, most specifically in regards to systolic BP and HR, also supports the veracity of the numerous positive associations. Future studies are warranted to corroborate and better understand the implications of our findings.
Conclusions
We have shown for the first time that there is a significant dose–response association between coarse CAP mass exposure and the magnitude of elevation in systolic BP and HR. We did not find evidence to support that the particulate composition was an important determinant of these responses. Conversely, exposure to only a few specific elements can elicit alterations in diastolic BP. Therefore, detailed characterizations of particle components can indeed provide a broader understanding of the potential varying resultant health effects induced by coarse PM exposure.
Supplementary Material
Acknowledgments
This study was funded by grants from the NIH CTSA (UL1RR024986) and from the United States Environmental Protection Agency RD83479701 and R833740. We thank James Barres, Sue Lustig, Mary Lynam, and Matt Salvadori for their field efforts.
Footnotes
Conflict of Interest: The authors declare no conflict of interest.
Supplementary Information accompanies the paper on the Journal of Exposure Science and Environmental Epidemiology website (http://www.nature.com/jes)
References
- 1.Brook RD, Rajagopalan S, Pope CA, III, Brook JR, Bhatnagar A, Diez-Roux A, et al. Particulate matter air pollution and cardiovascular disease. An update to the scientific statement from the American Heart Association. Circulation. 2010;121:2331–2378. doi: 10.1161/CIR.0b013e3181dbece1. [DOI] [PubMed] [Google Scholar]
- 2.Brunekreef B, Forsberg B. Epidemiological evidence on effects of coarse airborne particles on health. Eur Respir J. 2005;26:309–318. doi: 10.1183/09031936.05.00001805. [DOI] [PubMed] [Google Scholar]
- 3.Chang HH, Peng RD, Dominici F. Estimating the acute health effects of coarse particulate matter accounting for exposure measurement error. Biostat. 2011;12:637–652. doi: 10.1093/biostatistics/kxr002. [DOI] [PMC free article] [PubMed] [Google Scholar]
- 4.Peng PD, Chang HH, Bell ML, McDermott A, Zeger SL, Samet JM, et al. Coarse particulate matter air pollution and hospital admissions for cardiovascular and respiratory diseases among Medicare patients. JAMA. 2008;299:2172–2179. doi: 10.1001/jama.299.18.2172. [DOI] [PMC free article] [PubMed] [Google Scholar]
- 5.Puett RC, Hart JE, Yanosky JD, Paciorek C, Schwartz J, Suh H, et al. Chronic fine and coarse particulate exposure, mortality, and coronary heart disease in the Nurses' Health Study. Environ Health Perspect. 2009;117:1697–1701. doi: 10.1289/ehp.0900572. [DOI] [PMC free article] [PubMed] [Google Scholar]
- 6.Zanobetti A, Schwartz J. The effect of fine and coarse particulate matter air pollution on mortality: A national analysis. Environ Health Perspect. 2009;117:898–903. doi: 10.1289/ehp.0800108. [DOI] [PMC free article] [PubMed] [Google Scholar]
- 7.Brook RD, Bard RL, Morishita M, Dvonch JT, Wang L, Yang HY, et al. Hemo-dynamic, autonomic, and vascular effects of exposure to coarse particulate matter air pollution from a rural location. Environ Health Perspect. 2014;122:624–630. doi: 10.1289/ehp.1306595. [DOI] [PMC free article] [PubMed] [Google Scholar]
- 8.Brook RD, Urch B, Dvonch JT, Bard RL, Speck M, Keeler G, et al. Insights into the Mechanisms and Mediators of the Effects of Air Pollution Exposure on Blood Pressure and Vascular Function in Healthy Humans. Hypertension. 2009;54:659–667. doi: 10.1161/HYPERTENSIONAHA.109.130237. [DOI] [PMC free article] [PubMed] [Google Scholar]
- 9.Demokritou P, Gupta T, Ferguson S, Koutrakis P. Development and laboratory characterization of a prototype coarse particle concentrator for inhalation toxicology studies. Aerosol Sci. 2002;33:111–123. [Google Scholar]
- 10.Moffet RC, Shields LG, Berntsen J, Devlin RB, Prather KA. Characterization of an ambient coarse particle concentrator used for human exposure studies: aerosol size distributions, chemical composition, and concentration enrichment. Aerosol Sci Technol. 2004;38:1123–1137. [Google Scholar]
- 11.Harkema JR, Keeler GJ, Wagner JG, Morishita M, Timm E, Hotchkiss J, et al. Health Effects Institute Research Report. Vol. 120. Health Effects Institute: Boston MA; 2004. Effects of inhaled urban air particulates on normal and hypersecretory airways in rats. [PubMed] [Google Scholar]
- 12.Arrindell WA, van der Ende J. An empirical test of the utility of the observations-to-variables ratio in factor and components analysis. Appl Psychol Meas. 1985;9:165–178. [Google Scholar]
- 13.Bryant FB, Yarnold PR. Reading and understanding multivariale statistics. American Psychological Association; Washington, DC: 1995. Principal components analysis and exploratory and confirmatory factor analysis; pp. 99–136. [Google Scholar]
- 14.Mason B, Moore CB. Principles of geochemistry. Wiley; New York: 1982. [Google Scholar]
- 15.Gao Y, Nelsonb ED, Fielda MP, Ding Q, Li H, Sherrella RM, et al. Characterization of atmospheric trace elements on PM2.5 particulate matter over the New York–New Jersey harbor estuary. Atmos Environ. 2002;36:1077–1086. [Google Scholar]
- 16.Edgerton ES, Hartsell BE, Jansen JJ. Mercury speciation in coal-fired power plant plumes observed at three surface sites in the southeastern U.S. Environ Sci Technol. 2006;40:4563–4570. doi: 10.1021/es0515607. [DOI] [PubMed] [Google Scholar]
- 17.The Pesticide Action Network Database. [Accessed 15 February 2014];Copper Arsenate. http://www.pesticideinfo.org/
- 18.Widdiocombe J, Lee LY. Airway reflexes, autonomic function, and cardiovascular responses. Environ Health Perspect. 2001;109:579–584. doi: 10.1289/ehp.01109s4579. [DOI] [PMC free article] [PubMed] [Google Scholar]
- 19.Fariss MW, Gilmour MI, Reilly CA, Liedtke W, Ghio AJ. Emerging mechanistic targets in lung injury induced by combustion-generated particles. Tox Sci. 2013;132:253–267. doi: 10.1093/toxsci/kft001. [DOI] [PMC free article] [PubMed] [Google Scholar]
- 20.Hazari MS, Haykal-Coates N, Winsett DW, Krantz QT, King C, Costa DL, et al. TRPA1 and sympathetic activation contribute to increased risk of triggered cardiac arrhythmias in hypertensive rats exposed to diesel exhaust. Environ Health Perspect. 2011;119:951–957. doi: 10.1289/ehp.1003200. [DOI] [PMC free article] [PubMed] [Google Scholar]
- 21.Simon SA, Liedtke W. How irritating: the role of TRPA1 in sensing cigarette smoke and aerogenic oxidants in the airways. J Clin Invest. 2008;188:2383–2386. doi: 10.1172/JCI36111. [DOI] [PMC free article] [PubMed] [Google Scholar]
Associated Data
This section collects any data citations, data availability statements, or supplementary materials included in this article.