Abstract
Estimation of frequency-dependent ultrasonic attenuation is an important aspect of tissue characterization. Along with other acoustic parameters studied in quantitative ultrasound, the attenuation coefficient can be used to differentiate normal and pathological tissue. The spectral centroid downshift (CDS) method is one the most common frequency-domain approaches applied to this problem. In this study, a statistical analysis of this method’s performance was carried out based on a parametric model of the signal power spectrum in the presence of electronic noise. The parametric model used for the power spectrum of received RF data assumes a Gaussian spectral profile for the transmit pulse, and incorporates effects of attenuation, windowing, and electronic noise. Spectral moments were calculated and used to estimate second-order centroid statistics. A theoretical expression for the variance of a maximum likelihood estimator of attenuation coefficient was derived in terms of the centroid statistics and other model parameters, such as transmit pulse center frequency and bandwidth, RF data window length, SNR, and number of regression points. Theoretically predicted estimation variances were compared with experimentally estimated variances on RF data sets from both computer-simulated and physical tissue-mimicking phantoms. Scan parameter ranges for this study were electronic SNR from 10 to 70 dB, transmit pulse standard deviation from 0.5 to 4.1 MHz, transmit pulse center frequency from 2 to 8 MHz, and data window length from 3 to 17 mm. Acceptable agreement was observed between theoretical predictions and experimentally estimated values with differences smaller than 0.05 dB/cm/MHz across the parameter ranges investigated. This model helps predict the best attenuation estimation variance achievable with the CDS method, in terms of said scan parameters.
I. Introduction
The ultrasonic attenuation coefficient is one of the parameters studied in tissue characterization to learn about the pathological state of tissue [1]–[7]. It has been shown that normal and pathological livers present with different frequency-dependent attenuation profiles [3], [7]–[10]. Attenuation coefficient has been studied as a classifying parameter in myocardial disease [1], [2], [11], carotid artery plaques [4], [5], [12], breast cancers [6], [13], and other tissue types [14]. In addition, accurate estimation and compensation for the attenuation can lead to improved estimation of other acoustic parameters [15]–[19].
Most frequency domain estimation methods can be categorized as either determining the spectral difference or the spectral shift of echo signal from different depths within the attenuating medium [20].
Spectral difference methods, such as the reference phantom method (RPM), measure the decay of each frequency component of echo signal with depth, and provide an estimate of the attenuation coefficient as a function of frequency [21], [22].
Spectral shift methods, such as the centroid downshift method (CDS), measure the apparent shift of the spectrum toward lower frequencies. This downshift is due to the fact that high-frequency components of the signal experience higher attenuation than low-frequency components. These methods usually assume a linear frequency dependence for the attenuation and measure the slope of downshift with depth to estimate the attenuation coefficient [23]–[25]. Autoregressive modeling of the echo signal spectrum has also been studied as a computationally efficient way of determining the centroid [26], [27].
Several known advantages and disadvantages to using each category of attenuation estimation methods in a clinical setting exist. For example, the CDS method is susceptible to diffraction effects due to beam focusing [24]. As a result, the CDS method underestimates attenuation coefficients in the prefocal region and overestimates them in the postfocal region of the imaging plane. Spectral difference methods, such as the RPM, compensate for diffraction and other system-related effects through normalization of the sample power spectrum by a reference power spectrum acquired using the same system settings. However, spectral difference methods, such as RPM, experience estimation biases in nonuniform media with abrupt backscatter coefficient boundaries, whereas spectral shift methods, such as CDS, are not affected by backscatter level changes, as long as the frequency dependence of the backscatter does not change drastically throughout the sample. As a result, there is interest in using and improving both categories of methods [28], based on the clinical application. Our laboratory has previously proposed a frequency-domain method, namely the hybrid method [29], to improve upon the CDS method by incorporating a normalization step to reduce system-dependent effects. Labyed and Bigelow provided a comparison of the different attenuation estimation methods in [30]. Kim and Varghese presented a diffraction compensation technique in [31] that can be used with spectral shift methods. This technique makes use of a well-characterized reference phantom with known attenuation to measure the biases introduced to centroid estimates and compensate for them while analyzing the sample data. It is also possible to extend the usable parameter estimation region with the CDS method by using multiple foci while imaging the medium.
In this paper, we present a theoretical framework that can help predict the accuracy and precision with the CDS method, using different ultrasonic settings, in terms of various system parameters such as transmit pulse center frequency and bandwidth, time-gating window size and type, electronic signal to noise ratio (SNR), and number of centroids used in the region of interest (RO I) to determine the attenuation coefficient. The results are compared with measurements performed on simulated and physical tissue- mimicking (TM) phantoms with uniform attenuation and backscatter coefficients. Finally, an attenuation SNR measure has been studied as a way to determine the optimal parameter values to use for attenuation estimation.
II. Materials and Methods
In this section we present a spectral model of the RF signal and derive spectral moments and their variance from it. Using these variance terms, we derive the estimation variance of the centroid and translate it into the estimation variance of the attenuation coefficient.
A. Parametric Model of the Power Spectrum of the RF Signal
The power spectrum of backscattered RF signals from depth z, received at the ultrasound transducer, can be modeled to incorporate the effects of frequency-dependent attenuation, sampling, windowing, and additive electronic noise, as presented in (1). The noise process is assumed to be zero-mean and white with power density of
| (1) |
where represents the power spectrum of the received signal, and St(f) denotes the spectrum of the transmit pulse. BSC(f, z) is the spectral profile for the random scatterers in the medium. α(f, z) is the cumulative attenuation at frequency f and depth z. Ts is the sampling interval, and Bnoise,w is the equivalent noise bandwidth of the selected window function, which has a value of 1 for the rectangular window and greater than 1 for other window functions. The asterisk represents convolution with Sw(f), the power spectral characteristic of the window function, given by
| (2) |
where W(f) is the discrete-time Fourier transform (DTFT) of the window function. In this parametric model, we assume a Gaussian spectral shape for the transmit pulse that is centered on frequency ft with peak value of S0, and linear frequency dependence for attenuation with slope β. A rectangular window function is selected for initial analysis. The results can be generalized for other window types by modifying the equivalent noise bandwidth. Given these assumptions, the received power spectrum can be written as
| (3) |
The exponential terms can be rearranged as follows:
| (4) |
The DTFT of the rectangular window of length M and its spectral characteristic [32, ch. 6] are given in (5) and (6).
| (5) |
| (6) |
Note that (6) is the DTFT of the triangular function:
| (7) |
Taking to be the expected center frequency of the received signal, the modeled power spectrum from (4) can be written as (8), which has a better suited form for studying the spectral moments:
| (8) |
Random scatterers in the medium are responsible for the backscatter term in (8). Taking r[nTs] to be the impulse response sequence for these random scatterers, it can be modeled [23], [33], as a sample function of a zeromean and white Gaussian process with pdf:
| (9) |
Because r(n) are independent and identically distributed Gaussian random variables, the spectral term BSC(f, z) can also be shown to have an exponential distribution (chi-squared with two degrees of freedom) and constitute a Gaussian random process [32, ch. 3]:
| (10) |
| (11) |
Given this pdf, expected value and variance of the spectral backscatter term are calculated as (12). Measurements on simulated phantom spectra agree with this model to within a constant factor.
| (12) |
B. Second-Order Statistics of the Spectral Centroid
Next, we derive the spectral moments from the spectral representation of the received signal given in (8). Considering that the estimated power spectrum has support [0, fs/2], with fs being the sampling frequency, and resolution Δf = fs/M, expected values of the zeroth, first, and second spectral moments can be written as follows:
| (13) |
| (14) |
| (15) |
Using these estimated spectral moments, the centroid is estimated as (16), and the spectral width is estimated as (17).
| (16) |
| (17) |
Variance of the estimated centroid frequency is calculated as follows:
| (18) |
According to this model, variability in the estimated moments arises from variability in the backscatter spectral term and the effective additive noise power. Assuming a white Gaussian noise process , the effective noise power of a sampled and windowed data segment of length M will have a Gamma distribution [32, ch. 6].
| (19) |
For a sufficiently large M (e.g., M > 10), this Gamma distribution converges to a Gaussian distribution with expectation , and variance . Therefore, contribution of additive noise to the variance of the spectral moments can be estimated as given in (20):
| (20) |
Using (20), total variance of the estimated moments, including contribution of the backscatter term is calculated as follows. Replacing the variance terms from (21)–(23) into (18) yields the estimation variance of the centroid.
| (21) |
| (22) |
| (23) |
C. Attenuation Estimation Statistics
To estimate the attenuation coefficient β[Np/cm/MHz], a linear regression is performed over N consecutive windows of RF data (of size Δz) along depth, where their corresponding centroid estimates are fitted to a linear equation for which the slope of centroid frequency downshift with depth is determined by the attenuation coefficient as follows:
| (24) |
where ν(n) represent the variability in centroid frequency estimates and are modeled as independent normal random variables with zero mean and variance .
The joint probability density for with parameter β is therefore given by (25):
| (25) |
The log-likelihood function is written as
| (26) |
and its first and second partial derivatives with respect to β are written as (27) and (28):
| (27) |
| (28) |
The Cramer-Rao lower bound (CRLB) [32, ch. 4] on variance of the attenuation coefficient estimate, β̂, is therefore given by (29):
| (29) |
Another maximum-likelihood (ML) estimator of β can be written when the intercept of the linear relationship, Fc, is assumed to be unknown. In this case, a larger variance expression for the estimator of β is achievable, given by (30).
| (30) |
Multiplying the variance given in (30) by (8.686)2 converts its unit to [dB/cm/MHz]2.
Theoretical bounds for attenuation estimation variance were compared with statistics computed from simulated phantom and estimated from physical tissue-mimicking phantom data sets. Simulated phantoms were created using a program based on the classical linear diffraction theory [34]. For this study, a linear array transducer with 128 elements and a 0.2 mm spacing was simulated. Beam focus was set at 40 mm. A phantom with dimensions of 100 mm in depth and 160 mm in width was simulated. Simulated scatterers were glass beads with a 50 µm diameter and a density of 10 per cubic millimeter. Uniform attenuation of 0.5 dB/cm/MHz and sound speed of 1540 m/s were also assumed for the simulation. Sampling was performed at 40 MHz. To minimize diffraction effects, parameter estimation zone was limited to a symmetrical region about the focal depth. Scan parameters such as transmit pulse center frequency, transmit pulse bandwidth, and SNR were changed to generate different RF data sets using the simulated phantom. Initial values for these scan parameters were 5.5 MHz center frequency, 65% bandwidth, 40 dB SNR, and 8 mm window length (i.e., 6.3 pulse lengths or 28.5 wavelengths) with a Hann window function. Pulse length is defined as the distance between first and last transition of the transmit pulse above 0.1% of its maximum level [35]. Power spectra were estimated by calculating the squared FFT of the windowed data segments and averaging them over 40 adjacent A-lines. Given the large window length chosen, a 65% axial overlap between windowed segments was used.
III. Results
A. Simulated Phantom Results
The attenuation estimates obtained by the centroid downshift method in the focal region of the simulated transducer were used to calculate the estimation statistics. The effect of variation in the scan parameters on variance of the estimated attenuation coefficient was studied and compared with the theoretical values derived from the model.
1) Signal-to-Noise Ratio
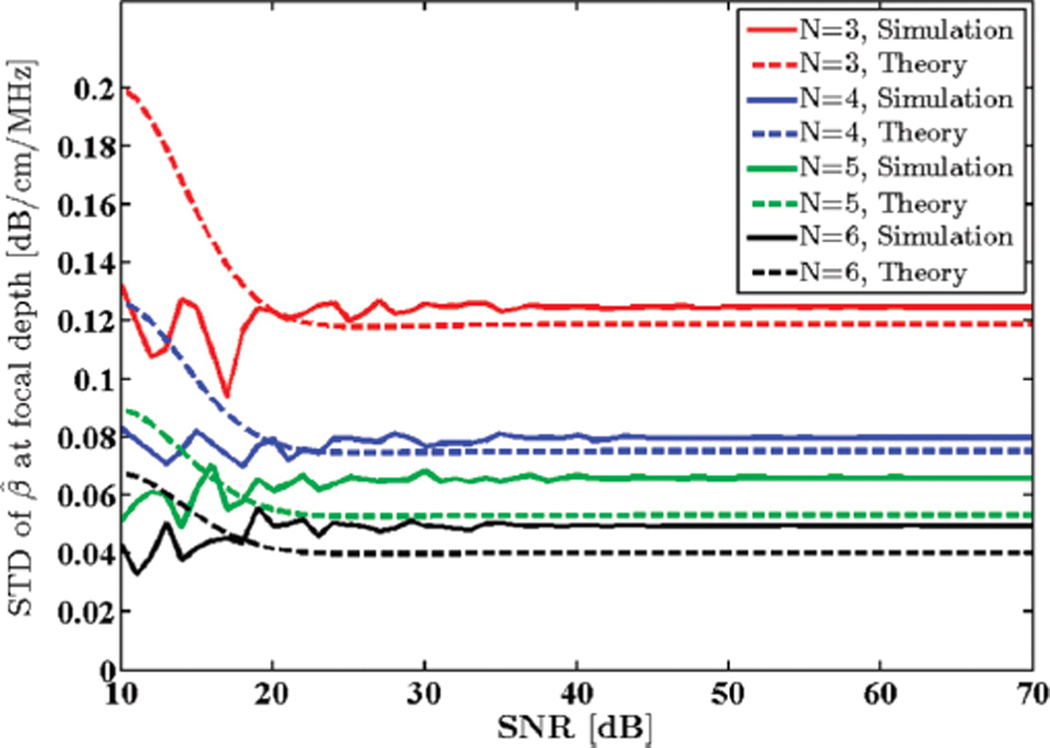
A Gaussian-shaped transmit pulse spectrum with a 5.5 MHz center frequency and 65% bandwidth was selected. Window size was set to 8 mm to yield stable power spectra and limit spectral broadening effects [35]. Additive white Gaussian noise (AWGN) with different power density values were added to the simulated RF data. SNR was computed as the ratio of the power spectrum peak to the out of band average noise power. Standard deviation (STD) of the estimated attenuation coefficient in the focal region of the phantom was computed and plotted against SNR as shown in Fig. 1.
Fig. 1.
Standard deviation (STD) of the estimated attenuation coefficient from simulated RF data in the focal region of the simulated transducer plotted against SNR, along with theoretical values given by the model. N shows the number of regression points used to estimate the attenuation coefficient.
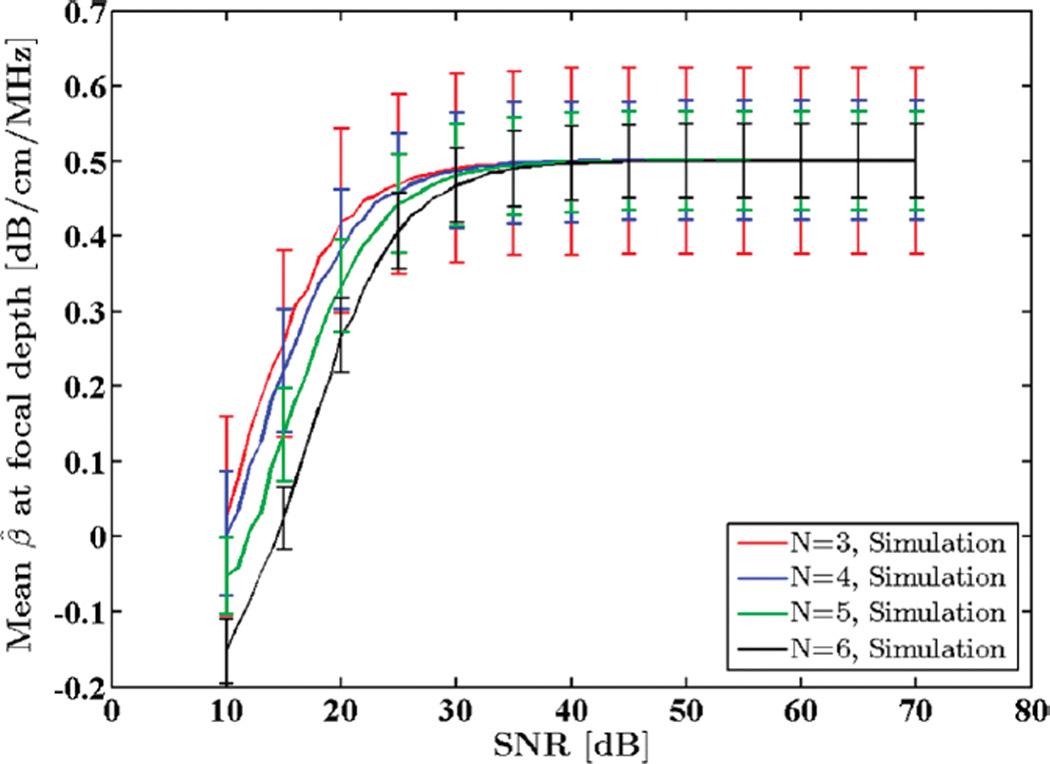
Fig. 2 shows the mean attenuation coefficient estimates for this SNR range. Note that for SNR values below 25 dB the estimation fails and therefore second-order statistics, i.e., STD of the attenuation coefficients, are not meaningful. As the SNR is increased, however, experimental and theoretical STDs begin to agree.
Fig. 2.
Mean of the estimated attenuation coefficients from simulated RF data in the focal region of the simulated transducer plotted against SNR. N shows the number of regression points used to estimate the attenuation coefficient.
2) Transmit Pulse Bandwidth
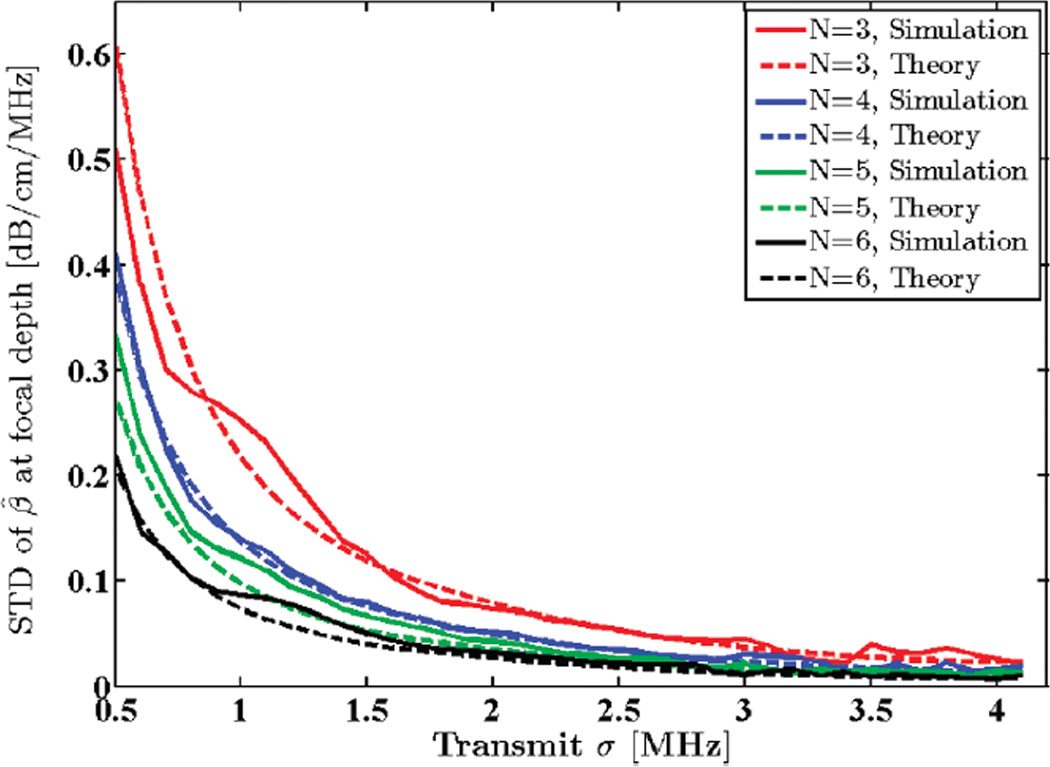
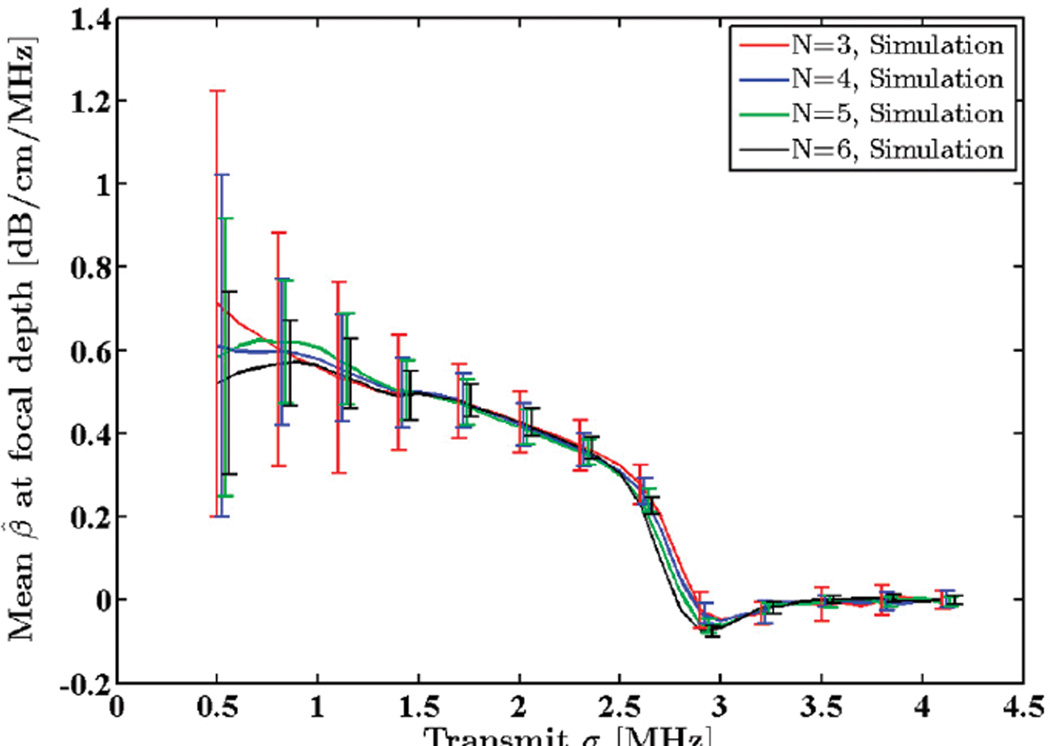
A Gaussian transmit pulse spectrum with a 5.5 MHz center frequency was assumed. SNR and window size were set to 40 dB and 8 mm, respectively. Standard deviation of the transmit pulse, σt, was varied from 0.5 to 4.1 MHz, and attenuation coefficients were estimated in the focal region of the simulated data. A comparison between the STD of the estimated attenuation coefficients and the theoretical predictions is illustrated in Fig. 3. Observe that increasing the transmit pulse bandwidth lowers the estimation variance. Fig. 4 shows the mean attenuation coefficient estimates for the same bandwidth range. Note that as the transmit sigma increases beyond 2.5 MHz (100% bandwidth), estimation becomes biased and ultimately fails. This is due to loss of spectral information during calculation of moments at high bandwidths. This can be remedied by using a higher transmit center frequency.
Fig. 3.
Standard deviation (STD) of the estimated attenuation coefficient from simulated RF data in the focal region of the simulated transducer plotted against STD of the transmit pulse, σt, along with theoretical values given by the model. N shows the number of regression points used to estimate the attenuation coefficient.
Fig. 4.
Mean of the estimated attenuation coefficients from simulated RF data in the focal region of the simulated transducer plotted against standard deviation of the transmit pulse, σt. N shows the number of regression points used to estimate the attenuation coefficient.
3) Transmit Pulse Center Frequency
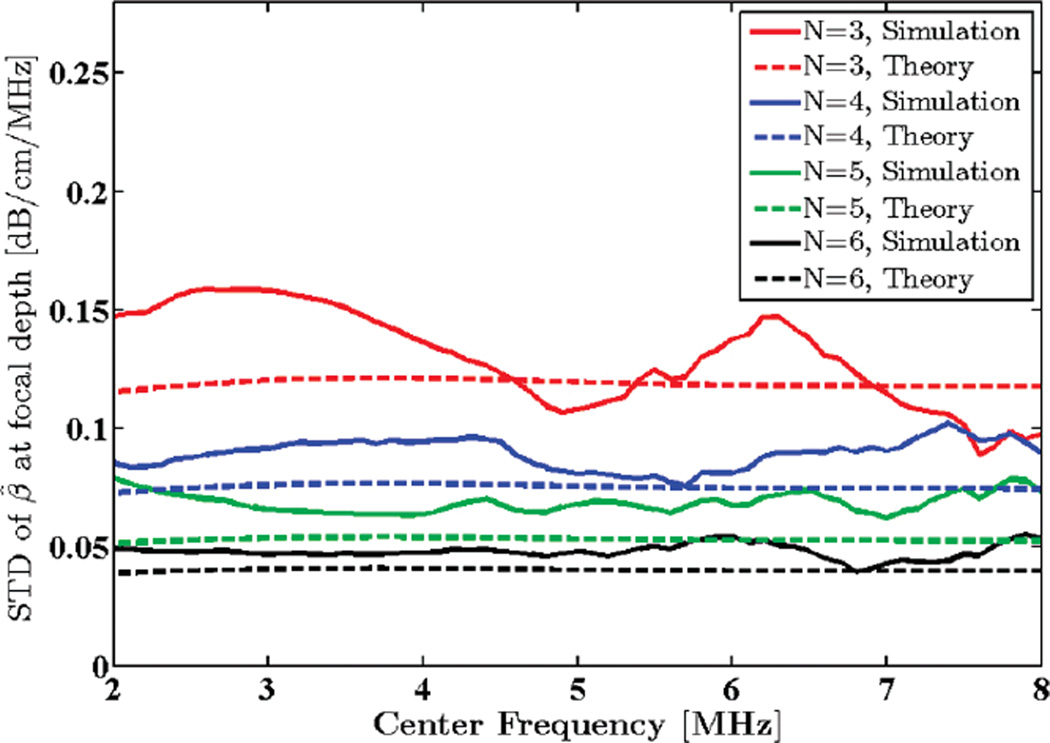
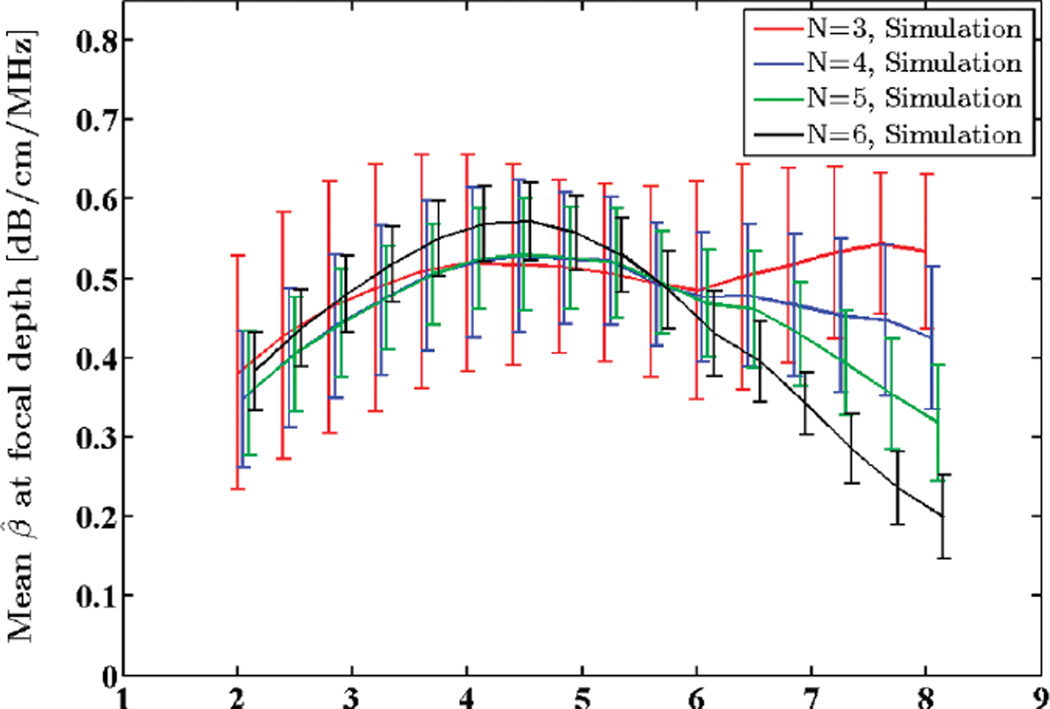
Standard deviation of the transmit pulse was set to 1.5 MHz. SNR was set to 40 dB, and window length was kept at 8 mm. Center frequency was varied from 2 to 8 MHz and the attenuation coefficient was estimated in the focal region of the simulated phantom. Standard deviation of the attenuation estimates are compared with the theoretical predictions in Fig. 5. Mean attenuation coefficient estimates for this frequency range are plotted in Fig. 6.
Fig. 5.
Standard deviation (STD) of the estimated attenuation coefficient from simulated RF data in the focal region of the simulated transducer plotted against transmit pulse center frequency, along with theoretical values given by the model. N shows the number of regression points used to estimate the attenuation coefficient.
Fig. 6.
Mean of the estimated attenuation coefficients from simulated RF data in the focal region of the simulated transducer plotted against transmit pulse center frequency. N shows the number of regression points used to estimate the attenuation coefficient.
4) Window Length
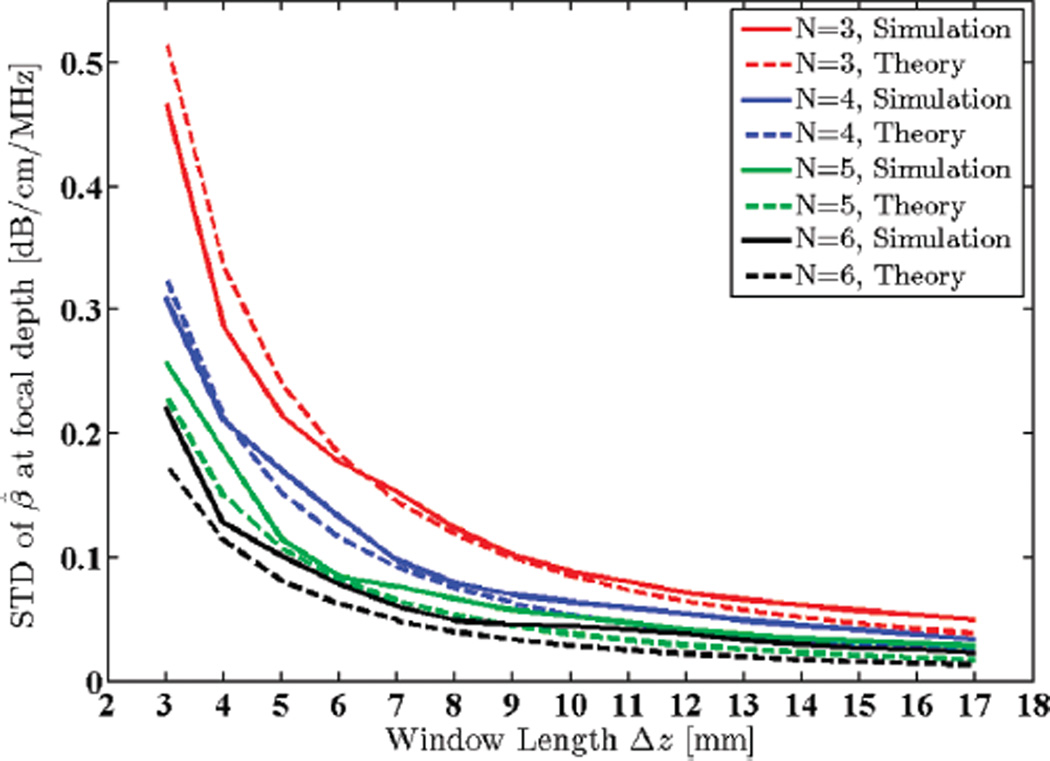
The Gaussian transmit pulse was set to have a 5.5 MHz center frequency and a 1.5 MHz STD. SNR was set to 40 dB. Window length was varied from 3 to 17 mm (i.e., 2.4 to 13.4 pulse lengths or 10.7 to 60.7 wavelengths). In typical clinical ultrasound imaging frequency ranges, a window length smaller than 4 µs (~3 mm) would result in unstable power spectral estimations and lead to spectral broadening effects [36]. The STD of estimated attenuation coefficients in the focal region of the simulated phantom is plotted against the theoretical predictions from the model in Fig. 7.
Fig. 7.
Standard deviation (STD) of the estimated attenuation coefficient from simulated RF data in the focal region of the simulated transducer plotted against window lengths 3 to 17 mm (2.4 to 13.4 pulse lengths or 10.7 to 60.7 wavelengths), along with theoretical values given by the model. N shows the number of regression points used to estimate the attenuation coefficient.
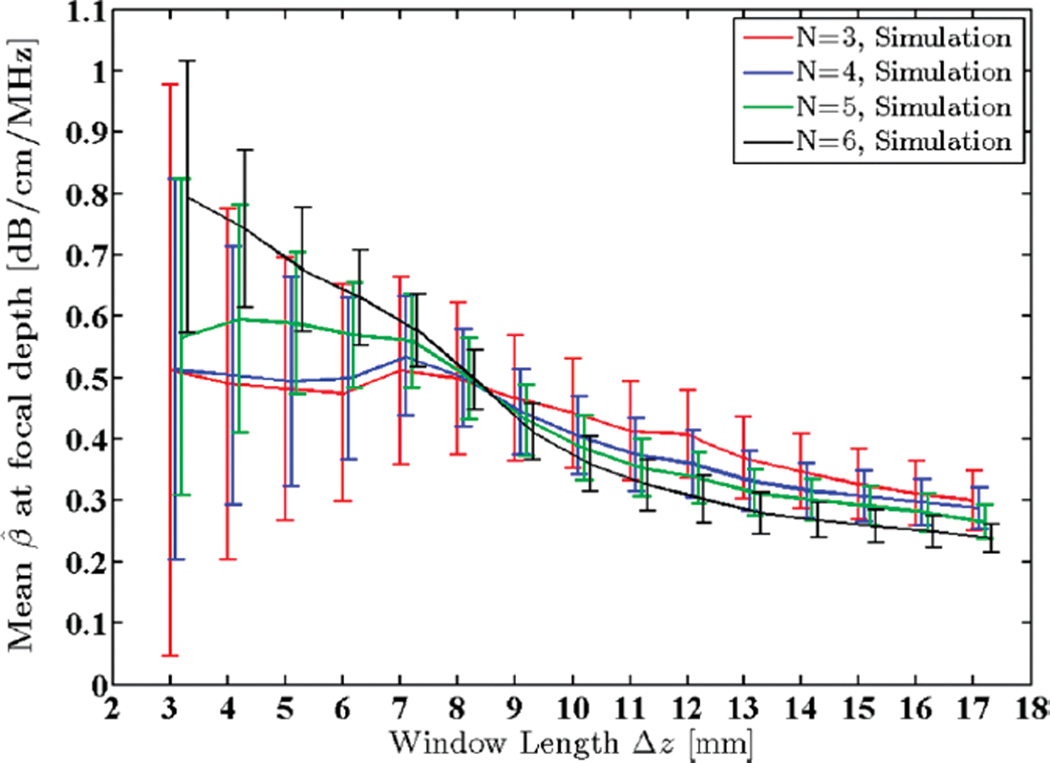
It is evident that increasing the window length results in increased robustness of the power spectra and centroid estimates and, therefore, lowers the variance of the attenuation estimates. However, increasing the window length also introduces bias to the estimates due to increasing non-stationarities, as illustrated in Fig. 8.
Fig. 8.
Mean of the estimated attenuation coefficients from simulated RF data in the focal region of the simulated transducer plotted against window lengths 3 to 17 mm (2.4 to 13.4 pulse lengths or 10.7 to 60.7 wavelengths). N shows the number of regression points used to estimate the attenuation coefficient.
B. Physical TM Phantom Measurements
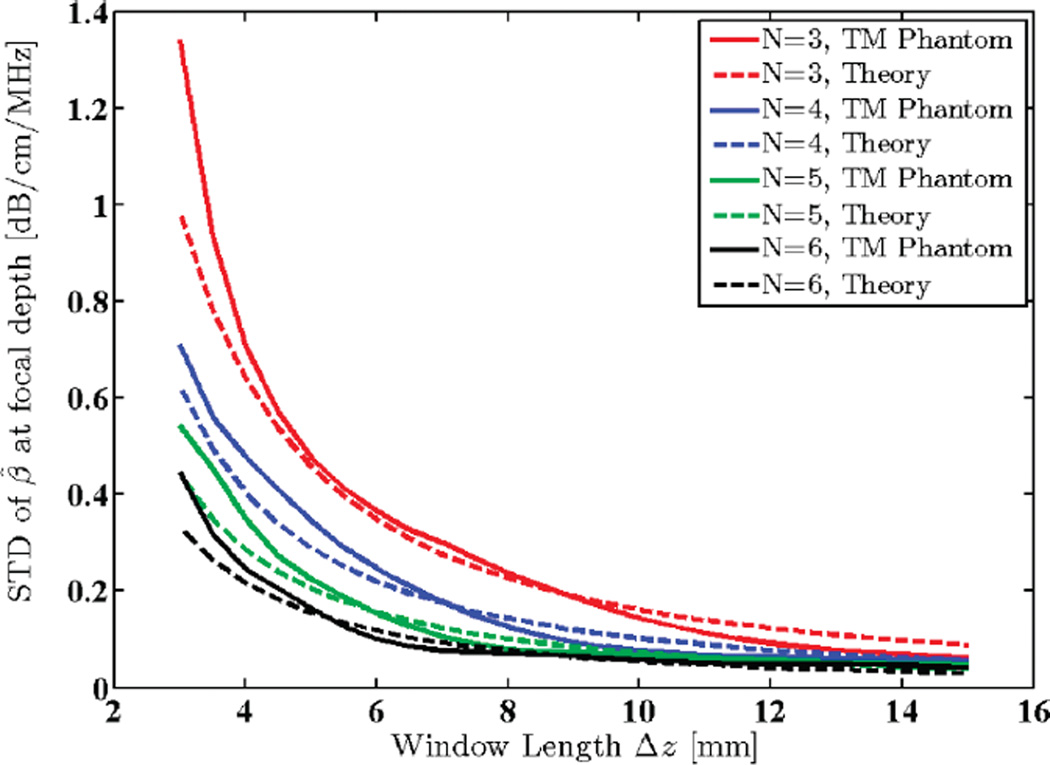
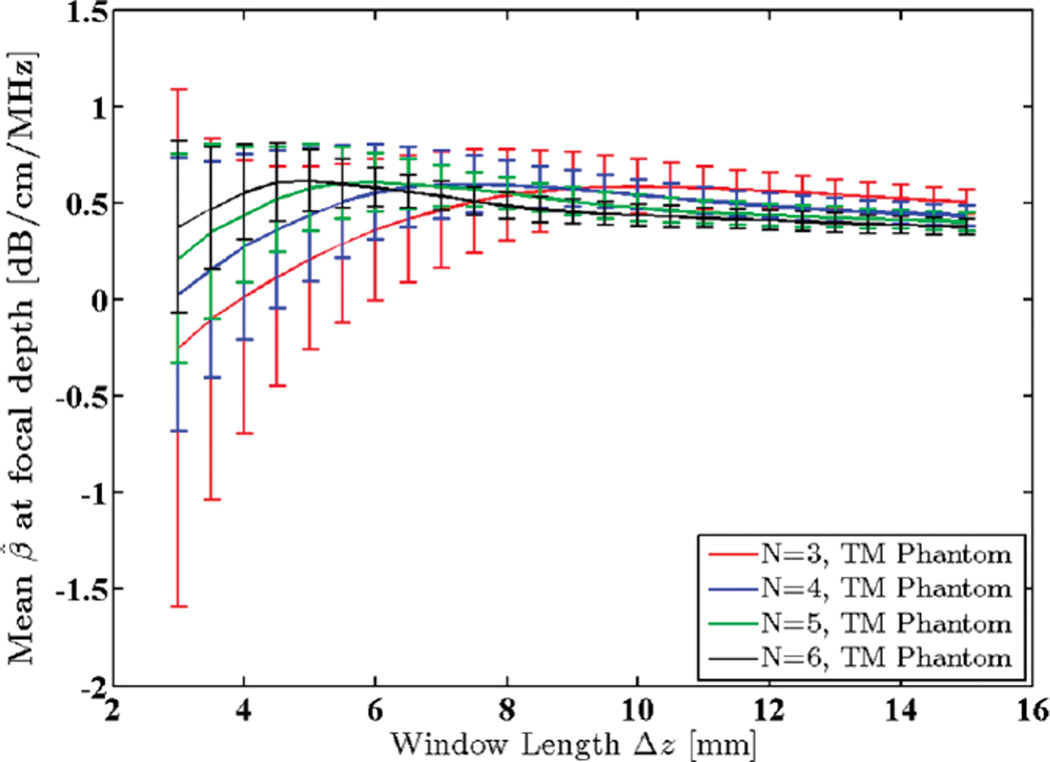
A uniform TM reference phantom with constant speed of sound (1540 m/s) and attenuation coefficient (0.5 dB/ cm/MHz) was scanned using a 9L4 linear array transducer (Siemens Medical Solutions USA Inc., Mountain View, CA) with a 6.7 MHz nominal center frequency (actual center frequency of the power spectra was 5.6 MHz) and 50% bandwidth. Data acquisition was performed using an Acuson S2000 ultrasound system (Siemens Medical Solutions USA Inc.) equipped with a research interface. Imaging depth was 80 mm and beam focus was set at 20 mm. 40 adjacent power spectra were averaged in each RO I, and a 65% axial overlap between windowed segments was used. The centroid downshift method was utilized to estimate the attenuation coefficient in the focal region of the transducer using different window sizes ranging from 3 to 15 mm, i.e., 2.4 to 11.8 pulse lengths, or 10.9 to 54.5 wavelengths. Standard deviation and mean of the estimates were calculated and plotted as shown in Figs. 9 and 10.
Fig. 9.
Standard deviation (STD) of estimated attenuation coefficients in the focal region of a uniform TM reference phantom plotted against window lengths 3 to 15 mm (2.4 to 11.8 pulse lengths or 10.9 to 54.5 wavelengths). N shows the number of regression points used to estimate the attenuation coefficient.
Fig. 10.
Mean of the estimated attenuation coefficients in the focal region of a uniform TM reference phantom plotted against window lengths 3 to 15 mm (2.4 to 11.8 pulse lengths or 10.9 to 54.5 wavelengths). N shows the number of regression points used to estimate the attenuation coefficient.
C. A Signal-to-Noise Measure for Attenuation
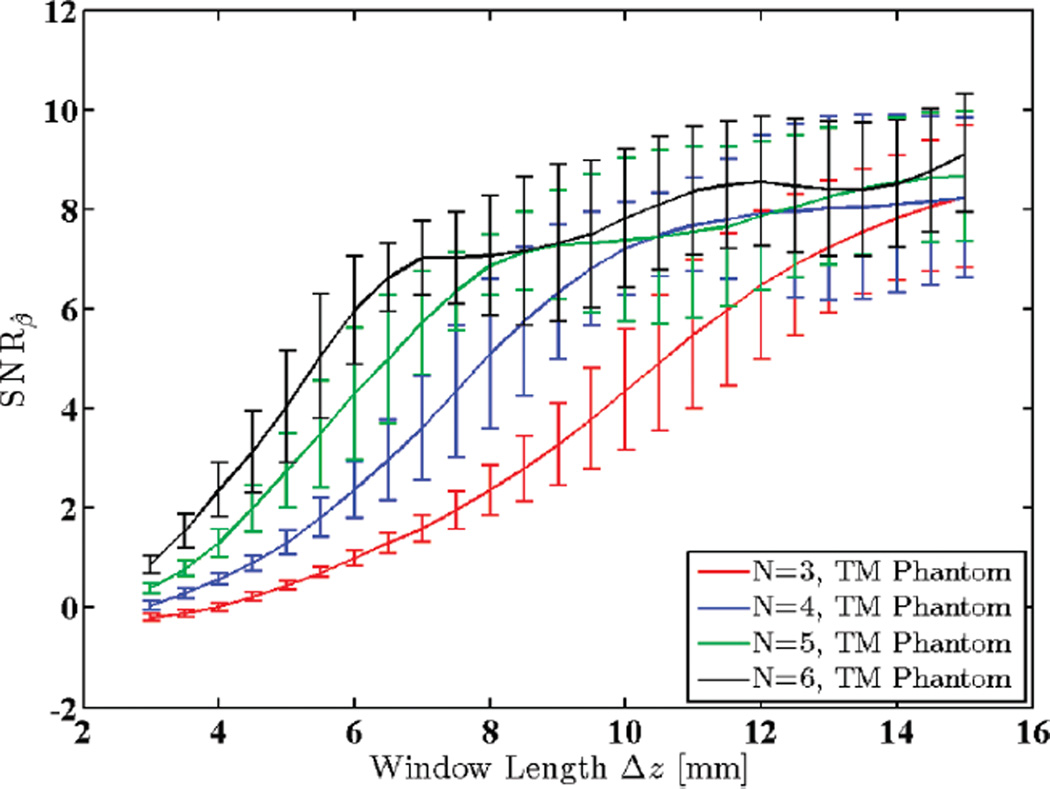
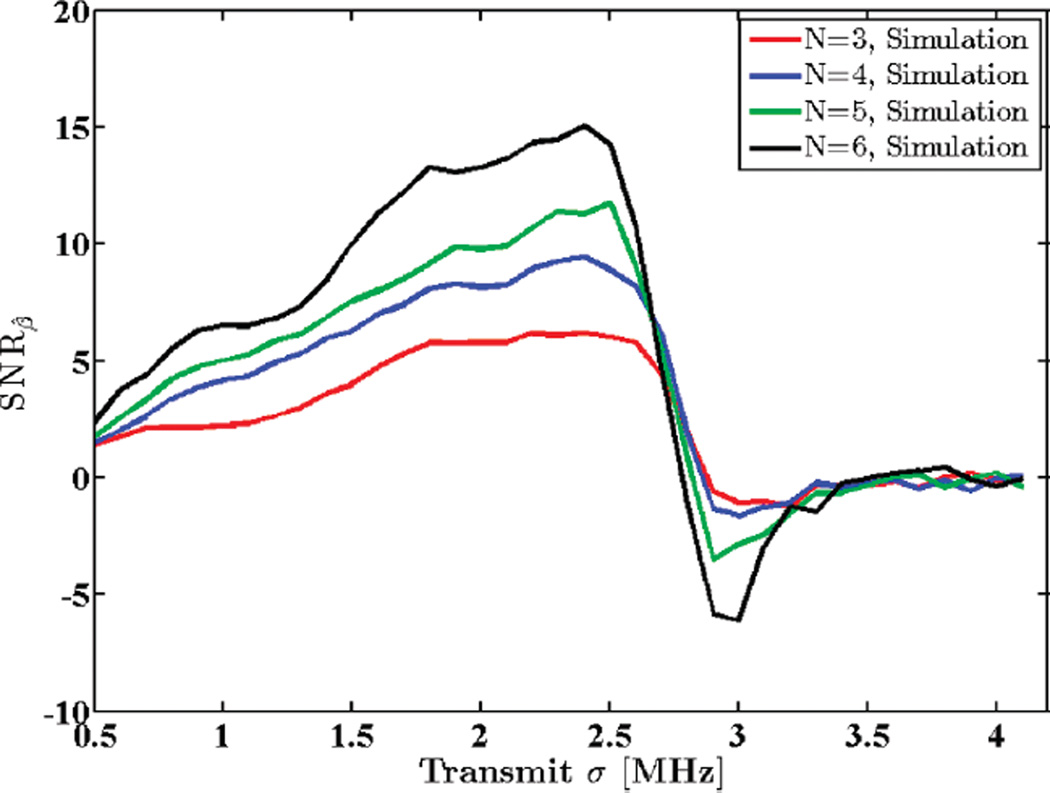
Recently, the attenuation SNR has been studied as a measure of effectiveness for different attenuation estimation methods [37]. In this section, we provide plots of attenuation SNR, defined as ratio of the mean attenuation coefficient to its STD for physical and simulated phantoms.
Fig. 11 shows SNRβ for the uniform TM reference phantom described in Section III-B for different window lengths. Note that SNRβ increases with increased window lengths until the increasing non-stationarities of the echo signal (with larger windows) introduce so much bias to the estimation process that the attenuation SNR begins to drop.
Fig. 11.
Attenuation SNR for a uniform TM reference phantom plotted against window lengths 3 to 15 mm (2.4 to 11.8 pulse lengths or 10.9 to 54.5 wavelengths). N shows the number of regression points used to estimate the attenuation coefficient.
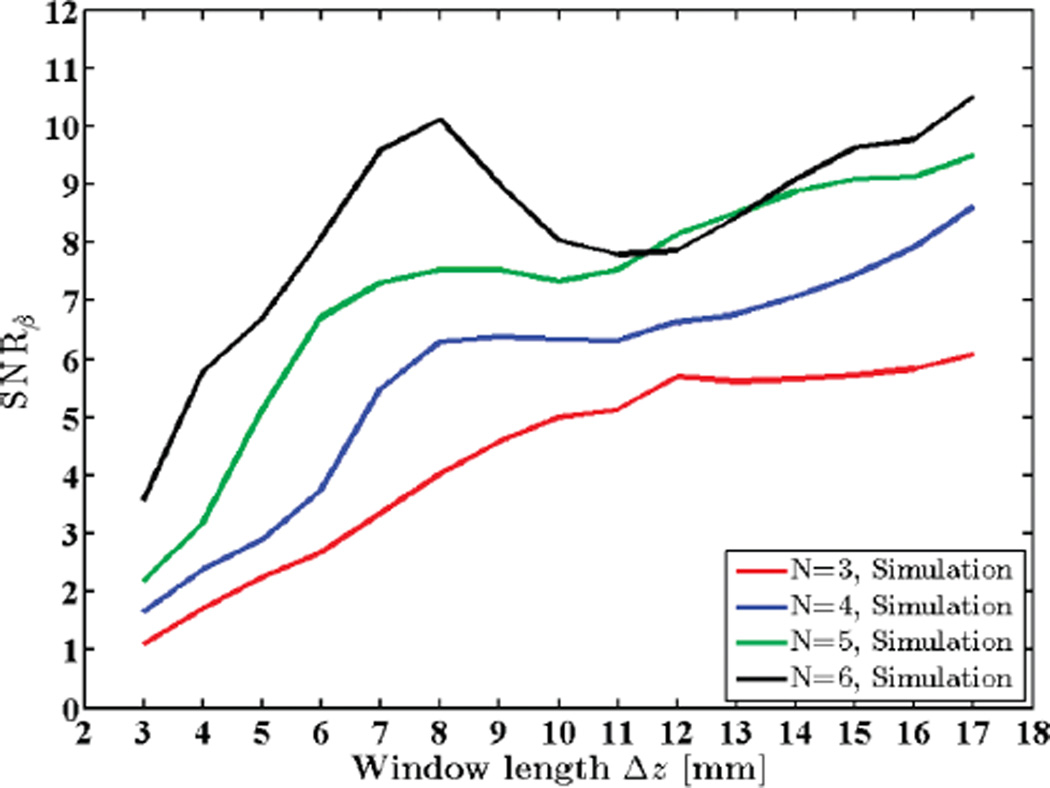
In a similar manner, Figs. 12 and 13 show variations in SNRβ with different window lengths and with different transmit pulse bandwidths for a simulated phantom, respectively. Observe that both experimental and simulated results follow a similar trend.
Fig. 12.
Attenuation SNR for a simulated uniform phantom plotted against window lengths 3 to 17 mm (2.4 to 13.4 pulse lengths or 10.7 to 60.7 wavelengths). N shows the number of regression points used to estimate the attenuation coefficient.
Fig. 13.
Attenuation SNR for a simulated uniform phantom plotted against standard deviation of the transmit pulse, σt. N shows the number of regression points used to estimate the attenuation coefficient.
IV. Discussion
Consideration should be given to the modeling of the spectral backscatter term. The model assumes that random scatterers in the medium are small (unresolved) and their concentration is high enough to satisfy the requirements of the central limit theorem, and constitute diffuse scattering. This results in a normally distributed impulse response sequence as given in (9) and therefore a Rayleigh distribution for signal envelope, and exponential distribution for its intensity. Hence the pdf in (11). The model is accurate when windowing effects (i.e., leakage and broadening) can be neglected, thereby justifying the assumption of independence at different frequency points. Expected value and variance of the spectral backscatter term were directly computed, in the simulated case, from the frequency-domain representation of the phantom before insonification. In the experimental case, it suffices to measure the expected value and variance of the power spectrum itself in the RO I because it is the ratio of variance to squared mean of the backscatter term that remains in the theoretical expressions, and not its absolute value. The spectral effects of the window function, such as spectral broadening due to main lobe and interference due to side lobes of the window spectrum, have been assumed negligible in the derivation of spectral moments and their variance terms. This assumption is reasonable for sufficiently large window sizes (e.g., >10 wavelengths) as is the case in this study. However, for small window sizes, the mentioned effects become significant. In any case, the model provides theoretical predictions for the STD of the attenuation coefficient estimated using the centroid downshift method, which show acceptable agreement with experimental measurements and can serve as a guideline for evaluating attenuation estimation algorithms. It is worth mentioning that the centroid downshift method is susceptible to diffraction effects and does not provide stable estimates outside of a symmetrical area about the transducer focal zone. Diffraction effects have not been accounted for in this model. Instead the parameter estimation region has been limited to a symmetrical RO I about the focal depth. As a result, the model only predicts the best achievable performance of the CDS method. Therefore, as depicted in Fig. 8, there are limitations on increasing the data segment length to get robust power spectra for this method. Besides, increasing the window length would also limit the spatial resolution of the attenuation coefficient estimated, which is not desirable in attenuation imaging endeavors.
V. Conclusion
We have derived a parametric model for the backscattered power spectrum from an attenuating medium. The spectral centroid estimate and its statistics were calculated based on this model and used to provide a theoretical prediction on the STD of the attenuation coefficient estimated using the centroid downshift method. The results were verified by comparing to measurements on simulated and physical TM phantoms. Theoretical predictions for the STD of the estimated attenuation slope were shown to track simulated and experimentally measured values with errors of less than 0.05 dB/cm/MHz over the parameter ranges investigated in this paper. This framework can help with selecting suitable imaging parameters such as transmit pulse center frequency and bandwidth, SNR, and window length and type that would provide required levels of stability for attenuation estimation. We were able to isolate scan parameter ranges that provided estimation STDs of 0.1 dB/cm/MHz or better for our simulated and physical TM phantoms.
Acknowledgments
The authors thank Mr. G. Frank for construction and through-transmission measurements on TM phantoms, and the anonymous reviewers for their valuable comments and suggestions that helped improve this manuscript significantly.
This work was supported in part by National Institutes of Health grants R01 CA112192-07 and T32 CA09206-36A1.
Biographies

Kayvan Samimi received the B.S. degree in electrical engineering from the University of Tehran, Iran, in 2009, and the M.S. degree in electrical engineering from the University of Wisconsin–Madison, Madison, WI, in 2011, where he is currently a Ph.D. student. His research interests are in signal processing applications in medical ultrasound imaging including attenuation estimation, tissue characterization, temperature imaging, and other areas of quantitative ultrasound. Mr. Samimi is a student member of IEEE and Eta Kappa Nu.

Tomy Varghese received the B.E. degree in instrumentation technology from the University of Mysore, India, in 1988, and the M.S. and Ph.D in electrical engineering from the University of Kentucky, Lexington, KY, in 1992 and 1995, respectively. From 1988 to 1990 he was employed as an Engineer at Wipro Information Technology Ltd. India. From 1995 to 2000, he was a postdoctoral research associate at the Ultrasonics laboratory, Department of Radiology, University of Texas Medical School, Houston, TX. He joined the Department of Medical Physics at the University of Wisconsin–Madison, Madison, WI, in 2000 as an Assistant Professor. He is currently a Professor in the same department. His research interests include elastography; ultrasound imaging; quantitative ultrasound, detection, and estimation theory; statistical pattern recognition; and signal and image processing applications in medical imaging. Dr. Varghese is a fellow of the American Institute of Ultrasound in Medicine (AIUM), senior member of the IEEE, and a member of the American Association of Physicists in Medicine (AAPM) and Eta Kappa Nu.
References
- 1.Mimbs JW, Yuhas D, Miller J, Weiss AN, Sobel BE. Detection of myocardial infarction in vitro based on altered attenuation of ultrasound. Circ. Res. 1977;41(2):192–198. doi: 10.1161/01.res.41.2.192. [DOI] [PubMed] [Google Scholar]
- 2.O’Donnell M, Mimbs J, Miller J. Relationship between collagen and ultrasonic backscatter in myocardial tissue. J. Acoust. Soc. Am. 1981;69(2):580–588. doi: 10.1121/1.385433. [DOI] [PubMed] [Google Scholar]
- 3.Gaitini D, Baruch Y, Ghersin E, Veitsman E, Kerner H, Shalem B, Yaniv G, Sarfaty C, Azhari H. Feasibility study of ultrasonic fatty liver biopsy: Texture vs. attenuation and backscatter. Ultrasound Med. Biol. 2004;30(10):1321–1327. doi: 10.1016/j.ultrasmedbio.2004.08.001. [DOI] [PubMed] [Google Scholar]
- 4.Shi H, Varghese T, Dempsey RJ, Salamat MS, Zagzebski JA. Relationship between ultrasonic attenuation, size and axial strain parameters for ex vivo atherosclerotic carotid plaque. Ultrasound Med. Biol. 2008;34(10):1666–1677. doi: 10.1016/j.ultrasmedbio.2008.02.014. [DOI] [PMC free article] [PubMed] [Google Scholar]
- 5.Shi H, Varghese T, Mitchell CC, McCormick M, Dempsey RJ, Kliewer MA. In vivo attenuation and equivalent scatterer size parameters for atherosclerotic carotid plaque: Preliminary results. Ultrasonics. 2009;49(8):779–785. doi: 10.1016/j.ultras.2009.06.004. [DOI] [PMC free article] [PubMed] [Google Scholar]
- 6.Chang CH, Huang SW, Yang HC, Chou YH, Li PC. Reconstruction of ultrasonic sound velocity and attenuation coefficient using linear arrays: Clinical assessment. Ultrasound Med. Biol. 2007;33(11):1681–1687. doi: 10.1016/j.ultrasmedbio.2007.05.012. [DOI] [PubMed] [Google Scholar]
- 7.Ghoshal G, Lavarello RJ, Kemmerer JP, Miller RJ, Oelze ML. Ex vivo study of quantitative ultrasound parameters in fatty rabbit livers. Ultrasound Med. Biol. 2012;38(12):2238–2248. doi: 10.1016/j.ultrasmedbio.2012.08.010. [DOI] [PMC free article] [PubMed] [Google Scholar]
- 8.Narayana PA, Ophir J. On the frequency dependence of attenuation in normal and fatty liver. IEEE Trans. Sonics Ultrason. 1983;30(6):379–383. [Google Scholar]
- 9.Lin T, Ophir J, Potter G. Correlation of ultrasonic attenuation with pathologic fat and fibrosis in liver disease. Ultrasound Med. Biol. 1988;14(8):729–734. doi: 10.1016/0301-5629(88)90028-2. [DOI] [PubMed] [Google Scholar]
- 10.Kuc R. Clinical application of an ultrasound attenuation coefficient estimation technique for liver pathology characterization. IEEE Trans. Biomed. Eng. 1980;27(6):312–319. doi: 10.1109/TBME.1980.326739. [DOI] [PubMed] [Google Scholar]
- 11.Baldwin SL, Marutyan KR, Yang M, Wallace KD, Holland MR, Miller JG. Estimating myocardial attenuation from M-mode ultrasonic backscatter. Ultrasound Med. Biol. 2005;31(4):477–484. doi: 10.1016/j.ultrasmedbio.2004.12.024. [DOI] [PubMed] [Google Scholar]
- 12.Bridal SL, Beyssen B, Fornès P, Julia P, Berger G. Multi-parametric attenuation and backscatter images for characterization of carotid plaque. Ultrason. Imaging. 2000;22(1):20–34. doi: 10.1177/016173460002200102. [DOI] [PubMed] [Google Scholar]
- 13.D’Astous F, Foster F. Frequency dependence of ultrasound attenuation and backscatter in breast tissue. Ultrasound Med. Biol. 1986;12(10):795–808. doi: 10.1016/0301-5629(86)90077-3. [DOI] [PubMed] [Google Scholar]
- 14.Bridal SL, Fournier C, Coron A, Leguerney I, Laugier P. Ultrasonic backscatter and attenuation (11–27 MHz) variation with collagen fiber distribution in ex vivo human dermis. Ultrason. Imaging. 2006;28(1):23–40. doi: 10.1177/016173460602800103. [DOI] [PubMed] [Google Scholar]
- 15.Nam K, Rosado-Mendez IM, Wirtzfeld LA, Ghoshal G, Pawlicki AD, Madsen EL, Lavarello RJ, Oelze ML, Zagzebski JA, O’Brien WD, Hall TJ. Comparison of ultrasound attenuation and backscatter estimates in layered tissue-mimicking phantoms among three clinical scanners. Ultrason. Imaging. 2012;34(4):209–221. doi: 10.1177/0161734612464451. [DOI] [PMC free article] [PubMed] [Google Scholar]
- 16.Anderson ME, Soo MS, Trahey GE. In vivo breast tissue backscatter measurements with 7.5-and 10-MHz transducers. Ultrasound Med. Biol. 2001;27(1):75–81. doi: 10.1016/s0301-5629(00)00310-0. [DOI] [PubMed] [Google Scholar]
- 17.Pawlicki AD, O’Brien WD. Method for estimating total attenuation from a spatial map of attenuation slope for quantitative ultrasound imaging. Ultrason. Imaging. 2013;35(2):162–172. doi: 10.1177/0161734613478695. [DOI] [PMC free article] [PubMed] [Google Scholar]
- 18.Vlad RM, Alajez NM, Giles A, Kolios MC, Czarnota GJ. Quantitative ultrasound characterization of cancer radiotherapy effects in vitro. Int. J. Radiation Oncol. Biol. Phys. 2008;72(4):1236–1243. doi: 10.1016/j.ijrobp.2008.07.027. [DOI] [PubMed] [Google Scholar]
- 19.Taggart LR, Baddour RE, Giles A, Czarnota GJ, Kolios MC. Ultrasonic characterization of whole cells and isolated nuclei. Ultrasound Med. Biol. 2007;33(3):389–401. doi: 10.1016/j.ultrasmedbio.2006.07.037. [DOI] [PubMed] [Google Scholar]
- 20.Kuc R. Estimating acoustic attenuation from reflected ultrasound signals: Comparison of spectral-shift and spectral-difference approaches. IEEE Trans. Acoust. Speech Signal Process. 1984;32(1):1–6. [Google Scholar]
- 21.Yao LX, Zagzebski JA, Madsen EL. Backscatter coefficient measurements using a reference phantom to extract depth-dependent instrumentation factors. Ultrason. Imaging. 1990;12(1):58–70. doi: 10.1177/016173469001200105. [DOI] [PubMed] [Google Scholar]
- 22.Labyed Y, Bigelow TA. Optimization of the algorithms for estimating the ultrasonic attenuation along the propagation path. Ultrasonics. 2012;52(6):720–729. doi: 10.1016/j.ultras.2012.01.011. [DOI] [PMC free article] [PubMed] [Google Scholar]
- 23.Kuc R, Schwartz M. Estimating the acoustic attenuation coefficient slope for liver from reflected ultrasound signals. IEEE Trans. Sonics Ultrason. 1979;26(5):353–361. [Google Scholar]
- 24.Fink M, Hottier F, Cardoso J. Ultrasonic signal processing for in vivo attenuation measurement: Short time Fourier analysis. Ultrason. Imaging. 1983;5(2):117–135. doi: 10.1177/016173468300500202. [DOI] [PubMed] [Google Scholar]
- 25.Bigelow TA, McFarlin BL, O’Brien WD, Jr, Oelze ML. In vivo ultrasonic attenuation slope estimates for detecting cervical ripening in rats: Preliminary results. J. Acoust. Soc. Am. 2008;123(3):1794–1800. doi: 10.1121/1.2832317. [DOI] [PMC free article] [PubMed] [Google Scholar]
- 26.Kuc R, Li H. Reduced-order autoregressive modeling for center-frequency estimation. Ultrason. Imaging. 1985;7(3):244–251. doi: 10.1177/016173468500700304. [DOI] [PubMed] [Google Scholar]
- 27.Baldeweck T, Laugier P, Herment A, Berger G. Application of autoregressive spectral analysis for ultrasound attenuation estimation: Interest in highly attenuating medium. IEEE Trans. Ultrason. Ferroelectr. Freq. Control. 1995;42(1):99–110. [Google Scholar]
- 28.Insana M, Zagzebski J, Madsen E. Improvements in the spectral difference method for measuring ultrasonic attenuation. Ultrason. Imaging. 1983;5(4):331–345. doi: 10.1177/016173468300500404. [DOI] [PubMed] [Google Scholar]
- 29.Kim H, Varghese T. Hybrid spectral domain method for attenuation slope estimation. Ultrasound Med. Biol. 2008;34(11):1808–1819. doi: 10.1016/j.ultrasmedbio.2008.04.011. [DOI] [PubMed] [Google Scholar]
- 30.Labyed Y, Bigelow TA. A theoretical comparison of attenuation measurement techniques from backscattered ultrasound echoes. J. Acoust. Soc. Am. 2011;129(4):2316–2324. doi: 10.1121/1.3559677. [DOI] [PMC free article] [PubMed] [Google Scholar]
- 31.Kim H, Varghese T. Attenuation estimation using spectral cross-correlation. IEEE Trans. Ultrason. Ferroelectr. Freq. Control. 2007;54(3):510–519. doi: 10.1109/tuffc.2007.274. [DOI] [PubMed] [Google Scholar]
- 32.Jenkins GM, Watts DG. Spectral Analysis and Its Applications. San Francisco, CA, USA: Holden-Day; 1968. The spectrum. [Google Scholar]
- 33.Kuc R. Bounds on estimating the acoustic attenuation of small tissue regions from reflected ultrasound. Proc. IEEE. 1985;73(7):1159–1168. [Google Scholar]
- 34.Li Y, Zagzebski JA. A frequency domain model for generating B-mode images with array transducers. IEEE Trans. Ultrason. Ferroelectr. Freq. Control. 1999;46(3):690–699. doi: 10.1109/58.764855. [DOI] [PubMed] [Google Scholar]
- 35.Labyed Y, Bigelow TA. Estimating the total ultrasound attenuation along the propagation path by using a reference phantom. J. Acoust. Soc. Am. 2010;128(5):3232–3238. doi: 10.1121/1.3483739. [DOI] [PMC free article] [PubMed] [Google Scholar]
- 36.Zagzebski J, Lu Z, Yao L. Quantitative ultrasound imaging: In vivo results in normal liver. Ultrason. Imaging. 1993;15(4):335–351. doi: 10.1177/016173469301500405. [DOI] [PubMed] [Google Scholar]
- 37.Omari EA, Varghese T. Signal to noise ratio comparisons for ultrasound attenuation slope estimation algorithms. Med. Phys. 2014;41(3) doi: 10.1118/1.4865781. art. no. 032902. [DOI] [PMC free article] [PubMed] [Google Scholar]


