Abstract
Epithelial-to-mesenchymal transition (EMT) is implicated in embryonic development and various pathological events. Transforming growth factor beta (TGFβ) has been reported to induce EMT in tumor cells, which is a critical step in the process of metastasis leading to cancer spreading and treatment failure. However, the involvement of microRNA during the EMT process in tongue squamous cell carcinoma (TSCC) remains to be determined. To address this question, TSCC cell lines SCC9 and CAL27 were treated with human recombinant TGFβ1 for 48 h. miRNA microarray illustrated that miR-639 was significantly downregulated in TGFβ-treated SCC9 cells. Ectopic expression of miR-639 with miRNA mimics effectively blocked TGFβ-induced EMT in SCC9 and CAL27 cells, but inhibition of miR-639 in SCC9 and CAL27 cells with antisense oligonucleotides induced EMT. Computational microRNA target predictions detected a conserved sequence matching to the seed region of miR-639 in the 3′-UTR of FOXC1 mRNA. Luciferase reporter assays revealed that miR-639 targets FOXC1. Ectopic expression of FOXC1 induces EMT in TSCC cells. Silencing FOXC1 expression blocked TGFβ-induced EMT in SCC9 cells. Clinically, reduced miR-639 expression was associated with metastasis in TSCC and poor patient survival. The data from the present study suggest that reduced expression of miR-639 underscores the mechanism of TGFβ-induced EMT in TSCC by targeting FOXC1 and may serve as therapeutic targets in the process of metastasis.
Keywords: Epithelial-to-mesenchymal transition, FOXC1, miR-639, tongue squamous cell carcinoma, transforming growth factor beta
Tongue squamous cell carcinoma (TSCC) is the most common oral cancer, which frequently leads to lymph node and distant metastasis, and metastasis is the most reliable adverse prognostic factor in TSCC patients.1,2 Previous studies in pancreatic, breast and colorectal cancer have demonstrated that tumor metastasis is associated with epithelial–mesenchymal transition (EMT).3–5 During EMT, epithelial cells detach from neighboring cells and acquire an elongated, mesenchymal-like morphology.6 Recent advances have fostered a more detailed understanding of molecular mechanisms and networks governing EMT in tumor progression.7 The signaling pathways include those triggered by different members of the transforming growth factor beta (TGFβ) superfamily, Wnts, Notch, EGF, HGF, FGF and many others,8–11 and those transcription factors include HIF, Snail, Slug, Twist, ZEB1, ZEB2/SIP1 and NF-κB.12–17 However, whether miRNA are involved in regulating TGFβ-induced EMT in TSCC remains obscure.
MicroRNA (miRNA) are a class of small, single-stranded, non-coding RNA molecules of ∼22 nucleotides in length, which regulate gene expression at the post-transcriptional level by base pairing to the 3′-untranslated region (UTR) of target mRNA.18 Binding of miRNA to its target mRNA could suppress translation or induce direct degradation.19 Growing evidence indicates that miRNA are involved in the modulating multiple cellular pathways, such as cellular proliferation, differentiation, apoptosis and EMT.20 MiR-200b and miR-15b regulate chemotherapy-induced EMT in human tongue cancer cells by targeting BMI1.21 More interestingly, a recent study has shown that miR-200b inhibits TGFβ-induced EMT and promotes growth of intestinal epithelial cells.
In the present study, we used high-throughput profiling of miRNA expression to screen the differentially expressed microRNA between SCC9 and TGFβ-treated SCC9 cells and identified that miR-639 was significantly downregulated. We then explored the role of miR-639 in TGFβ-induced EMT. Last, we correlated the expression of miR-639 and FOXC1 with the clinicopathological status and prognosis of TSCC patients.
Materials and Methods
Cell culture
Human tongue cancer cell lines SCC9 and CAL27 were purchased from the ATCC, Manassas, VA, USA. Human recombinant TGFβ1 (5 ng/mL; R&D Systems, Minneapolis, MN, USA) was used to treat SCC9 and CAL27 cells for 48 h. The SCC9 cells were cultivated in DMEM-F12 (Gibco, Rockville, MD, USA) supplemented with 10% FBS (Invitrogen, Carlsbad, CA, USA). CAL27 cells were cultivated in DMEM (Gibco, Rockville, MD, USA) supplemented with 10% FBS.
miRNA microarray analysis
Microarray analysis was performed by Kangcheng Bio-tech Inc. (Shanghai, China). Briefly, total RNA was extracted from cells using Trizol reagent. Total RNA (5 μg) was labelled by Hy3 fluorescence using a miRURYTM Array Labelling kit (Exiqon, Vedbaek, Denmark) and then concentrated using an RNeasy Mini Kit (Qiagen, Valencia, CA, USA). The miRNA microarray hybridization was performed in a Hybridization Chamber II (Corning, Ambion, TX, USA) using the miRCURYTM Array microarray kit (Exiqon). After hybridization, the miRNA array was processed using a Genepix 4000B scanner (Molecular Devices, Downingtown, PA, USA). Data analysis was performed using Genepix Pro 6.0 (Molecular Devices). The miRNA microarray data were quantified by the absolute fluorescence intensity of a spot divided by the median fluorescence intensity of all spots and normalized against the internal control U6 gene. The differentially expressed microRNA are listed in Table S1.
Transfection
All miRNA mimics, miRNA antisense oligonucleotides (ASO) and FOXC1 siRNA were obtained from GenePharma (Shanghai, China). Cells were transfected with 50 nM miRNA mimics, ASO or siRNA using Lipofectamine 2000 (Invitrogen). In experiments with combined transfection and TGFβ1 treatments, we transfected TSCC cells with miRNA mimics or siRNA for 12 h before TGFβ1 treatment. We started qPCR, western blotting, immunofluorescence staining and chamber assay after the 48 h treatment of TGFβ1.
Quantitative RT-PCR
Real-time PCR was carried out using a LightCycler 480 (Roche, Basel, Switzerland). Reactions were run in triplicate in three independent experiments. The relative expression of E-cadherin, vimentin, snail and FOXC1 were normalized to β-actin. QRT-PCR for miR-639 was performed using real-time PCR Universal Reagent (RIBOBIO, Guangzhou, Guangdong Province, China). U6 was used as an internal control. All relative expressions in the control were set to 1.
Western blotting
The protein extracts were resolved using 10% SDS-polyacrylamide gel electrophoresis and transferred to polyvinylidene difluoride membranes (BioRad, Berkeley, CA, USA), probed with antibody against human E-cadherin, vimentin, snail (Cell Signaling Technology, Boston, MA, USA), FOXC1 (Abcam, Cambridge, MA, USA) or β-actin (Proteintech, Chicago, IL, USA) and then with peroxidase-conjugated secondary antibody (Proteintech), and visualized using chemiluminescence (GE, Fairfield, CT, USA).
Migration and invasion assays
Migration and invasion assays were performed using transwell chambers (8 μm pore size; Corning). Cells (1 × 10⁵) in serum-free medium were seeded into the upper chamber. For the invasion assay, the top chamber was precoated with 1.37 mg/mL Matrigel. Medium supplemented with 10% FBS was added to the lower chamber as chemoattractant. After incubation for 12 h, cells remaining on the top layer were removed with a cotton swab. Cells on the bottom of the membrane were fixed with 4% paraformaldehyde and stained with 0.05% crystal violet. The stained cells were counted in 10 random fields under a microscope (original magnification, ×100). Three independent experiments were performed and the data are presented as the average ± SD.
Immunofluorescence staining
Cells were stained for immunofluorescence on coverslips. After fixation and permeabilization, the cells were incubated with primary antibodies against E-cadherin, Vimentin and then incubated with rhodamine-conjugated or FITC-conjugated secondary antibodies (Invitrogen). The coverslips were counterstained with 46-diamidino-2-phenyl indole and imaged under a confocal microscope TCS SP5 (Lecia, Solms, Germany).
Luciferase reporter assay
We cloned the miR-639 response element (wild type or mutated) in the 3′-UTR of FOXC1 into psiCHECK-2 plasmid downstream of the luciferase reporter gene. Luciferase activities were assayed using a luciferase assay kit (Promega, Madison, WI, USA) and the target effect was expressed as relative luciferase activity of the reporter vector with a target sequence over the one without a target sequence.
Patients and tissue samples
Primary tongue carcinomas were obtained from 92 patients, who were admitted to the Department of Oral and Maxillofacial Surgery of the Sun Yat-sen Memorial Hospital, Sun Yat-sen University, from June 2007 to 2008 (Table1). All patients recruited into the present study did not receive radiotherapy or chemotherapy or any other treatment before and after operation, following a protocol approved by the ethics committee. All samples were collected with informed consent. The pathological sections for in situ hybridization and immunohistochemical assay were collected during surgery.
Table 1.
Correlation among clinicopathological status and the expression of miR-639 and Foxc1 in tongue squamous cell carcinoma patients
| Characteristic | miR-639 (%) | P | Foxc1 (%) | P | ||
|---|---|---|---|---|---|---|
| No. low/− expression | No. high expression | No. low/− expression | No. high expression | |||
| Sex | ||||||
| Male | 30 (54.5) | 25 (45.5) | 0.579 | 27 (42.5) | 28 (57.5) | 0.767 |
| Female | 18 (48.6) | 19 (51.4) | 17 (54.3) | 20 (45.7) | ||
| Age (years) | ||||||
| <50 | 21 (53.8) | 18 (46.2) | 0.783 | 15 (38.2) | 24 (61.8) | 0.123 |
| ≥50 | 27 (50.9) | 26 (49.1) | 29 (56.1) | 24 (43.9) | ||
| Metastasis | ||||||
| N0 | 19 (39.6) | 29 (60.4) | 0.012 | 28 (59.5) | 20 (40.5) | 0.035 |
| N1–N2 | 29 (65.9) | 15 (34.1) | 16 (33.3) | 28 (66.7) | ||
| Clinical stage | ||||||
| I–II | 14 (35.0) | 26 (65.0) | 0.004 | 24 (43.2) | 16 (56.8) | 0.040 |
| III–IV | 34 (65.4) | 18 (34.6) | 20 (54.8) | 32 (45.2) | ||
| Status | ||||||
| Survival | 21 (41.2) | 30 (58.8) | 0.019 | 31 (64.3) | 20 (35.7) | 0.006 |
| Death | 27 (65.9) | 14 (34.1) | 13 (27.3) | 28 (72.7) | ||
In situ hybridization
This assay was performed according to the manufacturer's protocol (Exiqon). Briefly, after demasking, microRNA was hybridized to 3′ and 5′-DIG-labeled LNA probes. The digoxigenins were then recognized by a specific anti-DIG antibody that is directly conjugated with alkaline phosphatase. The nuclei were counterstained with nuclear fast red. A total of 5 × 200 tumor cells were counted randomly in each section. High expression, positive cells ≥30%; low expression, positive cells <30%.21
Immunohistochemistry
For immunohistochemistry, TGFβ1 and FOXC1 antibodies were used for overnight incubation at 4°C. The sections were then treated with secondary antibody, followed by further incubation with streptavidin–horseradish–peroxidase complex. Diaminobenzidine (Dako, Carpinteria, CA, USA) was used as a chromogen and the nuclei were counterstained with haematoxylin. Tumor cells (5 × 200) were counted in each section. High expression, positive cells ≥35%; low expression, positive cells <35%.21
Statistics
All statistical analyses were performed using SPSS 17.0 (SPSS Inc, Chicago, IL, USA). The χ2 test was used to analyze the relationship between miR-639 or FOXC1 expression and clinicopathological characteristics. To measure the association between pairs of variables, Spearman order correlations were run. Kaplan–Meier survival curves were plotted and the log-rank test was performed. All experiments for cell cultures were performed at least in triplicate. Results were expressed as mean ± SD. P < 0.05 was considered statistically significant.
Results
TGFβ-treated SCC9 and CAL27 cells have undergone EMT
We treated SCC9 and CAL27 with human recombinant TGFβ1 (5 ng/mL) for 48 h. SCC9 and CAL27 cells grew in clusters and were round in shape with tight cell–cell junctions, while SCC9 (TGFβ) and CAL27 (TGFβ) cells displayed a spindle shape and were separated from one other (Fig.1a). Moreover, quantitative RT-PCR (qRT-PCR) demonstrated that E-cadherin mRNA was reduced 3.5-fold (P < 0.001), while that of vimentin was increased 12-fold (P < 0.001) in SCC9 (TGFβ) cells, respectively. A similar observation was achieved in CAL27 (TGFβ) (Fig. S1a). Additionally, immunofluorescence staining (Fig.1a) and western blotting (Fig.1b) demonstrated that the protein expression of E-cadherin decreased, while that of vimentin dramatically increased in TGFβ-induced cells.
Figure 1.
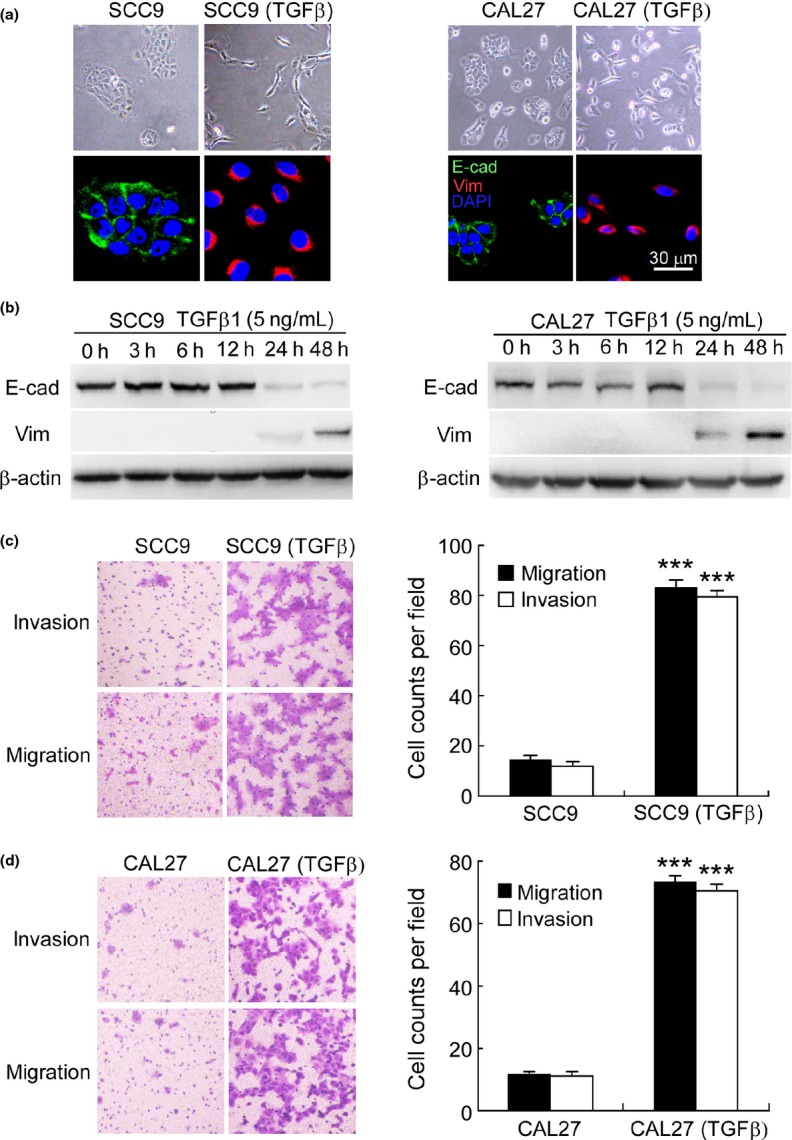
Transforming growth factor beta (TGFβ)-treated SCC9 and CAL27 cells have undergone epithelial-to-mesenchymal transition (EMT). (a) Phase contrast image and immunofluorescence staining, and (b) western blotting illustrated reduced expression of E-cadherin (E-cad) and increased expression of vimentin (Vim) when SCC9 and CAL27 were treated with human recombinant TGFβ1 (5 ng/mL) for 48 h. β-actin was used as an internal control. Nuclei are shown in blue. Bar, 30 μm. (c,d) Modified Boyden chamber assays demonstrated enhanced invasion and migration of SCC9 (TGFβ) and CAL27 (TGFβ) cells (original magnification, ×100). SCC9 (TGFβ), SCC9 cells treated with TGFβ1 (5 ng/mL) for 48 h; CAL27 (TGFβ), CAL27 cells treated with TGFβ1 (5 ng/mL) for 48 h. ***P < 0.001.
Furthermore, we examined the invasion and migration of TGFβ-induced cells using Boyden chamber assays. After 12 h of culture, the invasion and migration increased 6.9–5.8- and 6.4–6.4-fold in SCC9 (TGFβ) (Fig.1c) and CAL27 (TGFβ) cells (Fig.1d), respectively. Taken together, our observation indicates that TGFβ-treated SCC9 and CAL27 cells have undergone EMT with enhanced invasiveness and motility.
miR-639 regulates TGFβ-induced EMT in TSCC cells
To screen for miRNA that are involved in the underlying mechanisms of TGFβ-induced EMT, we used a miRNA microarray. A marked difference in expression was observed between SCC9 (TGFβ) cells and SCC9 cells, including 14 upregulated and 12 downregulated miRNA. Among them, miR-639 and miR-1200 were the most remarkably downregulated microRNA in SCC9 (TGFβ) cells (Table S1). However, ectopic expression of miR-1200 could not suppress TGFβ-induced downregulation of E-cadherin, as well as TGFβ-induced invasion and migration of SCC9 (TGFβ) cells (Fig. S2). We then focused on the function of miR-639. QRT-PCR validated that miR-639 was reduced by 72% in SCC9 (TGFβ) cells versus SCC9 cells. Transfection of the SCC9 cells with miR-639 mimics before TGFβ treatment but not the non-relevant miRNA mimics specifically increased the miR-639 level (Fig.2a).
Figure 2.
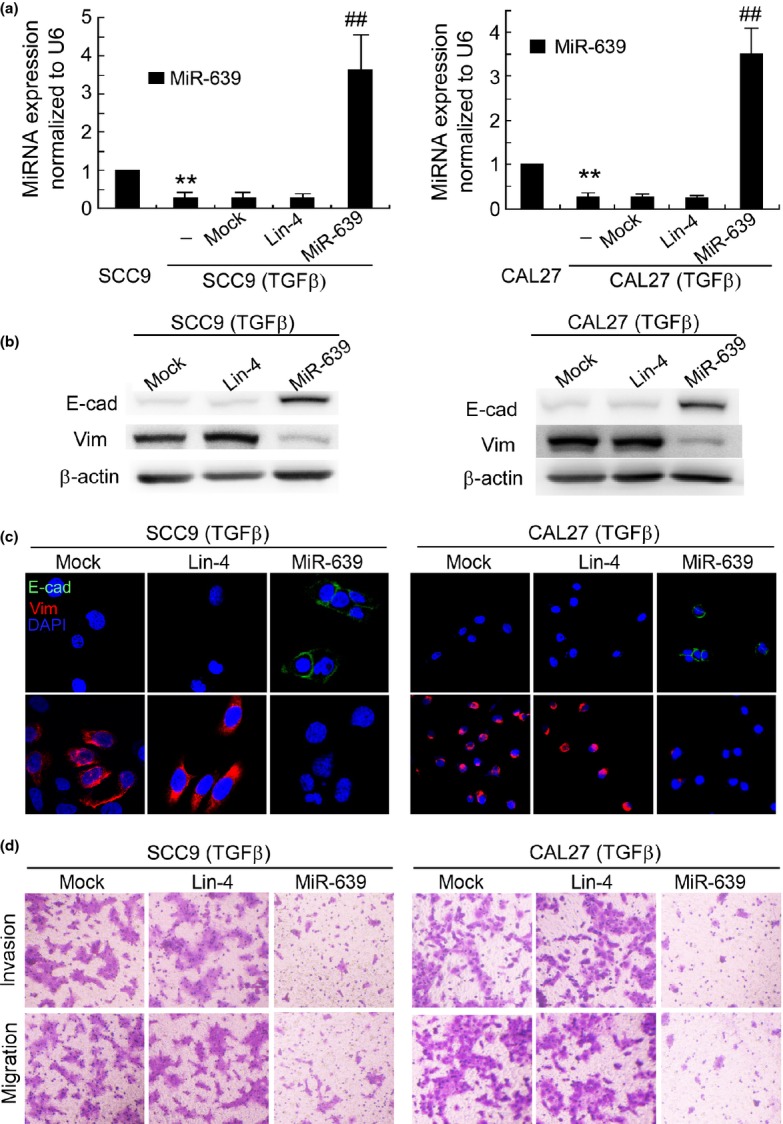
Ectopic expression of miR-639 suppresses transforming growth factor beta (TGFβ)-induced epithelial-to-mesenchymal transition (EMT) in SCC9 and CAL27 cells. (a) miR-639 expression in the parental and TGFβ-treated tongue squamous cell carcinoma (TSCC) cells was determined using qRT-PCR. **P < 0.01 versus SCC9 or CAL27 cells. ##P < 0.01 versus mock transfection. (b) Western blotting and (c) immunofluorescence staining demonstrated that transfection with miR-639 mimics before TGFβ treatment increased E-cadherin (E-cad) expression and reduced the expression of vimentin (Vim) in SCC9 (TGFβ) and CAL27 (TGFβ) cells. β-actin was used as an internal control. Nuclei are shown in blue. Bar, 30 μm. (d) Modified Boyden chamber assays showed that the invasion and migration of SCC9 (TGFβ) and CAL27 (TGFβ) cells were suppressed by miR-639 mimics (original magnification, ×100).
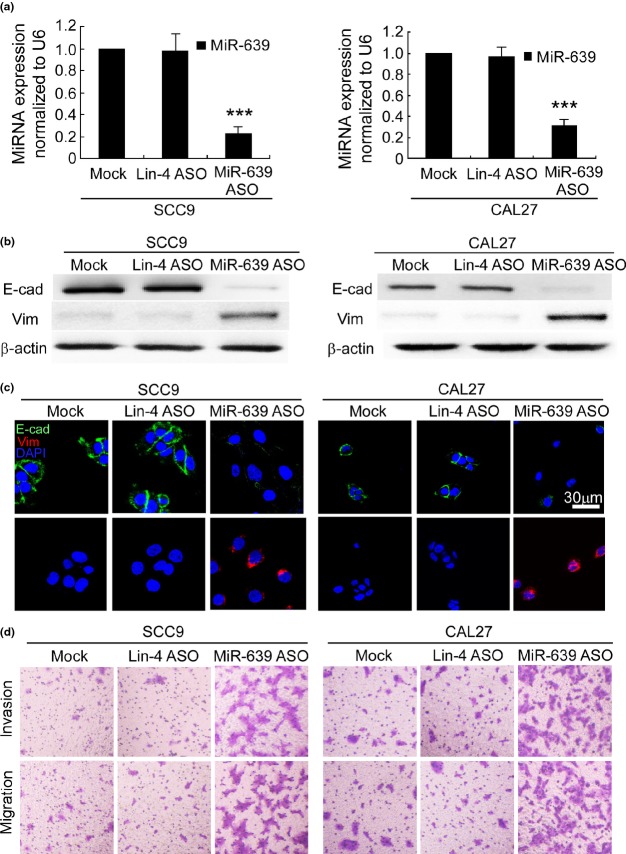
Next we investigated whether ectopic expression of miR-639 suppresses TGFβ-induced EMT in TSCC cells. MiR-639 mimics inhibited TGFβ-induced downregulation of E-cadherin, as well as TGFβ-induced upregulation of vimentin in SCC9 (TGFβ) cells, as shown by western blotting (Fig.2b) and immunofluorescence staining (Fig.2c). A similar observation was achieved in CAL27 (TGFβ) cells. A modified Boyden chamber assay demonstrated that the invasion and migration of SCC9 (TGFβ) and CAL27 (TGFβ) cells were suppressed by miR-639 mimics (Fig.2d). In contrast, silencing miR-639 expression using antisense oligonucleotides (Fig.3a) reduced E-cadherin expression and increased vimentin expression in SCC9 and CAL27 cells (Fig.3b,c). Furthermore, miR-639 ASO enhanced the invasion and migration of SCC9 and CAL27 cells (Figs3d,S1b). Therefore, miR-639 regulates TGFβ-induced EMT in TSCC cells.
Figure 3.
Reduction of miR-639 induces epithelial-to-mesenchymal transition (EMT) in SCC9 and CAL27 cells. (a) qRT-PCR demonstrated that miR-639 antisense oligonucleotides (ASO) specifically reduced miR-639 expression in SCC9 and CAL27 cells. ***P < 0.001 versus mock transfection. (b) Western blotting and (c) immunofluorescence staining demonstrated that transfection with miR-639 ASO reduced E-cadherin (E-cad) expression and enhanced the expression of vimentin (Vim) in SCC9 and CAL27 cells. β-actin was used as an internal control. Nuclei are shown in blue. Bar, 30 μm. (d) Modified Boyden chamber assays illustrate that transfection with miR-639 ASO enhance the invasion and migration of SCC9 and CAL27 (original magnification, ×100).
miR-639 regulates TGFβ-induced EMT of TSCC cells by targeting FOXC1
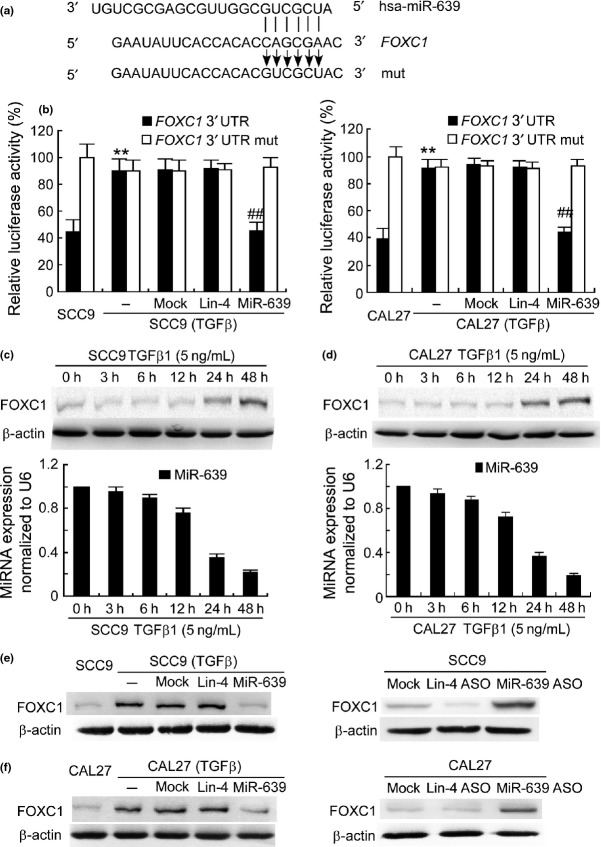
miRNA exerts its function by binding to the 3′-UTR of target genes through partial sequence homology. We predicted target genes of miR-639 with TargetScan (Release 6.2, Whitehead Institute for Biomedical Research, Cambridge, MA, USA) and found a miR-639 recognition site in the 3′-UTR of FOXC1 (Fig.4a). FOXC1 is a member of the forkhead box transcription factor family and plays an important role in metastasis of several human cancers.22–25 To investigate whether miR-639 targets to FOXC1 in TSCC cells, we conducted a luciferase reporter assay by evaluating the relative luciferase activities in the cells transfected with a reporter plasmid carrying the miR-639 target sequence (FOXC1 3′-UTR) versus those transfected with a control plasmid. To no surprise, relative luciferase activity in SCC9 cells with normal miR-639 expression was approximately 41%, while the one in the TGFβ-treated SCC9 cells with low miR-639 expression was 91%, respectively (Fig.4b). Transfection with miR-639 mimics significantly reduced the luciferase activity in SCC9 (TGFβ) cells. However, when the miRNA targeting sequence was mutated (FOXC1 3′-UTR mut) in the reporter plasmids, transfection with miR-639 mimics did not influence the relative luciferase activity. Similar results were obtained in CAL27 cells (Fig.4b). Furthermore, western blotting and qPCR showed that FOXC1 expression increased gradually and miR-639 expression decreased gradually as the TGFβ1 treatment time increases. FOXC1 expression was reversely correlated with the miR-639 level (Fig.4c,d). FOXC1 expression in TGFβ-treated SCC9 and CAL27 cells was much higher than that in the parent lines. Transfection with miR-639 mimics reduced FOXC1 expression in SCC9 (TGFβ) and CAL27 (TGFβ) cells, whereas miR-639 ASO enhanced FOXC1 expression in the SCC9 and CAL27 cells (Fig.4e,f).
Figure 4.
miR-639 targets to FOXC1 3′-untranslated region (UTR). (a) Target sequence of miR-639 in FOXC1 3′-UTR predicted by TargetScan and mutation of the sequence. (b) Luciferase assay was performed in transforming growth factor beta (TGFβ)-treated SCC9 and CAL27 cells that were co-transfected with miRNA mimics and reporter vectors carrying FOXC1 3′-UTR with a wild-type (FOXC1 3′-UTR) or mutated miR-639 response element (FOXC1 3′-UTR mut). **P < 0.01 versus parental tongue squamous cell carcinoma cells. ##P < 0.01 versus mock transfection. (c,d) FOXC1 and miR-639 expressions in SCC9 and CAL27 cells following TGFβ1 stimulation were determined using western blotting and qPCR. (e,f) FOXC1 protein expression was determined in SCC9 (TGFβ) or CAL27 (TGFβ) cells that were transfected with miRNA mimics and in SCC9 or CAL27 cells transfected with miRNA ASO. β-actin was used as an internal control.
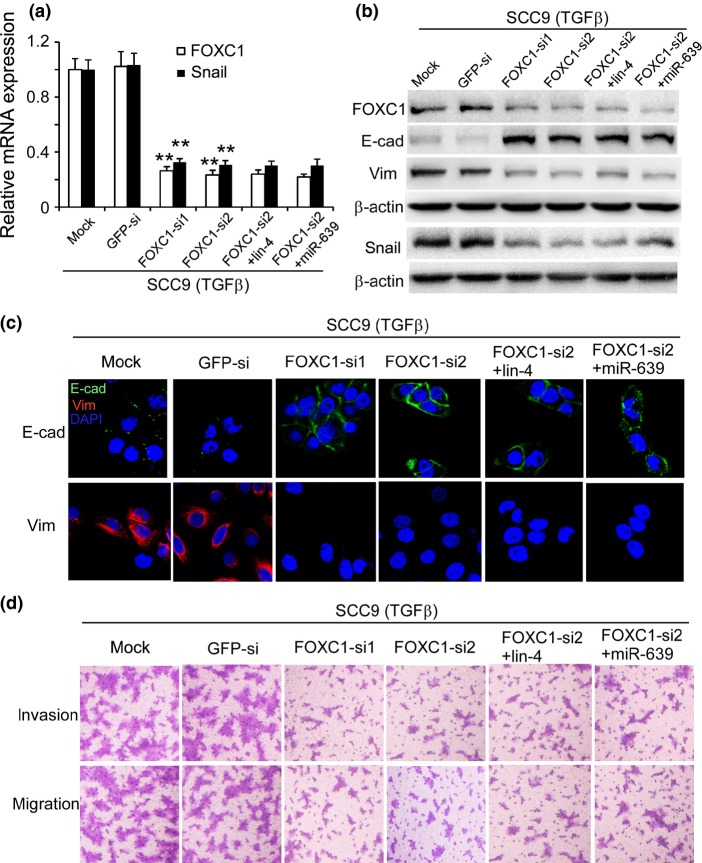
It has been reported that FOXC1 induces EMT in SMMC7721 cells. FOXC1 transactivates Snail expression by directly binding to the Snail promoter, thereby leading to the inhibition of E-cadherin transcription.26 We improved FOXC1 expression by transfecting TSCC cells with pcDNA3.1-FOXC1 and found that FOXC1 induced EMT in the TSCC cells (Fig. S3). The TSCC cells with high FOXC1 expression displayed a spindle shape. E-cadherin expression was reduced, while snail and vimentin expressions were increased in these cells. Furthermore, we silenced FOXC1 expression using RNA interference in SCC9 cells before TGFβ treatment (Fig.5a,b). Similar to miR-639 mimics, transfection with FOXC1-siRNA suppressed TGFβ-induced EMT in SCC9 cells. E-cadherin expression was increased and vimentin and snail expressions were reduced after FOXC1 was silenced (Fig.5a–c). These results indicate that FOXC1 might induce EMT in tongue cancer cells by transactivating snail expression. In addition, silencing FOXC1 expression reduced the invasion and migration of SCC9 (TGFβ) cells (Figs5d,S1c). Interestingly, the effect of FOXC1-siRNA alone to suppress TGFβ-induced EMT in SCC9 cells is comparable with that of the combined treatment with FOXC1-siRNA and miR-639 mimics, implying that miR-639 regulates EMT in TSCC cells via silencing FOXC1.
Figure 5.
Silencing FOXC1 expression suppressed transforming growth factor beta (TGFβ)-induced epithelial-to-mesenchymal transition (EMT) in SCC9 cells. (a) FOXC1 and snail mRNA expressions were demonstrated using qPCR. **P < 0.01 versus mock transfection. (b) Western blotting and (c) immunofluorescence staining illustrated that E-cadherin (E-cad) expression was increased and vimentin (Vim) and snail expressions were reduced when transfected with FOXC1-siRNA. β-actin was used as an internal control. Nuclei are shown in blue. Bar, 30 μm. (d) Modified Boyden chamber assays demonstrated reduced invasion and migration of SCC9 (TGFβ) cells (original magnification, ×100).
Low expression of miR-639 in TSCC is associated with lymph node metastasis and poor patient prognosis
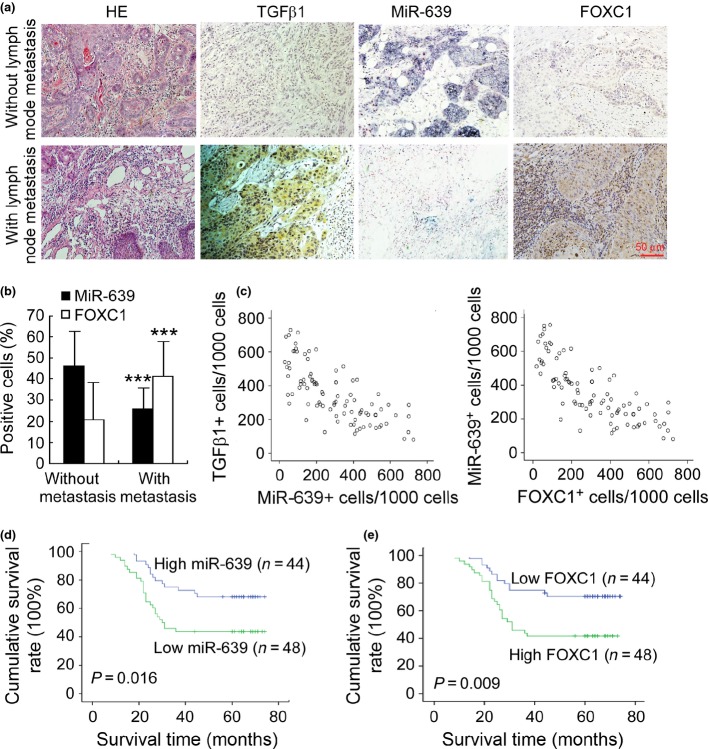
We further evaluated the clinical significance of miR-639 in metastasis and patient prognosis of TSCC. In situ hybridization and immunohistochemical staining (Fig.6a) demonstrated that miR-639 was lower and TGFβ1 and FOXC1 were higher in TSCC with lymph node metastasis compared with TSCC without lymph node metastasis. The expression difference between TSCC determined by the percentage of positive cells was statistically significant (Fig.6b). In addition, Spearman order correlation analysis showed that miR-639 expression in TSCC was reversely correlated with the TGFβ1 level (Fig.6c; rs = −0.453, P < 0.001) and FOXC1 expression was reversely correlated with the miR-639 level (Fig.6c; rs = −0.826, P < 0.001). We then analyzed the association of miR-639 and FOXC1 expression with the clinicopathological status of TSCC patients (Table1). No significant correlation was observed between miR-639 expression and age or sex. However, the miR-639 level was closely associated with lymph node metastasis, clinical stage and the survival of patients. Tumors with lymph node metastasis or high clinical stage expressed a low level of miR-639, suggesting that miR-639 downregulation was associated with tumor progression. In contrast, FOXC1 expression was positively correlated with lymph node metastasis and the clinical stage of TSCC.
Figure 6.
Downregulation of miR-639 correlates with lymph node metastasis and poor patient prognosis. (a) In situ hybridization for miR-639 and immunohistochemical staining for TGFβ1 and FOXC1 were demonstrated in tongue squamous cell carcinomas (TSCC) with lymph node metastasis compared with TSCC without lymph node metastasis (original magnification, ×200). (b) Quantification of miR-639 and FOXC1 expression in TSCC with lymph node metastasis compared with TSCC without lymph node metastasis. ***P < 0.001. (c) Associations between TGFβ1 expression and miR-639 expression, and miR-639 expression and FOXC1 expression in TSCC were analyzed with Spearman order correlation. Kaplan–Meier survival curves for TSCC patients are plotted on miR-639 expression (d) or FOXC1 expression (e), and the survival difference was analyzed using the log-rank test.
Furthermore, we evaluated the correlation between miRNA expression and the survival of patients. Patients with high expression of miR-639 in tumors survived significantly longer than those with low miR-639 expression in tumors (Fig.6d; P = 0.016). The cumulative survival rate up to 60 months was 63.6% in patients with high miR-639 expression, but was only 33.4% in those with low miR-639 expression. In contrast, low FOXC1 expression was associated with better survival (Fig.6e; P = 0.009). These data suggest that miR-639 expression is inversely correlated with tumor staging and may play a role in the progression of TSCC.
Discussion
Dysregulation of miRNA has been well documented in nearly all types of human malignancies, and numerous miRNA are involved in tumor formation and progression by regulating the expression and action of many oncogenes and tumor suppressor genes. In the present study, we identified FOXC1 as the functional target gene through which miR-639 regulates EMT. FOXC1 is a member of the forkhead box transcription factor family, which plays an important role in cell proliferation, apoptosis and differentiation, and correlates with the invasion and metastasis of several human cancers.23–26 Recent studies have demonstrated that FOXC1 is transcriptionally upregulated in response to TGFβ in several human cancer cell lines.27 FOXC1 is an effector of TGFβ and mediates cell growth inhibition.27 Upregulation of FOXC1 in SMMC7721 cells resulted in decreased expression of epithelial markers (E-cadherin and β-catenin) and increased expression of mesenchymal markers.22 Nevertheless, because one single miRNA might have multiple targets, judicious considerations are essential for identification of the main functional target. At present, our results indicate that miR-639 regulated TGFβ-induced EMT in TSCC cells mainly via silencing FOXC1.
Metastasis is a major issue of treatment in the majority of human tumors, including TSCC. It has been known that the EMT process promotes invasion and migration of cancer cells and the TGFβ-treated cancer cells undergo EMT. Thus, detecting rationale biomarkers to predict metastasis and screening for targets to overcome TGFβ-induced EMT is significant for cancer therapy. As ideal biomarkers should be stable in patient samples to be examined, microRNA have the advantage for they are relatively more stable compared with other biological macromolecules. They can be well preserved in tissue samples even after formalin fixation and paraffin embedding, and can be efficiently extracted and evaluated.28 In contrast, the development of cancers involves alteration of multiple gene expression, in which a single protein product of oncogene may not accurately reflect the status of the disease. However, microRNA may regulate multiple coding genes and thus is more likely to predict metastasis precisely and effectively. Herein, our observation that reduced miR-639 expression in clinical TSCC samples is associated with metastasis and poor patient prognosis.
Our findings demonstrate that overexpression of miR-639 inhibited TGFβ-induced EMT in TSCC cells. Therefore, miR-639 mimics may provide a novel therapeutic strategy against EMT and metastasis. Many signaling pathways have been targeted to interfere with EMT, including the use of neutralizing antibodies against TGFβ,29 the inhibition of the Sonic Hedgehog-Gli-Snail pathway and RNA interference against transcription factors that induces EMT.30,31 In contrast to artificially synthetic siRNA, microRNA are endogenous molecules existing in normal cells, which may minimize their unexpected off-target silencing effects.32,33 Besides, as a microRNA molecule targets to a set of coding genes, rather than a single one, therapies based on microRNA interference could be more potent in cancer treatment by targeting multiple molecular pathways.
Last, we analyzed the promoter region of miR-639 by browsing the UCSC genome database (GRCh37/hg19 assembly) and found an E2F1 binding site in the promoter region according to the ENCODE ChIP-seq data. Previous studies have shown that TGFβ induces transcriptional repression of E2F1.34,35 Therefore, TGFβ might downregulate miR-639 via suppressing E2F1 expression.
In summary, the present study indicates that miR-639 is an effective inhibitor of TGFβ-induced EMT and provides a strong rationale for its potential use as a therapeutic target to suppress TGFβ-induced EMT in tongue cancers.
Acknowledgments
This work was supported by grants to: J.L. from the National Natural Science Foundation of China (81072225, 81272951), the Natural Science Foundation of Guangdong Province (10251008901000022), the Specialized Research Fund for the Doctoral Program of Higher Education of China (20110171110068) and the Science and Technology Project of Guangzhou City (11C22060035); W.C. from the National Natural Science Foundation of China (81172563) and the Natural Science Foundation of Guangdong Province (S2011010003979); and L.S. from the National Natural Science Foundation of China (81302369) and the Fundamental Research Funds for the Central Universities (13ykpy27).
Disclosure Statement
The authors have no conflict of interest.
Supporting Information
Fig. S1. qRT-PCR of mRNA expression and quantification of invasive and migratory cells assessed using modified Boyden chamber assays.
Fig. S2. Reduction of miR-1200 is not responsible for TGFβ-induced EMT in TSCC cells.
Fig. S3. Ectopic expression of FOXC1 induces EMT in TSCC cells.
Table S1. Differentially expressed microRNA between SCC9 (TGFβ) and SCC9 cells.
References
- Sano D, Myers JN. Metastasis of squamous cell carcinoma of the oral tongue. Cancer Metastasis Rev. 2007;26:645–62. doi: 10.1007/s10555-007-9082-y. [DOI] [PubMed] [Google Scholar]
- Siegel R, Naishadham D, Jemal A. Cancer statistics, 2012. CA Cancer J Clin. 2012;62:10–29. doi: 10.3322/caac.20138. [DOI] [PubMed] [Google Scholar]
- Yamada S, Fuchs BC, Fujii T, et al. Epithelial-to-mesenchymal transition predicts prognosis of pancreatic cancer. Surgery. 2013;154:946–54. doi: 10.1016/j.surg.2013.05.004. [DOI] [PubMed] [Google Scholar]
- Moon HJ, Finney J, Xu L, Moore D, Welch DR, Mure M. MCF-7 cells expressing nuclear associated lysyl oxidase-like 2 (LOXL2) exhibit an epithelial-to-mesenchymal transition (EMT) phenotype and are highly invasive in vitro. J Biol Chem. 2013;288:30000–8. doi: 10.1074/jbc.C113.502310. [DOI] [PMC free article] [PubMed] [Google Scholar]
- Liu R, Li J, Xie K, et al. FGFR4 promotes stroma-induced epithelial-to- mesenchymal transition in colorectal cancer. Cancer Res. 2013;73:5926–35. doi: 10.1158/0008-5472.CAN-12-4718. [DOI] [PubMed] [Google Scholar]
- Chen Y, Xiao Y, Ge W, et al. miR-200b inhibits TGF-β1-induced epithelial–mesenchymal transition and promotes growth of intestinal epithelial cells. Cell Death Dis. 2013;4:e541. doi: 10.1038/cddis.2013.22. [DOI] [PMC free article] [PubMed] [Google Scholar]
- Huber MA, Kraut N, Beug H. Molecular requirements for epithelial–mesenchymal transition during tumor progression. Curr Opin Cell Biol. 2005;17:548–58. doi: 10.1016/j.ceb.2005.08.001. [DOI] [PubMed] [Google Scholar]
- Chaudhury A, Hussey GS, Ray PS, Jin G, Fox PL, Howe PH. TGF-β-mediated phosphorylation of hnRNP E1 induces EMT via transcript-selective translational induction of Dab2 and ILEI. Nat Cell Biol. 2010;12:286–93. doi: 10.1038/ncb2029. [DOI] [PMC free article] [PubMed] [Google Scholar]
- Kalluri R, Weinberg RA. The basics of epithelial–mesenchymal transition. J Clin Invest. 2009;119:1420–8. doi: 10.1172/JCI39104. [DOI] [PMC free article] [PubMed] [Google Scholar]
- Shin SY, Rath O, Zebisch A, Choo SM, Kolch W, Cho KH. Functional roles of multiple feedback loops in extracellular signal-regulated kinase and Wnt signaling pathways that regulate epithelial–mesenchymal transition. Cancer Res. 2010;70:6715–24. doi: 10.1158/0008-5472.CAN-10-1377. [DOI] [PMC free article] [PubMed] [Google Scholar]
- Thiery JP, Acloque H, Huang RYJ, Nieto MA. Epithelial–mesenchymal transitions in development and disease. Cell. 2009;139:871–90. doi: 10.1016/j.cell.2009.11.007. [DOI] [PubMed] [Google Scholar]
- Huber MAAN, Baumann B, Grünert S, et al. NF-κB is essential for epithelial–mesenchymal transition and metastasis in a model of breast cancer progression. J Clin Invest. 2004;114:569–81. doi: 10.1172/JCI21358. [DOI] [PMC free article] [PubMed] [Google Scholar]
- Kudo-Saito C, Shirako H, Takeuchi T, Kawakami Y. Cancer metastasis is accelerated through immunosuppression during Snail-induced EMT of cancer cells. Cancer Cell. 2009;15:195–206. doi: 10.1016/j.ccr.2009.01.023. [DOI] [PubMed] [Google Scholar]
- Sánchez-Tilló E, Lázaro A, Torrent R, et al. ZEB1 represses E-cadherin and induces an EMT by recruiting the SWI/SNF chromatin-remodeling protein BRG1. Oncogene. 2010;29:3490–500. doi: 10.1038/onc.2010.102. [DOI] [PubMed] [Google Scholar]
- Vuoriluoto K, Haugen H, Kiviluoto S, et al. Vimentin regulates EMT induction by Slug and oncogenic H-Ras and migration by governing Axl expression in breast cancer. Oncogene. 2010;30:1436–48. doi: 10.1038/onc.2010.509. [DOI] [PubMed] [Google Scholar]
- Wellner U, Schubert J, Burk UC, et al. The EMT-activator ZEB1 promotes tumorigenicity by repressing stemness-inhibiting microRNAs. Nat Cell Biol. 2009;11:1487–95. doi: 10.1038/ncb1998. [DOI] [PubMed] [Google Scholar]
- Wu Y, Deng J, Rychahou PG, Qiu S, Evers BM, Zhou BP. Stabilization of Snail by NF-κB is required for inflammation-induced cell migration and invasion. Cancer Cell. 2009;15:416–28. doi: 10.1016/j.ccr.2009.03.016. [DOI] [PMC free article] [PubMed] [Google Scholar]
- Bartel DP. MicroRNAs: genomics, biogenesis, mechanism, and function. Cell. 2004;116:281–97. doi: 10.1016/s0092-8674(04)00045-5. [DOI] [PubMed] [Google Scholar]
- Engel BM, Hutvagner G. Principles and effects of microRNA-mediated post-transcriptional gene regulation. Oncogene. 2006;25:6163–9. doi: 10.1038/sj.onc.1209909. [DOI] [PubMed] [Google Scholar]
- Hwang HW, Mendell JT. MicroRNAs in cell proliferation, cell death, and tumorigenesis. Br J Cancer. 2006;94:776–80. doi: 10.1038/sj.bjc.6603023. [DOI] [PMC free article] [PubMed] [Google Scholar]
- Sun L, Yao Y, Liu B, et al. MiR-200b and miR-15b regulate chemotherapy-induced epithelial–mesenchymal transition in human tongue cancer cells by targeting BMI1. Oncogene. 2012;31:432–45. doi: 10.1038/onc.2011.263. [DOI] [PubMed] [Google Scholar]
- Du J, Li L, Ou Z, et al. FOXC1, a target of polycomb, inhibits metastasis of breast cancer cells. Breast Cancer Res Treat. 2012;131:65–73. doi: 10.1007/s10549-011-1396-3. [DOI] [PubMed] [Google Scholar]
- Xu ZY, Ding SM, Zhou L, et al. FOXC1 contributes to microvascular invasion in primary hepatocellular carcinoma via regulating epithelial–mesenchymal transition. Int J Biol Sci. 2012;8:1130–41. doi: 10.7150/ijbs.4769. [DOI] [PMC free article] [PubMed] [Google Scholar]
- Wei LX, Zhou RS, Xu HF, Wang JY, Yuan MH. High expression of FOXC1 is associated with poor clinical outcome in non-small cell lung cancer patients. Tumour Biol. 2013;34:941–6. doi: 10.1007/s13277-012-0629-3. [DOI] [PubMed] [Google Scholar]
- Wang L, Gu F, Liu CY, Wang RJ, Li J, Xu JY. High level of FOXC1 expression is associated with poor prognosis in pancreatic ductal adenocarcinoma. Tumour Biol. 2013;34:853–8. doi: 10.1007/s13277-012-0617-7. [DOI] [PubMed] [Google Scholar]
- Xia L, Huang W, Tian D, et al. Overexpression of forkhead box C1 promotes tumor metastasis and indicates poor prognosis in hepatocellular carcinoma. Hepatology. 2013;57:610–24. doi: 10.1002/hep.26029. [DOI] [PubMed] [Google Scholar]
- Zhou Y, Kato H, Asanoma K, et al. Identification of FOXC1 as a TGF-beta1 responsive gene and its involvement in negative regulation of cell growth. Genomics. 2002;80:465–72. [PubMed] [Google Scholar]
- Gilad S, Meiri E, Yogev Y, et al. Serum microRNAs are promising novel biomarkers. PLoS ONE. 2008;3:e3148. doi: 10.1371/journal.pone.0003148. [DOI] [PMC free article] [PubMed] [Google Scholar]
- Chua KN, Ma J, Thiery JP. Targeted therapies in control of EMT in carcinoma and fibrosis. Drug Discov Today. 2008;4:261–7. [Google Scholar]
- Shida T, Furuya M, Nikaido T, et al. Sonic Hedgehog-Gli1 signaling pathway might become an effective therapeutic target in gastrointestinal neuroendocrine carcinomas. Cancer Biol Ther. 2006;5:1530–8. doi: 10.4161/cbt.5.11.3458. [DOI] [PubMed] [Google Scholar]
- Feldmann G, Dhara S, Fendrich V, Bedja D, Beaty R, Mullendore M. Blockade of hedgehog signaling inhibits pancreatic cancer invasion and metastases: a new paradigm for combination therapy in solid cancers. Cancer Res. 2007;67:2187–96. doi: 10.1158/0008-5472.CAN-06-3281. [DOI] [PMC free article] [PubMed] [Google Scholar]
- Krutzfeldt J, Rajewsky N, Braich R, et al. Silencing of microRNAs in vivo with ‘antagomirs’. Nature. 2005;438:685–9. doi: 10.1038/nature04303. [DOI] [PubMed] [Google Scholar]
- Jeyaseelan K, Herath WB, Armugam A. MicroRNAs as therapeutic targets in human diseases. Expert Opin Ther Targets. 2007;11:1119–29. doi: 10.1517/14728222.11.8.1119. [DOI] [PubMed] [Google Scholar]
- Spender LC, Inman GJ. TGF-β induces growth arrest in Burkitt lymphoma cells via transcriptional repression of E2F-1. J Biol Chem. 2009;284:1435–42. doi: 10.1074/jbc.M808080200. [DOI] [PubMed] [Google Scholar]
- Petrocca F, Visone R, Onelli MR, et al. E2F1-regulated microRNAs impair TGFβ-dependent cell-cycle arrest and apoptosis in gastric cancer. Cancer Cell. 2008;13:272–86. doi: 10.1016/j.ccr.2008.02.013. [DOI] [PubMed] [Google Scholar]
Associated Data
This section collects any data citations, data availability statements, or supplementary materials included in this article.
Supplementary Materials
Fig. S1. qRT-PCR of mRNA expression and quantification of invasive and migratory cells assessed using modified Boyden chamber assays.
Fig. S2. Reduction of miR-1200 is not responsible for TGFβ-induced EMT in TSCC cells.
Fig. S3. Ectopic expression of FOXC1 induces EMT in TSCC cells.
Table S1. Differentially expressed microRNA between SCC9 (TGFβ) and SCC9 cells.


