

Abstract
Increased expression of galectin-1 (Gal-1) in carcinoma-associated fibroblasts (CAFs) has been reported to correlate with progression and prognosis in many cancers. However, rarely have reports sought to determine whether high Gal-1 expression in CAFs in gastric cancer is involved in the tumor process, and the specific mechanism by which it promotes the evolution of gastric cancer is still unknown. In this study, we cultured gastric cancer CAFs, which showed strong expression of Gal-1, and established a co-culture system of CAFs with gastric cancer cells. Specific siRNA and in vitro migration and invasion assays were used to explore the effects of the interaction between Gal-1 expression of CAFs and gastric cancer cells on cell migration and invasion. We found that the overexpression of Gal-1 in CAFs enhanced gastric cancer cell migration and invasion, and these stimulatory effects could be blocked by specific siRNA which reduced the Gal-1 expression level. A set of cancer invasion-associated genes were then chosen to identify the possible mechanism of Gal-1-induced cell invasion. Among these genes, integrin β1 expression in cancer cells was considered to be associated with Gal-1 expression. Pre-blocking of the integrin β1 expression in gastric cancer cells with siRNA could interrupt the invasion-promoting effect of CAFs with high Gal-1 expression. Furthermore, immunohistochemical assay confirmed a positive correlation between Gal-1 and integrin β1 expression. Our results showed that high expression of Gal-1 in CAFs might facilitate gastric cancer cell migration and invasion by upregulating integrin β1 expression in gastric cancer.
Keywords: Carcinoma-associated fibroblasts, Gal-1, gastric cancer, integrin β1, invasion
Gastric cancer is one of the most common cancers in the world and is the second-leading cause of cancer-related death worldwide with a particularly high frequency in China.(1,2) Despite significant advances in surgical treatment that have proven effective for gastric cancers, a poor prognosis remains due to recurrence in the form of lymphatic spread, blood-borne metastasis, or peritoneal dissemination.(3,4) Thus, the molecular pathogenesis of gastric cancer metastasis remains to be explored.
Substantial evidence indicates that the development and progression of cancer not only depends on genetic characteristics but also on interactions with a complex microenvironment, which includes the ECM, growth factors, cytokines, and a variety of non-tumor cell types, such as vascular-related cells, inflammatory cells, and fibroblasts. These features promote tumor progression and metastasis, resulting in a poor prognosis and greater resistance to therapy. The fibroblast is one of the most important cell types of the stroma in the microenvironment. It forms the basic architecture of the tissue, contributing to structural integrity and the main components of the ECM. In normal tissue, it carried out tissue repair under certain physiological conditions.(5) But, as one of the important stromal cells in solid tumors, carcinoma-associated fibroblasts (CAFs) differentiate into fibroblasts that express α-smooth muscle actin (α-SMA) and produce ECM proteins such as fibronectin, fibroblast activation protein (FAP), fibroblast secretory protein (FSP), and collagen.(6) They play prominent roles in promoting tumor growth and progression.(7–9) Carcinoma-associated fibroblasts have various effects on tumor progression, such as ECM degradation, release of soluble factors, regulation of tumor metabolism or tumor cell implantation, and promotion of cancer cell proliferation, migration, and metastasis.(10–13) Clinical observations have documented that the accumulation of large numbers of CAFs in tumor stroma accelerates progression and metastasis.(6,7,14,15) Thus, in-depth study of the mechanism by which CAFs contribute to tumor progression is necessary and targeting CAFs may be an adjuvant therapy that can improve clinical outcomes.
Galectins (Gals), formerly known as S-type lectins, belong to a family of carbohydrate-binding proteins with an affinity for β-galactosides and they mediate cell–cell or cell–extracellular component communication by binding to glycol-conjugated proteins on the cell surface.(16) Thus, they carry out a series of biological functions including tissue development and differentiation, regulation of immune responses, cell migration, apoptosis, and tumor progression.(17) So far, 15 Gals have been identified and are classified into three types: proto-type (Gal-1, -2, -5, -7, -10, -11, -13, -14, and -15), chimera-type (Gal-3), and tandem repeat-type (Gal-4, -6, -8, -9, and -12).(18,19) Galectin-1, the first protein in this family to be discovered, is a non-covalent dimer composed of subunits with one carbohydrate recognition domain and behaves as a monomer of 14.5 kDa that dimerizes under certain circumstances.
Increased Gal-1 expression had been reported in various tumor cells, CAFs, and capillary endothelial cells, and is involved in cell–cell and cell–matrix interactions.(20–23) Increased expression of Gal-1 in CAFs correlates with the progression and prognosis of many cancers, such as colon cancer, gastric cancer, and oral squamous cell carcinoma.(24–26) However, whether the increased expression of Gal-1 in CAFs affects tumor cell homeostasis, and the underlying molecular mechanism, is still unknown, especially in gastric cancer.
Rare reports have sought to determine whether high Gal-1 expression in CAFs in gastric cancer is involved in the tumor process or the specific mechanism by which it promotes the evolution of gastric cancer. Our study set out to isolate and culture gastric cancer CAFs and establish a co-culture system for CAFs with gastric cancer cell lines. We aimed to investigate whether high Gal-1 expression in CAFs has any impact on the invasive or migratory behavior of gastric cancer cells and to explore its molecular mechanisms.
Materials and Methods
Cell lines
Gastric cell lines (AGS, BGC-823, 7901) were from the Shanghai Institute of Digestive Surgery (Shanghai, China) and cultured in RPMI-1640 containing 10% FBS, 50 U/mL penicillin, and 50 μg/mL streptomycin.
Primary cultures of CAFs and normal associated fibroblasts
Both CAFs and normal associated fibroblasts (NAFs) were isolated from gastric tumor tissues and adjacent normal mucosal tissue, respectively, using enzyme digestion. Tissue samples were obtained from surgery patients without radiotherapy or chemotherapy, and then were cut into 1 × 1-mm pieces. The pieces were incubated in enzyme digestion buffer (250 U/mL collagenase type I, 0.5% hyaluronidase in RPMI-1640 medium), horizontal shaken at 100 rpm for 2 h at 37°C, centrifuged at 1000 g for 10 min, and the supernatant was carefully discarded. The cell pellet was washed three times with serum-free RPMI-1640 and resuspended in RPMI-1640 containing 20% FBS. Undigested pieces were filtered through a 200-mesh cell sieve, adjusted to approximately 5 × 10⁶ cells per 6-cm cell culture dish, and incubated at 37°C in a 5% CO2 incubator. All NGFs and CAFs were used at <10 passages.
Immunohistochemistry
The isolated NGFs and CAFs were further identified using ICC. Cells were seeded at 1 × 10⁵ on slides in 6-well plates. After the cells adhered, the medium was discarded and the slides harvested for ICC staining. The slides were blocked with 3% (v/v) H2O2 for 10 min and 10% (v/v) normal goat serum for 15 min at room temperature. Then the slides were incubated with vimentin, cytokeratin, α-SMA, FAP, FSP, fibronectin, and Gal-1 primary antibodies at 4°C overnight. The HRP-conjugated secondary antibody (Zhongshan Biotech, Beijing, China) and 3′-diaminobenzidine tetrahydrochloride were used to visualize signal development, and then the sections were counterstained with hematoxylin.
Small interfering RNA transfection
Galectin-1 siRNA-1 (sc-35441; Santa Cruz Biotechnology, Santa Cruz, CA, USA), Gal-1 siRNA-2 (SR302674; OriGene Technologies, Beijing, China), integrin β1 siRNA-1 (sc-35674; Santa Cruz Biotechnology), and integrin β1 siRNA-2 (sc-44310; Santa Cruz Biotechnology) mixed with transfection reagent (sc-29528; Santa Cruz Biotechnology) were used for transfection according to the manufacturer's instructions. To inhibit Gal-1 expression, CAFs in 6-well plates (2 × 10⁵ per well) were transfected with Gal-1 siRNA-1 and siRNA-2; and to block integrin β1, 2 × 10⁵ gastric cancer cells per well were transfected with integrin β1 siRNA-1 and siRNA-2. In both, scrambled siRNA (sc-37007; Santa Cruz Biotechnology) was transfected as a negative control. After 24 h, cells were collected for experiments.
In vitro cell migration and invasion assays
In migration assays, 1 × 10⁵ gastric cancer cells (BGC-823, 7901, and AGS) were plated (in triplicate) in the top chamber of a Transwell (3422; Millipore, Billerica, MA, USA) with a membrane containing 8-μm pores in 200 μL serum-free RPMI-1640. The inserts were then placed into the bottom chamber wells of a 24-well plate with or without 2 × 10⁵ pre-cultured CAFs, control siRNA-transfected CAFs, or Gal-1 siRNA-transfected CAFs as attractants. After 24 h of incubation, cells remaining on the top layers of the inserts were removed by cotton swab scrubbing, and cells on the lower surface of the membrane were fixed and stained with H&E. The cell numbers in five random fields (200×) were counted for each chamber, and the average value was calculated.
In invasion assays, 2 × 10⁵ gastric cancer cells (BGC-823, 7901, and AGS) were plated in the top chamber with Matrigel pre-coated membrane (ECM554; Millipore), while the bottom chambers of a 24-well plate had inserts with or without 2 × 10⁵ pre-cultured CAFs, control siRNA-transfected CAFs, or Gal-1 siRNA-transfected CAFs as attractants. After 48 h of incubation, the cells (lower side of the membrane) were stained and the number calculated as above.
After real-time PCR and Western blot analysis, which suggested a correlation between Gal-1 and integrin β1, Transwell invasion assays were carried out to test the effect of integrin β1 siRNA on blocking the enhanced invasion induced by CAFs (high Gal-1 expression). First, the gastric cancer cells (BGC-823, 7901, AGS) were transfected with integrin β1 siRNA-1 and siRNA-2 to block integrin β1 expression, then the cells were collected and plated in the top chamber for Transwell invasion assay; the bottom chambers were pre-cultured with CAFs as the attractant. The method was as described above.
Candidate genes associated with Gal-1 induced cell invasion
Briefly, in a 6-well co-culture system (Millicell Cell Culture Insert, PIHP03050; Millipore), 4 × 10⁵ CAFs with or without Gal-1 siRNA transfection were seeded in the lower chamber, while 2 × 10⁵ gastric cancer cells (BGC-823 or 7901) were grown in the upper chamber; a membrane (0.4-μm pore size) permeable to liquids but not cells, was placed between the upper and lower chambers. After incubation at 37°C under 5% CO2 for 48 h, the gastric cancer cells in the upper chamber were collected for real-time PCR and Western blotting.
Total RNA was extracted using TRIzol reagent (Invitrogen, NY, USA) and reverse-transcribed according to the instructions with the PrimeScript First Strand cDNA Synthesis kit (DRR047A; Takara, Dalian, China). Real-time PCR was carried out using the MX3000P system (Stratagene, La Jolla, CA, USA), using gene-specific primers with the SYBR Premix ExTaq kit (DRR042A; Takara). GAPDH was used as an internal control. The candidate primer pool is listed in Table 1. Initial denaturation (5 min at 95°C) was followed by 40 cycles of amplification at 95°C for 10 s, annealing time (Table 1) 20 s, and 72°C for 20 s. Melting curve analysis was carried out at the end of the PCR cycles. The relative expression levels were calculated using the  method.
Table 1.
Primers used in PCR analyses
| Candidate gene | Primer sequence | Fragment size (bp) | Annealing temperature (°C) |
|---|---|---|---|
| ITGB7 (NM_000889.1) | F: TCTTGGTGGAGGATGACG R: GAAAGCGAGGATTGATGGT | 273 | 58 |
| ITGAV (NM_001145000.1) | F: CAGCCACTACCCATCTCAAT R: TTCAAACCAGCCAACCAAC | 195 | 55 |
| ITGB1 (NM_033668.2) | F: AAGACTATCCCATTGACCTC R: TCCAGCAAAGTGAAACCC | 443 | 55 |
| ITGB8 (NM_002214.2) | F: CTGTTATCCCTACGCTTCCC R: CTGTTCTTGTCTATTCAACCACC | 173 | 55 |
| ITGB6 (NM_000888.3) | F: GAAGAACTGCGGTCTGAGGT R: TTTTGGTGTTGGAAGAGGGT | 107 | 55 |
| ITGB3 (NM_000212.2) | F: GGAATAAGTGCCAGGATG R: TGATGCCAAGTGGGAGTG | 276 | 58 |
| ITGB5 (NM_002213.3) | F: GGCTGTGGAGGTGAGATAG R: GTGCCGTGTAGGAGAAAG | 364 | 55 |
| ITGA6 (NM_000210.2) | F: AGGGATTGTTCGTGTAGAGC R: ACCACCGCCACATCATAG | 327 | 55 |
| ITGA4 (NM_000885.4) | F: GTAGCCCTAATGGAGAACCT R: TGCCCACAAGTCACGATG | 118 | 55 |
| ITGA1 (NM_181501.1) | F: TTGGTGGTGCTGCCCTCTT R: GCATACTGTTTCCTTTCCCTCC | 125 | 55 |
| ITGA9 (NM_002207.2) | F: GAAGCCGACCACATCCTAC R: TGAAGAAGCCCGCTATCC | 154 | 55 |
| ITGA2 (NM_002203.3) | F: CGACGAAGTGCTACGAAAG R: TACCCAAGAACTGCTATGC | 131 | 56 |
| ITGAL (NM_002209.2) | F: GGCACAAGCAAACAGGAC R: TCACGGTGTAACCCAAATAG | 220 | 55 |
| ITGA3 (NM_002204.2) | F: TGGCAGACCTACCACAACG R: CTGGCTCAGCAAGAACACC | 330 | 55 |
| GAPDH (NM_002046.3) | F: TGAAGGTCGGAGTCAACGG R: CTGGAAGATGGTGATGGGATT | 223 | 56 |
F, forward; ITGA1, Homo sapiens integrin, α1; ITGA2, Homo sapiens integrin, α2 (CD49B, α2 subunit of VLA-2 receptor); ITGA3, Homo sapiens integrin, α3 (antigen CD49C, α3 subunit of VLA-3 receptor); ITGA6, Homo sapiens integrin, α6; ITGA4, Homo sapiens integrin, α4 (antigen CD49D, α4 subunit of VLA-4 receptor); ITGA9, Homo sapiens integrin, α9; ITGAL, Homo sapiens integrin, αL (antigen CD11A (p180), lymphocyte function-associated antigen 1; α polypeptide); ITGAV, Homo sapiens integrin, αV (vitronectin receptor, α polypeptide, antigen CD51); ITGB1, Homo sapiens integrin, β1 (fibronectin receptor, β polypeptide, antigen CD29 includes MDF2, MSK12); ITGB3, Homo sapiens integrin, β3 (platelet glycoprotein IIIa, antigen CD61); ITGB5, Homo sapiens integrin, β5; ITGB6, Homo sapiens integrin, β6; ITGB7, Homo sapiens integrin, β7; ITGB8, Homo sapiens integrin, β8; R, reverse.
Total protein was extracted using RIPA lysis buffer and fractionated on SDS-PAGE. The proteins were electrotransferred onto PVDF membranes using the semidry transfer method. The membranes were blocked with 5% BSA for 2 h, then incubated overnight with primary antibodies at 4°C. The primary antibodies were anti-Gal-1 (1:1000, G7420; Sigma, St. Louis, MO, USA) and anti-integrin β1 (1:1000, #9699; Cell Signaling Technology, Danvers, MA, USA). After incubation with secondary antibody (1:5000; Huaan Biotech, Hangzhou, China) for 2 h, the membranes were treated with electrochemiluminescence reagent (Generay, Shanghai, China) and exposed to autoradiographic film.
Immunohistochemical staining and evaluation
Ninety-four paraffin gastric cancer specimens were acquired from Zhejiang Provincial People's Hospital (Hangzhou, China), having been collected between January 2001 and December 2004. All cases were classified according to the World Health Organization Pathological Classification of Tumors in 2010. The characteristics of the 94 patients are summarized in Table 2. None of the patients had received any radiotherapy or chemotherapy in advance of the operation. Specimens were fixed in formalin and embedded in paraffin. The project was approved by the Ethics Committee of Zhejiang Provincial People's Hospital.
Table 2.
Relationship between galectin 1 (Gal-1), integrin β1, and clinicopathologic features in 94 gastric cancer patients
| Groups | No. of cases | Cases positive for Gal-1, n (%) | P-value | Cases positive for integrin β1, n (%) | P-value |
|---|---|---|---|---|---|
| Sex | |||||
| Male | 59 | 34 (57.6) | 0.438 | 27 (45.8) | 0.061 |
| Female | 35 | 23 (65.7) | 23 (65.7) | ||
| Tumor diameter | |||||
| <5 cm | 55 | 33 (60.0) | 0.880 | 25 (45.5) | 0.074 |
| ≥5 cm | 39 | 24 (61.5) | 25 (64.1) | ||
| Differentiation | |||||
| Well | 1 | 1 (100) | 0.099 | 1 (100.0) | 0.381 |
| Moderate | 27 | 12 (44.4) | 12 (44.4) | ||
| Poor | 66 | 44 (66.7) | 37 (56.1) | ||
| Histological classification | |||||
| Papillary adenocarcinoma | 5 | 2 (40.0) | 0.611 | 1 (20.0) | 0.300 |
| Tubular adenocarcinoma | 67 | 40 (59.7) | 36 (53.7) | ||
| Mucinous adenocarcinoma | 5 | 4 (80.0) | 4 (80.0) | ||
| Signet-ring cell carcinoma | 17 | 11 (64.7) | 9 (52.9) | ||
| Lymph node metastasis | |||||
| Yes | 64 | 49 (76.6) | 0.000 | 43 (67.2) | 0.000 |
| No | 30 | 8 (26.7) | 7 (23.3) | ||
| Distant metastasis | |||||
| Yes | 14 | 13 (92.9) | 0.007 | 12 (85.7) | 0.008 |
| No | 80 | 44 (55.0) | 38 (47.5) | ||
| TNM stage | |||||
| I + II | 40 | 14 (35.0) | 0.000 | 9 (22.5) | 0.000 |
| III + IV | 54 | 43 (79.6) | 41 (75.9) | ||
The sections were deparaffinized and rehydrated in graded ethanols. Antigen retrieval was carried out by autoclaving for 3 min in 0.01 M citrate buffer (pH 7.4). After retrieval, the sections were blocked with 3% (v/v) H2O2 for 10 min and 10% (v/v) normal goat serum for 15 min at room temperature. Then the sections were incubated with primary antibodies at 4°C overnight (anti-integrin β1 [1:400, #9699; Cell Signaling Technology] and anti-Gal-1 (1:250, #6837-1; Epitomics, Burlingame, CA, USA]). Then the sections were incubated with HRP-conjugated secondary antibody (Zhongshan Biotech) for 20 min at room temperature. Finally, 3′-diaminobenzidine tetrahydrochloride was used to visualize the signal development, and then the sections were counterstained with hematoxylin.
The immunohistochemical evaluation was independently carried out by two pathologists without knowledge of the clinical data. The immunoreactivity levels of each case were estimated under a light microscope by assessing the average signal intensity (on a scale of 0–3) and the proportion of cells showing positive staining (0, <5%; 1, 5–25%; 2, 26–50%; 3, 51–75%; 4, 76–100%). The intensity and proportion scores were then multiplied to obtain a composite score; 0–3 was defined as negative and 4–12 as positive.
Statistical analysis
All statistical analyses were carried out using spss version 13.0 (SPSS, Chicago, IL, USA). For in vitro experiments, independent samples t-tests were used to analyze the significance of differences between the control and treatment groups. Categorical data were assessed using Chi-square or Fisher's exact tests. Spearman's ρ-test was used to assess the correlation between integrin β1 and Gal-1 staining. Survival curves were estimated using the Kaplan–Meier method, and the log–rank test was used to calculate differences between the curves. A P-value of <0.05 was considered statistically significant.
Result
Identification of primary cultured cells and Gal-1 expression in CAFs
Although we could not distinguish the two types of cells under the light microscope (Fig. S1) as both were long and spindle-shaped and with spiral growth, we did identify differences between CAFs and NAFs using molecular markers and ICC staining (Fig. 1). Both in NGFs and CAFs, vimentin was strongly expressed but no cytokeratin was detected, whereas α-SMA was expressed in CAFs, but not in NGFs. The FSP, FAP, and fibronectin expression was increased in CAFs compared with NAFs. Gal-1 was strongly expressed in CAFs, but no or only a weak signal was detected in NAFs (Fig. 1).
Fig 1.
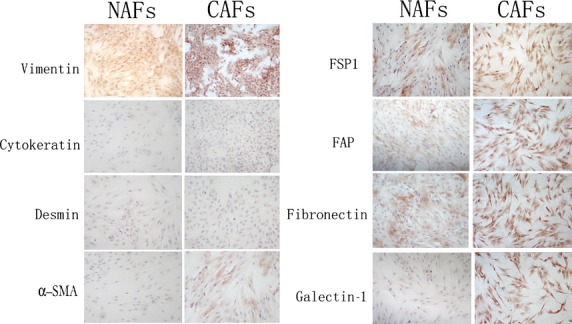
Photomicrographs of carcinoma-associated fibroblasts (CAFs) and normal associated fibroblasts (NAFs) stained for vimentin, cytokeratin, α-smooth muscle actin (α-SMA), fibroblast activation protein (FAP), fibroblast secretory protein (FSP1), fibronectin, and galectin-1. Magnification, ×200; phase contrast microscopy.
High Gal-1 expression in CAFs promotes cell migration and invasion
In the migration and invasion assays, BGC-823, 7901, and AGS cells co-cultured with CAFs for 24 h showed increased numbers of migrating cells (P < 0.05compared with controls; Fig. 2). Reducing the expression of Gal-1 in CAFs with Gal-1 siRNAs inhibited this effect (Fig. 2). These results indicate that overexpression of Gal-1 in CAFs contributes to gastric cancer cell migration and invasion.
Fig 2.

Migration and invasion of gastric cancer cells is impacted by galectin-1 (Gal-1) expression in carcinoma-associated fibroblasts (CAFs). (a, b) CAF-treated cancer cells showed higher migration than untreated cells (P < 0.05), and this effect was inhibited by reducing the expression of Gal-1 in CAFs with Gal-1 siRNA-1 and siRNA-2 compared with the normal control (NC) siRNA-treated group (P < 0.05). (c, d) CAF-treated cancer cells showed higher invasiveness than untreated cells (P < 0.05), and this effect was inhibited by reducing the Gal-1 expression as in (a) and (b). (a, c) Magnification, ×200.
Candidate genes associated with Gal-1-induced cell migration and invasion
In order to identify genes associated with Gal-1-induced cell invasion in gastric cancer, a set of cancer invasion-associated primers were investigated by real-time PCR screening. Among these genes, the expression levels of integrin β1 in cancer cells were considered to occur through upregulation of Gal-1 expression. Compared with gastric cancer cells co-cultured with CAFs with low Gal-1 expression (treated with Gal-1 siRNAs), the expression level of integrin β1 was remarkably elevated in those co-cultured with CAFs with high Gal-1 expression (treated with control siRNA), both at the mRNA and protein levels (Fig. 3). There were no differences in the expression of ITGB7, ITGAV, ITGB8, ITGB6, ITGB3, ITGB5, ITGA6, ITGA4, ITGA1, ITGA9, ITGA2, ITGAL, or ITGA3 (data not shown). We further tested the involvement of integrin β1 in the CAF-induced enhanced invasiveness of human gastric cancer cells. Integrin β1 siRNA was used to block its expression in gastric cancer cells, and we found that pretreatment of 7901, BGC-823, and AGS cells with integrin β1 siRNA significantly reduced the enhanced the invasive potential induced by CAFs (Fig. 4).
Fig 3.
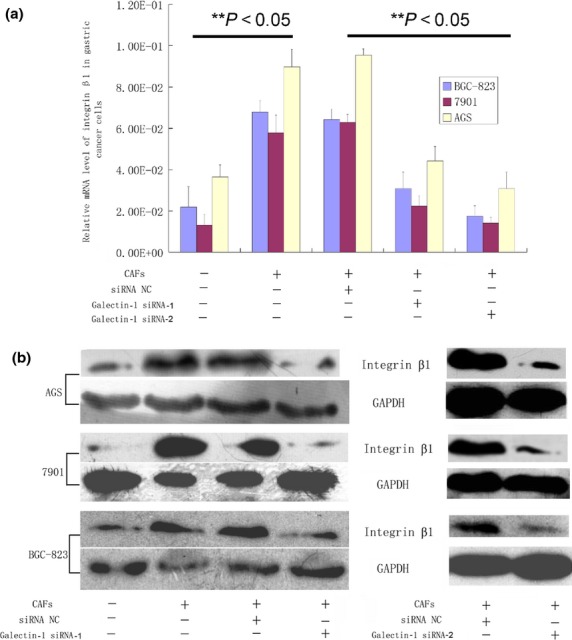
Candidate genes associated with galectin-1-induced cell migration and invasion. Integrin β1 was elevated at both the mRNA and protein level when gastric cancer cells were co-cultured with carcinoma-associated fibroblasts (CAFs), and this was markedly reduced when the CAFs were pre-transfected with galectin-1 siRNA-1 and siRNA-2. (a) Real-time PCR results. (b) Western blotting results.
Fig 4.
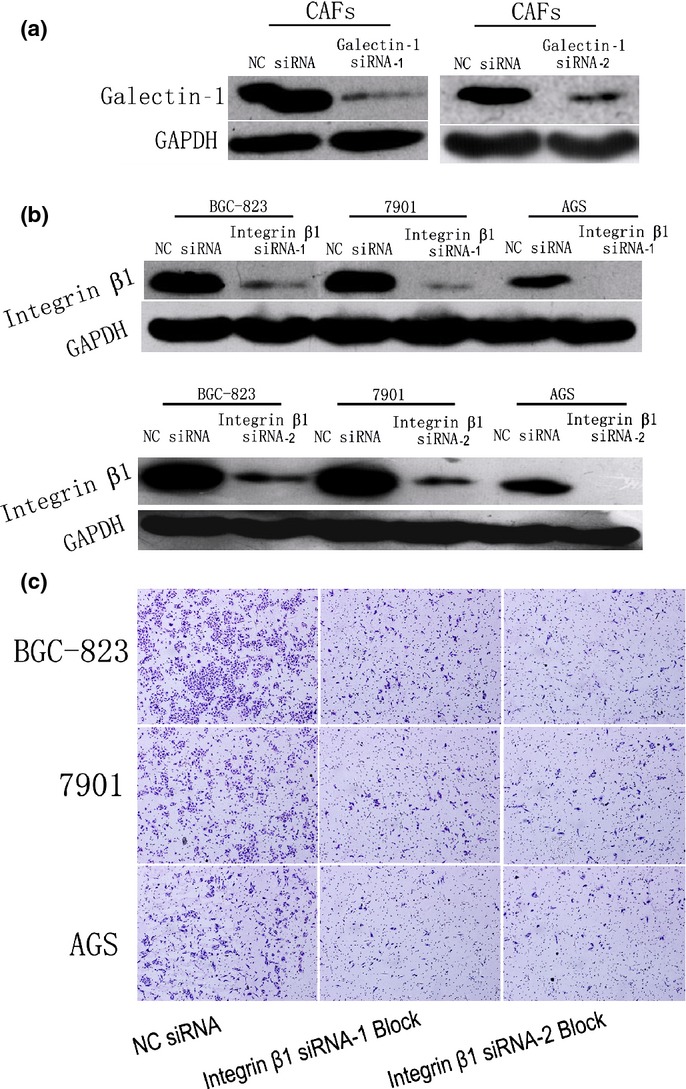
Validation of siRNA transfection efficiency and the involvement of integrin β1 in the enhanced invasion of human gastric cancer cells induced by carcinoma-associated fibroblasts (CAFs). (a) Western blot validation of the transfection efficiency of galectin-1 siRNA-1 and siRNA-2 in CAFs. (b) Western blot validation of the transfection efficiency of integrin β1 siRNA-1 and siRNA-2 in gastric cancer cells. (c) Pre-blockade of integrin β1 expression in gastric cancer cells by siRNA-1 and siRNA-2 interrupted the invasion-promoting effect of CAFs that highly express galectin-1. NC, normal control. Magnification, ×200.
Taken together, these results suggest that high expression levels of Gal-1 in CAFs enhance the invasive and migratory ability of human gastric cancer cells. This may be achieved by upregulating the expression level of integrin β1 in these cells. Furthermore, the blockade of integrin β1 expression in the cells blocked these effects.
Correlation between Gal-1 and integrin β1 expression in gastric cancer and survival analysis
To confirm the correlation between Gal-1 and integrin β1 expression, immunohistochemistry was carried out in 94 gastric cancer samples. Integrin β1 protein showed membranous staining in most cancer cells, but Gal-1 was found to be strongly expressed in CAFs and a negative reaction in tumor cells (Fig. 5). Integrin β1 expression was positive in 50 of 94 tumor samples (53.2%) and Gal-1 in 57 of 94 (60.6%). Integrin β1 and Gal-1 expression and staining intensity were significantly associated with lymph node metastasis, distant metastasis, and TNM stage of the clinicopathologic parameters (Table 2). Spearman's ρ-test gave a positive correlation between the levels of Gal-1 and integrin β1 (R = 0.51, P = 0.001; Table 3).
Fig 5.
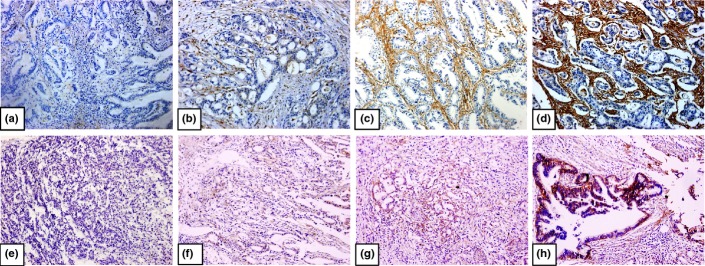
Immunohistochemical staining for galectin-1 (a–d) and integrin β1 (e–h) in gastric cancer tissues. Negative (a), weak (b), moderate (c), and strong (d) galectin-1 staining. Negative (e), weak (f), moderate (g), and strong (h) integrin β1staining. Original magnification, ×200.
Table 3.
Correlation between galectin-1 (Gal-1)and integrin β1 expression in 94 gastric cancer patients
| Integrin β1 expression | Spearman's ρ-test | ||||
|---|---|---|---|---|---|
| Integrin β1 (−) | Integrin β1 (+) | R-value | P-value | ||
| Gal-1 | Gal-1 (−) | 29 | 8 | 0.510 | 0.000 |
| expression | Gal-1 (+) | 15 | 42 | ||
Kaplan–Meier analysis indicated a significant impact on patient survival of integrin β1 staining intensity in tumor cells and Gal-1 staining intensity in CAFs. Cases with both strong cytoplasmic integrin β1 intensity in cancer cells and strong Gal-1 intensity in CAFs showed a shortened mean survival time (31.7 ± 1.8 month) compared to cases with single integrin β1-positive (36.3 ± 4.2 month) and Gal-1-positive (49.3 ± 2.7 month) or double-negative stained samples (54.1 ± 2.1 month, P < 0.05; Fig. 6).
Fig 6.
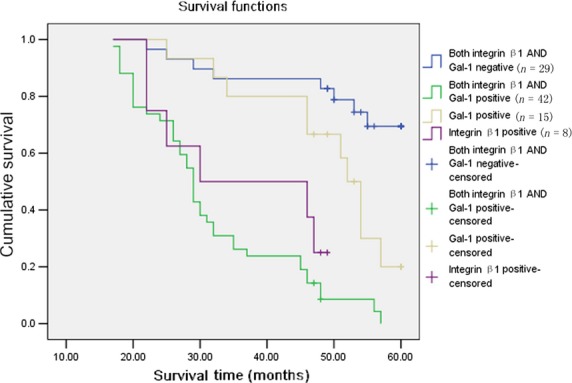
Kaplan–Meier survival curves of galectin-1 (Gal-1) and integrin β1 expression in gastric cancer patients. Cumulative 5-year survival rate.
Discussion
Increasing attention is being paid to the tumor microenvironment, where tumor cells closely interact with the surrounding vascular endothelial cells, inflammatory cells, fibroblasts, and other ECM components. These interactions induce a variety of changes in stromal cells, including the abnormal production of many growth factors, chemokines, angiogenesis, and ECM proteins, which together form a suitable tumor microenvironment. Under the effects of exogenous stimulating factors, a series of signaling pathways associated with tumor progression and metastasis are abnormally activated. Then the tumor cells express many malignant changes, such as rapid proliferation, local adhesion, invasion, and distant metastasis.(27,28) Galectin-1, a secretory protein that is overexpressed in CAFs, plays a prominent role in promoting tumor growth and progression,(24–26) and patients with high Gal-1 expression have a poor prognosis. These studies only focused on the relationship between Gal-1 expression and cancer progression and prognosis, whereas a precise model of the interaction between the cancer microenvironment, CAFs and cancer cells is still unkown. In particular, the reasons why Gal-1 was highly expressed in CAFs and how it influenced tumor cells was still not clear. In this study, we co-cultured CAFs that have high Gal-1 expression with gastric cancer cells and found that the overexpression of Gal-1 in CAFs enhanced gastric cancer cell migration and invasion, and these stimulatory effects were blocked by siRNA that reduce the Gal-1 expression level. These findings indicated that the expression of Gal-1 in CAFs promotes gastric cancer cell migration and invasion.
In humans, integrins have 18 α-subunits and 8 β-subunits and can form 24 different combinations.(29) High integrin expression is associated with the progression of epithelial malignancies, particularly during invasion, metastasis, and angiogenesis, and adhesion to the ECM.(30,31) Adhesion to the ECM is an essential step for cancer cell survival and growth in distant locations during metastasis. During this step, integrins are major regulatory molecules that provide a scaffold linking the ECM to the actin cytoskeleton, respond to tumor environmental cues (such as growth factors, chemokines, angiogenetic factors secreted by vascular-related cells, inflammatory cells, and CAFs), and then transmit the external signals to cancer cells.(29,32,33) Integrin β1 has broad functional activities in cancer such as proliferation, adhesion, and invasion, and its knockdown inhibits colony formation, invasion, and migration.(34–37) Recent reports have implied that integrin β1 expression causes therapeutic resistance in several solid cancer models.(38,39) Morello et al.(40) indicated that integrin β1 is an essential regulator of epidermal growth factor receptor signaling and affects the tumorigenic properties of lung cancer cells by inducing active proliferation and metastasis. Moiseeva et al.(41) revealed that Gal-1 probably affects vascular smooth muscle cell adhesion, migration, and proliferation by direct binding to integrin β1 on the cell surface. In this study, we used real-time PCR and Western blotting to analyze several candidate genes that may be associated with cancer invasion and Gal-1 expression, and obtained results similar to those of Moiseeva et al.(41) Among these candidate genes, using siRNAs we found that the expression level of integrin β1 was remarkably elevated in gastric cancer cells co-cultured with CAFs expressing high Gal-1 compared to those with low Gal-1 expression CAFs. That is, the Gal-1 overexpression in CAFs may be through the upregulation of the expression level of integrin β1 in cancer cells. Pre-blocking the integrin β1 expression in gastric cancer cells with siRNA interrupted the invasion-promoting effect of CAFs with high Gal-1 expression. Furthermore, immunohistochemistry confirmed a positive correlation between Gal-1 and integrin β1 expression; patients with positive expression of both Gal-1 and integrin β1 had shorter survival times than those with double-negative or single-positive results.
In conclusion, our results showed that overexpression of Gal-1 in CAFs promotes the invasiveness of gastric cancer cells in vitro and integrin β1 is closely involved in this invasive promotion. Investigation of these signaling pathways (Gal-1/integrin β1 axis) will further improve our understanding of the molecular mechanisms underlying gastric cancer progression, and help develop novel techniques for its treatment.
Acknowledgments
This work was supported by the National Key Basic Research Program of China (Grant No. 2014CB542101), the National Natural Science Foundation of China (Grant Nos. 81071991, 81372598, and 81000016), Zhejiang Provincial Natural Science Foundation of China (Grant No. LY14H160039), Zhejiang Provincial Program for the Cultivation of High-level Innovative Health Talents, Science and Technology Plan of Haining Science Committee (Grant No. 20121213), Medicine and Health Research Foundation of Zhejiang Province (Grant Nos. 2013KYB022, 2013KYB017, and 2011KYA016).
Disclosure Statement
The authors have no conflict of interest.
Supporting Information
Additional supporting information may be found in the online version of this article:
Fig. S1. Primary cultures of carcinoma-associated fibroblasts (CAFs) (a–c) and normal associated fibroblasts (NAFs) (d–f). Magnification, ×200; phase contrast microscopy.
References
- 1.Anderson C, Nijagal A, Kim J. Molecular markers for gastric adenocarcinoma: an update. Mol Diagn Ther. 2006;10:345–52. doi: 10.1007/BF03256211. [DOI] [PubMed] [Google Scholar]
- 2.Jemal A, Center MM, DeSantis C, Ward EM. Global patterns of cancer incidence and mortality rates and trends. Cancer Epidemiol Biomarkers Prev. 2010;19:1893–907. doi: 10.1158/1055-9965.EPI-10-0437. [DOI] [PubMed] [Google Scholar]
- 3.Feng XY, Chen YB, Wang W, et al. Time-varying pattern of recurrence risk for gastric cancer patients. Med Oncol. 2013;30:514. doi: 10.1007/s12032-013-0514-y. [DOI] [PubMed] [Google Scholar]
- 4.Park JM, Song KY, O JH, Kim WC, Choi MG, Park CH. Bone recurrence after curative resection of gastric cancer. Gastric Cancer. 2013;16:362–9. doi: 10.1007/s10120-012-0193-y. [DOI] [PubMed] [Google Scholar]
- 5.Desmouliere A, Darby IA, Gabbiani G. Normal and pathologic soft tissue remodeling: role of the myofibroblast, with special emphasis on liver and kidney fibrosis. Lab Invest. 2003;83:1689–707. doi: 10.1097/01.lab.0000101911.53973.90. [DOI] [PubMed] [Google Scholar]
- 6.Herrera M, Islam AB, Herrera A, et al. Functional heterogeneity of cancer-associated fibroblasts from human colon tumors shows specific prognostic gene expression signature. Clin Cancer Res. 2013;19:5914–26. doi: 10.1158/1078-0432.CCR-13-0694. [DOI] [PubMed] [Google Scholar]
- 7.Kalluri R, Zeisberg M. Fibroblasts in cancer. Nat Rev Cancer. 2006;6:392–401. doi: 10.1038/nrc1877. [DOI] [PubMed] [Google Scholar]
- 8.Bhowmick NA, Neilson EG, Moses HL. Stromal fibroblasts in cancer initiation and progression. Nature. 2004;432:332–7. doi: 10.1038/nature03096. [DOI] [PMC free article] [PubMed] [Google Scholar]
- 9.Li H, Fan X, Houghton J. Tumor microenvironment: the role of the tumor stroma in cancer. J Cell Biochem. 2007;101:805–15. doi: 10.1002/jcb.21159. [DOI] [PubMed] [Google Scholar]
- 10.Bissell MJ, Radisky D. Putting tumours in context. Nat Rev Cancer. 2001;1:46–54. doi: 10.1038/35094059. [DOI] [PMC free article] [PubMed] [Google Scholar]
- 11.Dabbous MK, Haney L, Carter LM, Paul AK, Reger J. Heterogeneity of fibroblast response in host-tumor cell-cell interactions in metastatic tumors. J Cell Biochem. 1987;35:333–44. doi: 10.1002/jcb.240350408. [DOI] [PubMed] [Google Scholar]
- 12.Orimo A, Weinberg RA. Stromal fibroblasts in cancer: a novel tumor-promoting cell type. Cell Cycle. 2006;5:1597–601. doi: 10.4161/cc.5.15.3112. [DOI] [PubMed] [Google Scholar]
- 13.Gout S, Huot J. Role of cancer microenvironment in metastasis: focus on colon cancer. Cancer Microenviron. 2008;1:69–83. doi: 10.1007/s12307-008-0007-2. [DOI] [PMC free article] [PubMed] [Google Scholar]
- 14.Zhi K, Shen X, Zhang H, Bi J. Cancer-associated fibroblasts are positively correlated with metastatic potential of human gastric cancers. J Exp Clin Cancer Res. 2010;29:66. doi: 10.1186/1756-9966-29-66. [DOI] [PMC free article] [PubMed] [Google Scholar]
- 15.Bello IO, Vered M, Dayan D, et al. Cancer-associated fibroblasts, a parameter of the tumor microenvironment, overcomes carcinoma-associated parameters in the prognosis of patients with mobile tongue cancer. Oral Oncol. 2011;47:33–8. doi: 10.1016/j.oraloncology.2010.10.013. [DOI] [PubMed] [Google Scholar]
- 16.Barondes SH, Castronovo V, Cooper DN, et al. Galectins: a family of animal beta-galactoside-binding lectins. Cell. 1994;76:597–8. doi: 10.1016/0092-8674(94)90498-7. [DOI] [PubMed] [Google Scholar]
- 17.Yang RY, Rabinovich GA, Liu FT. Galectins: structure, function and therapeutic potential. Expert Rev Mol Med. 2008;10:e17. doi: 10.1017/S1462399408000719. [DOI] [PubMed] [Google Scholar]
- 18.Ito K, Stannard K, Gabutero E, et al. Galectin-1 as a potent target for cancer therapy: role in the tumor microenvironment. Cancer Metastasis Rev. 2012;31:763–78. doi: 10.1007/s10555-012-9388-2. [DOI] [PubMed] [Google Scholar]
- 19.Balan V, Nangia-Makker P, Raz A. Galectins as cancer biomarkers. Cancers (Basel) 2010;2:592–610. doi: 10.3390/cancers2020592. [DOI] [PMC free article] [PubMed] [Google Scholar]
- 20.Satelli A, Rao PS, Gupta PK, Lockman PR, Srivenugopal KS, Rao US. Varied expression and localization of multiple galectins in different cancer cell lines. Oncol Rep. 2008;19:587–94. [PubMed] [Google Scholar]
- 21.Thijssen VL, Hulsmans S, Griffioen AW. The galectin profile of the endothelium: altered expression and localization in activated and tumor endothelial cells. Am J Pathol. 2008;172:545–53. doi: 10.2353/ajpath.2008.070938. [DOI] [PMC free article] [PubMed] [Google Scholar]
- 22.Jung EJ, Moon HG, Cho BI, et al. Galectin-1 expression in cancer-associated stromal cells correlates tumor invasiveness and tumor progression in breast cancer. Int J Cancer. 2007;120:2331–8. doi: 10.1002/ijc.22434. [DOI] [PubMed] [Google Scholar]
- 23.Clausse N, van den Brule F, Waltregny D, Garnier F, Castronovo V. Galectin-1 expression in prostate tumor-associated capillary endothelial cells is increased by prostate carcinoma cells and modulates heterotypic cell-cell adhesion. Angiogenesis. 1999;3:317–25. doi: 10.1023/a:1026584523789. [DOI] [PubMed] [Google Scholar]
- 24.Nagy N, Legendre H, Engels O, et al. Refined prognostic evaluation in colon carcinoma using immunohistochemical galectin fingerprinting. Cancer. 2003;97:1849–58. doi: 10.1002/cncr.11268. [DOI] [PubMed] [Google Scholar]
- 25.Bektas S, Bahadir B, Ucan BH, Ozdamar SO. CD24 and galectin-1 expressions in gastric adenocarcinoma and clinicopathologic significance. Pathol Oncol Res. 2010;16:569–77. doi: 10.1007/s12253-010-9248-8. [DOI] [PubMed] [Google Scholar]
- 26.Wu MH, Hong HC, Hong TM, Chiang WF, Jin YT, Chen YL. Targeting galectin-1 in carcinoma-associated fibroblasts inhibits oral squamous cell carcinoma metastasis by downregulating MCP-1/CCL2 expression. Clin Cancer Res. 2011;17:1306–16. doi: 10.1158/1078-0432.CCR-10-1824. [DOI] [PubMed] [Google Scholar]
- 27.Mbeunkui F, Johann DJ., Jr Cancer and the tumor microenvironment: a review of an essential relationship. Cancer Chemother Pharmacol. 2009;63:571–82. doi: 10.1007/s00280-008-0881-9. [DOI] [PMC free article] [PubMed] [Google Scholar]
- 28.Lorusso G, Ruegg C. The tumor microenvironment and its contribution to tumor evolution toward metastasis. Histochem Cell Biol. 2008;130:1091–103. doi: 10.1007/s00418-008-0530-8. [DOI] [PubMed] [Google Scholar]
- 29.Guo W, Giancotti FG. Integrin signalling during tumour progression. Nat Rev Mol Cell Biol. 2004;5:816–26. doi: 10.1038/nrm1490. [DOI] [PubMed] [Google Scholar]
- 30.Foubert P, Varner JA. Integrins in tumor angiogenesis and lymphangiogenesis. Methods Mol Biol. 2012;757:471–86. doi: 10.1007/978-1-61779-166-6_27. [DOI] [PMC free article] [PubMed] [Google Scholar]
- 31.Tchaicha JH, Reyes SB, Shin J, Hossain MG, Lang FF, McCarty JH. Glioblastoma angiogenesis and tumor cell invasiveness are differentially regulated by beta8 integrin. Cancer Res. 2011;71:6371–81. doi: 10.1158/0008-5472.CAN-11-0991. [DOI] [PMC free article] [PubMed] [Google Scholar]
- 32.Barczyk M, Carracedo S, Gullberg D. Integrins. Cell Tissue Res. 2010;339:269–80. doi: 10.1007/s00441-009-0834-6. [DOI] [PMC free article] [PubMed] [Google Scholar]
- 33.Askari JA, Buckley PA, Mould AP, Humphries MJ. Linking integrin conformation to function. J Cell Sci. 2009;122:165–70. doi: 10.1242/jcs.018556. [DOI] [PMC free article] [PubMed] [Google Scholar]
- 34.Wang D, Muller S, Amin AR, et al. The pivotal role of integrin beta1 in metastasis of head and neck squamous cell carcinoma. Clin Cancer Res. 2012;18:4589–99. doi: 10.1158/1078-0432.CCR-11-3127. [DOI] [PMC free article] [PubMed] [Google Scholar]
- 35.Kato H, Liao Z, Mitsios JV, et al. The primacy of beta1 integrin activation in the metastatic cascade. PLoS ONE. 2012;7:e46576. doi: 10.1371/journal.pone.0046576. [DOI] [PMC free article] [PubMed] [Google Scholar]
- 36.Lin HC, Wu CL, Chen YL, Huang JS, Wong TY, Yuan K. High-level beta1-integrin expression in a subpopulation of highly tumorigenic oral cancer cells. Clin Oral Investig. 2014;18:1277–84. doi: 10.1007/s00784-013-1088-y. [DOI] [PubMed] [Google Scholar]
- 37.Grzesiak JJ, Tran Cao HS, Burton DW, et al. Knockdown of the beta(1) integrin subunit reduces primary tumor growth and inhibits pancreatic cancer metastasis. Int J Cancer. 2011;129:2905–15. doi: 10.1002/ijc.25942. [DOI] [PMC free article] [PubMed] [Google Scholar]
- 38.Carbonell WS, DeLay M, Jahangiri A, Park CC, Aghi MK. beta1 integrin targeting potentiates antiangiogenic therapy and inhibits the growth of bevacizumab-resistant glioblastoma. Cancer Res. 2013;73:3145–54. doi: 10.1158/0008-5472.CAN-13-0011. [DOI] [PMC free article] [PubMed] [Google Scholar]
- 39.Huang C, Park CC, Hilsenbeck SG, et al. Beta1 integrin mediates an alternative survival pathway in breast cancer cells resistant to lapatinib. Breast Cancer Res. 2011;13:R84. doi: 10.1186/bcr2936. [DOI] [PMC free article] [PubMed] [Google Scholar]
- 40.Morello V, Cabodi S, Sigismund S, et al. Beta1 integrin controls EGFR signaling and tumorigenic properties of lung cancer cells. Oncogene. 2011;30:4087–96. doi: 10.1038/onc.2011.107. [DOI] [PubMed] [Google Scholar]
- 41.Moiseeva EP, Williams B, Goodall AH, Samani NJ. Galectin-1 interacts with beta-1 subunit of integrin. Biochem Biophys Res Commun. 2003;310:1010–6. doi: 10.1016/j.bbrc.2003.09.112. [DOI] [PubMed] [Google Scholar]
Associated Data
This section collects any data citations, data availability statements, or supplementary materials included in this article.
Supplementary Materials
Fig. S1. Primary cultures of carcinoma-associated fibroblasts (CAFs) (a–c) and normal associated fibroblasts (NAFs) (d–f). Magnification, ×200; phase contrast microscopy.