

Abstract
Tumor budding/sprouting has been shown to be an independent adverse prognostic factor in T1 and T3N0 colorectal carcinomas, however, its assessment could be improved by more accurate identification of budding carcinoma cells and consideration of budding areas. Moreover, tumor budding mechanisms are yet to be defined. In this study, we evaluated the identification of budding tumor cells by either H&E staining alone or H&E with immunohistochemistry and developed a scoring system based on budding grades and areas. We examined whether the budding score correlated with clinicopathologic features and prognosis and the association between tumor budding/sprouting and c-Met protein expression and phosphorylation and MET gene copy numbers because c-Met is known to play an important role in colorectal carcinoma tumorigenesis. Cytokeratin immunohistochemistry could identify tumors with shorter disease-free survival (DFS) from the low-grade budding group assessed with H&E alone. High budding scores based on budding grade and area were more significantly correlated with DFS than scores obtained using the budding grade alone. In tumors with a high budding score, c-Met expression and phosphorylation levels and MET gene copy numbers were significantly increased at the invasive front compared with those in superficial tumor portions. This study showed for the first time that high levels of phospho-c-Met at the invasive front were significantly associated with a high budding score and shorter DFS. In conclusion, a budding score assessed by budding grades and budding-positive areas correlates highly with clinicopathologic aggressive features of colorectal carcinoma.
Keywords: tumor budding, sprouting, c-Met, tumor invasion
Colorectal carcinoma is one of the most common solid tumors worldwide.(1) Clinicopathologic staging of colorectal tumors is carried out for prognosis and treatment decision using the TNM staging system from the Union for International Cancer Control.(2) However, a substantial number of tumors demonstrate local or distant recurrences despite being categorized as low risk by the TNM system.(3,4) The failure of TNM staging to serve as a reliable prognostic system for patients with intermediate-stage tumors may be overcome by considering morphologic, molecular, or treatment-related factors that can stratify patients more precisely into different categories of risk.(5) Thus, the search for additional factors to assess the prognosis of colorectal carcinomas has been a major research focus. The promising histopathologic parameters in colorectal carcinoma include extramural venous invasion, tumor border configuration (pushing vs. infiltrating), presence of an inflammatory infiltrate, and tumor budding/sprouting, defined as small clusters of tumor cells at the invasive front.(3)
The concept of tumor budding/sprouting was first described in the 1950s by Imai, who postulated that the presence of “sprouting” at the invasive edge of carcinomas reflected a more rapid tumor growth rate.(3) Although a large number of studies have shown that tumor budding/sprouting is an independent adverse prognostic factor in colorectal carcinoma, assessment methods and definitions have varied widely between studies.(3) It is sometimes difficult to detect budding foci by conventional pathological examination of H&E stained sections alone because tumor buds can be very small and resemble the surrounding stromal cells.(3,6) Furthermore, the distribution and frequency of budding foci differs even among tumors with the same budding grade.
The molecular mechanisms underlying tumor budding/sprouting remain unclear. In this study, we focused on the role of c-Met in budding tumor cells. The c-Met protein is an important factor in colorectal tumorigenesis, progression, and metastasis.(7) The MET gene is located on chromosome 7 at q31 and encodes a transmembrane glycoprotein that serves as a specific receptor for hepatocyte growth factor (HGF).(8) Binding of HGF to c-Met induces phosphorylation of tyrosine residues at the C-terminus of the receptor, leading to receptor activation.(9) Hepatocyte growth factor/MET signaling promotes multiple biological activities, including cell proliferation, motility, invasion, angiogenesis, and morphogenesis in a wide variety of normal and neoplastic cells.(10) Moreover, c-Met activity is deregulated in many human cancers, including colorectal carcinoma, as a result of genetic mutations, gene amplification, protein overexpression, or production of HGF-dependent autocrine circuits.(11,12) In colorectal carcinoma, increased expression of the c-Met protein is associated with highly invasive tumors that spread through the intestinal wall.(8,13)
Our study had two major aims: (i) to evaluate the associations between our scoring system for tumor budding/sprouting, which included budding grade and the proportion of budding-positive areas, and clinicopathologic factors or prognosis; and (ii) to assess the association between c-Met expression and tumor budding/sprouting. Assessment of the budding score was significantly associated with lymphovascular invasion, lymph node (LN) metastasis, and poor prognosis. Moreover, we found a significant correlation between c-Met expression levels at the invasive tumor front and budding score.
Materials and Methods
Patients
We retrospectively reviewed 139 patients who underwent surgical resection of primary colorectal adenocarcinomas at the Department of Gastroenterological Surgery, Fukuoka University Hospital (Fukuoka, Japan) from January 2005 to December 2009. Patients with familial adenomatous polyposis, hereditary non-polyposis colorectal cancer syndrome, or inflammatory bowel disease were excluded. Tissues from surgical resections can be used for research according to the standard treatment agreement with patients in our hospital, provided patient anonymity is maintained and the patient has no objections. The protocol for this study was approved by the Institutional Review Board (Ethics Committee). Pathologic stage and tumor differentiation were determined by the TNM classification of malignant tumors (Union for International Cancer Control) and the Japanese Classification of Colorectal Carcinoma (JCCC),(14) respectively. Complete tumor resection was achieved in 114 cases, including 10 cases of pTis tumors for which endoscopic treatment could not be carried out. None of the patients received preoperative radiotherapy or chemotherapy.
Tissue samples and immunohistochemistry (IHC)
Surgically resected specimens were fixed in 10% formalin and processed into paraffin blocks. Tissues were sectioned (3-μm thickness), deparaffinized, and immersed in 0.3% hydrogen peroxide in methanol for 10 min at room temperature to block endogenous peroxidase activity. For anti-cytokeratin (CK) antibody staining, sections were heated in 10 mM EDTA buffer (pH 8.0) in a microwave oven (700 W) for 10 min to retrieve epitopes. After non-specific sites were blocked with Serum-Free Protein Block (Dako, Carpinteria, CA, USA) for 30 min at room temperature, sections were incubated with antibodies against CK (AE1/AE3) (dilution 1:200; Dako), c-Met (dilution 1:500; Santa Cruz Biotechnology, Santa Cruz, CA, USA), or phosphorylated c-Met (p-c-Met) (dilution 1:1,000; Immuno-Biological Laboratories, Takasaki, Japan) for 1 h at room temperature (AE1/AE3) or overnight at 4°C (c-Met, p-c-Met). Sections were then washed and incubated with ChemMate EnVision (Dako). Immunoreactive proteins were visualized with 3,3′-diamino-benzidine (Dako), followed by counterstaining with hematoxylin. A diagnosis was independently made by two pathologists and confirmed when the two opinions were concordant.
Scoring system for tumor budding/sprouting
Based on JCCC,(14) we defined tumor budding/sprouting as a cancer cell nest consisting of five or fewer cells that infiltrated the interstitium at the invasive margin of the cancer (Fig. 1). After selecting an area in which budding/sprouting was most intensive, the buds were counted in a field measuring 0.785 mm2 through a 20 × objective lens (WHK 10× ocular lens; Olympus, Tokyo, Japan). Depending on the number of buds, the criteria by JCCC for estimation of tumor budding/sprouting were modified as follows: grade 0, no budding; grade 1, 1–4 buds; grade 2, 5–9 buds; and grade 3, 10 or more buds. We used this grading system to evaluate budding/sprouting in H&E- and CK-immunostained sections. The extent of budding/sprouting was classified as low grade (grades 0 and 1) or high grade (grades 2 and 3).
Fig 1.

Hematoxylin–eosin staining of colorectal cancer showing tumor budding/sprouting (a) and cytokeratin immunohistochemistry (CK-IHC) for tumor budding/sprouting (b) at the invasive front. (c) Classification of budding grade by H&E staining and CK-IHC. (d) Disease-free survival curves for patients with different budding grades assessed by H&E and CK-IHC. Green line, 40 tumors assessed as low grade budding with both H&E and CK-IHC; blue line, 47 tumors assessed as low grade with H&E but high grade with CK-IHC; red line, 26 tumors assessed as high grade with both H&E and CK-IHC. NS, not significant.
The distribution of budding foci differed, even among tumors of the same grade (Fig. 2a,b). For example, in some tumors only a few grade 2 budding/sprouting foci were present whereas other tumors showed grade 2 budding foci at higher frequencies along the invasive front. Therefore, we assessed both budding grade and the proportion of budding-positive areas. Each budding grade (grade 0–3 by CK-IHC) was multiplied by an area score (0.25, 0–25%; 0.5, 26–50%; 0.75, 51–75%; and 1, 76–100%), giving a maximum total score of 3. This budding score was classified as low (<1) or high (≥1).
Fig 2.

Score for colorectal cancer budding/sprouting based on grade and area. (a,b) Both of these tumors were categorized as budding grade 2, but the area of the invasive front positive for tumor budding/sprouting was different. (c,d) Disease-free survival (DFS) curves stratified by budding score and grade for 114 patients who underwent complete resection of colorectal tumors. (c) DFS curves for patients with high and low budding score were significantly different (P < 0.001). (d) DFS curves for patients with high and low budding grade assessed by cytokeratin immunohistochemistry were significantly different (P = 0.002).
Scoring for c-Met and p-c-Met
Immunoreactivity for c-Met or p-c-Met was observed as cytoplasmic or membrane staining in carcinoma cells. Staining results were assessed semiquantitatively with the modified McCarty's H-scoring system.(15) The intensity score (0, none; 1, weak; 2, moderate; and 3, strong) and proportion score (0, 0–5%; 1, 6–25%; 2, 26–50%; 3, 51–75%; and 4, 76–100%) were multiplied to yield an overall c-Met or p-c-Met score. These c-Met and p-c-Met scores were classified as low or high corresponding to overall scores of 0–4 or 6–12, respectively.
Fluorescence in situ hybridization analysis
Fluorescence in situ hybridization assays were carried out at the invasive fronts and within superficial portions of tumors for 21 or 22 randomly selected recent cases of budding/sprouting with low or high score, respectively. The MET gene was evaluated on formalin-fixed paraffin-embedded 4-μm thick tissue sections using Vysis LSI MET/CEP 7 probe (Abbott, Tokyo, Japan) with slight modifications, as described previously.(16) At least 60 cells were scored for each case.
The copy number of the MET gene was classified into six categories (disomy, low and high trisomy, low and high polysomy, and gene amplification) according to the number of copies of the MET gene and chromosome 7 centromere.(10) The mean MET gene copy number per cell was also recorded for each case.
Statistical analysis
The relationships between several clinicopathologic parameters and the results of budding assessment, FISH, and IHC were evaluated with the chi-square-test and Fisher's exact test. The results of IHC and FISH analyses were compared using the Mann–Whitney U-test at both the invasive front and superficial portions of colorectal cancers. Survival curves were plotted by the Kaplan–Meier method, and P-values were calculated with the log–rank test. A P-value <0.05 was considered statistically significant. All data analyses were carried out using StatMate IV for Windows (ATMS, Tokyo, Japan).
Results
Clinicopathologic findings and budding grades by H&E staining or CK-IHC
Table 1 summarizes the clinicopathologic characteristics of the 139 patients (84 males and 55 females; age range, 25–94 years [mean, 66.7]). The median follow-up period was 40.5 months (range, 0–93).
Table 1.
Clinicopathological features of 139 patients with surgically resected primary colorectal adenocarcinomas
| n | % | |
|---|---|---|
| Patients | 139 | na |
| Gender | ||
| Male | 84 | 60.4 |
| Female | 55 | 39.6 |
| Age, years | ||
| Mean | 66.7 | na |
| Range | 25–94 | na |
| Location | ||
| Cecum | 8 | 5.8 |
| Ascending colon | 21 | 15.1 |
| Transverse colon | 15 | 10.8 |
| Descending colon | 7 | 5.0 |
| Sigmoid colon | 30 | 21.6 |
| Rectum | 58 | 41.7 |
| Tumor differentiation | ||
| Well | 63 | 45.3 |
| Moderately | 75 | 54.0 |
| Poorly | 1 | 0.7 |
| Wall penetration (pT) | ||
| pTis | 10 | 7.2 |
| pT1 | 27 | 19.4 |
| pT2 | 21 | 15.1 |
| pT3 | 47 | 33.8 |
| pT4 | 34 | 24.5 |
| Lymphatic invasion | ||
| Present | 80 | 57.6 |
| Absent | 59 | 42.4 |
| Venous invasion | ||
| Present | 103 | 74.1 |
| Absent | 36 | 25.9 |
| Lymph node metastasis | ||
| Present | 50 | 36.0 |
| Absent | 89 | 64.0 |
| TNM stage | ||
| 0 | 9 | 6.5 |
| I | 42 | 30.2 |
| II | 29 | 20.9 |
| III | 35 | 25.2 |
| IV | 24 | 17.3 |
na, not applicable.
Tumor budding/sprouting was first assessed in H&E stained sections. However, assessment was sometimes difficult because of the presence of reactive fibroblasts or macrophages in the stroma surrounding the invasive front, therefore we investigated whether it was easier to detect budding carcinoma cells with CK-IHC. Among 139 tumors, H&E revealed low- and high-grade budding in 101 (72.7%) and 38 (27.3%) tumors, respectively, whereas CK-IHC showed low- and high-grade budding in 45 (32.4%) and 94 (67.6%) tumors, respectively (Fig. 1a–c). Cytokeratin–IHC revealed approximately 2.5-fold more cases of high-grade budding than H&E staining. Comparing the two assessment methods, 37 of 38 tumors that showed high-grade budding with H&E remained high by CK-IHC (high-to-high group). In contrast, only 44 of 101 tumors that showed low-grade budding with H&E remained low grade with CK-IHC (low-to-low group) and 57 were classified as high-grade (low-to-high group). Both H&E- and CK-IHC-based grades showed significant association with all three parameters, lymphatic and venous invasion and lymph node metastasis (Table 2). However, the high grade of the CK-IHC budding grade detected more cases with lymphatic and venous invasion and lymph node metastasis than that of the H&E budding grade (80% vs. 41%, 78% vs. 34%, and 96% vs. 54%, respectively), indicating usefulness of the CK-IHC grade. When disease-free survival (DFS) was assessed in 113 patients who received curative resections (40 low-to-low, 47 low-to-high, and 26 high-to-high), the low-to-high group (Fig. 1d, blue line) showed an intermediate survival curve between that for the low-to-low (green line) and high-to-high (red line) groups. The differences between low-to-low and low-to-high and between low-to-low and high-to-high groups were statistically significant. The presence of the low-to-high group, which showed survival in between the low-to-low and high-to-high group, also supported the clinicopathological significance of the CK-IHC grade.
Table 2.
Clinicopathological findings in relation to budding grade of primary colorectal adenocarcinomas by H&E staining and immunohistochemistry (IHC)
| Budding grade (H&E) |
Budding grade (IHC) |
|||||
|---|---|---|---|---|---|---|
| Low grade | High grade | P-value | Low grade | High grade | P-value | |
| Lymphatic invasion | ||||||
| Present | 47 | 33 | <0.001 | 9 | 71 | <0.001 |
| Absent | 54 | 5 | 36 | 23 | ||
| Venous invasion | ||||||
| Present | 68 | 35 | <0.01 | 23 | 80 | <0.001 |
| Absent | 33 | 3 | 22 | 14 | ||
| Lymph node metastasis | ||||||
| Present | 23 | 27 | <0.001 | 2 | 48 | <0.001 |
| Absent | 78 | 11 | 43 | 46 | ||
The degree of budding/sprouting was classified as low grade or high grade corresponding to 0–4 (grade 0 and grade 1) and ≥5 budding foci (grade 2 and grade 3) in one field, respectively.
Scoring for tumor budding/sprouting
Next, we considered budding-positive areas in our assessment of tumor budding/sprouting (Fig. 2a,b) and identified 51 (36.7%) low-score and 88 (63.3%) high-score tumors. A high score for budding-positive areas was significantly associated with greater wall penetration, increased lymphovascular invasion, and more frequent lymph node metastasis (Table 3).
Table 3.
Clinicopathological findings in relation to budding score in primary colorectal adenocarcinomas
| Budding score |
|||
|---|---|---|---|
| Low score (score <1) (n = 51) | High score (score ≥1) (n = 88) | P-value | |
| Tumor size | |||
| <5 cm | 38 | 59 | 0.360 |
| ≥5 cm | 13 | 29 | |
| pT-stage | |||
| pTis, pT1, pT2 | 33 | 25 | <0.001 |
| pT3, pT4 | 18 | 63 | |
| Lymphatic invasion | |||
| Present | 14 | 66 | <0.001 |
| Absent | 37 | 22 | |
| Venous invasion | |||
| Present | 28 | 75 | <0.001 |
| Absent | 23 | 13 | |
| Lymph node metastasis | |||
| Present | 6 | 44 | <0.001 |
| Absent | 45 | 44 | |
The association between budding score or grade and DFS was assessed in 114 patients who received curative resections. Disease-free survival was significantly shorter in patients with high budding scores or grades compared with that in patients with low budding scores or grades, respectively (P < 0.001 for budding scores and P = 0.002 for budding grade) (Fig. 2c). Thus, both budding score and grade revealed significant association with DFS. In this study, we used the budding score for analyses of budding mechanisms as tumor budding is assessed more precisely by budding grade and areas, although budding grade alone is more practical for daily diagnosis.
Scores for c-Met and p-c-Met at different tumor sites
We examined the relationship between the expression of c-Met or p-c-Met and the extent of tumor budding/sprouting to assess the role of c-Met signaling in tumor budding/sprouting. Carcinoma cells including budding cells expressed c-Met and p-c-Met in the cytoplasm and cell membrane, as reported in other tumors.(17,18) Representative images of different intensity scores for c-Met and p-c-Met are shown in Figure 3.
Fig 3.
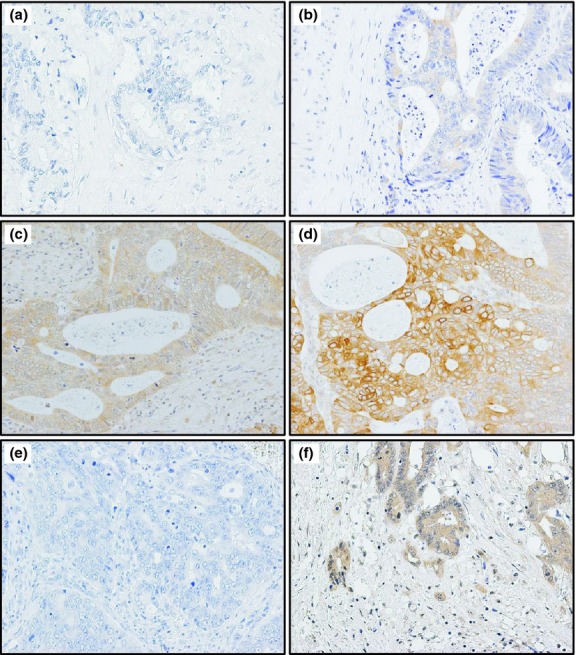
Representative images of c-Met expression in tissue sections of colorectal cancer by immunohistochemistry. (a) No c-Met expression in tumor cells (scored as 0). (b) Weak c-Met expression in tumor cells (scored as 1). (c) Moderate c-Met expression in tumor cells (scored as 2). (d) Strong c-Met expression in tumor cells forming nests near the invasive front (scored as 3). (e) No phosphorylated c-Met expression in tumor cells in superficial portion (scored as 0). (f) Moderate phosphorylated c-Met expression in tumor cells including budding cells at the invasive front (scored as 2).
Tumors with both low and high scores for tumor budding/sprouting showed significantly higher c-Met scores at the invasive front than in superficial portions of the tumors. Moreover, c-Met scores at the invasive front were significantly higher in tumors with high budding scores than those in tumors with low budding scores (P < 0.05). In contrast, c-Met scores in superficial portions were not significantly different between tumors with low and high scores for tumor budding/sprouting (P = 0.32) (Fig. 4a).
Fig 4.
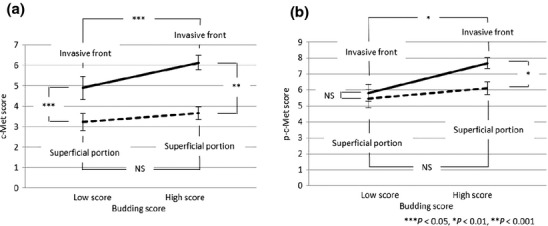
Comparison of c-Met (a) and phosphorylated c-Met (p-c-Met) scores (b) in different colorectal cancer tumor regions between tumors with high and low budding scores. NS, not significant.
Immunohistochemistry for p-c-Met showed similar results as staining for c-Met, except that p-c-Met scores were not significantly different between the invasive front and superficial portions of tumors with low-score budding (Fig. 4b). Tumor cells expressing c-Met and p-c-Met were observed more frequently in budding cells and tumor cell nests at or near the invasion front than superficial portions of tumors with high budding scores. This difference in distribution of p-c-Met-expressing cells was not evident in tumors with low budding scores.
Fluorescence in situ hybridization analysis
The FISH analysis for MET copy number showed occasional trisomy, polysomy, and disomy (Fig. 5a). Amplification was not observed in this study (n = 43 tumors). The MET gene copy number per cell was significantly higher at the invasive front than in the superficial portion of tumors in tumors with a high budding score. However, the copy number was less than 2.5 even at the invasive front of tumors with high-score budding, therefore no gene amplification was detected (Fig. 5b).
Fig 5.
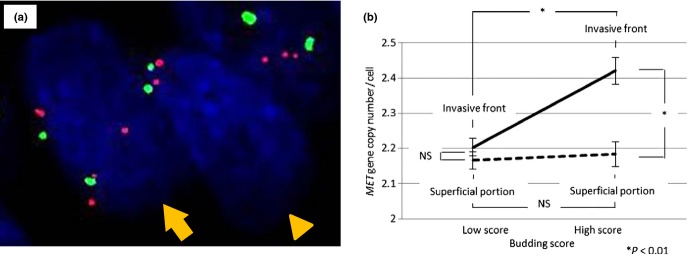
(a) Dual-color FISH assays with probes for MET (red) and chromosome 7 centromere (green) in colorectal cancer tissue. The MET gene copy number in the cells shown was two (arrowhead) and four (arrow). (b) Comparison of MET gene copy number per cell by FISH in different tumor regions between tumors with high and low budding scores. NS, not significant.
Univariate analysis
Among 114 tumors, univariate analysis identified significant associations between shorter DFS and budding score (high score), budding grades (high grades), lymphatic invasion (positive), venous invasion (positive), LN metastasis (positive), tumor size (≥5 cm), pathologic wall penetration (T3 and T4), p-c-Met score (high score), and MET gene copy number per cell (≥2.4) (Table 4).
Table 4.
Results of univariate analysis on postoperative disease-free survival in patients with surgically resected primary colorectal adenocarcinomas
| Factor | Disease-free survival (n = 114) |
||
|---|---|---|---|
| n | P-value | ||
| Budding grade (IHC) | Low grade | 41 | 0.002 |
| High grade | 73 | ||
| Budding score | Low score | 46 | <0.001 |
| High score | 68 | ||
| Lymphatic invasion | Present | 58 | 0.010 |
| Absent | 56 | ||
| Venous invasion | Present | 78 | 0.024 |
| Absent | 36 | ||
| Lymph node metastasis | Present | 35 | 0.006 |
| Absent | 79 | ||
| Tumor size | <5 cm | 86 | <0.001 |
| ≥5 cm | 28 | ||
| Wall penetration (pT) | Tis, T1, T2 | 57 | <0.001 |
| T3, T4 | 57 | ||
| c-Met score | Low score | 47 | 0.670 |
| High score | 67 | ||
| p-c-Met score | Low score | 35 | 0.030 |
| High score | 79 | ||
| MET gene copy number per cell | <2.4 | 24 | 0.140 |
| ≥2.4 | 11 | ||
Scores of c-Met and phosphorylated c-Met (p-c-Met) were classified as low or high corresponding to 0–4 and 6–12, respectively. IHC, immunohistochemistry.
Discussion
This study has shown that tumor budding/sprouting assessed by grade and area shows a strong correlation with clinicopathologically aggressive parameters in colorectal carcinoma. Although our assessment may not be useful for routine clinical practice, it is appropriate for examining the molecular mechanisms of tumor budding/sprouting. This is the first suggestion of a potential association between c-Met activation and formation of tumor budding/sprouting at the invasive front.
Morodomi et al.(19) and Ueno et al.(20) provided budding grades that can be used routinely for histopathologic diagnosis by examination of H&E sections. However, these grades have several limitations regarding objective assessment of tumor budding/sprouting. In some cases, tumor buds cannot be detected easily with H&E staining alone because stromal reaction, such as aggregation of active fibroblasts and/or histiocytes, is present at the invasive front and often masks the buds. Also, marked inflammation can obscure budding tumor cells.(3) Therefore, as in previous studies,(2,6,21–25) we assessed tumor budding/sprouting by IHC with anti-CK antibody to more accurately and objectively diagnose tumor budding/sprouting. We found that CK-IHC was very useful for the detection of single cancer cells or small cancer cell clusters embedded in fibrous stroma. One previous study(25) that included both H&E and CK-IHC showed a modest improvement in inter-observer variability with the latter.(3) We compared budding counts obtained with H&E to those obtained with CK-IHC and obtained significantly higher counts with the latter. Moreover, CK-IHC could identify tumors with shorter DFS among tumors assessed as low-grade budding by H&E alone. Thus, CK-IHC was useful for objective evaluation of budding grade.
In our study, the frequency of tumor budding/sprouting along the entire invasive front differed, even among tumors with the same budding grade. The majority of previous studies evaluated the budding grade only at the invasive front with the greatest amount of tumor budding/sprouting, although a few studies(26) also evaluated the proportion of budding-positive areas. The latest study by Horcic et al.(27) reported that one visual field is suboptimal to assess tumor budding because of heterogeneous biological features in CRC. Tumor buds are not homogeneously distributed along the invasive border. Therefore, Horcic et al. recommends that tumor budding assessment should be carried out using 10 high power fields to account for the biological variation within a histological section. We assessed tumor budding variation in terms of the frequency of budding along the invasive border instead of assessing 10 high power fields. In this way, we developed an original scoring system that includes both budding grade and area. A high budding score using our system was significantly correlated with a shorter DFS, and this correlation was slightly more significant than that obtained by assessing budding grade alone. These results suggest that the budding score is a predictive factor for recurrence after curative resection.
Previous studies have shown positive staining for c-Met by IHC in 60–79% of colorectal carcinomas(28,29) and MET gene amplification by FISH in 2.6% of carcinomas.(30) However, the relationship between c-Met and tumor budding/sprouting has not been explored fully. In this study, the expression and phosphorylation levels of c-Met were significantly higher at the invasive fronts than in superficial portions of tumors in the high-score budding group. No MET gene amplification was detected, although a significant increase in the MET gene copy number per cell was seen at the invasive front of the high-score budding group. Metastatic colon carcinoma tissues in the liver showed the gene copy number similar to that at the invasive front (n = 3, 2.39 ± 0.16; preliminary study, data not shown). However, the gene copy numbers were less than 2.5 in both metastatic liver tumors and invasive fronts of tumors with high-score budding, and thus their biological or clinical significance in c-Met expression is still unknown and needs to be clarified in the future. Therefore, in this study, we consider that post-transcriptional activation of c-Met by phosphorylation may be involved in tumor budding/sprouting at invasive fronts. This phosphorylation of c-Met may be induced by HGF produced by stromal cells. In colorectal carcinoma, HGF was actually detected in mesenchymal cells in association with c-Met expression in carcinoma cells.(31) A previous study showed that c-Met was expressed in tumor cells and stromal HGF at a significantly higher level in type C invasive tumors than in type A and B non-invasive tumors based on Noguchi's classification for lung adenocarcinomas.(10) In another study using 3-D co-cultures of a ductal breast carcinoma in situ cell line and HGF-secreting fibroblasts, fibroblast-derived HGF promoted progression of in situ ductal carcinoma to invasive carcinoma.(32) These results indicate that HGF produced by active fibroblasts might be one of the factors triggering the transition of non-invasive tumors to invasive adenocarcinomas. Therefore, the expression and phosphorylation of c-Met at tumor invasive fronts observed in our study may be related to tumor–stroma interactions. Furthermore, the presence of more p-c-Met expressing cells at the invasion front in the high-score budding group suggested an association between the activated c-Met signaling pathway and tumor budding/sprouting. Activation of c-Met in tumors leads to cell proliferation, angiogenesis, invasion, and cell migration, including cell scattering.(10–12) The presence of tumor buds is considered to represent epithelial–mesenchymal transition,(33) a process frequently associated with increased expressions of molecules relevant to tumor invasion, such as MMPs, β-catenin, and laminin 5γ2 in tumor cells, and stimulation of the Wnt signaling pathway.(33) In our study, p-c-Met expression was frequently observed not only in tumor buds but also in larger tumor nests near the invasion front, suggesting that additional factor/s may be needed for cells undergoing tumor budding/sprouting. Our finding that the p-c-Met score was associated with postoperative recurrence is also of potential clinical significance. Future studies should examine whether c-Met inhibition reduces the invasiveness or recurrence of colorectal carcinoma.
Acknowledgments
We thank Ms. M. Onitsuka, Ms. K. Yano, Ms. T. Nakamura, and Mr. S. Matsumoto for excellent technical assistance in IHC and FISH. This work was supported in part by grants from the Grants-in-Aid for Scientific Research from the Ministry of Education, Culture, Sports, Science, and Technology (No. 24590495) and the Research Center for Advanced Molecular Medicine, Fukuoka University.
Disclosure Statement
The authors have no conflict of interest.
References
- 1.Suzuki H, Masuda N, Shimura T, et al. Nuclear beta-catenin expression at the invasive front and in the vessels predicts liver metastasis in colorectal carcinoma. Anticancer Res. 2008;28:1821–30. [PubMed] [Google Scholar]
- 2.Prall F, Nizze H, Barten M. Tumour budding as prognostic factor in stage I/II colorectal carcinoma. Histopathology. 2005;47:17–24. doi: 10.1111/j.1365-2559.2005.02161.x. [DOI] [PubMed] [Google Scholar]
- 3.Mitrovic B, Schaeffer DF, Riddell RH, Kirsch R. Tumor budding in colorectal carcinoma: time to take notice. Mod Pathol. 2012;25:1315–25. doi: 10.1038/modpathol.2012.94. [DOI] [PubMed] [Google Scholar]
- 4.Park KJ, Choi HJ, Roh MS, Kwon HC, Kim C. Intensity of tumor budding and its prognostic implications in invasive colon carcinoma. Dis Colon Rectum. 2005;48:1597–602. doi: 10.1007/s10350-005-0060-6. [DOI] [PubMed] [Google Scholar]
- 5.Puppa G, Senore C, Sheahan K, et al. Diagnostic reproducibility of tumour budding in colorectal cancer: a multicentre, multinational study using virtual microscopy. Histopathology. 2012;61:562–75. doi: 10.1111/j.1365-2559.2012.04270.x. [DOI] [PubMed] [Google Scholar]
- 6.Kazama S, Watanabe T, Ajioka Y, Kanazawa T, Nagawa H. Tumour budding at the deepest invasive margin correlates with lymph node metastasis in submucosal colorectal cancer detected by anticytokeratin antibody CAM5.2. Br J Cancer. 2006;94:293–8. doi: 10.1038/sj.bjc.6602927. [DOI] [PMC free article] [PubMed] [Google Scholar]
- 7.Maulik G, Shrikhande A, Kijima T, Ma PC, Morrison PT, Salgia R. Role of the hepatocyte growth factor receptor, c-Met, in oncogenesis and potential for therapeutic inhibition. Cytokine Growth Factor Rev. 2002;13:41–59. doi: 10.1016/s1359-6101(01)00029-6. [DOI] [PubMed] [Google Scholar]
- 8.Zeng ZS, Weiser MR, Kuntz E, et al. c-Met gene amplification is associated with advanced stage colorectal cancer and liver metastases. Cancer Lett. 2008;265:258–69. doi: 10.1016/j.canlet.2008.02.049. [DOI] [PMC free article] [PubMed] [Google Scholar]
- 9.Janjigian YY, Tang LH, Coit DG, et al. MET expression and amplification in patients with localized gastric cancer. Cancer Epidemiol Biomarkers Prev. 2011;20:1021–7. doi: 10.1158/1055-9965.EPI-10-1080. [DOI] [PMC free article] [PubMed] [Google Scholar]
- 10.Tachibana K, Minami Y, Shiba-Ishii A, et al. Abnormality of the hepatocyte growth factor/MET pathway in pulmonary adenocarcinogenesis. Lung Cancer. 2012;75:181–8. doi: 10.1016/j.lungcan.2011.07.008. [DOI] [PubMed] [Google Scholar]
- 11.Trusolino L, Comoglio PM. Scatter-factor and semaphorin receptors: cell signalling for invasive growth. Nat Rev Cancer. 2002;2:289–300. doi: 10.1038/nrc779. [DOI] [PubMed] [Google Scholar]
- 12.Wielenga VJ, van der Voort R, Taher TE, et al. Expression of c-Met and heparan-sulfate proteoglycan forms of CD44 in colorectal cancer. Am J Pathol. 2000;157:1563–73. doi: 10.1016/S0002-9440(10)64793-1. [DOI] [PMC free article] [PubMed] [Google Scholar]
- 13.Takeuchi H, Bilchik A, Saha S, et al. c-MET expression level in primary colon cancer: a predictor of tumor invasion and lymph node metastases. Clin Cancer Res. 2003;9:1480–8. [PubMed] [Google Scholar]
- 14.Rectum JSfCotCa. Japanese Classification of Colorectal carcinoma. 8th edn. Tokyo: Kanehara; 2013. [Google Scholar]
- 15.McCarty KS, Jr, Miller LS, Cox EB, Konrath J, McCarty KS., Sr Estrogen receptor analyses. Correlation of biochemical and immunohistochemical methods using monoclonal antireceptor antibodies. Arch Pathol Lab Med. 1985;109:716–21. [PubMed] [Google Scholar]
- 16.Matsumoto S, Nabeshima K, Kamei T, et al. Morphology of 9p21 homozygous deletion-positive pleural mesothelioma cells analyzed using fluorescence in situ hybridization and virtual microscope system in effusion cytology. Cancer Cytopathol. 2013;121:415–22. doi: 10.1002/cncy.21269. [DOI] [PubMed] [Google Scholar]
- 17.Koga K, Hamasaki M, Kato F, et al. Association of c-Met phosphorylation with micropapillary pattern and small cluster invasion in pT1-size lung adenocarcinoma. Lung Cancer. 2013;82:413–9. doi: 10.1016/j.lungcan.2013.09.005. [DOI] [PubMed] [Google Scholar]
- 18.Moschetta M, Basile A, Ferrucci A, et al. Novel targeting of phospho-cMET overcomes drug resistance and induces antitumor activity in multiple myeloma. Clin Cancer Res. 2013;19:4371–82. doi: 10.1158/1078-0432.CCR-13-0039. [DOI] [PubMed] [Google Scholar]
- 19.Morodomi T, Isomoto H, Shirouzu K, Kakegawa K, Irie K, Morimatsu M. An index for estimating the probability of lymph node metastasis in rectal cancers. Lymph node metastasis and the histopathology of actively invasive regions of cancer. Cancer. 1989;63:539–43. doi: 10.1002/1097-0142(19890201)63:3<539::aid-cncr2820630323>3.0.co;2-s. [DOI] [PubMed] [Google Scholar]
- 20.Ueno H, Murphy J, Jass JR, Mochizuki H, Talbot IC. Tumour ‘budding’ as an index to estimate the potential of aggressiveness in rectal cancer. Histopathology. 2002;40:127–32. doi: 10.1046/j.1365-2559.2002.01324.x. [DOI] [PubMed] [Google Scholar]
- 21.Ohtsuki K, Koyama F, Tamura T, et al. Prognostic value of immunohistochemical analysis of tumor budding in colorectal carcinoma. Anticancer Res. 2008;28:1831–6. [PubMed] [Google Scholar]
- 22.Shinto E, Jass JR, Tsuda H, et al. Differential prognostic significance of morphologic invasive markers in colorectal cancer: tumor budding and cytoplasmic podia. Dis Colon Rectum. 2006;49:1422–30. doi: 10.1007/s10350-006-0595-1. [DOI] [PubMed] [Google Scholar]
- 23.Shinto E, Mochizuki H, Ueno H, Matsubara O, Jass JR. A novel classification of tumour budding in colorectal cancer based on the presence of cytoplasmic pseudo-fragments around budding foci. Histopathology. 2005;47:25–31. doi: 10.1111/j.1365-2559.2005.02162.x. [DOI] [PubMed] [Google Scholar]
- 24.Losi L, Ponti G, Gregorio CD, et al. Prognostic significance of histological features and biological parameters in stage I (pT1 and pT2) colorectal adenocarcinoma. Pathol Res Pract. 2006;202:663–70. doi: 10.1016/j.prp.2006.05.003. [DOI] [PubMed] [Google Scholar]
- 25.Suzuki A, Togashi K, Nokubi M, et al. Evaluation of venous invasion by Elastica van Gieson stain and tumor budding predicts local and distant metastases in patients with T1 stage colorectal cancer. Am J Surg Pathol. 2009;33:1601–7. doi: 10.1097/PAS.0b013e3181ae29d6. [DOI] [PubMed] [Google Scholar]
- 26.Nakamura T, Mitomi H, Kanazawa H, Ohkura Y, Watanabe M. Tumor budding as an index to identify high-risk patients with stage II colon cancer. Dis Colon Rectum. 2008;51:568–72. doi: 10.1007/s10350-008-9192-9. [DOI] [PubMed] [Google Scholar]
- 27.Horcic M, Koelzer VH, Karamitopoulou E, et al. Tumor budding score based on 10 high-power fields is a promising basis for a standardized prognostic scoring system in stage II colorectal cancer. Hum Pathol. 2013;44:697–705. doi: 10.1016/j.humpath.2012.07.026. [DOI] [PubMed] [Google Scholar]
- 28.Abou-Bakr AA, Elbasmi A. c-MET overexpression as a prognostic biomarker in colorectal adenocarcinoma. Gulf J Oncolog. 2013;1:28–34. [PubMed] [Google Scholar]
- 29.De Oliveira AT, Matos D, Logullo AF, et al. MET Is highly expressed in advanced stages of colorectal cancer and indicates worse prognosis and mortality. Anticancer Res. 2009;29:4807–11. [PubMed] [Google Scholar]
- 30.Cappuzzo F, Varella-Garcia M, Finocchiaro G, et al. Primary resistance to cetuximab therapy in EGFR FISH-positive colorectal cancer patients. Br J Cancer. 2008;99:83–9. doi: 10.1038/sj.bjc.6604439. [DOI] [PMC free article] [PubMed] [Google Scholar]
- 31.Otte JM, Schmitz F, Kiehne K, et al. Functional expression of HGF and its receptor in human colorectal cancer. Digestion. 2000;61:237–46. doi: 10.1159/000007764. [DOI] [PubMed] [Google Scholar]
- 32.Jedeszko C, Victor BC, Podgorski I, Sloane BF. Fibroblast hepatocyte growth factor promotes invasion of human mammary ductal carcinoma in situ. Cancer Res. 2009;69:9148–55. doi: 10.1158/0008-5472.CAN-09-1043. [DOI] [PMC free article] [PubMed] [Google Scholar]
- 33.Zlobec I, Lugli A. Epithelial mesenchymal transition and tumor budding in aggressive colorectal cancer: tumor budding as oncotarget. Oncotarget. 2010;1:651–61. doi: 10.18632/oncotarget.199. [DOI] [PMC free article] [PubMed] [Google Scholar]