Abstract
The emergence of oligoclonal bands (OB) has been reported in patients with multiple myeloma (MM) after stem cell transplantation (SCT) or successful chemotherapy. However, their clinical relevance remains unclear. We reviewed the clinical records of MM patients from January 2006 to May 2014. Treatment response was evaluated by International Working Group (IMWG) criteria. Serum immunofixation tests were performed at least every 3 months if the patient achieved more than very good partial response (VGPR). Free light chain (FLC) and minimal residual disease measurement by multicolor flow cytometry (MFC) were performed to evaluate the response to treatment. Among the 163 patients included in the study, 40 developed OB. Detection rates of OB in patients with complete response (CR), VGPR and partial response (PR) or less were 51.8, 36.3 and 0%, respectively. Patients with OB showed better progression-free survival (PFS) and overall survival (OS) rates than those without OB (P = 0.028 and P < 0.001, respectively). However, if the patients were limited to ≥VGPR or CR, development of OB did not affect PFS (P = 0.621 and P = 0.646, respectively) or OS (P = 0.189 and P = 0.766, respectively). OB was observed in 60% of patients after SCT, and in 36.6% of patients with more than VGPR without SCT (P < 0.001). Patients with OB tended to have less minimal residual disease than those without OB (P = 0.054) and its presence may affect the stringent CR criteria. In conclusion, the emergence of OB was seen exclusively in patients with favorable responses, but its emergence per se could not be translated to improved survival.
Keywords: Free light chain, minimal residual disease, Multiple myeloma, Oligoclonal band, stem cell transplantation
Multiple myeloma (MM) is characterized by the production of monoclonal immunoglobulin and clonal proliferation of neoplastic plasma cells in bone marrow. According to the criteria defined by the International Myeloma Working Group (IMWG) in 2008, the definition of complete response (CR) in MM requires the absence of the original monoclonal protein in both serum and urine immunofixation electrophoresis (IFE).(1,2) The emergence of oligoclonal bands (OB) in serum and/or urine IFE different to those observed at diagnosis(3,4) has been reported with varying frequencies in patients with stem cell transplantation (SCT) or favorable response to chemotherapy, although its prognostic relevance remains unclear. A recent study showed that the presence of OB resulted in significantly longer progression-free survival (PFS) and overall survival (OS).(5) However, other investigators report that the presence of OB is not correlated with significant differences in overall or event-free survival.(6,7) Hence, the clinical significance of OB detected by IFE in patients with MM remains unclear.
Here, we retrospectively analyzed clinical records and results of serial serum and/or urine IFE of 180 patients with MM treated at our hospital to determine the frequency, clinical characteristics and prognostic impact of OB that developed after treatment. We also analyzed the effects of OB on the results of free light chain (FLC) assay, which may affect the stringent CR (sCR) criteria proposed by the IMWG.
Materials and Methods
We retrospectively reviewed the medical records of patients with MM admitted to the Department of Hematology/Oncology at Kameda Medical Center, Kamogawa, Japan, from January 2006 to May 2014. Diagnosis of myeloma and evaluation of treatment response were performed according to the IMWG criteria.(1,2) OB was defined as the presence of a serum and/or urine IFE monoclonal spike that was different from the original myeloma protein in heavy and/or light chains, as well as a different IFE migration pattern. IFE was performed at least every 3 months after obtaining very good partial response (VGPR) and then until confirmation of disease progression or relapse.
We analyzed minimal residual disease (MRD) of MM plasma cells in the bone marrow of patients in CR by six-color multiparameter flow cytometry (MFC), as described previously.(8,9) Briefly, erythrocyte lysed marrow samples were incubated with antibodies against CD19-PE, CD38 PE-Cy7, CD138 APC and CD45 APC-Cy7 for 20 min in the dark. The cells were washed and incubated with antibodies against CD19, CD38, CD138 and CD45 for 20 min in the dark. The cells were then fixed, permeabilized and incubated with 10 mL each of Kappa FITC and Lambda PE-Cy5 for 30 min at 4°C. They were then washed and analyzed using Beckman–Coulter software (Kaluza [Beckman Coulter, Fullerton, CA, USA]). Identification of plasma cells requires at least two markers (CD38 and either CD45 or CD138). Neoplastic plasma cells were further identified from normal plasma cells based on differential expression of CD19 and CD45. Patients were considered MRD-36) negative when <50 neoplastic plasma cells were detected by MFC in bone marrow samples at a sensitivity limit of 10−4. This retrospective study was approved by the Institutional Review Board of Kameda General Hospital and was performed in accordance with the Declaration of Helsinki.
Statistical analysis
Baseline characteristics were analyzed for significance of differences between two groups by anova or Student's t-test for continuous variables and Fisher's exact test for categorical variables. The results are shown as means ± SD, numbers (%), hazard ratios (HR) and 95% confidence intervals (CI). Data analysis was performed with Stata version 12.1 (Stata, College Station, TX, USA). All statistical test values were two-sided, and P < 0.05 was taken to indicate significance in all analyses.
Results
Characteristics and prevalence of oligoclonal bands
A total of 180 patients with myeloma were identified during the study period and 17 patients were excluded from the analysis due to lack of appropriate follow-up data. Therefore, 163 patients were selected for the analysis. Figure 1 shows representative results of serum protein electrophoresis and IFE in a patient with IgGκ MM who developed IgGλ and IgM OB. Table 1 lists the patient characteristics and treatments in patients with or without OB. All patients received at least one novel agent, including bortezomib, lenalidomide and/or thalidomide. A total of 40 patients received high-dose chemotherapy and autologous stem cell transplantation (auto-SCT). Two patients received both auto-SCT and allogeneic SCT.
Fig 1.
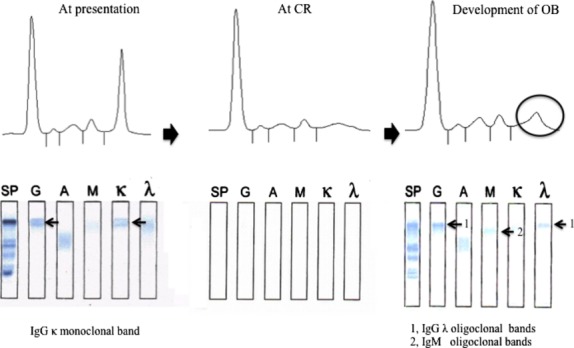
Development of oligoclonal band (OB) in a patient with IgGκ myeloma (Table 2, Patient No. 26). At presentation, serum protein electrophoresis (SPE) showed a sharp monoclonal spike corresponding to IgG and κ monoclonal band on immunofixation electrophoresis (IFE), which disappeared at complete response (CR). This patient developed a monoclonal spike 5 months after obtaining CR. IFE revealed IgGλ and IgM monoclonal bands (arrows 1 and 2, respectively) which were not observed at presentation.
Table 1.
Characteristics of patients with or without OB
| No. of patients n = 163 |
|||
|---|---|---|---|
| Characteristics | OB+ (%) | OB− (%) | P-value |
| n = 40 (24.5) | n = 123 (75.5) | ||
| Median age, year (range) | 68.5 (44–87) | 73.4 (46–89) | 0.014 |
| Male/Female | 11/29 | 63/60 | 0.029 |
| ISS classification: 1,2/3 | 18/22 | 60/63 | 0.815 |
| Heavy-chain subclass of OB | |||
| IgG | 15 (37.5) | 68 (55.3) | 0.061 |
| IgA | 16 (40.0) | 27 (22.0) | |
| Light chain only | 9 (22.5) | 28 (22.7) | |
| Light-chain isotype (%) | |||
| κ | 21 (52.5) | 73 (59.3) | 0.564 |
| λ | 19 (47.5) | 50 (40.7) | |
| Use of IMiD | 30 (75.0) | 89 (72.9) | 0.903 |
| Use of Bortezomib | 35 (87.5) | 101 (82.1) | 0.582 |
| Treatment response | |||
| Patients with ≤PR | 0 (0) | 76 (61.8) | <0.001 |
| Patients with VGPR | 12 (30.0) | 21 (17.1) | |
| Patients with CR | 28 (70.0) | 26 (21.1) | |
| Patients with SCT (n = 30) | 18/30 (60) | 12/30 (40.0) | <0.001 |
| Patients without SCT (n = 133) | 22/133 (16.5) | 111/133 (83.5) | |
| Abnormal FLC in patients with CR | 10/28 (39.3) | 4/26 (15.4) | 0.118 |
OB, Oligoclonal band; ISS, International staging system; IMiD, Immunomodulatory drug; PR, Partial response; VGPR, Very good partial response; CR, Complete response; SCT, Stem cell transplantation; FLC, Free light chain.
Among the 163 patients included in the analysis, 40 (24.5%) developed OB during the study period. Although age and male prevalence rate were significantly higher in patients with OB, there were no differences between the two groups in age, International Staging System (ISS) stage, heavy chain class, light chain isotype, and use of immunomodulatory drugs or bortezomib.
Myeloma responses better than VGPR and CR were achieved in 87 (53.3%) and 54 (33.1%) patients, respectively. None of the patients with less than PR developed OB, and OB developed in 36.3% (12/33) and 51.9% (28/54) of the patients with VGPR and CR, respectively. Among the 30 patients that received SCT, 18 (60.0%) developed OB, whereas only 12 of 133 who did not receive SCT developed OB. The emergence rate of OB was significantly higher in patients receiving SCT (P < 0.001).
As the presence of OB may result in an abnormal serum FLCκ/λ ratio, we examined the association between FLCκ/λ ratio and development of OB in 28 patients who achieved CR. Abnormal FLCκ/λ ratio was observed in 10 (35.7%) and 4 (15.3%) patients with and without OB, respectively, among those with CR (P = 0.118). Conversely, OB was detected in 10 of the 14 patients with an abnormal FLC ratio (71.4%) versus 18 of 40 (45.0%) with a normal serum FLC ratio (P = 0.164) among those with CR.
Prognostic implications of oligoclonal band after treatment
Next, we examined the prognostic impact of developing OB. The clinical outcome was compared between patients with and without OB. Figure 2 shows PFS and OS of all cohorts. The median PFS and OS of the patients with or without OB were 79.4 and 19.2 months (P=0.028), and not reached and 41.1 months, respectively. Consistent with previous studies, patients with OB showed better PFS and OS compared to those without OB. These observations indicated that the development of OB is a favorable prognostic factor for survival. However, as shown in Table 1, the development of OB was closely linked to favorable response, such as CR or VGPR, and, therefore, we compared PFS and OS among patients who achieved CR (Fig. 3). Median PFS and OS of CR patients with and without OB were not significantly different between the two groups (79.4 vs 80.1 months, respectively, P = 0.646; and not reached and not reached, respectively, P = 0.776). If the patients were analyzed better than VGPR, results were similar with CR patients (data not shown). These observations indicated that OB appeared exclusively in the patients with better than VGPR response; however, there was no correlation between emergence of an oligoclonal band and survival in these patients.
Fig 2.
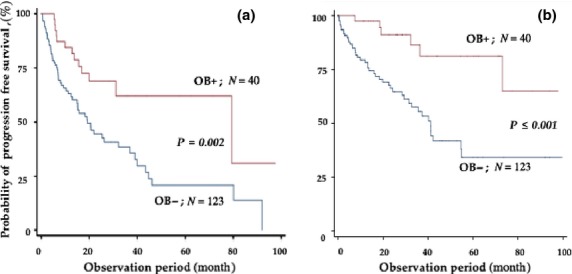
Progression-free survival (a) and overall survival (b) rates of all patients according to the presence or absence of oligoclonal band (OB).
Fig 3.
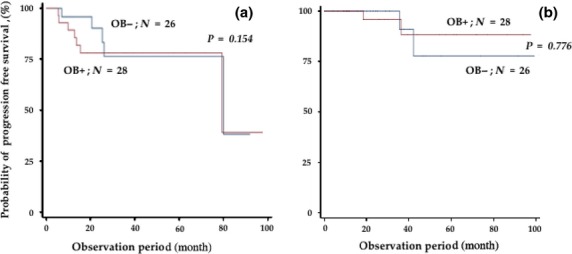
Progression-free survival (a) and overall survival (b) rates of patients who obtained complete response (CR) according to the presence or absence of oligoclonal band (OB).
We then analyzed the survival rates of the patients who received SCT according to the presence or absence of OB. With a median observation period of 39.4 months (range: 4.3–99.3 months), the presence of OB was not associated with either PFS or OS (20.0 vs 44.7 months, respectively, P = 0.543; and not reached vs not reached, respectively, P = 0.739) (Fig. 4).
Fig 4.
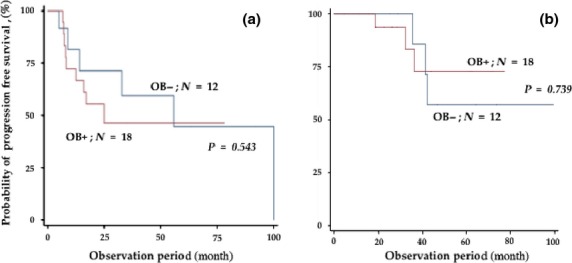
Progression-free survival (a) and overall survival rates (b) of patients receiving stem cell transplantation (SCT) according to the presence or absence of oligoclonal band (OB).
Table 2 shows the characteristics of the 28 patients with CR who developed OB. The number of patients with the original IgG, IgA and Bence–Jones type paraproteins were 8, 11 and 9, respectively. The number of patients with the primary OB (initial OB) of IgGκ, IgGλ, IgMκ and IgMλ were 16, 9, 1 and 2, respectively. The patients who developed OB showed a higher rate of abnormal FLCκ/λ ratio than those without OB, although the difference was not statistically significant (39.3 vs 15.4%, respectively, P = 0.118).
Table 2.
Characteristic of patients with OB
| No. | Age (year) | Sex | Initial reimen | SCT | Original M-protein | Primary OB | Other OBs | FLC ratio | Latency (months) | |
|---|---|---|---|---|---|---|---|---|---|---|
| Auto | Allo | |||||||||
| 1 | 69 | M | VAD | N | N | IgAκ | IgGκ | No | 1.01 | 79 |
| 2 | 72 | M | VAD | N | N | BJκ | IgGκ | No | 8.15 | 85 |
| 3 | 72 | M | DT | N | N | IgAλ | IgMκ | IgGλ | 0.90 | 64 |
| 4 | 49 | M | DT | Y | N | IgGκ | IgGλ | No | 1.99 | 51 |
| 5 | 66 | F | DT | Y | N | IgAκ | IgGκ | No | 1.10 | 35 |
| 6 | 64 | F | PAD | N | N | BJλ | IgGκ | IgGλ, IgG | 1.17 | 66 |
| 7 | 67 | M | VD | Y | N | IgAκ | IgGκ | IgGλ | 1.71 | 41 |
| 8 | 61 | F | MPV | Y | Y | IgGκ | IgGλ | No | 0.85 | 58 |
| 9 | 69 | M | MPV | N | N | IgGλ | IgMλ | No | 0.98 | 34 |
| 10 | 70 | F | VD | N | N | BJκ | IgGκ | IgGλ | 1.31 | 16 |
| 11 | 79 | F | VD | N | N | BJλ | IgMλ | IgGλ | 1.50 | 29 |
| 12 | 64 | M | VD | Y | N | IgAκ | IgGκ | IgGλ | 0.66 | 31 |
| 13 | 60 | F | VD | Y | Y | IgGκ | IgG-λ | No | 0.05 | 17 |
| 14 | 71 | M | VD | 0 | N | BJλ | IgGκ | No | 0.61 | 36 |
| 15 | 76 | F | VD | 0 | N | IgAλ | IgGκ | No | 1.50 | 26 |
| 16 | 61 | M | VD | 0 | N | BJ-λ | IgGκ | No | 1.87 | 9 |
| 17 | 61 | M | VCD | Y | N | IgGκ | IgGλ | No | 0.09 | 9 |
| 18 | 85 | M | MPV | 0 | N | IgAλ | IgGλ | No | 0.55 | 11 |
| 19 | 67 | M | VD | Y | N | IgGλ | IgGκ | IgAλ | 0.11 | 6 |
| 20 | 65 | F | VCD | Y | N | IgGκ | IgGλ | No | 1.20 | 5 |
| 21 | 86 | M | VD | N | N | BJ-λ | IgGλ | IgM | 0.58 | 1 |
| 22 | 78 | M | VD | N | N | IgAλ | IgGλ | No | 1.11 | 3 |
| 23 | 66 | M | PAD | Y | N | BJλ | IgGκ | IgGλ, IgA, IgM | 0.42 | 19 |
| 24 | 63 | F | PAD | Y | N | IgAκ | IgGκ | IgGλ, IgM, IgA | 2.43 | 14 |
| 25 | 60 | M | PAD | Y | N | IgAκ | IgGκ | IgGλ | 3.08 | 9 |
| 26 | 70 | M | VCD | Y | N | IgGκ | IgGλ | IgM | 0.36 | 11 |
| 27 | 50 | M | VCD | Y | N | IgAκ | IgGκ | IgGλ | 1.95 | 11 |
| 28 | 85 | M | VD | N | N | BJκ | IgGκ | No | 2.33 | 3 |
Normal range of FLCκ/λ ratio: (normal range, 0.26–1.65). M, male; F, female; N, no; Y, yes; SCT, stem cell traansplantation; OB, oligoclonal band; FLC, free light chain; VAD, vincritstin + adriamycine + dexamethasone; DT, dexamethasone + thalidoide; PAD, bortezomib + adriamycine + dexamethasone; VD, bortezomib + dexamethasone; MPV, melpharan + predonisolon + bortezomib; VCD, bortezomib + cyclophosphamide + dexamethasone.
We also analyzed the association between MRD assessed by multicolor FCM in patients who achieved CR and the development of OB. Although the patients with OB showed slightly lower levels of myeloma cells than those without OB (2.49 × 10⁻⁴ vs 4.15 × 10⁻⁴, respectively), there was no significant difference between the two groups (P = 0.054) (Fig. 5).
Fig 5.
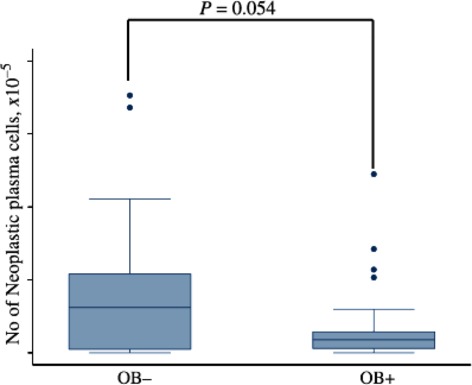
Residual plasma cell enumeration by multicolor flow cytometry in complete response (CR) patients with or without oligoclonal band (OB).
Discussion
Development of OB is a well-recognized phenomenon and is observed more frequently in patients after auto-SCT compared with conventional chemotherapy.(3,10–12) A recent study also showed that OB developed at a high rate after treatment with novel drugs.(4) However, the frequency of OB varies considerably from 6.6 to 73% in patients receiving SCT.(6,10,12) The varied rates may be attributed to a number of factors, including the definition of OB, frequency of immunofixation test, intraobserver inconsistency(13) and agents used for treatment. In addition, despite the number of studies on this issue, there are still controversies regarding the significance and impact on prognosis. Consistent with previous studies, OB was seen exclusively in patients with favorable myeloma responses (better than VGPR), and its development was associated with improved survival, as demonstrated in the present study. However, we also showed that the development of OB per se did not have an additional prognostic impact on either PFS or OS because no prolongation of PFS or OS was observed in the patients who achieved better than VGPR according to the development of OB. This was also confirmed in the patients receiving SCT, the majority of whom (90%) achieved responses better than VGPR. Similar observations were recently made by Zou et al.,(14) who found no significant differences in PFS or OS in 55 patients receiving SCT according to the presence or absence of OB. In contrast, Tovar et al. (2013) studied 211 patients receiving melphalan-based auto-SCT and found that development of OB was significantly associated with longer PFS and OS, although in their study the development of OB was not associated with the prolongation of PFS and OS in the patients undergoing auto-SCT.(5)
As OB was strongly associated with achievement of CR and was a major prognostic factor for longer survival, it is possible that the better survival of patients with OB simply reflects the depth of response. We measured the MRD by FCM in CR patients with or without OB. Although patients with OB tended to have less residual disease than those without OB (Fig. 5), definitive conclusions could not be drawn from the data.
The mechanism and prognostic impact of the emergence of OB on survival are still largely unknown. It may represent changes in antibody production of the original plasma cell clone or the emergence of a new malignant clone that was hidden at diagnosis. Some investigators consider OB as a manifestation of robust immune reconstitution after high-dose chemotherapy with SCT or effective therapy with novel agents.(5,12,15) However, patients receiving maintenance therapy who are assumed to be highly unresponsive to vaccination also developed OB.
Stringent CR was added as a deeper CR criterion in addition to immunofixation-negative CR in the Uniform Response Criteria proposed by IMWG. However, the presence of OB in CR patients may affect the application of sCR criteria. In this regard, Fernandez de Larrea et al.(5) report that OB in MM patients with CR frequently resulted in an abnormal FLCκ/λ ratio. In their study, the frequencies of abnormal FLC ratio in patients with and without OB were 72.7 and 26%, respectively. Table 2 reveals that individual patients with OB frequently showed abnormal FLC ratios despite the considerable latency after achieving CR. These observations indicated that 35.7% of patients with OB and 15.4% of patients without OB showed abnormal FLCκ/λ ratios. Although the difference between CR patients with and without OB was not statistically significant, its appearance could negatively affect FLCκ/λ normalization in CR patients. Therefore, the presence of OB should be considered for the application of sCR criteria.
In conclusion, we showed that the emergence of OB occurred exclusively in patients with favorable myeloma responses (more than VGPR) and was associated with prolonged survival. Patients with OB appeared to have fewer residual myeloma cells compared to those without OB. However, its development did not confer an additional survival benefit among the patients who achieved CR or better than VGPR. In addition, it is possible that the emergence of OB affects the sCR response criteria proposed by the IMWG.
Disclosure Statement
The authors have no conflict of interest to declare.
Authorship Statement
MF and KM designed the study and wrote the manuscript. MF, KS, KF, YS, MF, HS and MT provided clinical care and performed laboratory examinations. MF and KM collected and analyzed data, and performed statistical analyses. All authors had full access to all of the data in the study and had final responsibility for the decision to submit for publication.
References
- 1.Kyle RA, Rajkumar SV. Criteria for diagnosis, staging, risk stratification and response assessment of multiple myeloma. Leukemia. 2009;23:3–9. doi: 10.1038/leu.2008.291. [DOI] [PMC free article] [PubMed] [Google Scholar]
- 2.Durie BG, Harousseau JL, Miguel JS, et al. International uniform response criteria for multiple myeloma. Leukemia. 2006;20:1467–73. doi: 10.1038/sj.leu.2404284. [DOI] [PubMed] [Google Scholar]
- 3.Guikema JE, Vellenga E, Veeneman JM, et al. Multiple myeloma related cells in patients undergoing autologous peripheral blood stem cell transplantation. Br J Haematol. 1999;104:748–54. doi: 10.1046/j.1365-2141.1999.01233.x. [DOI] [PubMed] [Google Scholar]
- 4.Fernandez de Larrea C, Tovar N, Cibeira MT, et al. Emergence of oligoclonal bands in patients with multiple myeloma in complete remission after induction chemotherapy: association with the use of novel agents. Haematologica. 2011;96:171–3. doi: 10.3324/haematol.2010.030882. [DOI] [PMC free article] [PubMed] [Google Scholar]
- 5.Tovar N, de Larrea CF, Arostegui JI, et al. Natural history and prognostic impact of oligoclonal humoral response in patients with multiple myeloma after autologous stem cell transplantation: long-term results from a single institution. Haematologica. 2013;98:1142–6. doi: 10.3324/haematol.2013.084350. [DOI] [PMC free article] [PubMed] [Google Scholar]
- 6.Hovenga S, de Wolf JT, Guikema JE, et al. Autologous stem cell transplantation in multiple myeloma after VAD and EDAP courses: a high incidence of oligoclonal serum Igs post transplantation. Bone Marrow Transplant. 2000;25:723–8. doi: 10.1038/sj.bmt.1702194. [DOI] [PubMed] [Google Scholar]
- 7.Byrne E, Giles C, Andrews J, et al. Lack of correlation between emergence of an abnormal protein band or of oligoclonal bands and survival in patients with multiple myeloma achieving complete remission following autologous stem cell transplantation. Haematologica. 2011;96:e29. doi: 10.3324/haematol.2011.041509. [DOI] [PMC free article] [PubMed] [Google Scholar]
- 8.Rawstron AC, Orfao A, Beksac M, et al. Report of the European Myeloma Network on multiparametric flow cytometry in multiple myeloma and related disorders. Haematologica. 2008;93:431–8. doi: 10.3324/haematol.11080. [DOI] [PubMed] [Google Scholar]
- 9.de Tute RM, Jack AS, Child JA, et al. A single-tube six-colour flow cytometry screening assay for the detection of minimal residual disease in myeloma. Leukemia. 2007;21:2046–9. doi: 10.1038/sj.leu.2404815. [DOI] [PubMed] [Google Scholar]
- 10.Zent CS, Wilson CS, Tricot G, et al. Oligoclonal protein bands and Ig isotype switching in multiple myeloma treated with high-dose therapy and hematopoietic cell transplantation. Blood. 1998;91:3518–23. [PubMed] [Google Scholar]
- 11.Liu AJ, Zong H, Yang GZ, et al. Significance of oligoclonal bands after stem cell transplantation in multiple myeloma cases. Asian Pac J Cancer Prev. 2012;13:1483–6. doi: 10.7314/apjcp.2012.13.4.1483. [DOI] [PubMed] [Google Scholar]
- 12.Hall SL, Tate J, Gill D, Mollee P. Significance of abnormal protein bands in patients with multiple myeloma following autologous stem cell transplantation. Clin Biochem Rev. 2009;30:113–8. [PMC free article] [PubMed] [Google Scholar]
- 13.Caillon H, Dejoie T, Le Loupp AG, et al. Difficulties in immunofixation analysis: a concordance study on the IFM 2007-02 trial. Blood Cancer J. 2013;3:e154. doi: 10.1038/bcj.2013.51. [DOI] [PMC free article] [PubMed] [Google Scholar]
- 14.Zou D, An G, Zhu G, et al. Secondary monoclonal gammopathy of undetermined significance is frequently associated with high response rate and superior survival in patients with plasma cell dyscrasias. Biol Blood Marrow Transplant. 2014;20:319–25. doi: 10.1016/j.bbmt.2013.11.022. [DOI] [PubMed] [Google Scholar]
- 15.Rahlff J, Trusch M, Haag F, et al. Antigen-specificity of oligoclonal abnormal protein bands in multiple myeloma after allogeneic stem cell transplantation. Cancer Immunol Immunother. 2012;61:1639–51. doi: 10.1007/s00262-012-1220-x. [DOI] [PMC free article] [PubMed] [Google Scholar]


