

Abstract
Most studies evaluating Alzheimer’s disease (AD) biomarkers longitudinally have studied patients with mild cognitive impairment (MCI) who progress to AD; data on normal subjects are scarce. We studied which biomarkers best predict cognitive decline on the Alzheimer’s Disease Assessment Scale-Cognitive Subscale (ADAS-Cog) among those with normal cognition at baseline, and derived cut points to predict decline. We studied 191 subjects in the Alzheimer’s Disease Neuroimaging Initiative (ADNI) who had normal cognition at baseline, 2 + visits (mean follow-up 3.1 years), and data on neuropsychological tests, cerebrospinal fluid (CSF) biomarkers, and structural MRI. We used repeated measures linear regression of log ADAS-Cog on age, race, gender, education, APOE4 status, baseline biomarker values, and follow-up time; an interaction between biomarker and time assessed predictive power. Neuropsychological tests did not significantly predict ADAS-Cog decline, while both MRI variables and CSF biomarkers did; CSF markers were the strongest predictors. Optimal cut points for baseline CSF markers to distinguish decliners were < 220 pg/ml (Aβ42), ≥61 pg/ml (t-tau), ≥21 pg/ml (p-tau), ≥0.31 (t-tau/Aβ42), and ≥0.10 (p-tau/Aβ42). For progression to MCI/AD (n = 28), the best markers were t-tau, t-tau/Aβ42, and p-tau/Aβ42, with optimal cut points of 58, 0.31, and 0.08, respectively. The optimal cut points across all markers and cut points predicted decline in ADAS-Cog, as well as transition to MCI, with a 65% accuracy. Our findings support current models of AD progression and suggest it is feasible to establish biomarker criteria to predict cognitive decline in individuals with normal cognition. Larger studies will be needed to more accurately characterize optimal cut points.
Keywords: Biomarkers, cerebrospinal fluid, cognition, mild cognitive impairment
INTRODUCTION
There is increasing consensus among Alzheimer’s disease (AD) investigators that clinical dementia represents a late stage of illness emerging many years after the first development of pathological changes. Based on a growing body of biomarker evidence, Jack et al. [1] proposed a model for the temporal sequence of pathological and clinical changes, and a recent revision of this model incorporates additional new evidence [2]. The model establishes a hypothetical framework for biomarker changes in the course of disease, relying on results from several studies including the Alzheimer’s Disease Neuroimaging Initiative (ADNI). These longitudinal studies have established the utility of cerebrospinal fluid (CSF) and neuroimaging measures for identifying the presence of AD pathology and for predicting the progression from mild cognitive impairment (MCI) to AD dementia [3, 4].
Improving the diagnostic accuracy for AD and establishing the etiological diagnosis for MCI represent important advances, but there is an increasingly urgent need to develop predictors of AD during presymptomatic stages. Failures of recent late-stage trials of disease-modifying drugs targeting the amyloid-β peptide (Aβ42) may have been due to their application too late in the course of disease. Neuroimaging [4–6], CSF [7, 8], and pathological studies [9–12] suggest that changes in Aβ42 occur very early in the evolution of AD, and anti-Aβ42 therapeutics may not be effective in symptomatic stages of disease when Aβ42 accumulation has already plateaued.
Unfortunately, there is a paucity of data regarding biomarker changes in older adults with normal cognition at baseline. Gustafson et al. [13] and Stomrud et al. [14] studied small numbers of non-demented subjects (n = 55 and n = 57, respectively), and found that Aβ42 and tau predicted decline in the Mini-Mental Status Exam (MMSE) and clinically significant memory impairment over a 10-year and 3-year period, respectively. Jack et al. [15] studied 116 ADNI subjects with normal cognition at baseline over a one-year follow-up period and found an increase in t-tau among cognitively normal individuals but no changes in CSF Aβ42 or hippocampal volume. Lo et al. [16] also studied cognitively normal ADNI participants at baseline, but data on CSF biomarkers was limited to 36 normal subjects with a 3-year maximum follow-up. These studies support the concept of stage-specific biomarker changes, but models have not been developed to predict future decline among cognitively normal individuals in relation to biomarker values.
In the current study, we examined the potential for baseline values of neuropsychological tests, CSF biomarkers, and brain volumes to predict decline among individuals with normal cognition at baseline. We studied 191 ADNI subjects who were followed for a mean of 3.1 years, and had complete data on cognitive tests, neuroimaging, and CSF biomarkers. We determined which of these indices individually predicted decline on the Alzheimer’s Disease Assessment Scale-Cognitive Subscale (ADAS-Cog), and estimated cut points for the biomarkers that best predicted cognitive decline.
METHODS
Data used in the preparation of this article were obtained from the ADNI database (http://adni.loni.usc.edu/). The ADNI was launched in 2003 by the National Institute on Aging (NIA), the National Institute of Biomedical Imaging and Bioengineering (NIBIB), the Food and Drug Administration (FDA), private pharmaceutical companies and non-profit organizations, as a $60 million, 5-year public-private partnership. The primary goal of ADNI has been to test whether serial magnetic resonance imaging (MRI), positron emission tomography, other biological markers, and clinical and neuropsychological assessment can be combined to measure the progression of MCI and early AD. Determination of sensitive and specific markers of very early AD progression is intended to aid researchers and clinicians to develop new treatments and monitor their effectiveness, as well as lessen the time and cost of clinical trials.
The Principal Investigator of this initiative is Michael W. Weiner, MD, VA Medical Center and University of California–San Francisco. ADNI is the result of efforts of many co-investigators from a broad range of academic institutions and private corporations, and subjects have been recruited from over 50 sites across the U.S. and Canada. The initial goal of ADNI was to recruit 800 subjects but ADNI has been followed by ADNI-GO and ADNI-2. To date these three protocols have recruited over 1,500 adults, ages 55 to 90, to participate in the research, consisting of cognitively normal older individuals, people with early or late MCI, and people with early AD. The follow up duration of each group is specified in the protocols for ADNI-1, ADNI-2, and ADNI-GO. Subjects originally recruited for ADNI-1 and ADNI-GO had the option to be followed in ADNI-2. For up-to-date information, see http://www.adni-info.org/.
All ADNI CSF samples are collected according to a standard protocol (http://www.adni-info.org/Scientists/Pdfs/CSFBiomarkerTestInstr.pdf) and are then sent to a central location for analysis (ADNI Biomarker Core, University of Pennsylvania Medical School) for analysis, using methods described in the literature [17]. Test-retest R-squares have been high at the ADNI Biomarker Core, typically on the order of 90% or higher, depending on the marker (http://www.alz.org/research/funding/partnerships/2013meeting/5-biomarkers-core-adni.pdf)
In the ADNI database, there were 391 subjects who were cognitively normal at baseline, and had two or more follow-up visits. Of these, 191 had complete data on cognitive tests, APOE status, CSF biomarker concentrations, and brain volumetric measurements at baseline, as well as ADAS-Cog scores over time. These subjects were included in the study (Table 1).
Table 1.
Descriptive statistics, baseline values for patients normal at baseline (n = 191)
| All (n = 191) | No Conversion (n = 163) | Conversion to MCI or AD (n = 28) | p value conversion versus no conversion | |
|---|---|---|---|---|
| Age, years | 74.5 ± 5.5 | 74.3 ± 5.5 | 75.9 ± 5.2 | 0.16 |
| Male gender, n (%) | 98 (51%) | 82 (50%) | 16 (57%) | 0.50 |
| White, n (%) | 178 (93%) | 155 (95%) | 23 (82%) | 0.01 |
| Years schooling | 16.1 ± 2.7 | 16.1 ± 2.8 | 15.7 ± 2.5 | 0.43 |
| APOE ε4 carriers | 44 (23%) | 37 (23%) | 7 (25%) | 0.79 |
| FAQ ≥ 1 | 18 (9%) | 12 (7%) | 6 (21%) | 0.02 |
| ADAS-cog Total | 6.3 ± 3.0 | 6.1 ± 3.1 | 7.2 ± 2.7 | 0.09 |
| Cognitive tests | ||||
| Mini-cog | 5.3 ± 0.9 | 5.4 ± 0.9 | 5.2 ± 0.9 | 0.27 |
| MMSE | 29.0 ± 1.1 | 29.0 ± 1.1 | 29.2 ± 0.8 | 0.44 |
| ANART, # errors | 9.8 ± 7.9 | 9.4 ± 7.6 | 12.3 ± 9.1 | 0.07 |
| AVLT trial 5 | 11.0 ± 2.4 | 11.2 ± 2.3 | 10.0 ± 2.3 | 0.01 |
| AVLT Short Recall | 8.1 ± 3.2 | 8.4 ± 3.2 | 6.6 ± 2.8 | 0.01 |
| Animal Fluency | 20.2 ± 5.5 | 20.5 ± 5.6 | 18.5 ± 4.7 | 0.07 |
| Trails A (secs) | 35.3 ± 11.8 | 34.8 ± 10.8 | 38.1 ± 16.6 | 0.18 |
| Trails B (secs) | 86.1 ± 42.1 | 84.7 ± 42.5 | 94.2 ± 39.4 | 0.28 |
| Logical memory | ||||
| Immediate | 13.8 ± 3.4 | 14.1 ± 3.3 | 12.3 ± 3.5 | 0.01 |
| Delayed | 13.0 ± 3.4 | 13.3 ± 3.2 | 11.2 ± 4.0 | 0.00 |
| Boston Naming | 27.9 ± 2.3 | 28.1 ± 2.2 | 26.9 ± 2.8 | 0.02 |
| Brain volume measures | ||||
| Whole-brain (mm3) | 1,059,037 ± 106,185 | 1,060,978 ± 107,004 | 1,047,738 ± 102,419 | 0.55 |
| Ventricle (mm3) | 35956 ± 19092 | 35233 ± 18900 | 40167 ± 20006 | 0.21 |
| L.Hippocampus (mm3) | 3618 ± 412 | 3631 ± 414 | 3546 ± 402 | 0.32 |
| R.Hippocampus (mm3) | 3670 ± 446 | 3688 ± 434 | 3564 ± 502 | 0.17 |
| Cerebrospinal fluid | ||||
| tau (pg/mL) | 71.4 ± 30.7 | 69.5 ± 30.3 | 82.3 ± 31.3 | 0.04 |
| p-tau (pg/mL) | 23.5 ± 11.6 | 22.8 ± 10.8 | 27.3 ± 15.1 | 0.06 |
| Aβ42 (pg/mL) | 218.4 ± 63.6 | 221.9 ± 63.5 | 197.5 ± 61.4 | 0.06 |
| tau/Aβ42 ratio | 0.38 ± 0.26 | 0.36 ± 0.25 | 0.48 ± 0.30 | 0.03 |
| p-tau/Aβ42 ratio | 0.13 ± 0.10 | 0.12 ± 0.09 | 0.17 ± 0.16 | 0.01 |
AD, Alzheimer’s disease; ADAS-Cog, Alzheimer’s Disease Assessment Scale-Cognitive Subscale; ANART, American National Adult Reading Test; AVLT, Rey Auditory Verbal Learning Test; FAQ, Functional Activities Questionnaire; MCI, mild cognitive impairment; MMSE, Mini-Mental Status Exam.
The cognitive tests for which there were complete data were the MMSE [18], Trails A and B [19], Animal Fluency [20], American National Adult Reading Test [21], Rey Auditory Verbal Learning Test [22], Boston Naming Test [23], and Weschsler Logical Memory [24]. We also included the Functional Activities Questionnaire [25] as a measure of the ability to perform instrumental activities of daily living. Complete or nearly complete data were also available for the CSF markers (Aβ42, t-tau, p-tau, t-tau/Aβ42, and p-tau/Aβ42). Three persons were missing data on t-tau, and these individuals were omitted in analyses of t-tau and the t-tau/Aβ42 ratio. For brain structure, data were available for total brain volume, ventricular volume, and right and left hippocampal volume. Five persons were missing data on hippocampal volume, and these individuals were omitted in the analyses for that biomarker.
ADAS-Cog is an integer ranging from 0 to 70 [26]; here we treated it as continuous. The mean score in our sample at baseline was 6.3 (s.d. 3.0). Figure 1 shows the distribution of ADAS-Cog scores at baseline (n = 191). Log[ADAS-Cog] was distributed more normally than ADAS-Cog itself, and this was used as the outcome for regression models. Conversion to MCI was relatively rare during follow-up (28/191, 15%), and we thus preferred a continuous variable as a more sensitive measure of decline than conversion to MCI. However, we also ran supplementary analyses using conversion to MCI as the outcome.
Fig. 1.
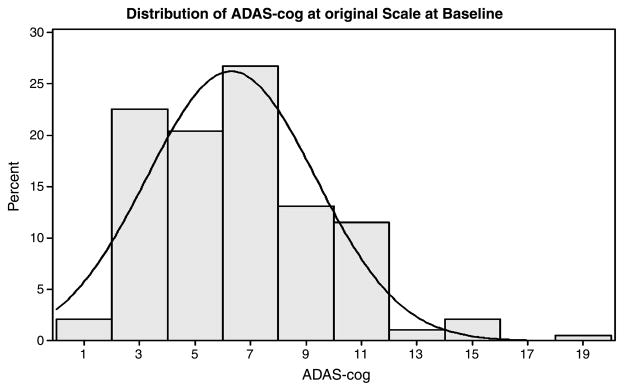
Distribution of ADAS-Cog at baseline.
We used repeated measures linear regression (PROC MIXED, SAS) of log[ADAS-Cog] on age, race, gender, years of education, APOE4 status, and baseline values of biomarkers (each separately), as well as a continuous variable for time in months (visits were every 6 months until 12 months, and yearly thereafter). The ability of a biomarker to predict decline was assessed by an interaction term between the baseline value of the biomarker and time. We used an exchangeable correlation matrix to account for the association between data points for the same subject. Subjects had a minimum of 2 visits and a maximum of 9 visits (median = 5). Follow-up continued until the last visit in these analyses.
To determine optimal cut points for variables which predicted an increase (worsening) of log[ADAS-Cog] over time, we iteratively separated the subjects into two groups using different cut points for the baseline values of each predictor, and ran separate models for each group. We did this until we found the cut point for each biomarker separately which best divided subjects into two groups: an affected group which showed the maximum possible decline during follow-up (always > 12%), while at the same time defining an unaffected group which showed no appreciable (always ≤ 3%) change over follow-up. These cut points were model-based and hence ‘adjusted for’ or ‘averaged over’ demographic variables such as gender, age, race, and education, as well as APOE status. An additional search for model-free cut points, that might incorporate more than one predictor, was conducted using a classification tree algorithm, Classification and Regression Trees (CART) [27], implemented in R [28]. The CART algorithm selects optimal cut points by recursively partitioning the observations to achieve the maximum reduction in the Gini index, a measure of disparity between the predicted and observed values. The CART cut points were not adjusted for demographic covariates; however, we also tried adding dichotomous demographic variables for age, gender, race, and education to the CART trees.
We conducted supplementary analyses, using survival analysis (SAS PHREG), in which the outcome was defined as a transition to MCI (n = 25) or AD (n = 3) during follow-up (dichotomous outcome). The same set of predictor variables was used as in the ADAS-Cog analysis. Time in this analysis was follow-up time. Follow-up in these analyses stopped at last visit, or at time of transition. The predictive value of the baseline biomarker was assessed by its p-value in the model. Optimal cut points for predicting progression to MCI or AD were determined by simple trial and error using cut points suggested by the survival analysis (after dichotomizing biomarkers to maximize the odds ratio for transition to MCI or AD), and also by the use of the same CART algorithm described above.
RESULTS
Table 1 provides descriptive variables for the data set. The 191 individuals averaged 3.1 years of follow-up (sd 2.3). Overall, ADAS-Cog scores worsened an average of 7.5% over 3 years (p = 0.0007), adjusted for covariates (Table 2). Forty-four (23%) individuals had ADAS-Cog total scores which increased by 3 or more points (1 s.d.) over follow-up (32% increase over 3 years, based on model prediction).
Table 2.
Estimated parameters from regression model for change in log ADAS-Cog over follow-up, for those normal at baseline
| Effect | Parameter estimate | Difference per 1-unit increase, % | p value |
|---|---|---|---|
| Age, 10 years | 0.15 ± 0.05 | 16.1 | 0.0031 |
| Male gender | 0.19 ± 0.06 | 20.5 | 0.0009 |
| Race, white | 0.05 ± 0.11 | 4.9 | 0.6528 |
| Education, years | −0.03 ± 0.01 | −3.1 | 0.0023 |
| APOE ε4 carriers | 0.14 ± 0.06 | 14.9 | 0.0273 |
| Visit time (in months) | 0.002 ± 0.00 | 0.2 | 0.0007 |
Dividing the group into decliners and non-decliners (ADAS-Cog change >0 versus ≤0), 88 (46%) subjects declined over time, while 103 (54%) did not. Based on the model, the predicted increase in ADAS-Cog over three years was 24% (<0.0001) for the decliners, and the predicted decrease among non-decliners was 10% (p = 0.0007). Through follow-up, 163 patients remained classified as cognitively normal while 25 and 3 patients converted to MCI and AD, respectively.
Table 2 illustrates results for the basic model with demographic variables at baseline, APOE status, and the variable for time of follow-up. Greater age at baseline, male gender, lower education, and presence of the APOE4 variant predicted higher (worse) ADAS-Cog scores over all follow-up times. Race was not a significant predictor of ADAS-Cog (partly due to the small number of non-whites), but was nevertheless retained in all models. The variable for time reflects change in ADAS-Cog over follow-up. There was a significant worsening over time, reflected in a positive coefficient for the time variable, which was highly significant.
Table 3 summarizes those predictors which interacted significantly (at p ≤ 0.05) with the time variable, indicating a significant difference in change over time between those with different baseline levels of these variables. In all cases, the direction of the interaction conformed to what would be expected, i.e., those with lower values of Aβ42 worsened on ADAS-Cog over time more than those with higher values of Aβ42. In general the cognitive tests at baseline did not predict cognitive decline, with the exception of category fluency, which had borderline significance (p = 0.05). Three of four variables for brain structure at baseline all predicted decline, with p-values of about 0.01. The strongest predictors of decline, with the lowest p-values for the interaction term, were the CSF biomarkers Aβ42, p-tau, and p-tau/Aβ42 (p = 0.0007, 0.006 and 0.003, respectively). CSF t-tau and t-tau/Aβ42 also predicted decline (p = 0.04 and 0.01, respectively) but less robustly than other CSF measures.
Table 3.
Summary of interaction models*
| Interaction Terms | p value# |
|---|---|
| Cognitive test | |
| Animal Fluency*visit | 0.05 |
| Brain volumetric measures | |
| Whole-brain volume*visit | 0.02 |
| L hippocampal volume*visit (n = 186) | 0.02 |
| R hippocampal volume*visit (n = 186) | 0.008 |
| Cerebrospinal fluid | |
| tau*visit (n = 188) | 0.04 |
| p-tau*visit | 0.006 |
| Aβ42*visit | 0.0007 |
| tau/Aβ42*visit (n = 188) | 0.01 |
| p-tau/Aβ42*visit | 0.003 |
These models included an interaction term between the marker and the variable for time. The p value is the p-value of the interaction term. A significant interaction means that the decline over time depends on the level of the baseline value of the biomarker.
Table 4 shows the optimal cut points and the predicted change in ADAS-Cog scores over 3 years for different biomarkers, each considered separately. The cut points were chosen to divide subjects into two groups: those whose cognition got worse over follow-up and those who did not. We defined these two groups as 1) those whose ADAS-Cog scores worsened >10% over time, and 2) those without appreciable change in ADAS-Cog scores over time. An additional search for cut points without using the regression model, and potentially incorporating more than one predictor, was conducted using CART. The search led to the cut points using t-tau and right hippocampal volume, which best predicted decline versus non-decline with 65% accuracy, 74% sensitivity, and 57% specificity. Those with t-tau ≥85 and those with 52 ≤ t-tau <85 and right hippocampal volume <3900 mm3 were predicted to decline, while those with the converse were predicted to not decline. Adding demographic variables to the cut points did not improve prediction.
Table 4.
Predicted 3-year change in ADAS-cog stratified by optimal cut points of predictors*
| 3-year % Change in ADAS-Cog | p value | |
|---|---|---|
| Cognitive test | ||
| Animal fluency | ||
| <22 (n = 110) | 12.4 | <0.0001 |
| ≥22 (n = 81) | −0.2 | 0.96 |
| Brain volumetric measures | ||
| Whole-brain volume | ||
| <1,080,000mm3 (n = 104) | 14.8 | <0.0001 |
| ≥1,080,000mm3 (n = 87) | 0 | 0.99 |
| L-hippocampal volume, mm (n = 186) | ||
| <3,600 mm3 (n = 88) | 14.2 | <0.0001 |
| ≥3,600 mm3 (n = 98) | 2.1 | 0.45 |
| R hippocampal volume, mm (n = 186) | ||
| <3,700 mm3 (n = 95) | 13.5 | <0.0001 |
| ≥3,700 mm3 (n = 91) | 1.9 | 0.51 |
| Cerebrospinal Fluid | ||
| Total tau (n = 188) | ||
| ≥61 (n = 91) | 13.6 | <0.0001 |
| <61 (n = 91) | 1.3 | 0.68 |
| p-tau | ||
| ≥21 (n = 89) | 13.1 | <0.0001 |
| <21 (n = 102) | 1.4 | 0.64 |
| Aβ42 | ||
| <220 (n = 90) | 16.7 | <0.0001 |
| ≥220 (n = 101) | −0.2 | 0.95 |
| Total tau/Aβ42 ratio (n = 188) | ||
| ≥0.31 (n = 89) | 16.0 | <0.0001 |
| <0.31 (n = 99) | 0.1 | 0.98 |
| p-tau/Aβ42 ratio | ||
| ≥0.10 (n = 85) | 16.1 | <0.0001 |
| <0.10 (n = 106) | 0.4 | 0.88 |
Based on iteratively choosing cut points for each individual marker, and running survival analyses for each of the two resulting groups, in which 3-year percent change is predicted via the coefficient for ‘time’. All models adjusted for age, race, gender, education, and APOE status.
In supplementary analyses, we modeled the transition to MCI or AD among those normal at baseline. We found that t-tau (p = 0.03), t-tau/Aβ42 (p = 0.06), and p-tau/Aβ42 (p = 0.04), were the only significant (or borderline significant) predictors of transition to MCI/AD. We then searched for optimal cut points using the model. The model-based optimal cut points were reasonably similar to the optimal cut points associated with worsening on ADAS-Cog, i.e., t-tau ≥ 58, t-tau/Aβ42 ≥ 0.31, and p-tau/Aβ42 ≥ 0.08. The rate ratios for those with levels higher than the cut points vs. those below the cut points were 2.88 (p = 0.04), 3.72 (p = 0.007), and 1.57 (p = 0.36), respectively, suggesting that the t-tau/Aβ42 ratio was the marker for which the most discriminatory cut point could be derived to differentiate persons with greatest risk of transition to MCI or AD. The above results did not change when we omitted the 3 cases in which normal subjects progressed directly to AD. Trying various cut points of t-tau/Aβ42 (not model-based, without adjusting for demographics), we found that a cut point of t-tau/Aβ42 ≥ 0.34 was best, predicting transition to MCI with 65% accuracy, 68% sensitivity, and 64% specificity. Using additional biomarker predictors or demographics did not improve this prediction.
DISCUSSION
Development of tools to predict AD represents an essential step in therapeutic strategies to ameliorate, delay, or prevent disease. Recent advances in the application of biomarkers have changed our conceptualization of early cognitive decline, and MCI due to AD has emerged as a specific etiological diagnosis [29]. We also recognize, however, that even the earliest symptomatic stages likely emerge only after AD pathology has advanced over the course of many years [1, 2]. Changes in CSF markers, in vivo amyloid imaging, and functional imaging studies have been demonstrated in groups at high risk for AD [1, 2], but to date we cannot accurately predict development of cognitive decline in asymptomatic individuals. While longer follow-up in larger cohorts will be needed to establish reliable criteria, our findings suggest that predicting decline in cognitively normal individuals may be possible using currently available biomarkers.
In this study, we emphasize ADAS-Cog as our main outcome measure rather than transition from normal to MCI or AD. The latter, while arguably preferable because of the clearly defined clinical endpoint, was less powerful and less sensitive than analyses of ADAS-Cog because transitions were relatively rare (15%) and because transition is a dichotomous rather than a continuous measure. Among those who were judged to be cognitively normal at baseline, the strongest predictors of decline on the ADAS-Cog were CSF biomarkers, but volumetric MRI measures were also predictive. Among cognitive tests, only category fluency reached borderline significance.
Our data suggest it may be possible to define cut points for baseline values of predictive biomarkers which separate cognitively normal individuals into those predicted and not predicted to decline cognitively over time. The cutpoints suggested here are based on results from the single centralized ADNI laboratory [17]. An inter-laboratory comparison, including the ADNI central laboratory, using uniform methods, suggested reasonably low intra and inter-lab variability [30]. However our suggested cutpoints may not be applicable to other labs using different collection and analysis procedures.
Few such cut points have been published in the literature, and most focus on differentiating AD patients versus either MCI or normal subjects. Shaw et al. [31] published cut points for differentiating normal subjects from AD patients, based on the same central ADNI lab used here. These cut points for Aβ42, t-tau, p-tau, t-tau/Aβ42, and p-tau/Aβ42 were < 192 pg/ml, > 93 pg/ml, > 23 pg/ml, > 0.39, and 0.10, respectively. Our cut points for predicting decline in ADAS-Cog among cognitively normal individuals were in most cases less extreme (Aβ42 < 220 pg/ml, t-tau ≥ 61 pg/ml, t-tau/Aβ42 > 0.30, p-tau/Aβ42 ≥ 0.10). In general, these cut points tended to divide the group approximately in half, which is logical given that ADAS-Cog scores worsened in about half over time, while the other half remained unchanged or improved. Our best cut points based on transition to MCI or AD were also less extreme (t-tau > 58 pg/ml, p-tau ≥ 21 pg/ml, t-tau/Aβ42 > 0.31, and p-tau/Aβ42 > 0.08) than those that discriminate individuals with AD from those with normal cognition or MCI. This finding might be expected in that those who have already transitioned to MCI as a group are expected to have worse values of biomarkers than normal individuals, and cut points for further transition to AD might be expected to be more extreme. It is interesting to note that baseline CSF measures incorporating Aβ42 (i.e., Aβ42 level and p-tau/Aβ42 ratio) most strongly predicted decline on the ADAS-Cog while CSF tau levels played a greater role in predicting transitions from normal cognition to MCI or AD. This suggests that Aβ42 may serve as an early marker of initial cognitive decline, but tau may be a better predictor of later clinical progression. This analysis was based on very small numbers of transitions (25 MCI, 3 AD) and warrants further examination. Nevertheless, our findings are consistent with hypothetical models in which changes in tau reflect a later stage of AD progression than Aβ42.
Future studies over longer periods in larger cohorts should be able to more accurately determine optimal cut points to predict initial cognitive decline as well as transition of cognitively normal individuals to MCI and AD. It is encouraging to note that reasonably accurate predictions appear feasible using commonly available biomarkers. Refinement of these studies as well as incorporation of additional biomarkers will support the design of trials that push interventions to asymptomatic stages of AD during which they may be more effective in modifying the course of disease.
Acknowledgments
Data collection and sharing for this project was funded by the Alzheimer’s Disease Neuroimaging Initiative (ADNI) (National Institutes of Health Grant U01 AG024904). ADNI is funded by the National Institute on Aging, the National Institute of Biomedical Imaging and Bioengineering, and through generous contributions from the following: Alzheimer’s Association; Alzheimer’s Drug Discovery Foundation; BioClinica, Inc.; Biogen Idec Inc.; Bristol-Myers Squibb Company; Eisai Inc.; Elan Pharmaceuticals, Inc.; Eli Lilly and Company; F. Hoffmann-La Roche Ltd and its affiliated company Genentech, Inc.; GE Healthcare; Innogenetics, N.V.; IXICO Ltd.; Janssen Alzheimer Immunotherapy Research & Development, LLC.; Johnson & Johnson Pharmaceutical Research & Development LLC.; Medpace, Inc.; Merck & Co., Inc.; Meso Scale Diagnostics, LLC.; NeuroRx Research; Novartis Pharmaceuticals Corporation; Pfizer Inc.; Piramal Imaging; Servier; Synarc Inc.; and Takeda Pharmaceutical Company. The Canadian Institutes of Health Research is providing funds to support ADNI clinical sites in Canada. Private sector contributions are Rev November 7, 2012 facilitated by the Foundation for the National Institutes of Health (http://www.fnih.org/). The grantee organization is the Northern California Institute for Research and Education, and the study is coordinated by the Alzheimer’s Disease Cooperative Study at the University of California, San Diego. ADNI data are disseminated by the Laboratory for Neuro Imaging at the University of California, Los Angeles.
This research was also supported by NIH grants P30 AG010129 and K01 AG030514. This work was also supported by an NIH Center Grant for the Emory Alzheimer’s Disease Research Center, and by a National Institute on Aging (NIA) Grant (U01 AG016976) to the National Alzheimer’s Coordinating Center.
Footnotes
Authors’ disclosures available online (http://www.j-alz.com/disclosures/view.php?id=2055).
References
- 1.Jack CR, Jr, Knopman DS, Jagust WJ, Shaw LM, Aisen PS, Weiner MW, Petersen RC, Trojanowski JQ. Hypothetical model of dynamic biomarkers of the Alzheimer’s pathological cascade. Lancet Neurol. 2010;9:119–128. doi: 10.1016/S1474-4422(09)70299-6. [DOI] [PMC free article] [PubMed] [Google Scholar]
- 2.Jack CR, Jr, Knopman DS, Jagust WJ, Petersen RC, Weiner MW, Aisen PS, Shaw LM, Vemuri P, Wiste HJ, Weigand SD, Lesnick TG, Pankratz VS, Donohue MC, Trojanowski JQ. Tracking pathophysiological processes in Alzheimer’s disease: an updated hypothetical model of dynamic biomarkers. Lancet Neurol. 2013;12:207–216. doi: 10.1016/S1474-4422(12)70291-0. [DOI] [PMC free article] [PubMed] [Google Scholar]
- 3.Blennow K, Hampel H, Weiner M, Zetterberg H. Cerebrospinal fluid and plasma biomarkers in Alzheimer disease. Nat Rev Neurol. 2010;6:131–144. doi: 10.1038/nrneurol.2010.4. [DOI] [PubMed] [Google Scholar]
- 4.Fagan AM, Mintun MA, Mach RH, Lee SY, Dence CS, Shah AR, LaRossa GN, Spinner ML, Klunk WE, Mathis CA, DeKosky ST, Morris JC, Holtzman DM. Inverse relation between in vivo amyloid imaging load and cerebrospinal fluid a beta(42) in humans. Ann Neurol. 2006;59:512–519. doi: 10.1002/ana.20730. [DOI] [PubMed] [Google Scholar]
- 5.Jack CR, Jr, Lowe VJ, Weigand SD, Wiste HJ, Senjem ML, Knopman DS, Shiung MM, Gunter JL, Boeve BF, Kemp BJ, Weiner M, Petersen RC Alzheimer’s Disease Neuroimaging Initiative. Serial PIB and MRI in normal, mild cognitive impairment and Alzheimer’s disease: implications for sequence of pathological events in Alzheimer’s disease. Brain. 2009;132:1355–1365. doi: 10.1093/brain/awp062. [DOI] [PMC free article] [PubMed] [Google Scholar]
- 6.Mormino EC, Kluth JT, Madison CM, Rabinovici GD, Baker SL, Miller BL, Koeppe RA, Mathis CA, Weiner MW, Jagust WJ Alzheimer’s Disease Neuroimaging Initiative. Episodic memory loss is related to hippocampal-mediated beta-amyloid deposition in elderly subjects. Brain. 2009;132:1310–1323. doi: 10.1093/brain/awn320. [DOI] [PMC free article] [PubMed] [Google Scholar]
- 7.De Meyer G, Shapiro F, Vanderstichele H, Vanmechelen E, Engelborghs S, De Deyn PP, Coart E, Hansson O, Minthon L, Zetterberg H, Blennow K, Shaw L, Trojanowski JQ Alzheimer’s Disease Neuroimaging, Initiative . Diagnosis-independent Alzheimer disease biomarker signature in cognitively normal elderly people. Arch Neurol. 2010;67:949–956. doi: 10.1001/archneurol.2010.179. [DOI] [PMC free article] [PubMed] [Google Scholar]
- 8.Fagan AM, Roe CM, Xiong C, Mintun MA, Morris JC, Holtzman DM. Cerebrospinal fluid tau/beta-amyloid(42) ratio as a prediction of cognitive decline in nondemented older adults. Arch Neurol. 2007;64:343–349. doi: 10.1001/archneur.64.3.noc60123. [DOI] [PubMed] [Google Scholar]
- 9.Ikonomovic MD, Klunk WE, Abrahamson EE, Mathis CA, Price JC, Tsopelas ND, Lopresti BJ, Ziolko S, Bi W, Paljug WR, Debnath ML, Hope CE, Isanski BA, Hamilton RL, DeKosky ST. Post-mortem correlates of in vivo PiB-PET amyloid imaging in a typical case of Alzheimer’s disease. Brain. 2008;131:1630–1645. doi: 10.1093/brain/awn016. [DOI] [PMC free article] [PubMed] [Google Scholar]
- 10.Klunk WE, Price JC, Mathis CA, Tsopelas ND, Lopresti BJ, Ziolko SK, Bi W, Hoge JA, Cohen AD, Ikonomovic MD, Saxton JA, Snitz BE, Pollen DA, Moonis M, Lippa CF, Swearer JM, Johnson KA, Rentz DM, Fischman AJ, Aizenstein HJ, DeKosky ST. Amyloid deposition begins in the striatum of presenilin-1 mutation carriers from two unrelated pedigrees. J Neurosci. 2007;27:6174–6184. doi: 10.1523/JNEUROSCI.0730-07.2007. [DOI] [PMC free article] [PubMed] [Google Scholar]
- 11.O’Brien RJ, Resnick SM, Zonderman AB, Ferrucci L, Crain BJ, Pletnikova O, Rudow G, Iacono D, Riudavets MA, Driscoll I, Price DL, Martin LJ, Troncoso JC. Neuropathologic studies of the Baltimore Longitudinal Study of Aging (BLSA) J Alzheimers Dis. 2009;18:665–675. doi: 10.3233/JAD-2009-1179. [DOI] [PMC free article] [PubMed] [Google Scholar]
- 12.Reiman EM, Caselli RJ, Yun LS, Chen K, Bandy D, Minoshima S, Thibodeau SN, Osborne D. Preclinical evidence of Alzheimer’s disease in persons homozygous for the epsilon 4 allele for apolipoprotein E. N Engl J Med. 1996;334:752–758. doi: 10.1056/NEJM199603213341202. [DOI] [PubMed] [Google Scholar]
- 13.Gustafson DR, Skoog I, Rosengren L, Zetterberg H, Blennow K. Cerebrospinal fluid beta-amyloid 1–42 concentration may predict cognitive decline in older women. J Neurol Neurosurg Psychiatry. 2007;78:461–464. doi: 10.1136/jnnp.2006.100529. [DOI] [PMC free article] [PubMed] [Google Scholar]
- 14.Stomrud E, Hansson O, Blennow K, Minthon L, Londos E. Cerebrospinal fluid biomarkers predict decline in subjective cognitive function over 3 years in healthy elderly. Dement Geriatr Cogn Disord. 2007;24:118–124. doi: 10.1159/000105017. [DOI] [PubMed] [Google Scholar]
- 15.Jack CR, Jr, Vemuri P, Wiste HJ, Weigand SD, Aisen PS, Trojanowski JQ, Shaw LM, Bernstein MA, Petersen RC, Weiner MW, Knopman DS Alzheimer’s Disease Neuroimaging, Initiative . Evidence for ordering of Alzheimer disease biomarkers. Arch Neurol. 2011;68:1526–1535. doi: 10.1001/archneurol.2011.183. [DOI] [PMC free article] [PubMed] [Google Scholar]
- 16.Lo RY, Hubbard AE, Shaw LM, Trojanowski JQ, Petersen RC, Aisen PS, Weiner MW, Jagust WJ Alzheimer’s Disease Neuroimaging, Initiative . Longitudinal change of biomarkers in cognitive decline. Arch Neurol. 2011;68:1257–1266. doi: 10.1001/archneurol.2011.123. [DOI] [PMC free article] [PubMed] [Google Scholar]
- 17.Trojanowski JQ, Vandeerstichele H, Korecka M, Clark CM, Aisen PS, Petersen RC, Blennow K, Soares H, Simon A, Lewczuk P, Dean R, Siemers E, Potter WZ, Weiner MW, Jack CR, Jr, Jagust W, Toga AW, Lee VM, Shaw LM Alzheimer’s Disease Neuroimaging, Initiative . Update on the biomarker core of the Alzheimer’s Disease Neuroimaging Initiative subjects. Alzheimers Dement. 2010;6:230–238. doi: 10.1016/j.jalz.2010.03.008. [DOI] [PMC free article] [PubMed] [Google Scholar]
- 18.Folstein MF, Folstein SE, McHugh PR. “Mini-mental state”: A practical method for grading the cognitive state of patients for the clinician. J Psychiatr Res. 1975;12:189–198. doi: 10.1016/0022-3956(75)90026-6. [DOI] [PubMed] [Google Scholar]
- 19.US Army. Army Individual Test Battery. War Department, Adjutant General’s Office; Washington, D.C: 1944. [Google Scholar]
- 20.Harrison JE, Buxton P, Husain M, Wise R. Short test of semantic and phonological fluency: normal performance, validity and test-retest reliability. Br J Clin Psychol. 2000;39:181–191. doi: 10.1348/014466500163202. [DOI] [PubMed] [Google Scholar]
- 21.Grober E, Sliwinski M. Development and validation of a model for estimating premorbid intelligence in the elderly. J Clin Exp Neuropsychol. 1991;13:933–949. doi: 10.1080/01688639108405109. [DOI] [PubMed] [Google Scholar]
- 22.Rey A. L’examen clinique en psychologie [clinical examination in psychology. Presses Univeritaires de France; Paris: 1964. [Google Scholar]
- 23.Kaplan E, Goodglass H, Weintraub S. Boston Naming Test. Lea & Febiger; Philadelphia, PA: 1983. [Google Scholar]
- 24.Wechsler D. Wechsler Memory Scale-Revised. The Psychological Corporation; San Antonio, TX: 1987. [Google Scholar]
- 25.Pfeffer RI, Kurosaki TT, Harrah CH, Jr, Chance JM, Filos S. Measurement of functional activities of older adults in community. J Gerontol. 1982;37:323–329. doi: 10.1093/geronj/37.3.323. [DOI] [PubMed] [Google Scholar]
- 26.Benge JF, Balsis S, Geraci L, Massman PJ, Doody RS. How well do the ADAS-cog and its subscales measure cognitive dysfunction in Alzheimer’s disease? Dement Geriatr Cogn Disord. 2009;28:63–69. doi: 10.1159/000230709. [DOI] [PubMed] [Google Scholar]
- 27.Breiman L, Friedman J, Olshen R, Stone C. Classification and Regression Trees. Wadsworth; Belmont, CA: 1984. [Google Scholar]
- 28.R Development Core Team. R: A language and environment for statistical computing [program] R Foundation for Statistical Computing; Vienna, Austria: 2006. [Google Scholar]
- 29.Albert MS, DeKosky ST, Dickson D, Dubois B, Feldman HH, Fox NC, Gamst A, Holtzman DM, Jagust WJ, Petersen RC, Snyder PJ, Carrillo MC, Thies B, Phelps CH. The diagnosis of mild cognitive impairment due to Alzheimer’s disease: recommendations from the National Institute on Aging–Alzheimer’s Association workgroups on diagnostic guidelines for Alzheimer’s disease. Alzheimers Dement. 2011;7:270–279. doi: 10.1016/j.jalz.2011.03.008. [DOI] [PMC free article] [PubMed] [Google Scholar]
- 30.Shaw LM, Vanderstichele H, Knapik-Czajka M, Figurski M, Coart E, Blennow K, Soares H, Simon AJ, Lewczuk P, Dean RA, Siemers E, Potter W, Lee VM, Trojanowski JQ Alzheimer’s Disease Neuroimaging, Initiative . Qualification of the analytical and clinical performance of CSF biomarker analyses in ADNI. Acta Neuropathol. 2011;121:597–609. doi: 10.1007/s00401-011-0808-0. [DOI] [PMC free article] [PubMed] [Google Scholar]
- 31.Shaw LM, Vanderstichele H, Knapik-Czajka M, Clark CM, Aisen PS, Petersen RC, Blennow K, Soares H, Simon A, Lewczuk P, Dean R, Siemers E, Potter W, Lee VM, Trojanowski JQ Alzheimer’s Disease Neuroimaging, Initiative . Cerebrospinal fluid biomarker signature in Alzheimer’s disease neuroimaging initiative subjects. Ann Neurol. 2009;65:403–413. doi: 10.1002/ana.21610. [DOI] [PMC free article] [PubMed] [Google Scholar]