

Abstract
Background:
Diabetes mellitus (DM), being a long-term condition, requires consistent blood glucose monitoring and adjustment of doses of the antidiabetic drugs and insulin. Telehealth is an emerging field that can have a positive impact on the management of this disease.
Aim:
The aim was to study the impact of the frequency of consultation and follow-up on telephone of diagnosed follow-up patients of DM on glycemic and metabolic profiles, the patients' compliance, and their quality of life (QoL), and to compare the effectiveness of different modes of follow-up.
Materials and Methods:
One hundred twenty patients were enrolled from the outpatient department (OPD) including both type 1 and type 2 DM patients who had already been diagnosed and were on treatment. They were randomly assigned to one of three groups, each consisting of 40 subjects, according to the mode of follow-up: A (rare, i.e., less frequent outpatient visits), B (moderate, i.e., more frequent outpatient visits), and C (frequent, i.e., more frequent outpatient visits with weekly telephonic consultation). Metabolic profiles and the QoL were monitored. The patients' compliance with and adherence to the treatment, and dietary and exercise advice were assessed.
Results:
The patients' compliance with and adherence to the treatment was higher in group C, followed by groups B and A. There was a net decrease in adverse events, with an increase in the frequency of follow-up. Changes in glycated hemoglobin (HbA1c) suggested a positive impact of weekly telephonic consultation. The lipid profile was also positively affected, with maximum improvement being in high-density lipoproteins (HDLs) and triglycerides. There was an improvement in the QoL domains pertaining to physical health and endurance in patients with higher frequency of follow-ups. There was no effect on emotional or mental health. There was an overall deterioration of the financial domain, being most marked in group B. The treatment satisfaction questionnaire showed better results in the telephone intervention group.
Conclusion:
Telephonic consultation can be a useful measure to improve the follow-up and management of patients with DM.
Keywords: Compliance, Diabetes, Telehealth, Quality of life (QoL), Telephone
Introduction
Proper drug therapy, social support, health education, and psychological care in diabetes are essential but are usually deficient, especially in developing countries.[1] It is an ongoing challenge to provide care and support that will produce and sustain the desired improvements in the health of persons with a chronic illness, such as diabetes. Financial restrictions, distance from hospital and laboratory services, low levels of education, and less disease awareness among the patients are the limiting factors in the effective follow-up of diabetic patients under treatment.
Quality health care requires effective collaboration between clinicians and patients. Finding novel ways to enhance communication and improve the health of those with chronic diseases is also a continuing part of providing effective care.[2] Telehealth delivers tailored health care that is acceptable to patients and it facilitates more responsive interventions from professionals, resulting in better disease control with fewer exacerbations and admissions.[3] With the emergence of home telemonitoring, there is potential for improving the impact of self-monitoring by linking patients with health care professionals who can monitor blood glucose values and then remotely provide guided recommendations.[4] Though there are concerns with technical challenges and the time commitment required to use messaging and monitoring devices, they are seen as useful tools for monitoring those patients who are interested in working on the management of their disease.[5]
Because of the widespread usage and availability of telephones, these devices can be used to maximize efficiency in the health care system. They can be seen as a new delivery system to provide medical recommendations and prescriptions at the appropriate time and may help to normalize blood glucose levels in diabetic patients by encouraging doctor-patient communication. Studies in which a telephone is used as a means to improve the management of diabetes have not been done earlier in developing countries such as India.
Most of the earlier studies done using telephone-based interventions involved interaction of the patient with a nurse or trained personnel and not directly with the specialist or physician who could advise and modify the treatment pattern according to the investigation results or current complaints. Since in these studies the calls or messages were not made by the patients but were sent to them by the paramedical/nursing staff, the patients might not have felt the need for calls and might not be motivated enough to receive the calls or follow the medical advice.
The objective of our study was to evaluate the impact of introducing consultation and follow-up over the telephone and increasing the frequency of follow-up in patients of diabetes mellitus (DM) who have already been diagnosed and have been on treatment for diabetes for more than 3 months. The parameters evaluated were the glycemic and metabolic profiles, patient compliance, and quality of life (QoL).
We tried to use telephone service as a means for patients to consult with the physician, thereby providing more frequent, direct, and immediate contact with the physician who can modify drug or insulin dosages and provide other advice according to each patient's most recent glycemic and clinical data. To the best of our knowledge, no study on the impact of this form of telephonic intervention in the management of patients of DM was done in the past in India.
Materials and Methods
A total of 120 patients were enrolled from the outpatient department (OPD) of a tertiary care teaching hospital. The subjects with the following characteristics were included in the study:
DM patients (either type 1 or type 2).
Already diagnosed and on treatment (on oral hypoglycemic agents and/or insulin therapy) for >3 months.
Age >18 years.
Those with gestational diabetes, major psychiatric illness, problems in hearing and vocalization, or on follow-up for less than 3 months were excluded from the study.
The study was approved by the institutional review board. Written, informed consent for inclusion into the study was taken from the subjects and they were randomly assigned to one of three groups, each consisting of 40 subjects, using published tables of random numbers. The division was made according to the mode and frequency of the follow-up: Rare mode (patients advised 3-monthly follow-ups on OPD basis), moderate mode (patients advised monthly OPD visits), and frequent mode (patients advised monthly OPD and weekly telephonic consultation).
Personal details; history of the disease; clinical, biochemical, and treatment details; and systemic examination findings were noted in the pro forma for each subject at baseline. Treatment and dietary and exercise advice were provided to each patient at the initial OPD visit after thorough examination and analysis of the investigation reports. This visit was considered the first OPD visit of the study.
The patients were given a schedule of follow-ups according to their group and the mode of follow-up. Those in group A were advised a follow-up for the next/second OPD visit after 12 weeks (3 months). In groups B and C, the subjects were advised a follow-up at the OPD after every 4 weeks, and those in group C were additionally provided with a telephone number through which they could contact the concerned doctor within OPD timings, after every week (7 days) as per the follow-up schedule for consultation. Apart from the advised schedule, additional phone calls and OPD visits made by the patients were noted. Emergency visits and admissions for any disease-related problem were noted separately. Each patient was followed up for 3 months after the initial OPD visit.
Monitoring of the metabolic profile, which included the glycated hemoglobin (HbA1c) levels (measured by immunoassay) and the lipid profile including serum total cholesterol, high-density lipoprotein (HDL), low-density lipoprotein (LDL), triglycerides, and total cholesterol: HDL cholesterol (HDL-C) ratio, was done at baseline at 12 weeks. The fasting blood sugar (FBS) test, done by the glucose oxidase method, and the postprandial blood glucose (PPBS) test, measured 2 h after breakfast, were done weekly. The weekly reports for all the parameters were analyzed together at the final OPD visit, i.e., after 12 weeks for group A, after 4 weeks during the monthly OPD visit for group B, and weekly through a telephone call made by the patient as well as the monthly OPD visit as per each patient's follow-up schedule for group C. Necessary changes in the treatment were made accordingly and noted.
The patients' QoL was assessed by the Quality of Life Instrument for Indian Diabetes Patients (QOLID) questionnaire[5] at baseline and at 12 weeks for all the three groups. Changes in the scores for each of the eight components were noted and separately analyzed.
The patients' compliance was measured in terms of the percentage of advised OPD visits made, the phone calls received, and the investigations done on time. Adherence to the treatment and medications prescribed for both glycemic control and diabetes-related complications, including lipid-lowering drugs and antihypertensive drugs and to the dietary and exercise advice, were assessed by questioning at the last visit. In addition to the complaints noted during the study period, the number of hypoglycemic events or any other adverse event leading to the need for emergency admission was noted.
Statistical analysis
Data for the above mentioned parameters were compiled, tabulated, and analyzed using Microsoft Excel and IBM SPSS statistics for windows, version 19 (IBM Corp. Released 2010. Armonk, NY). The mean values of all the parameters were obtained for the three groups and dispersion was measured by standard deviation (SD). Analysis of variance (ANOVA) was used for calculating the F value for comparing the three groups with regard to the glycemic parameters to find out the effectiveness of increase in the frequency of follow-up. The paired t-test was used for testing the statistical significance of the difference between groups A and B, groups B and C, and groups A and C with regard to the changes occurring in the glycemic parameters over the period of 12 weeks. Percentage changes in the lipid parameters, QOLID scores, and level of patient compliance and adherence to treatment were also compared.
Results
All the 120 participants completed the study and there was no case of any dropout, loss to follow-up, or mortality in any of the three groups. However, there were eight subjects in group A who reported 1-3 weeks later than the advised second visit that was taken as the final visit for them. The discontinuation rate was 0% for all the groups.
The baseline demographic profile for the groups is shown in Table 1. Among the 40 patients in each group, sex distribution was comparable with 55% males in group A, 45% males in group B, and 52.5% males in group C. The mean age was 49 years in group A, 54 years in group B, and 55 years in group C. The mean years of education of the subjects were 8 years, 7 years, and 7 years, respectively, for groups A, B, and C. In group A, 57.5% of the patients belonged to the rural population, which was similar to 55% in group B and 60% in group C. In group A, 10% were single and 90% were married as compared to 20% and 15% single in groups B and C, respectively.
Table 1.
Baseline characteristics
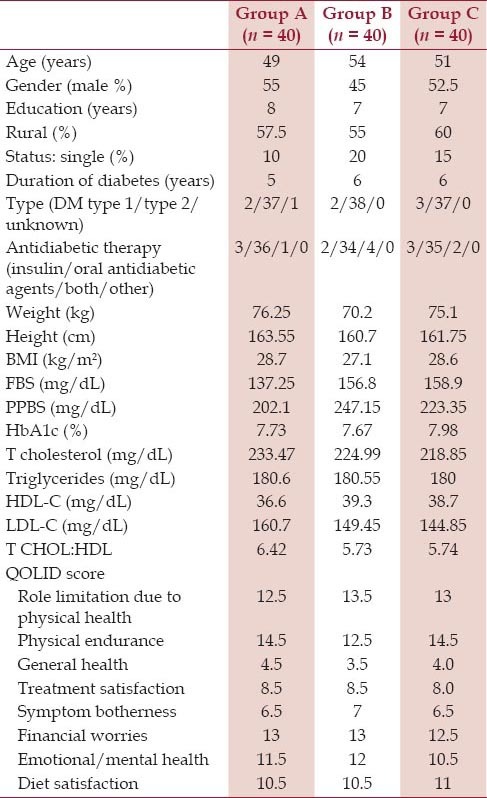
The mean duration of DM since diagnosis was 5 years in group A and 6 years each in groups B and C. In group A, two patients had DM type 1 who were on insulin therapy, 37 had DM type 2, of whom 36 were on oral antidiabetic agents, one on both oral and insulin therapies, and one belonged to the unknown category and was on insulin therapy alone. In group B, two patients had DM type 1 and were on insulin therapy and 38 patients had DM type 2, out of whom 34 were on oral antidiabetic agents and four on both. In group C, there were three patients who had DM type 1 and were on insulin therapy and 37 patients of DM type 2, out of whom 35 were on oral therapy and two on both oral as well as insulin therapies.
The mean body weight for the groups A, B, and C was 76.25 kg, 70.2 kg, and 75.1 kg, respectively. The mean height was 163.55 cm, 160.7 cm, and 161.75 cm for groups A, B, and C, respectively. The mean body mass index (BMI) was 28.7 kg/m2, 27.1 kg/m2, and 28.6 kg/m2 for groups A, B, and C, respectively.
The patients' compliance was measured in terms of the percentage of OPD visits made, phone calls received, and investigations done on time. As shown in Table 2, in group A, two OPD visits were advised to each patient (total 80 visits for 40 patients), of which 95% were made with additional 12 visits made by the patients apart from the advised schedule. In group B, out of the four visits (1 month apart) advised per person (total 160 visits for 40 patients), 87.5% were made with an additional six visits apart from the advised schedule. In group C, out of the four visits advised per person (total 160 visits for 40 patients), 82.5% were made with four additional visits made by the patients apart from the advised schedule. As per the advised schedule in group C, out of a total of nine telephone calls per patient done weekly during the 12-week follow-up period (total 360 calls for 40 patients), 75.55% were received on the advised days of follow-up and apart from these, 22 calls were received in addition to the recommended schedule.
Table 2.
Patient compliance and adherence
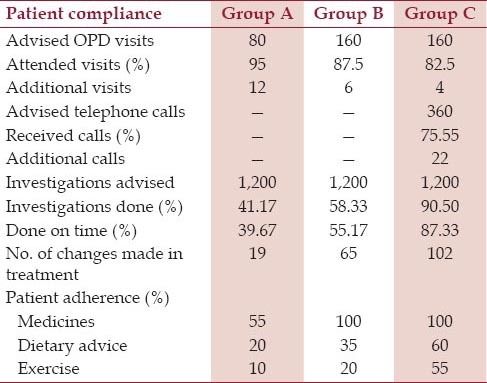
Weekly FBS, PPBS, monthly lipid profile, and HbA1c were advised for each patient. On an average, the patients in group A got 41.17% investigations done, of which 39.67% were done on time. In group B, 58.33% investigations were done, of which 55.17% were done on time. In group C, the values of investigations and the ones done in time were 90.5% and 87.33%, respectively.
The total number of changes made in the medication and dietary and exercise patterns by the physician over the follow-up period of 12 weeks for the groups A, B, and C were 19, 65, and 102, respectively, [Table 2]. Changes made in the medication were in the form of alteration of the dose of insulin, the dose and frequency of the oral antidiabetic agent as well as the addition of a new drug or insulin.
The patient's adherence to treatment as communicated by each patient [Table 2] was noted at the end of 12 weeks. In group A, 45% of the patients reported problems with adherence to the medication, and only 20% and 10% of the patients adhered to the dietary and exercise advice, respectively, given at the beginning of the study. On the other hand, 100% of the patients in groups B and C reported no problem with adherence to the medication. Those who adhered to the dietary advice were 35% and 60% of the patients in groups B and C, respectively. In groups B and C, 20% patients and 55% patients, respectively, followed the exercise advice.
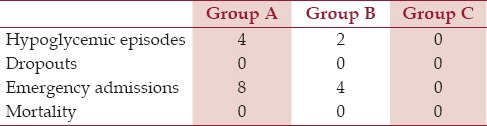
There was no dropout or mortality in any of the groups during the follow-up period of 12 weeks. However, four hypoglycemic events in group A, two in group B, and none in group C were noted. There were eight emergency admissions in group A, four in group B, and none in group C [Table 3].
Table 3.
Adverse events
The mean FBS was found to decrease from 137.25 mg/dL to 130.15 mg/dL in group A (decrease of 5.35% from baseline, P = 0.0003). In group B, it decreased from 156.8 mg/dL to 115.05 mg/dL (decrease of 23.94% from baseline, P < 0.0001). In group C, it decreased from 158.9 mg/dL to 109.65 mg/dL (decrease of 28.02% from the baseline, P = 0.017). In all the groups, the decrease was found to be significant as compared to the baseline [Figure 1].
Figure 1.
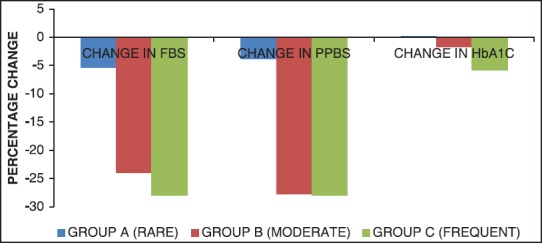
Effect on glycemic parameters in groups with different frequencies of follow-up
On comparison of the three groups using the F-test, it was observed that the difference was significant (P < 0.001); thus, increasing the frequency of the follow-up was found to be effective in improving the mean FBS levels. Further, among the groups, on applying the t-test for the mean FBS, the difference between groups B and C was not statistically significant (P = 0.71). On the other hand, the difference between groups A and B (P = 0.0072) and groups A and C (<0.0001) was statistically significant.
The mean PPBS was found to decrease from 202.1 mg/dL to 192.65 mg/dL (decrease of 3.84% from the baseline, P = 0.91) in group A and from 247.15 mg/dL to 178.25 mg/dL (decrease of 27.71% from the baseline, P = 0.10) in group B. This was not found to be statistically significant. However, in group C, a decrease in the mean PBBS from 223.35 mg/dL to 160.65 mg/dL (decrease of 27.97% from the baseline, P < 0.0001) was found to be significant.
On comparison of the three groups using the F-test, it was observed that the difference was significant (P < 0.001), thereby increasing the frequency of the follow-up that was found to be effective in improving the mean PPBS levels. On applying the t-test among the groups for the mean PPBS, the difference between groups B and C (P = 0.377) was not statistically significant. On the other hand, the difference between groups A and B (P < 0.0001) and groups A and C (P < 0.0001) was statistically significant.
The mean HbA1c levels (7.73% points) were found to be the same in group A both at the beginning and at the end of the study. The decrease in group B was 1.66% of the baseline (7.67 to 7.53, P = 0.93) and was not statistically significant. Group C recorded a statistically significant decrease of 5.87% of the baseline HbA1c (7.98 to 7.48, P < 0.0001).
On comparison of the three groups using the F-test, it was observed that the difference was significant (P < 0.001), thereby increasing the frequency of the follow-up was found to be effective in improving the mean HbA1c levels. On applying the t-test among the groups for the mean HbA1c levels, the difference between groups B and C (P = 0.99) and that between groups A and B (P = 0.99) was not statistically significant, while between groups A and C (P = 0.09), it was found to be statistically significant at the 90% level.
Out of all the components of the lipid profile, the maximum difference in change was found for HDL-C among the groups, the mean increase in levels of HDL being 5.2%, 8.09%, and 8.75% of the baseline values for groups A, B, and C, respectively. This was followed by changes in triglyceride levels, the mean decrease being 5.86%, 6.57%, and 7.88% of the baseline values, respectively, for groups A, B, and C as shown in Figure 2.
Figure 2.
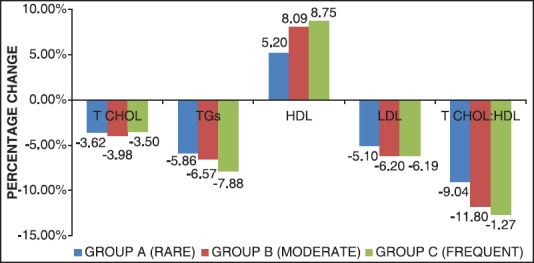
Effect on lipid profile in groups with different frequencies of follow-up
Small differences were observed for total cholesterol and LDL cholesterol (LDL-C). The mean decrease in total cholesterol was 3.62%, 3.98%, and 3.50% for the three groups and the mean decrease in LDL-C levels was 5.1%, 6.2%, and 6.19% of the baseline values for the three groups, respectively.
On calculating the total cholesterol:HDL-C ratio, a mean decrease of 9.04%, 11.8%, and 12.7% of the baseline values was noted for groups A, B, and C, respectively.
The QoL of the patients was assessed using the QOLID questionnaire at the beginning and the end of the study period. Effects of the intensive follow-up schedule were variable on the eight different components of the QOLID score, as shown in Figure 3.
Figure 3.
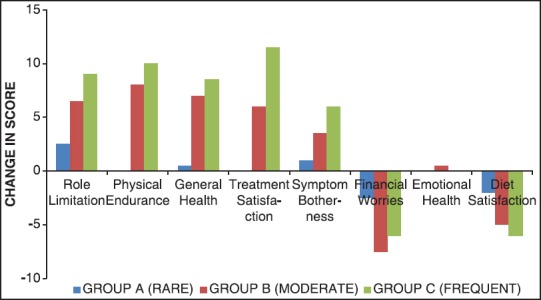
Effect on components of QOLID score
There was an improvement in the scores of the domains of role limitation due to physical health (mean increase of 2.5, 6.5, and 9 points in groups A, B, and C, respectively), physical endurance (mean increase of 0, 8, and 10 points in groups A, B, and C, respectively), general health (mean increase of 0.5, 7, and 8.5 points in groups A, B, and C, respectively), symptom botherness (mean increase of 1, 3.5, and 6 points in groups A, B, and C, respectively), and treatment satisfaction (mean increase of 0, 6, and 11.5 points in groups A, B, and C, respectively). The increase in the points was greater in group C, followed by group B and then group A.
The effect on emotional/mental health was negligible (change of 0, 0.5, and 0 points for the three groups). There was a decrease in the points for the components of financial worries (mean decrease of 2.5, 7.5, and 6.0 points for the groups A, B, and C, respectively), and diet satisfaction (mean decrease of 2, 5, and 6 points, respectively, for groups A, B, and C). The decrease was more in group C, followed by group B and then group A.
Discussion
Telehealth, in the form of both telemonitoring and telemedicine, is an emerging field in the management of long-term conditions, especially DM that requires consistent blood glucose monitoring and adjustment of the doses of the antidiabetic drugs and insulin.
This was a randomized controlled study carried out on 120 patients satisfying the inclusion criteria and who had given their consent for the study. The patients were divided into three groups of 40 each, according to the mode and the frequency of the follow-up. Overall, the three groups were well matched for the demographic profile and baseline characteristics [shown in Table 1], ruling out any confounding factors that may alter the results of the intervention.
The patients' compliance was measured in terms of percentage of the outpatient visits attended, the phone calls received, and the investigations done on time. It was higher in group C, followed in sequence by groups B and A [Table 2]. The patients' adherence to the treatment assessed for medication, and dietary and exercise advice was also much better for group C than for groups B and A. No similar study had been done earlier to note the effect of telephone calls made by the patient for consultation. Studies that are based on other forms of telephone follow-ups like the one by Estey et al. have shown that the follow-up intervention by telephone calls and home visits did enhance the patients' compliance with certain aspects of the prescribed diabetes management plan: the self-monitoring of blood glucose (SMBG) practice, especially, was significantly better in the intervention group.[6] A study by Nesari et al. of nurse-led telephone follow-up found it to be effective in enhancing the level of adherence to a diabetes therapeutic regimen.[7]
These results show that consistent and frequent follow-ups, because of the easy accessibility of the physician's guidance over the telephone, improve compliance with investigations and adherence to the medication and lifestyle suggestions. Compliance with scheduled weekly measurements of blood glucose levels was better in group C, for the obvious reason that the patients had the advantage of immediate advice according to their current blood glucose levels, than in groups A and B where the data pertaining to blood measurement were analyzed at the next outpatient visit as a record and served the purpose of monitoring alone.
Also, the intervention led to a net decrease in adverse events like hypoglycemia and the need for emergency admissions [Table 3]. The patients who were given a more intensive follow-up schedule and telephone number for easy access to the physician had less need of making additional visits, both to the OPD and the emergency facility, with fewer problems than those who followed the rare mode of follow-up [Table 2].
The effect on the glycemic profile was measured in the form of decrease in mean FBS, mean PPBS, and HbA1c levels [Figure 1]. There was maximum decrease in the levels of mean FBS and mean PPBS in the frequent mode of follow-up and least in the rare mode of follow-up. The differences between groups A and B and between groups A and C were statistically significant. Though the difference between moderate and frequent follow-ups that is groups B and C was not statistically significant, yet on comparing the absolute values of mean FBS, there was a clinically significant glycemic improvement in group C compared to group B.
The results for HbA1c showed a statistically significant decrease in group C, compared to no net change in group A. Also, the difference between groups C and A was significant compared to that between groups A and B. This corroborates with the findings of those studies that have used other modes of telephonic follow-up in the form of nurse-led calls or fixed messages, leading to a decrease in the levels of HbA1c, such as the one by Klug et al.[8] (−1.3%), Zolfaghari et al.[9] (−0.93%), and Piette et al.[10] and similar to the improvements shown by other telehealth studies such as that of McMohan et al.[11] (−1.6%), Cho et al.,[12] Whitlock et al.,[13] Shea et al.,[14] and Davis et al.[15]
These results show that increase in the OPD follow-up has a positive impact on mean FBS and PPBS. Though the decrease in blood sugar values from the baseline in group C was significant, the telephonic intervention did not have any added advantage over the monthly OPD follow-up. However, changes in HbA1c suggested a positive impact of weekly telephonic consultation. The difference between the two parameters may be due to two reasons. First, the records of blood glucose levels were not uniform for all the groups; group C members getting maximum investigations done on time (87.33%) are bound to give truer records of monitoring, compared to only 39.67% in group A and 55.17% in group B, thus affecting the final values and reliability of blood glucose levels. Second, blood glucose levels can be fallacious if the patient deliberately maintains better adherence to medication and dietary advice immediately before getting the investigation. This could be the reason for a smaller difference between the groups for FBS and PPBS. However, in such a case, HbA1c is more reliable because it depicts blood glucose control over a span of 2-3 months and, unlike blood glucose levels, cannot fluctuate with transient control.
The telephonic consultation also had a positive impact on the lipid profile [Figure 2], with the maximum improvement being in HDL levels followed by triglycerides, and the change was best observed in the order of group C, B, and A. Small decreases in LDL and total cholesterol were also seen but these were almost similar for all the three groups. This might be due to the following three reasons: First, the effect of improved glycemic control that can especially account for the reduction in triglyceride levels; second, better adherence to dietary and exercise advice, with lifestyle measures being responsible for slight improvement in the metabolic profile; third, the telephonic consultation might lead to an increased compliance with lipid-lowering drugs being taken by most of the patients enrolled with type 2 DM, due to the constant motivation and early response to any side effects arising from these drugs, while the patients in the other groups are more likely to show poor compliance with these drugs due to less frequent interaction with the doctor.
The effect on the QoL was also studied using the QOLID questionnaire. The effect was variable on the eight different domains of the instrument [Figure 3]. There was an improvement in the scores of the domains pertaining to physical health, physical endurance, general health, and symptom botherness in the telephonic intervention group (group C), followed by group B, and was almost negligible in group A. The effect on the emotional/mental health was negligible for all the three groups.
On the other hand, the domains pertaining to financial worries and diet satisfaction showed a decrease in points. The decrease in diet satisfaction may be related to the poor acceptability to dietary changes in the Indian population as well as to lifestyle modifications.[16] This shows the need for continuous counseling of patients, with special emphasis on dietary advice during follow-ups.
Group B showed maximum deterioration of the financial worries domain, more than group C did. This could be due to the reason that in group C, the investigations that the patients underwent were analyzed immediately by telephonic consultation, thus allowing for necessary changes to be made on time. On the other hand, group B patients could feel the increase in the number of investigations as a financial burden because they were assessed at the end of a month with no immediate adjustments and therefore, no early benefit to the patients. Thus, this suggests that frequent monitoring of blood glucose should be supported by physician- or medical expert-guided dose adjustments, or else the monitoring would only increase the financial apprehensions of the patients. Overall, the deterioration in the domain of financial worries is a reflection of the health system in India and poor insurance coverage of the population enrolled for the study.
The improvement in the domain of treatment satisfaction was maximum in group C, following the frequent mode of follow-up. A study on telehealth by Chumbler et al. found significant improvements in only three of the eight the Short Form (36) Health Survey (SF-36) subscales of (role: Physical, bodily pain, and social functioning).[17] This corroborates with our findings of improved physical health domains. A study by Newman et al. suggested that the effect of telehealth on the health-related QoL in long-term conditions is weak or nonexistent.[3] However, the difference can be because the effect on the different components of the QoL is different for the three groups in our study. The domains documented in our study are similar to those reported for the evaluated scales in other studies except financial worries and diet advice satisfaction, which need special evaluation in the Indian population. Also, the study by Newman did not use disease-specific measures of the health-related QoL, rather it used the same questionnaire for all the long-term conditions.[3] This could be the reason for the different results of our study.
The limitations of this study include its small sample size and the short duration of the follow-up. Though the investigations done at the hospital laboratory were done using the same standardized kits, the weekly blood glucose measurements were obtained from patients using different glucometers and from different laboratories, which might have brought in some erroneous values; however, this could not have been avoided, because of the lack of prior knowledge of the patients regarding self-monitoring of glucose and the cost factor that restrained them from buying individual glucometers. Other laboratory analytes including serum creatinine levels in users of metformin, liver tests in users of statins, and serum potassium in hypertensive patients on selected blood pressure medications were not monitored, which could have been included had the study been of a longer duration. Because of cost considerations, no automated telemedicine system could be incorporated in the study.
However, we feel that our study has highlighted this important public health issue and may stimulate multicenter studies to note the persistence of effect in a larger population group with a longer duration of follow-up.
On the basis of results from this study, the following recommendations can be made to improve the clinical practice in this area: First, it can be planned to introduce a telephonic service so that the patients staying at a distance can consult the doctor over telephone during the OPD timings, according to a schedule given to them in addition to the OPD visits. Second, a community diabetes team may be created with the provision of a telephone support line for easy accessibility for the patients. Third, this facility can be useful for certain categories of patients who need intensive follow-up, with priority being given to certain groups of individuals, such as those who cannot easily access the physician because they stay at a long distance from the hospital in remote rural areas or at a place with poor transport means and those who have financial restrictions for making frequent visits to the hospital OPD. This is also applicable to patients who need frequent monitoring and close follow-up like those with poorer glycemic control and those in the early stages of management, those with complications of DM, those with poor compliance with and adherence to medication and lifestyle advice, and those who need constant motivation because they have low psychological scores on account of the chronic disease. Finally, as we have also found out the need for constant psychological counseling and motivation for the diabetic patients, this frequent follow-up can help in that, especially in terms of dietary satisfaction and on the financial front to enhance the QoL in the patients from this developing country.
Conclusion
This intervention can be a useful measure to improve the follow-up and management of particular patient groups by building up a diabetes team and telephone support line, both at the hospital and at the community level. There is a need for further research to evaluate the financial considerations and the feasibility before the project can be implemented on a larger scale.
Footnotes
Source of Support: Nil.
Conflict of Interest: None declared.
References
- 1.Gautam Y, Sharma A, Agarwal A, Bhatnagar M, Trehan RR. A cross-sectional study of QOL of diabetic patients at tertiary care hospitals in Delhi. Indian J Community Med. 2009;34:346–50. doi: 10.4103/0970-0218.58397. [DOI] [PMC free article] [PubMed] [Google Scholar]
- 2.Krishna S, Boren SA. Diabetes self-management care via cell phone: A systematic review. J Diabetes Sci Technol. 2008;2:509–17. doi: 10.1177/193229680800200324. [DOI] [PMC free article] [PubMed] [Google Scholar]
- 3.Cartwright M, Hirani SP, Rixon L, Beynon M, Doll H, Bower P, et al. Whole Systems Demonstrator Evaluation Team. Effect of telehealth on quality of life and psychological outcomes over 12 months (Whole Systems Demonstrator telehealth questionnaire study): Nested study of patient reported outcomes in a pragmatic, cluster randomised controlled trial. BMJ. 2013;346:f653. doi: 10.1136/bmj.f653. [DOI] [PMC free article] [PubMed] [Google Scholar]
- 4.Health Quality Ontario. Home telemonitoring for type 2 diabetes: An evidence-based analysis. Ont Health Technol Assess Ser. 2009;9:1–38. [PMC free article] [PubMed] [Google Scholar]
- 5.Hopp FP, Hogan MM, Woodbridge PA, Lowery JC. The use of telehealth for diabetes management: A qualitative study of telehealth provider perceptions. Implement Sci. 2007;2:14. doi: 10.1186/1748-5908-2-14. [DOI] [PMC free article] [PubMed] [Google Scholar]
- 6.Estey AL, Tan MH, Mann K. Follow-up intervention: Its effect on compliance behavior to a diabetes regimen. Diabetes Educ. 1990;16:291–5. doi: 10.1177/014572179001600408. [DOI] [PubMed] [Google Scholar]
- 7.Nesari M, Zakerimoghadam M, Rajab A, Bassampour S, Faghihzadeh S. Effect of telephone follow-up on adherence to a diabetes therapeutic regimen. Jpn J Nurs Sci. 2010;7:121–8. doi: 10.1111/j.1742-7924.2010.00146.x. [DOI] [PubMed] [Google Scholar]
- 8.Klug C, Bonin K, Bultemeier N, Rozenfeld Y, Vasquez RS, Johnson M, et al. Integrating telehealth technology into a clinical pharmacy telephonic diabetes management program. J Diabetes Sci Technol. 2011;5:1238–45. doi: 10.1177/193229681100500533. [DOI] [PMC free article] [PubMed] [Google Scholar]
- 9.Zolfaghari M, Mousavifar SA, Haghani H. Mobile phone text messaging and Telephone follow-up in type 2 diabetic patients for 3 months: A comparative study. J Diabetes Metab Disord. 2012;11:7. doi: 10.1186/2251-6581-11-7. [DOI] [PMC free article] [PubMed] [Google Scholar] [Retracted]
- 10.Piette JD, Weinberger M, Kraemer FB, McPhee SJ. Impact of automated calls with nurse follow-up on diabetes treatment outcomes in a department of veterans affairs health care system: A randomized controlled trial. Diabetes Care. 2001;24:202–8. doi: 10.2337/diacare.24.2.202. [DOI] [PubMed] [Google Scholar]
- 11.McMahon GT, Gomes HE, Hickson Hohne S, Hu TM, Levine BA, Conlin PR. Web-based care management in patients with poorly controlled diabetes. Diabetes Care. 2005;28:1624–9. doi: 10.2337/diacare.28.7.1624. [DOI] [PMC free article] [PubMed] [Google Scholar]
- 12.Cho JH, Chang SA, Kwon HS, Choi YH, Ko SH, Moon SD, et al. Long-term effect of the internet-based glucose monitoring system on HbA1c reduction and glucose stability: A 30-month follow-up study for diabetes management with a ubiquitous medical care system. Diabetes Care. 2006;29:2625–31. doi: 10.2337/dc05-2371. [DOI] [PubMed] [Google Scholar]
- 13.Whitlock WL, Brown A, Moore K, Pavliscsak H, Dingbaum A, Lacefield D, et al. Telemedicine improved diabetic management. Mil Med. 2000;165:579–84. [PubMed] [Google Scholar]
- 14.Shea S, Weinstock RS, Starren J, Teresi J, Palmas W, Field L, et al. A randomized trial comparing telemedicine case management with usual care in older, ethnically diverse, medically underserved patients with diabetes mellitus. J Am Med Inform Assoc. 2006;13:40–51. doi: 10.1197/jamia.M1917. [DOI] [PMC free article] [PubMed] [Google Scholar]
- 15.Davis RM, Hitch AD, Salaam MM, Herman WH, Zimmer-Galler IE, Mayer-Davis EJ. TeleHealth improves diabetes self-management in an underserved community: Diabetes TeleCare. Diabetes Care. 2010;33:1712–7. doi: 10.2337/dc09-1919. [DOI] [PMC free article] [PubMed] [Google Scholar]
- 16.Nagpal J, Kumar A, Kakar S, Bhartia A. The development of 'Quality of Life Instrument for Indian Diabetes Patients (QOLID): A validation and reliability study in middle and higher income groups. J Assoc Physicians India. 2010;58:295–304. [PubMed] [Google Scholar]
- 17.Chumbler NR, Neugaard B, Kobb R, Ryan P, Qin H, Joo Y. Evaluation of a care coordination/home-telehealth program for veterans with diabetes: Health services utilization and health-related quality of life. Eval Health Prof. 2005;28:464–78. doi: 10.1177/0163278705281079. [DOI] [PubMed] [Google Scholar]