

Short abstract
Biomaterial substrates composed of semi-aligned electrospun fibers are attractive supports for the regeneration of connective tissues because the fibers are durable under cyclic tensile loads and can guide cell adhesion, orientation, and gene expression. Previous studies on supported electrospun substrates have shown that both fiber diameter and mechanical deformation can independently influence cell morphology and gene expression. However, no studies have examined the effect of mechanical deformation and fiber diameter on unsupported meshes. Semi-aligned large (1.75 μm) and small (0.60 μm) diameter fiber meshes were prepared from degradable elastomeric poly(esterurethane urea) (PEUUR) meshes and characterized by tensile testing and scanning electron microscopy (SEM). Next, unsupported meshes were aligned between custom grips (with the stretch axis oriented parallel to axis of fiber alignment), seeded with C3H10T1/2 cells, and subjected to a static load (50 mN, adjusted daily), a cyclic load (4% strain at 0.25 Hz for 30 min, followed by a static tensile loading of 50 mN, daily), or no load. After 3 days of mechanical stimulation, confocal imaging was used to characterize cell shape, while measurements of deoxyribonucleic acid (DNA) content and messenger ribonucleic acid (mRNA) expression were used to characterize cell retention on unsupported meshes and expression of the connective tissue phenotype. Mechanical testing confirmed that these materials deform elastically to at least 10%. Cells adhered to unsupported meshes under all conditions and aligned with the direction of fiber orientation. Application of static and cyclic loads increased cell alignment. Cell density and mRNA expression of connective tissue proteins were not statistically different between experimental groups. However, on large diameter fiber meshes, static loading slightly elevated tenomodulin expression relative to the no load group, and tenascin-C and tenomodulin expression relative to the cyclic load group. These results demonstrate the feasibility of maintaining cell adhesion and alignment on semi-aligned fibrous elastomeric substrates under different mechanical conditions. The study confirms that cell morphology is sensitive to the mechanical environment and suggests that expression of select connective tissue genes may be enhanced on large diameter fiber meshes under static tensile loads.
Keywords: bioreactor, confocal microscopy, polyurethane, mechanical properties, C3H10T1/2, electrospinning, cell morphology, cyclic stretch
1. Introduction
Connective tissue injuries, such as ruptures and tears of tendons and ligaments, are a major medical problem, often requiring surgical intervention to restore biomechanical function. However, conventional treatment with autologous and decellularized allogeneic tissue has intrinsic drawbacks. Autologous tissue is of limited supply and is associated with donor site complications, while allogeneic tissue risks disease transmission and compromised mechanical properties from standard storage and sterilization procedures [1,2]. Consequently, functional engineered tissues are needed, which recapitulate the structure and function of native connective tissue while overcoming the limitations of autologous and allogeneic materials.
Fibrous biomaterials, such as braided or knitted silk fibroin [3,4], poly(lactic acid) [5,6], and polyurethane fibers [7], are strong in tension and compliant in bending and compression, making them attractive for connective tissue engineering applications. However, these materials—typically prepared by melt- or wet-spinning—consist of 25–200 μm diameter fibers that are larger than mammalian cells and do not necessarily present a topography to guide cell alignment. In contrast, fibers produced by electrospinning have diameters of 0.1–5 μm [8], can guide cell alignment [9–11], and modulate development of organized extracellular matrix (ECM) [12–14]. For example, Chaurey et al. showed that as the diameters of aligned fibers were increased from 0.1 to 0.8 μm, the cell alignment also increased [15]. At the same time, Erisken et al. showed that increasing the diameter of aligned fibers from 0.68 to 1.80 μm resulted in increased expression of collagen types I, III, and V, and tenomodulin [16], while Cardwell et al. reported that increasing the diameter of aligned fibers from 0.50 to 2.1 μm resulted in increased expression of collagen I and scleraxis [17]. Together, these data demonstrate that cell morphology and expression of the connective tissue phenotype are sensitive to the diameter of oriented electrospun biomaterial substrates.
Concurrently, mechanical stimulation has been shown to induce synthesis of ECM proteins, both in vivo in connective tissues [18–20] and in vitro in engineered tissues [9–11,21]. With regard to the latter, recent studies have shown that 10 min to 3 hr of cyclic uniaxial loading with tensile strains of 2.5–15% and frequencies of 0.1–1 Hz induce the collagens I and III expression by fibroblasts and mesenchymal stem cells (MSCs) on two-dimensional surfaces [22,23], in three-dimensional constructs [9–11], and on braided or woven constructs [21]. In addition, Teh et al.—using electrospun fibers on woven mesh supports—showed that cyclic mechanical stretch and fiber orientation act synergistically to stimulate expression of the connective tissue ECM genes collagen I and III, and tenascin-C by MSCs [24]. Together, these studies indicate that MSCs and fibroblastic cells are sensitive to uniaxial strain. However, the effect of uniaxial loads on unsupported electrospun fiber meshes has not been examined.
The objectives of this study were to characterize the morphology of cells in situ on electrospun meshes under static and cyclic uniaxial tensile loads and to determine whether varying the diameter of semi-aligned electrospun fibers influences markers of the connective tissue phenotype under different mechanical conditions. To accomplish this, elastomeric meshes were electrospun from PEUUR with either large (≥1 μm) or small (≤1 μm) diameter fibers. These surfaces were seeded with C3H10T1/2 cells (an MSC line) and cultured in a custom-made bioreactor. Cell-seeded large and small fiber diameter meshes were maintained under no load, under a 50 mN static load, or subjected to 4% cyclic strain for 30 min, 0.25 Hz daily for 3 days. Cell morphology, orientation, density, and gene expression of connective tissue proteins were quantified poststimulation.
2. Materials and Methods
2.1. Materials.
All chemicals were purchased from Sigma-Aldrich (St. Louis, MO). Unless otherwise noted, cell culture reagents were purchased from Life Technologies (Carlsbad, CA).
2.2. PEUUR Synthesis.
Segmented PEUUR was synthesized from 2000 Da polycaprolactone (PCL) diol, 1,6-diisocyanatohexane, and 1,3-propanediol bis(4-aminobenzoate) as described previously [17]. Differential scanning calorimetry indicated a glass transition temperature of the polymer of −47 °C, while gel permeation chromatography indicated number- and weight-average molecular weights of 87 kDa and 128 kDa, respectively, and a polydispersity index of 1.48.
2.3. Mesh Fabrication and Characterization.
Meshes consisting of large or small fibers were fabricated by electrospinning 12 or 8 wt.% solutions of PEUUR, respectively, in 1,1,1,3,3,3-hexaflouro-2-propanol (HFIP) from a 22 gauge steel flat-tip needles using a +15 kV potential, 3 mL/hr flow rate, and 15 cm throw distance. Electrospun meshes (∼200 μm thick) were collected on an aluminum foil-wrapped 6.5 cm diameter cylindrical mandrel rotating at 1000 rpm (corresponding to a 3.5 m/s surface velocity), dried overnight in a fume hood, and stored in a desiccator until use. SEM (LEO 1550 Field Emission SEM, Carl Zeiss SMT, Thornwood, NY) was performed to assess fiber morphology. Diameters and orientations of individual fibers were measured manually using IMAGEJ v1.40 (National Institutes of Health, Bethesda, MD) [17]. Orientations were then used to determine angular standard deviation (a measure of fiber alignment) as described elsewhere [14].
2.4. Mechanical Testing of Meshes.
Both large and small fiber diameter meshes were mechanically tested under monotonic and cyclic uniaxial tensile strain on a BioPulsTM testing system with a 10 kN capacity load cell and submersible pneumatic grips (Instron 3366, Norwood, MA). Samples were cut to 3.5 cm by 0.5 cm (with the long axis corresponding to direction of alignment) and secured in custom polyetherimide/silicone clamps so as to maintain dimensionality. Residual HFIP was removed by immersion of samples in 70% ethanol for 2 days followed by distilled water for 2 days. Samples were subjected to monotonic strain at 0.1% s−1 in phosphate-buffered saline (PBS) at room temperature (22 °C). Elastic moduli were calculated through a least-squares fit of the linear portion of the stress–strain curve. For cyclic testing, samples were preloaded to 50 mN at an applied strain rate of 0.1% s−1. A new gauge length was then calculated and the sample was subsequently cyclically strained to 4% at 0.25 Hz for 30 min (450 cycles) in PBS at room temperature (22 °C). The cycling was performed three times for each sample (calculating a new gauge length at the beginning of each test) to simulate a full 3-day bioreactor study. Stress–strain curves were constructed to evaluate the response of the meshes over the regimen.
2.5. Cell Culture and Seeding.
Mouse C3H10T1/2 Clone 8 MSCs (ATCC, Manassas, VA) were cultured in high glucose Dulbecco's modified Eagle's medium (DMEM, ATCC) supplemented with 10% fetal bovine serum, 2 mM L-glutamine, 1% antibiotic/antimycotic, and 50 μg/mL L-ascorbic acid (hereafter, referred to as growth medium), and used for all experiments at passage 15. Cells were cultured for 4 days on tissue culture polystyrene, detached using 0.25% trypsin/ethylenediamine tetraacetic acid (EDTA), and incubated with DiI (10 μg/mL) (Molecular Probes, Eugene, OR) in growth medium for 30 min at 37 °C to fluorescently label the cells.
Prior to cell seeding, electrospun meshes were cut to 4.5 cm by 1 cm strips (with the long axis corresponding to the direction of fiber alignment) and secured in custom Ultem® clamps (Fig. 1(a)). Next, residual HFIP was leeched from the meshes through immersion in 70% ethanol and distilled water (as described in Sec. 2.4), then dried and sterilized by exposure to ethylene oxide (Anderson Products, Haw River, NC) under tension. Meshes were then immersed in PBS containing 5 μg/mL fibronectin (MP Biomedicals, Solon, OH) for 6 hr at 37 °C and transferred into a custom seeding platform (Fig. 1(b)), which maintained meshes under slight tension during cell seeding. Sterile absorbent cotton pads (Bio-Rad, Hercules, CA) were placed beneath the meshes and prewetted with 100 μL of PBS, followed by dropwise addition of a 300 μL volume of DiI-labeled cells in growth medium to a final density of 15,000 cells/cm2. (Here, the cotton pads were used to wick excess medium through the mesh and draw seeded cells to the mesh surface.) Cell-seeded meshes were maintained in a humidified incubator (37 °C, 5% CO2) for 4 hr and then an additional 250 μL of growth media was added. Following another 3 hr incubation, the clamped meshes were carefully transferred to Petri dishes, submerged in growth medium, and incubated overnight.
Fig. 1.
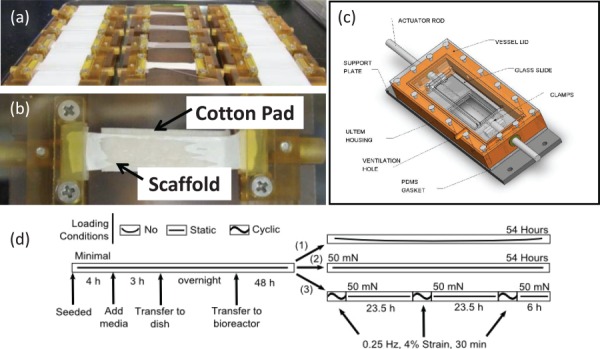
Bioreactor components and operations. (a) Individual mesh between a pair of custom-designed polyetherimide grips and laid over a cotton pad. (b) Troughs to seed multiple meshes and maintain tension. (c) Diagram of the assembled bioreactor [25]. (d) Diagram of the mechanical stimulation time-course. For the no load group (1), meshes were hung slack. For the static load group (2), meshes were strained to 50 mN each day. For the cyclic load group (3), meshes were strained to 50 mN each day and then cyclically strained to an additional 4% at 0.25 Hz for 30 min.
2.6. Mechanical Stimulation of Cell-Seeded Meshes.
A custom bioreactor system, as detailed previously by Kluge et al. [25], was used to stimulate C3H10T1/2 cells on electrospun meshes (Fig. 1(c)). Cell-seeded meshes were transferred to individual bioreactor chambers with the cell-seeded surface facing downward to permit in situ confocal microscopy via a DM IRE2 inverted microscope (Leica Microsystems, Wetzlar, Germany) [25]. After 48 hr of undisturbed culture, mechanical stimulation was applied to the meshes daily for 3 days. For the static load group, meshes were strained to and maintained at 50 mN. (Here, the strain was adjusted daily to compensate for any mesh creep). For the cyclic load group, meshes were preloaded to 50 mN and then cyclically strained by an additional 4% at a rate of 0.25 Hz for 30 min. Thereafter, the meshes were returned to a 50 mN load and maintained similar to the static load group. (This mild cyclic loading regimen was selected to ensure cell retention on fiber meshes over the 3 day study and lies within the range of conditions known to stimulate extracellular signal-regulated kinase (ERK) phosphorylation [10].) For the no load group, meshes were secured loosely (i.e., no tension) between the two clamps for the duration of the experiment. (The different treatment regimens are shown diagrammatically in Fig. 1(d).) Bioreactor studies were performed twice with n = 2 samples for each condition per replicate. The results of the two replicates were combined to achieve n = 4.
2.7. Confocal Imaging.
Following the third day of mechanical stimulation, cells were incubated with 2 μM calcein-AM (Molecular Probes) for 1 hr to visualize the live cells. After staining, the medium was replaced with PBS and the entire bioreactor chamber was placed on the microscope stage for confocal imaging. The z-stacks were collected using 2 μm axial steps and line-averaged twice. Final images were constructed as projections across z-stacks. Projected areas, aspect ratios, and angles of the long axis were measured using IMAGEJ. Angle data were then used to calculate angular standard deviations.
2.8. Gene Expression.
Six hours after the completion of the third daily application of mechanical stimulation, meshes were washed twice with cold PBS, sectioned down the long axis, and the separate pieces probed for gene expression and cell number. For gene expression, mesh pieces were combined with 1 mL phenol/guanidine isothiocyanate (TRIzol, Life Technologies, Carlsbad, CA) and stored at −80 °C until further purification. Total RNA was isolated from thawed samples following homogenization and column purification (RNeasy Mini Kit, Qiagen, Germantown, MD) according to the manufacturer's instructions. Samples were subjected to on-column DNA digestion (DNase I, Qiagen) prior to elution. Total RNA was quantified using Quant-iT RiboGreen® kit (Life Technologies, Carlsbad, CA) using a fluorescent plate reader (SpectraMax M2, Molecular Devices, Sunnyvale, CA), according to manufacturer's protocol. Equal amounts of total RNA (500 ng) were reverse transcribed (High Capacity cDNA Reverse Transcription kit, Life Technologies, Carlsbad, CA) with random hexamers as primers, according to manufacturer's protocol. Polymerase chain reaction (PCR) was performed on an ABI 7300 Real Time PCR System (Applied Biosystems, Foster City, CA) using mouse-specific primers designed using commercial software (primer express v2.0, Applied Biosystems) to probe for collagen I, collagen III, decorin, tenascin-C, scleraxis, tenomodulin, and β-actin (Table 1). Relative gene expression was determined using the comparative threshold cycle (ΔΔCt) method [26] with β-actin as the housekeeping gene and the small diameter fiber, no load group as the normalizer. Individual data were transformed by the formula 2−ΔΔCt and plotted as the mean ± the standard error of the mean.
Table 1.
Primer sequences for quantitative PCR
| Gene accession no. | Significance | Primer set (5′–3′) | Amplicon size (bp) |
|---|---|---|---|
| Collagen 1α1 | Primary structural protein of tendon/ligament ECM | Fwd: ATGTTCAGCTTTGTGGACCT | 92 |
| NM_007742 | Rev: CAGCTGACTTCAGGGATGT | ||
| Collagen 3α1 | Secondary structural protein of tendon/ligament ECM | Fwd: CACCCTTCTTCATCCCACTCTTA | 91 |
| NM_009930 | Rev: TCTAGACTCATAGGACTGACCAAGGT | ||
| Collagen 12α1 | Fibril-associated collagen with a role in collagen fibrillogenesis | Fwd: TCAAAGAGGTGGAGGTGGAC | 108 |
| NM_007730 | Rev: ATGTGCCCTCATCGTACACA | ||
| Decorin | Proteoglycan mediator in collagen fibrillogenesis | Fwd: TCGAGTGGTGCAGTGTTCTGA | 82 |
| NM_007833 | Rev: TTGCAGGTCTAGCAAGGTTGTGTC | ||
| Tenascin-C | Glycoprotein abundant in developing tendons | Fwd: CCACCTAGTACTGATTTCATTGTCTACCT | 137 |
| NM_011607 | Rev: CCGTCTGGAGTGGCATCTG | ||
| Tenomodulin | Late marker of tendon differentiation | Fwd: GGCCTTAACTCTAATTGTCCTGTTTT | 103 |
| NM_022322 | Rev: CTCGCCGTTGCTGTAGAAAGT | ||
| Scleraxis | Selective tendon/ligament transcription factor | Fwd: TCTGCCTCAGCAACCAGAGAAAGT | 130 |
| NM_198885 | Rev: ACTCTTCAGTGGCATCCACCTTCA | ||
| β-actin | Housekeeping/reference | Fwd: TGCTCCCCGGGCTGTATT | 87 |
| NM_007393 | Rev: ACATAGGAGTCCTTCTGACCCATT |
2.9. DNA Content.
For quantification of DNA, mesh pieces (stored in PBS at −80 °C until analysis) were thawed and digested with 0.5 mg/mL papain buffer (MP Biomedicals) for 20 hr at 65 °C. DNA was then quantified using a Quant-iT PicoGreen® kit (Life Technologies, Carlsbad, CA) according to manufacturer's protocol using a fluorescent plate reader (SpectraMax M2).
2.10. Statistical Analysis.
Testing for statistically significant differences between means was performed using one-way analysis of variance (ANOVA) followed by post-hoc comparisons using the Fisher method with a significance criterion of p ≤ 0.05 (originpro 8.1, Northampton, MA). Pairwise testing for statistically significant differences between angular standard deviations was performed by estimating the F-statistic as the ratio of angular standard deviations squared. Calculations of mean fiber diameter and angular standard deviation were based on the analysis of n ≥ 100 fibers from three meshes per condition. Mechanical properties corresponded to the analysis of n = 4 meshes per condition. Cell projected area, aspect ratios, and angular standard deviations were based on analysis of fluorescence images of n ≥ 50 calcein-stained cells. For analysis of gene expression, statistical tests were performed on the transformed data (2−ΔΔCt) and results correspond to n = 4 samples. For analysis of cell number, data correspond to n = 2 samples.
3. Results
3.1. Properties of Electrospun Meshes.
For all meshes, SEM images revealed dense matrices composed of smooth, continuous polymer fibers without bead formation (Fig. 2). Meshes electrospun from 12 wt.% PEUUR had fiber diameters of 1.74 ± 0.49 μm, while those electrospun from 8 wt.% PEUUR had fiber diameters of 0.60 ± 0.25 μm. These materials are hereafter referred to as large and small fiber diameter meshes, respectively. SEM images revealed modest fiber alignment, consistent with fiber collection on a rotating mandrel (3.5 m/s surface velocity). The calculated angular standard deviations were 33.7 deg and 36.4 deg for small and large fiber diameter meshes, respectively (Fig. S1 (Supplemental figures are available under the “Supplemental Data” tab for this paper on the ASME Digital Collection)), and comparable to previous measurements [14]. (Here, a smaller angular standard deviation corresponds to greater fiber alignment.)
Fig. 2.
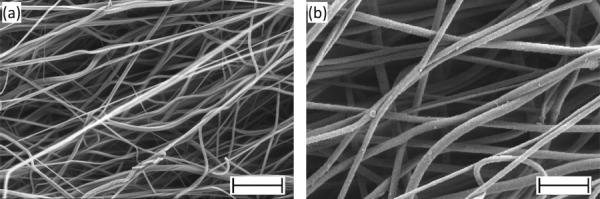
Electron micrographs of electrospun segmented polyurethane meshes. Meshes had mean fiber diameters of: (a) 0.60 μm and (b) 1.74 μm. Scale bars correspond to 10 μm.
Mechanical properties of the meshes were characterized parallel to the axis of fiber alignment. Monotonic strain-to-failure testing revealed S-shaped stress–strain curves for both large and small fiber diameter meshes, consisting of distinct toe-in, linear, and yield regions (Fig. 3(a)). The transition between the toe-in and linear regions occurred at a load of approximately 50 mN (∼5% strain). Large fiber diameter meshes exhibited elastic moduli of 4.2 ± 0.3 MPa while small fiber diameter meshes had elastic moduli of 9.2 ± 0.6 MPa. Cyclic tensile testing was performed to determine the viscoelastic and dynamic responses of large (Fig. 3(b)) and small diameter meshes (Fig. 3(c)) under simulated bioreactor loading conditions. The first cycles (black traces) were marked by a large energy loss (the area between the elongation and relaxation curves) that is consistent with energy dissipation due to breaking of fibers and rearrangement of molecular entanglements. By the last cycle, the elongation and relaxation curves were similar (gray traces), consistent with primarily elastic deformation.
Fig. 3.
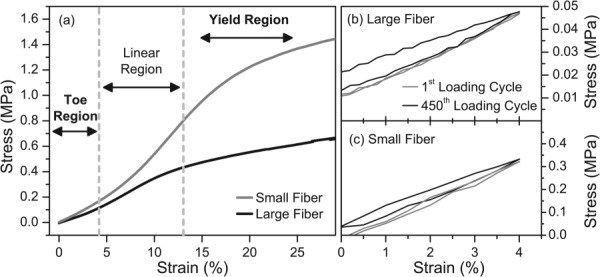
Representative stress–strain curves for PEUUR electrospun meshes tested wet at room temperature. (a) Strain to failure testing of meshes with mean fiber diameters of 0.60 μm (small, gray trace) and 1.74 μm (large, black trace). Cyclic loading of meshes with: (b) a mean fiber diameter of 1.74 μm (large) and (c) a mean fiber diameter of 0.60 μm (small). Meshes were preloaded to 50 mN at a strain rate of 0.1% s−1 and then cyclically stretched between 0% and 4% elongation at 0.25 Hz for 30 min (450 cycles). Traces for the first (black) and last cycles (gray) are shown.
3.2. Cellular Viability and Morphology.
MSCs, seeded onto both large and small diameter fiber meshes, were allowed to adhere for 48 hr, and then subjected to no load, static load, or three daily episodes of cyclic loading (Fig. 1(d)). DNA content was quantified at the end of the regimen to determine the combined effect of fiber diameter and the mechanical stimulation on cell number. Similar cell densities were observed on both large and small diameter fiber meshes, indicating that cell proliferation was not affected by fiber diameter (Fig. 4). In addition, the larger (but not significantly different) numbers of cells on cyclically stretched meshes indicate that cell adhesion and viability were not adversely affected by mechanical stimulation. In situ confocal images of calcein-stained cells were collected after the third application of mechanical stimulation to probe for differences in cell morphology (Fig. 5). Quantitative analysis indicated that neither cell projected area nor aspect ratio varied systematically with fiber diameter or mechanical condition. However, some pairwise differences in projected areas were statistically significant (Fig. S2(a) (Supplemental figures are available under the “Supplemental Data” tab for this paper on the ASME Digital Collection)), and cell aspect ratio appeared to be higher when cells on large diameter fibers were subjected to static or cyclic load (Fig. S2(b) (Supplemental figures are available under the “Supplemental Data” tab for this paper on the ASME Digital Collection)). In contrast, angular standard deviations were significantly lower on both small and large diameter fiber meshes when maintained under static or cyclic loads (Fig. 6 and Fig. S2(c) (Supplemental figures are available under the “Supplemental Data” tab for this paper on the ASME Digital Collection)).
Fig. 4.
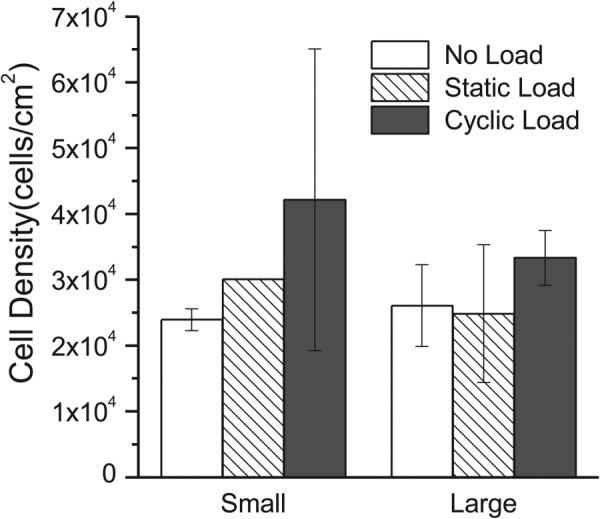
Cell density on electrospun PEUUR meshes after 3 days of mechanical treatment. Bars correspond to the mean ± standard deviation for n = 2 samples, except for small diameter fiber, static load, where n = 1.
Fig. 5.
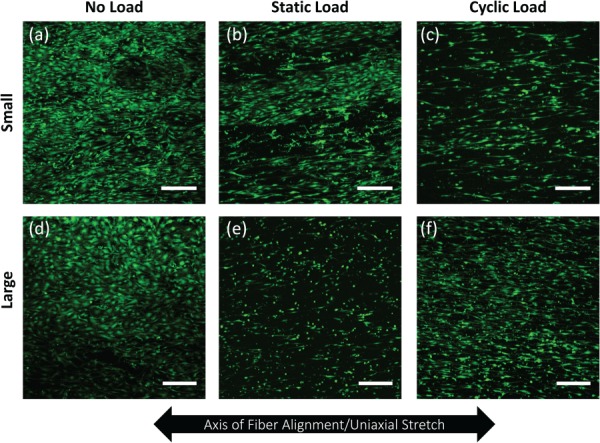
Confocal images of C3H10T1/2 cells following 3 days of: (a) and (d) no load, (b) and (e) static load, or (c) and (f) cyclic load on meshes with either a small (0.60 μm) ((a)–(c)) or large (1.74 μm) ((d)–(f)) mean fiber diameter. Scale bars correspond to 300 μm.
Fig. 6.
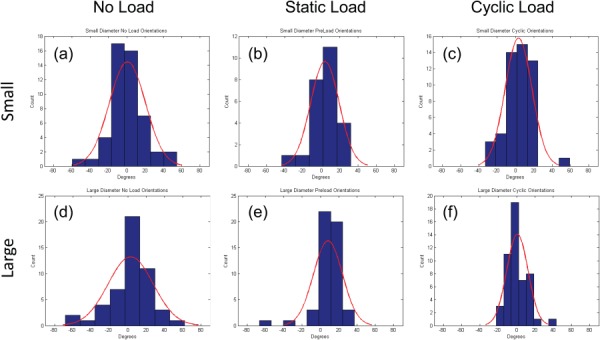
Histogram of the distribution of cell orientations relative to the mean for: (a)–(c) small and (d)–(f) large diameter fiber meshes. Orientations were determined after the third daily application of mechanical stimulation and panels correspond to: (a) and (d) no load, (b) and (e) static load, and (c) and (f) cyclic load. Curve corresponds to the best fit of a wrapped normal distribution based on angular standard deviations of: (a) 18.8 deg, (b) 14.8 deg, (c) 13.9 deg, (d) 22.9 deg, (e) 13.9 deg, and (f) 11.3 deg. (These numbers are plotted in Fig. S2(c) (Supplemental figures are available under the “Supplemental Data” tab for this paper on the ASME Digital Collection)).
3.3. Gene Expression.
On the third day of mechanical stimulation (6 hr after the third daily application of cyclic load), meshes were collected for all three loading groups and analyzed for expression of collagen types I and III, the ECM proteoglycans decorin and tenascin-C, and tendon/ligament selective proteins scleraxis, and tenomodulin (Fig. 7). Pairwise differences between groups were not statistically significant, but potential differences were noted. First, on the large diameter fiber meshes, cells that were maintained under a static load expressed slightly higher levels of tenomodulin than cells maintained under no load (p = 0.48) and expressed slightly higher levels of tenascin-C and tenomodulin than cells subjected to a cyclic load (p = 0.08 and p = 0.50, respectively). Second, when cells were exposed to no load, collagen type III expression was slightly elevated on small diameter fibers meshes than on large diameter fibers meshes (p = 0.27). Together, these data show that both fiber diameter and mechanical environment may influence cell phenotype. However, the cyclic loading regimen tested in this study did not appear to affect cell behavior relative to the no load group.
Fig. 7.
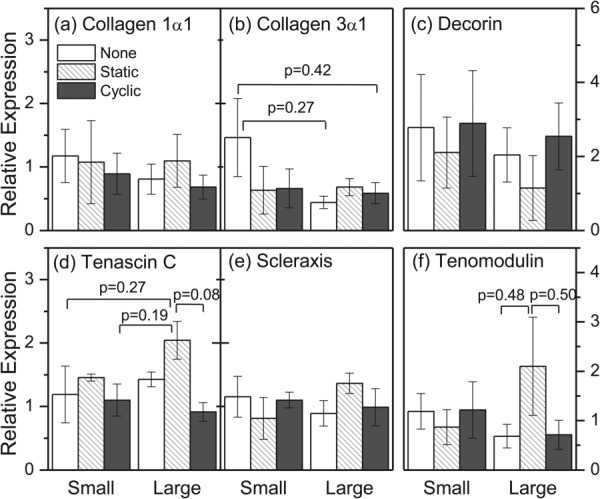
Relative gene expression of tendon/ligament primary collagens ((a) and (b)), tendon/ligament matrix accessory genes ((c) and (d)), and tendon/ligament selective genes ((e) and (f)) after 3 days of no load, static load, or cyclic load culture on electrospun polyurethane meshes with mean fiber diameter size of 0.60 μm (small) or 1.74 μm (large). Bars correspond to the mean ± SEM for n = 4 for all groups except for small fiber diameter meshes group, static load, where n = 2.
4. Discussion
In this study, the effect of fiber diameter on the adhesion, morphology, and expression of connective tissue genes was evaluated in mechanically stimulated C3H10T1/2 cells. Cells proliferated on both large (1.74 μm) and small (0.60 μm) diameter fiber meshes under both cyclic and static mechanical loading and maintained orientation parallel to the direction of fiber alignment under applied strain. On large diameter fiber meshes, cells that were cultured for 3 days under static tension expressed slightly higher levels of tenascin-C and tenomodulin, while on small diameter fibers, cells that were cultured under no load expressed slightly more type III collagen. However, differences in gene expression were not statistically significant.
Segmented polyurethane electrospun meshes produced for this study displayed nonlinear mechanical behavior under tensile loading, exhibiting distinct toe-in, linear-elastic, and yield regions (Fig. 3(a)) similar to native ligament [27,28]. While direct observation of fiber kinematics during tensile loading was not performed, individual fibers within the electrospun mesh should reorient parallel to the loading direction in the toe-in region and elongate in the linear-elastic region. Meshes with the smaller fiber diameter (0.60 μm) had a higher elastic modulus (9.2 MPa) than the meshes with the larger (1.74 μm) fiber diameter (4.2 MPa). This difference could be attributed to various phenomena, including fiber packing density (i.e., porosity), the strength of fiber–fiber cross-links, and the degree of strain-induced crystallization of the PCL microphase. PEUUR meshes were subsequently tested under a simulated strain regimen (4%, 0.25 Hz, 30 min) to predict their performance within the bioreactor. The large hysteresis loop of the first cycle indicates dissipation of energy, likely due to the breakage of smaller fibers and weaker fiber cross-links (Figs. 3(b) and 3(c)) when first strained. In contrast, minimal hysteresis of the last cycle indicates that nearly all of the mechanical energy of the mesh could be recovered upon unloading. Equally important, the relaxation curves for the first and last cycles nearly superimpose on one another, indicating a minimal amount of creep or change in the shape of the stress–strain curves over repeated cyclic loading. This implies that the mechanical environment to which adherent cells were exposed likely did not change substantially over the 30 min cyclic stimulation periods.
While studies have been performed to independently evaluate the effect of the diameters of electrospun fibers on cell phenotype in the absence of mechanical forces [16,17] and to probe cellular responses to mechanical stimulation on fibrous supports [21,24,29], the combined effect of fiber diameter and mechanical stimulation has not been previously examined. In this study, cell number was comparable across all loading conditions on meshes of both fiber diameters, indicating that mechanical stimulation did not undermine cell adhesion or proliferation. Further, SEM imaging (Fig. 8) indicated that cells did not penetrate below the mesh surface for either fiber diameter and for any mechanical treatment. Regardless of fiber diameter, cell alignment was more pronounced in cyclically and statically loaded meshes compared to the nonloaded meshes (Fig. 6 and Fig. S2(c) (Supplemental figures are available under the “Supplemental Data” tab for this paper on the ASME Digital Collection)), consistent with previous studies [21,24]. Finally, only modest differences in gene expression of relevant markers were observed in this study (Fig. 7). This may have been due to the shorter duration of mechanical stimulation (3 days) as compared to previous publications. For example, other research groups have mechanically stimulated cells for 2–4 weeks [21,24], and Teh et al., in particular, reported that significant upregulation in collagens I and III did not occur until after 2 weeks of stimulation [24]. In addition, previous studies—which have examined the effect of fiber diameters in the absence of mechanical stimulation—have shown only modest changes in gene expression of collagens I and III, and scleraxis at early timepoints [16,17]. Cardwell et al., who cultured C3H10T1/2 on small (0.50 μm), medium (1.0 μm), and large (2.0 μm) semi-aligned polyurethane fibers, reported significantly higher expression of collagen I on large diameter fibers only after 14 days of culture [17]. Similarly, Erisken et al. found modest differences in expression of collagens I, III, and V, and tenomodulin in primary human rotator cuff fibroblasts at day 3 on aligned poly(lactic-co-glycolic) acid (PLGA) meshes with fiber diameters of 320 nm, 680 nm, and 1.80 μm [16]. However, they reported significantly higher expression of these four genes at day 14 on 1.80 μm diameter fibers relative to cells on the smaller diameter fiber meshes.
Fig. 8.
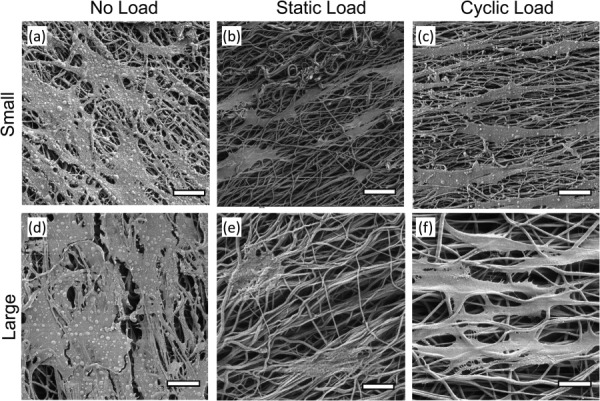
SEM images of C3H10T1/2 cells on: (a)–(c) small diameter and (d)–(f) large diameter electrospun polyurethane meshes after 3 days of: (a) and (d) no load, (b) and (e) static load, or (c) and (f) cyclic load. Scale bars correspond to 20 μm.
Despite the relatively similar levels of mRNA expression among the different experimental conditions (Fig. 7), five of the six genes measured on large diameter fiber meshes were elevated under static load relative to no load. This difference, although not statistically significant, may be the result of two phenomena. First, contact guidance phenomena may be more pronounced on larger diameter fibers, as Bashur et al. showed that cells exhibit a higher aspect ratio on larger diameter fibers [14]. Second, the nonlinear stress/strain relationship of PEUUR fiber meshes (Fig. 3(a)) suggests that the no load meshes may appear more compliant to adherent cells than the statically loaded meshes. Indeed, while cell aspect ratio was not significantly elevated on statically loaded large diameter meshes relative to the no load group (Fig. S2(b) (Supplemental figures are available under the “Supplemental Data” tab for this paper on the ASME Digital Collection)), cells were significantly more aligned (Fig. 6 and Fig. S2(c) (Supplemental figures are available under the “Supplemental Data” tab for this paper on the ASME Digital Collection)). Previous work by Engler et al. showed that cell phenotype can be guided by the mechanical properties of the substratum [30]. Consequently, we are currently examining the combined effect of static uniaxial tension and fiber modulus on expression of the connective tissue phenotype.
5. Conclusions
In this study, fibrous meshes with 0.60 and 1.74 μm diameters were cultured in a bioreactor which permitted mechanical stimulation and in situ imaging of cellular morphology. Under physiologic loading conditions, these small and large PEUUR-based electrospun fiber meshes displayed nonlinear and viscoelastic mechanical behavior and tensile moduli of 9 and 4 MPa, respectively. Nondestructive imaging demonstrated that cells remained adhered to the meshes and cell alignment differed between the load and no load mechanical environments. While gene expression of relevant connective tissue markers was not statistically different, on large diameter fiber meshes MSCs cultured under static tension expressed slightly elevated levels of tenascin-C and tenomodulin than MSCs on large diameter fiber meshes subjected to cyclic or no load. Together, these data indicate that fiber diameter and mechanical environment can alter cell morphology; however, longer studies may be required to demonstrate differences in cell phenotype.
Supplementary Material
Acknowledgment
The authors would like to thank the Tissue Engineering Resource Center (P41 EB002520) at Tufts University for providing equipment and facilities to perform this work. This publication was made possible by Grant No. AR 055872 to R.D.C. from the National Institutes of Health.
Contributor Information
Robyn D. Cardwell, Department of Biomedical Engineering, Virginia Tech, Blacksburg, VA 24061
Jonathan A. Kluge, Department of Biomedical Engineering, Tufts University, Medford, MA 02155
Patrick S. Thayer, Department of Biomedical Engineering, Virginia Tech, Blacksburg, VA 24061
Scott A. Guelcher, Chemical and Biomolecular Engineering, Vanderbilt University, Nashville, TN 37235
Linda A. Dahlgren, Large Animal Clinical Sciences, Virginia-Maryland, Regional College of Veterinary Medicine, Blacksburg, VA 24061
David L. Kaplan, Department of Biomedical Engineering, Tufts University, Medford, MA 02155
Aaron S. Goldstein, Department of Biomedical Engineering, Virginia Tech, Blacksburg, VA 24061; Department of Chemical Engineering, Virginia Tech, Blacksburg, VA 24061, e-mail: goldst@vt.edu.
References
- [1]. West, R. V. , and Harner, C. D. , 2005, “Graft Selection in Anterior Cruciate Ligament Reconstruction,” J. Am. Acad. Orthop. Surg., 13(3), pp. 197–207. [DOI] [PubMed] [Google Scholar]
- [2]. Guo, L. , Yang, L. , Duan, X.-J. , He, R. , Chen, G.-X. , Wang, F.-Y. , and Zhang, Y. , 2012, “Anterior Cruciate Ligament Reconstruction With Bone–Patellar Tendon–Bone Graft: Comparison of Autograft, Fresh-Frozen Allograft, and γ-Irradiated Allograft,” Arthroscopy, 28(2), pp. 211–217. 10.1016/j.arthro.2011.08.314 [DOI] [PubMed] [Google Scholar]
- [3]. Altman, G. H. , Horan, R. L. , Lu, H. H. , Moreau, J. , Martin, I. , Richmond, J. C. , and Kaplan, D. L. , 2002, “Silk Matrix for Tissue Engineered Anterior Cruciate Ligaments,” Biomaterials, 23(20), pp. 4131–4141. 10.1016/S0142-9612(02)00156-4 [DOI] [PubMed] [Google Scholar]
- [4]. Chen, J. , Horan, R. L. , Bramono, D. , Moreau, J. E. , Wang, Y. , Geuss, L. R. , Collette, A. L. , Volloch, V. , and Altman, G. H. , 2006, “Monitoring Mesenchymal Stromal Cell Developmental Stage to Apply On-Time Mechanical Stimulation for Ligament Tissue Engineering,” Tissue Eng., 12(11), pp. 3085–3095. 10.1089/ten.2006.12.3085 [DOI] [PubMed] [Google Scholar]
- [5]. Freeman, J. W. , Woods, M. D. , Cromer, D. A. , Wright, L. D. , and Laurencin, C. T. , 2009, “Tissue Engineering of the Anterior Cruciate Ligament: The Viscoelastic Behavior and Cell Viability of a Novel Braid-Twist Scaffold,” J. Biomater. Sci., Polym. Ed., 20(12), pp. 1709–1728. 10.1163/156856208X386282 [DOI] [PubMed] [Google Scholar]
- [6]. Freeman, J. W. , Woods, M. D. , Cromer, D. A. , Ekwueme, E. C. , Andric, T. , Atiemo, E. A. , Bijoux, C. H. , and Laurencin, C. T. , 2011, “Evaluation of a Hydrogel-Fiber Composite for ACL Tissue Engineering,” J. Biomech., 44(4), pp. 694–699. 10.1016/j.jbiomech.2010.10.043 [DOI] [PubMed] [Google Scholar]
- [7]. Liljensten, E. , Gisselfalt, K. , Edberg, B. , Bertilsson, H. , Flodin, P. , Nilsson, A. , Lindahl, A. , and Peterson, L. , 2002, “Studies of Polyurethane Urea Bands for ACL Reconstruction,” J. Mater. Sci.: Mater. Med., 13(4), pp. 351–359. 10.1023/A:1014380332762 [DOI] [PubMed] [Google Scholar]
- [8]. Gupta, P. , Elkins, C. , Long, T. E. , and Wilkes, G. L. , 2005, “Electrospinning of Linear Homopolymers of Poly(Methyl Methacrylate): Exploring Relationships Between Fiber Formation, Viscosity, Molecular Weight and Concentration in a Good Solvent,” Polymer, 46(13), pp. 4799–4810. 10.1016/j.polymer.2005.04.021 [DOI] [Google Scholar]
- [9]. Balestrini, J. L. , and Billiar, K. L. , 2009, “Magnitude and Duration of Stretch Modulate Fibroblast Remodeling,” ASME J. Biomech. Eng., 131(5), p. 051005. 10.1115/1.3049527 [DOI] [PubMed] [Google Scholar]
- [10]. Paxton, J. Z. , Hagerty, P. , Andrick, J. J. , and Baar, K. , 2012, “Optimizing an Intermittent Stretch Paradigm Using ERK1/2 Phosphorylation Results in Increased Collagen Synthesis in Engineered Ligaments,” Tissue Eng., Part A, 18(3–4), pp. 277–284. 10.1089/ten.tea.2011.0336 [DOI] [PMC free article] [PubMed] [Google Scholar]
- [11]. Webb, K. , Hitchcock, R. W. , Smeal, R. M. , Li, W. , Gray, S. D. , and Tresco, P. A. , 2006, “Cyclic Strain Increases Fibroblast Proliferation, Matrix Accumulation, and Elastic Modulus of Fibroblast-Seeded Polyurethane Constructs,” J. Biomech., 39(6), pp. 1136–1144. 10.1016/j.jbiomech.2004.08.026 [DOI] [PubMed] [Google Scholar]
- [12]. Lee, C. H. , Shin, H. J. , Cho, I. H. , Kang, Y. M. , Kim, I. A. , Park, K. D. , and Shin, J. W. , 2005, “Nanofiber Alignment and Direction of Mechanical Strain Affect the ECM Production of Human ACL Fibroblast,” Biomaterials, 26(11), pp. 1261–1270. 10.1016/j.biomaterials.2004.04.037 [DOI] [PubMed] [Google Scholar]
- [13]. Yin, Z. , Chen, X. , Chen, J. L. , Shen, W. L. , Hieu Nguyen, T. M. , Gao, L. , and Ouyang, H. W. , 2010, “The Regulation of Tendon Stem Cell Differentiation by the Alignment of Nanofibers,” Biomaterials, 31(8), pp. 2163–2175. 10.1016/j.biomaterials.2009.11.083 [DOI] [PubMed] [Google Scholar]
- [14]. Bashur, C. A. , Shaffer, R. D. , Dahlgren, L. A. , Guelcher, S. A. , and Goldstein, A. S. , 2009, “Effect of Fiber Diameter and Alignment of Electrospun Polyurethane Meshes on Mesenchymal Progenitor Cells,” Tissue Eng., Part A, 15(9), pp. 2435–2445. 10.1089/ten.tea.2008.0295 [DOI] [PubMed] [Google Scholar]
- [15]. Chaurey, V. , Block, F. , Su, Y.-H. , Chiang, P.-C. , Botchwey, E. , Chou, C.-F. , and Swami, N. S. , 2012, “Nanofiber Size-Dependent Sensitivity of Fibroblast Directionality to Alignment Methodology of Scaffold,” Acta Biomater., 8(11), pp. 3982–3990. 10.1016/j.actbio.2012.06.041 [DOI] [PubMed] [Google Scholar]
- [16]. Erisken, C. , Zhang, X. , Moffat, K. L. , Levine, W. N. , and Lu, H. H. , 2013, “Scaffold Fiber Diameter Regulates Human Tendon Fibroblast Growth and Differentiation,” Tissue Eng., Part A, 19(3–4), pp. 519–528. 10.1089/ten.tea.2012.0072 [DOI] [PMC free article] [PubMed] [Google Scholar]
- [17]. Cardwell, R. D. , Dahlgren, L. A. , and Goldstein, A. S. , 2014, “Electrospun Fibre Diameter, Not Alignment, Affects Mesenchymal Stem Cell Differentiation Into the Tendon/Ligament Lineage,” J. Tissue Eng. Regener. Med., 8(12), pp. 937–945. 10.1002/term.1589 [DOI] [PubMed] [Google Scholar]
- [18]. Arnoczky, S. P. , Lavagnino, M. , and Egerbacher, M. , 2007, “The Mechanobiological Aetiopathogenesis of Tendinopathy: Is it the Over-Stimulation or the Under-Stimulation of Tendon Cells?,” Int. J. Exp. Pathol., 88(4), pp. 217–226. 10.1111/j.1365-2613.2007.00548.x [DOI] [PMC free article] [PubMed] [Google Scholar]
- [19]. Iatridis, J. C. , MaClean, J. J. , and Ryan, D. A. , 2005, “Mechanical Damage to the Intervertebral Disc Annulus Fibrosus Subjected to Tensile Loading,” J. Biomech., 38(3), pp. 557–565. 10.1016/j.jbiomech.2004.03.038 [DOI] [PMC free article] [PubMed] [Google Scholar]
- [20]. Wang, J. H. , 2006, “Mechanobiology of Tendon,” J. Biomech., 39(9), pp. 1563–1582. 10.1016/j.jbiomech.2005.05.011 [DOI] [PubMed] [Google Scholar]
- [21]. Barber, J. G. , Handorf, A. M. , Allee, T. J. , and Li, W.-J. , 2011, “Braided Nanofibrous Scaffold for Tendon and Ligament Tissue Engineering,” Tissue Eng., Part A, 19(11–12), pp. 1265–1274. 10.1089/ten.tea.2010.0538 [DOI] [PubMed] [Google Scholar]
- [22]. Kaneko, D. , Sasazaki, Y. , Kikuchi, T. , Ono, T. , Nemoto, K. , Matsumoto, H. , and Toyama, Y. , 2009, “Temporal Effects of Cyclic Stretching on Distribution and Gene Expression of Integrin and Cytoskeleton by Ligament Fibroblasts In Vitro,” Connect. Tissue Res., 50(4), pp. 263–269. 10.1080/03008200902846270 [DOI] [PMC free article] [PubMed] [Google Scholar]
- [23]. Gilbert, T. W. , Stewart-Akers, A. M. , Sydeski, J. , Nguyen, T. D. , Badylak, S. F. , and Woo, S. L. , 2007, “Gene Expression by Fibroblasts Seeded on Small Intestinal Submucosa and Subjected to Cyclic Stretching,” Tissue Eng., 13(6), pp. 1313–1323. 10.1089/ten.2006.0318 [DOI] [PubMed] [Google Scholar]
- [24]. Teh, T. K. , Toh, S. L. , and Goh, J. C. , 2013, “Aligned Fibrous Scaffolds for Enhanced Mechanoresponse and Tenogenesis of Mesenchymal Stem Cells,” Tissue Eng., Part A, 19(11–12), pp. 1360–1372. 10.1089/ten.tea.2012.0279 [DOI] [PubMed] [Google Scholar]
- [25]. Kluge, J. A. , Leisk, G. G. , Cardwell, R. D. , Fernandes, A. P. , House, M. , Ward, A. , Dorfmann, A. L. , and Kaplan, D. L. , 2011, “Bioreactor System Using Noninvasive Imaging and Mechanical Stretch for Biomaterial Screening,” Ann. Biomed. Eng., 39(5), pp. 1390–1402. 10.1007/s10439-010-0243-8 [DOI] [PMC free article] [PubMed] [Google Scholar]
- [26]. Livak, K. J. , and Schmittgen, T. D. , 2001, “Analysis of Relative Gene Expression Data Using Real-Time Quantitative PCR and the 2(-Delta Delta C(T)) Method,” Methods, 25(4), pp. 402–408. 10.1006/meth.2001.1262 [DOI] [PubMed] [Google Scholar]
- [27]. Kwon, K. I. , Kidoaki, S. , and Matsuda, T. , 2005, “Electrospun Nano- to Microfiber Fabrics Made of Biodegradable Copolyesters: Structural Characteristics, Mechanical Properties and Cell Adhesion Potential,” Biomaterials, 26(18), pp. 3929–3939. 10.1016/j.biomaterials.2004.10.007 [DOI] [PubMed] [Google Scholar]
- [28]. Kidoaki, S. , Kwon, I. K. , and Matsuda, T. , 2006, “Structural Features and Mechanical Properties of In Situ-Bonded Meshes of Segmented Polyurethane Electrospun From Mixed Solvents,” J. Biomed. Mater. Res., Part B, 76(1), pp. 219–229. 10.1002/jbm.b.30336 [DOI] [PubMed] [Google Scholar]
- [29]. Kahn, C. J. , Ziani, K. , Zhang, Y. M. , Liu, J. , Tran, N. , Babin, J. , de Isla, N. , Six, J.-L. , and Wang, X. , 2013, “Mechanical Properties Evolution of a PLGA-PLCL Composite Scaffold for Ligament Tissue Engineering Under Static and Cyclic Traction-Torsion In Vitro Culture Conditions,” J. Biomater. Sci., Polym. Ed., 24(8), pp. 899–911. 10.1080/09205063.2012.727265 [DOI] [PubMed] [Google Scholar]
- [30]. Engler, A. J. , Sen, S. , Sweeney, H. L. , and Discher, D. E. , 2006, “Matrix Elasticity Directs Stem Cell Lineage Specification,” Cell, 126(4), pp. 677–689. 10.1016/j.cell.2006.06.044 [DOI] [PubMed] [Google Scholar]
Associated Data
This section collects any data citations, data availability statements, or supplementary materials included in this article.