The lipogenic transcription factor SREBP1c is often aberrantly activated in cancer cells and suppresses primary cilium formation. PLA2G3 is implicated in the cilium-repressing action of SREBP1c. This involves alterations in vesicular trafficking, which is largely mediated by increased lysophospholipid levels.
Abstract
Distortion of primary cilium formation is increasingly recognized as a key event in many human pathologies. One of the underlying mechanisms involves aberrant activation of the lipogenic transcription factor sterol regulatory element–binding protein 1c (SREBP1c), as observed in cancer cells. To gain more insight into the molecular pathways by which SREBP1c suppresses primary ciliogenesis, we searched for overlap between known ciliogenesis regulators and targets of SREBP1. One of the candidate genes that was consistently up-regulated in cellular models of SREBP1c-induced cilium repression was phospholipase A2 group III (PLA2G3), a phospholipase that hydrolyzes the sn-2 position of glycerophospholipids. Use of RNA interference and a chemical inhibitor of PLA2G3 rescued SREBP1c-induced cilium repression. Cilium repression by SREBP1c and PLA2G3 involved alterations in endosomal recycling and vesicular transport toward the cilium, as revealed by aberrant transferrin and Rab11 localization, and was largely mediated by an increase in lysophosphatidylcholine and lysophosphatidylethanolamine levels. Together these findings indicate that aberrant activation of SREBP1c suppresses primary ciliogenesis by PLA2G3-mediated distortion of vesicular trafficking and suggest that PLA2G3 is a novel potential target to normalize ciliogenesis in SREBP1c-overexpressing cells, including cancer cells.
INTRODUCTION
The primary cilium is a microtubule-based organelle that projects from the surface of a wide variety of cells. It acts as an antenna to sense extracellular cues and regulates numerous signaling pathways such as Hedgehog and Wnt (Christensen et al., 2007; Berbari et al., 2009). Defects in primary ciliogenesis are associated with a wide variety of human diseases. These include genetic disorders called ciliopathies but also many more pathologies, including obesity and cancer, reflecting the importance of proper assembly and maintenance of the cilium in developmental biology and tissue homeostasis (Marshall and Nonaka, 2006; Fliegauf et al., 2007). In cancer, loss of the primary cilium is observed in many tumor types (Schraml et al., 2009; Seeley et al., 2009; Yuan et al., 2010; Kim et al., 2011; Egeberg et al., 2012). It promotes aberrant cell signaling (Egeberg et al., 2012) and reflects the inability of cancer cells to exit the cell cycle (Plotnikova et al., 2008).
Previous work by our team showed that aberrant activation of the lipogenic transcription factor sterol regulatory element-binding protein 1c (SREBP1c) plays a key role in the loss of the primary cilium in cancer cells (Willemarck et al., 2010). SREBP1c is a helix-loop-helix leucine zipper transcription factor that modulates the expression of a wide array of enzymes involved in fatty acid synthesis. SREBP1c is synthesized as inactive precursor inserted into the endoplasmic reticulum membrane, where it binds to the SREBP cleavage activating protein (SCAP). To activate transcription, SREBP1c/SCAP complex translocates to the Golgi, where a two-step proteolytic cleavage releases the NH2-terminal domain of SREBP1c. This mature form can enter the nucleus and bind to sterol regulatory elements (SREs) within the promoter of its target genes (Brown and Goldstein, 1997; Horton et al., 2002). SREBP1c plays a key role in energy homeostasis and seems to be involved in lipid metabolism in cancer cells (Menendez and Lupu, 2007). Here SREBP1c is often overactivated by constitutive growth factor signaling and plays a key role in the cellular adaptation of lipid metabolism to the increased lipid demand and changing environmental conditions (Swinnen et al., 2000; Griffiths et al., 2013).
In this study, we sought to pinpoint the mechanism by which SREBP1c suppresses primary ciliogenesis. We identified phospholipase A2 group III (PLA2G3) as one of the prime mediators. PLA2G3 is a secreted phospholipase that hydrolyzes glycerophospholipids at the sn-2 position, resulting in the generation of lysophospholipids and the release of free fatty acids. The present study implicates PLA2G3 in the cilium-repressing action of SREBP1c by modulating vesicular trafficking and reveals significant novel insights in the mechanism of primary cilium suppression in SREBP1c-overexpressing cells, including some cancer cells.
RESULTS
Aberrant SREBP1c expression impairs primary cilium formation in multiple cell line models
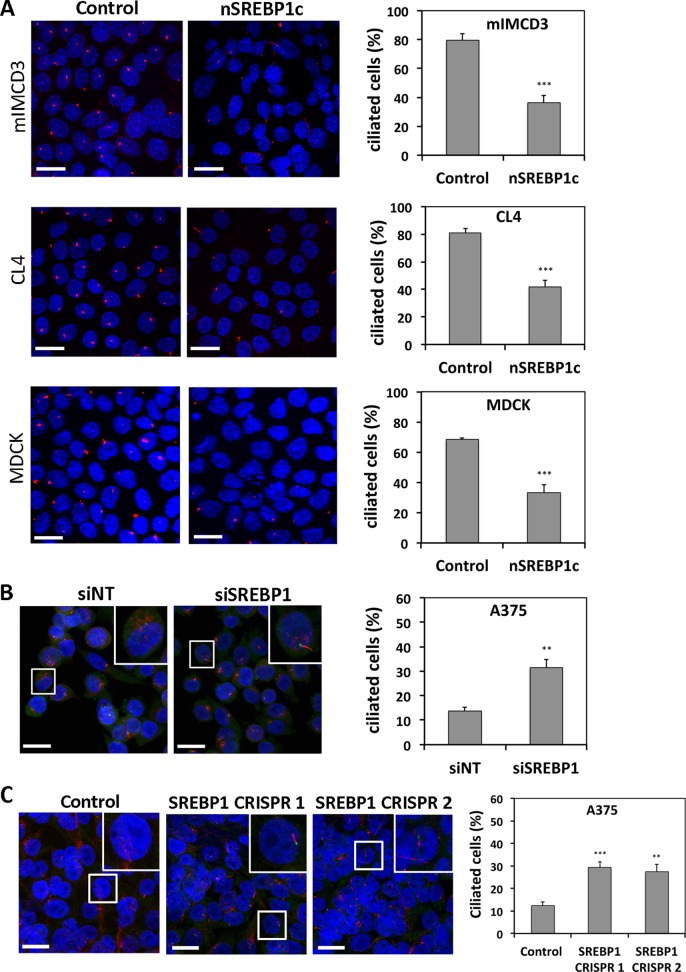
Previous research by our team revealed that aberrant expression of the mature nuclear form of human SREBP1c (nSREBP1c) distorts primary cilium formation in Xenopus embryos and Madin–Darby canine kidney (MDCK) cells (Willemarck et al., 2010). To consolidate this concept, we now expand these findings to other well-ciliated cell line models from different species, including murine inner medullary collecting duct (mIMCD3) and porcine kidney (CL4) cells, which are commonly used to study ciliogenesis. To this end, cells were infected with adenovirus encoding nSREBP1c or control virus. nSREBP1c functionality was confirmed with quantitative real time reverse transcription PCR (qRT-PCR) and Western blot analysis for fatty acid synthase (FASN) expression, a known target gene of nSREBP1c (Supplemental Figure S1A). After reaching confluency, primary cilia were visualized by immunocytochemical staining for axonemal marker acetylated α-tubulin (Figure 1A). Control mIMCD3 cells displayed cilia on 83% of the cells, whereas nSREBP1c transduction significantly decreased the percentage of ciliated cells to 37%. Similarly, in CL4 cells, ectopic nSREBP1c expression resulted in a significantly decreased ciliogenesis, from 81% to 42%. Similar deficits in ciliogenesis were observed in nSREBP1c-transfected MDCK cells, as previously described (Willemarck et al., 2010). In all three cell lines, nSREBP1c transduction resulted in a flattening and enlargement of the cells, as previously described (Willemarck et al., 2010).
FIGURE 1:
Modulation of SREBP1c expression affects primary cilium formation in various cell line models. (A) Ectopic nSREBP1c expression in well-ciliated, nonmalignant cells decreases primary cilium formation. mIMCD3, CL4, and MDCK cells were infected with nSREBP1c or control adenovirus. Primary cilia were visualized by immunofluorescence staining of acetylated α-tubulin (red). Nuclei were stained with DAPI (blue). For quantification, 500–900 cells were scored. (B, C) SREBP1 knockdown stimulates ciliogenesis in lipogenic cancer cells. A375 cells were transfected with nontargeting (siNT) or SREBP1-targeting siRNA (siSREBP1; B) or with SREBP1-targeting CRISPR/Cas9 plasmids (C). Cells were stained for acetylated α-tubulin (red), γ-tubulin (green), and DAPI (blue). For quantification, 700–800 cells were scored. Insets, magnification of a representative region. Left, representative pictures of three independent experiments. Bar, 20 μM. Right, percentage of ciliated cells. Error bars, SEM. **p < 0.005 and ***p < 0.0005 using Student's t test.
We also performed the converse experiment. Because SREBP1c is constitutively activated in many cancer cells, we down-regulated endogenous SREBP1 in a highly lipogenic human malignant melanoma cancer cell line, A375. Transfection of this cell line with small interfering RNA (siRNA) targeting SREBP1 resulted in 90% knockdown of SREBP1c mRNA and protein expression (Supplemental Figure S1B). This led to significantly increased cilium formation in SREBP1-knockdown cells (32%) compared with cells transfected with nontargeting siRNA (15%), as revealed by primary cilium staining with antibodies against acetylated α-tubulin and centrosomal marker γ-tubulin (Figure 1B). As expected, we observed a low percentage of ciliated cancer cells in the control condition. To corroborate these findings, we down-regulated endogenous SREBP1 in A375 cells using CRISPR/Cas9 technology. Western blot analysis showed significant knockdown of SREBP1 in the total pool of cells transfected with two independent CRISPR/Cas9 plasmids (Supplemental Figure S1C). This led to a significant increase in cilium formation (nearly 30%) compared with control cells (12%; Figure 1C).
Collectively these results confirm and extend our earlier findings that SREBP1c overexpression disturbs primary cilium formation in both normal and SREBP1c-overexpressing cancer cells.
Identification of PLA2G3 as a candidate SREBP1c-regulated gene affecting ciliogenesis
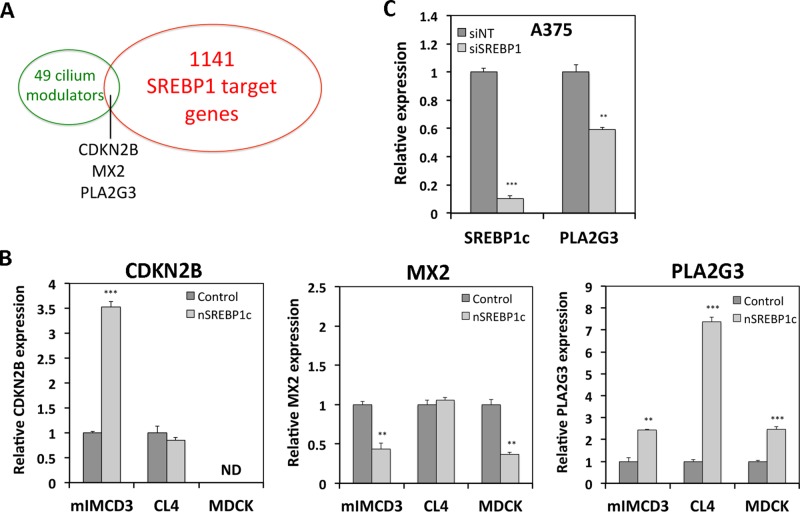
To identify mediators of SREBP1c-induced cilium repression, we searched for SREBP1c targets in a list of previously identified modulators of ciliogenesis selected in a functional genomic screen (Kim et al., 2010). From the 36 positive and 13 negative cilium modulators listed, we selected three genes (Figure 2A) that are directly regulated by SREBP1 based on existing chromatin immunoprecipitation (ChIP)-chip and microarray data: cyclin-dependent kinase inhibitor 2B (CDKN2B), myxovirus resistance 2 (MX2), and PLA2G3 (Reed et al., 2008). To test whether any of these potential targets of SREBP1 is indeed affected by SREBP1c in our ciliogenesis model systems, we assessed the expression of the selected genes by qRT-PCR in mIMCD3, CL4, and MDCK cells infected with adenovirus encoding nSREBP1c or with control vector (Figure 2B). nSREBP1c differentially affected the expression of these genes in the various cell lines. CDKN2B expression was not consistently affected by nSREBP1c in all the cell lines and was undetectable in MDCK cells. MX2 was differentially affected in the various models. Only the gene encoding PLA2G3, a secreted phospholipase A2 enzyme, was consistently activated in all three cell lines. Hence, we selected PLA2G3 for further investigation.
FIGURE 2:
Identification of PLA2G3 as candidate gene mediating nSREBP1c-induced cilium repression. (A) Venn diagram of known cilium modulators and direct SREBP1 targets. (B) qRT-PCR analysis of CDKN2B, MX2, and PLA2G3 in mIMCD3, CL4, and MDCK cells 48 h after infection with adenovirus encoding nSREBP1c versus control vector. ND, nondetectable. (C) qRT-PCR analysis of SREBP1c and PLA2G3 in A375 cells 48 h after transfection with SREBP1 siRNA (siSREBP1) or nontargeting siRNA (siNT). N = 3; error bars, SEM. **p < 0.005 and ***p < 0.0005 using Student's t test.
To establish further the link between SREBP1c activation and PLA2G3 expression, we performed the reverse experiment by down-regulating the endogenous SREBP1 in highly lipogenic A375 melanoma cancer cells. Consistent with a role of endogenous SREBP1c in the regulation of PLA2G3, siRNA-mediated knockdown of SREBP1c resulted in a 40% decrease in PLA2G3 expression (Figure 2C).
PLA2G3 is a direct target of SREBP1c
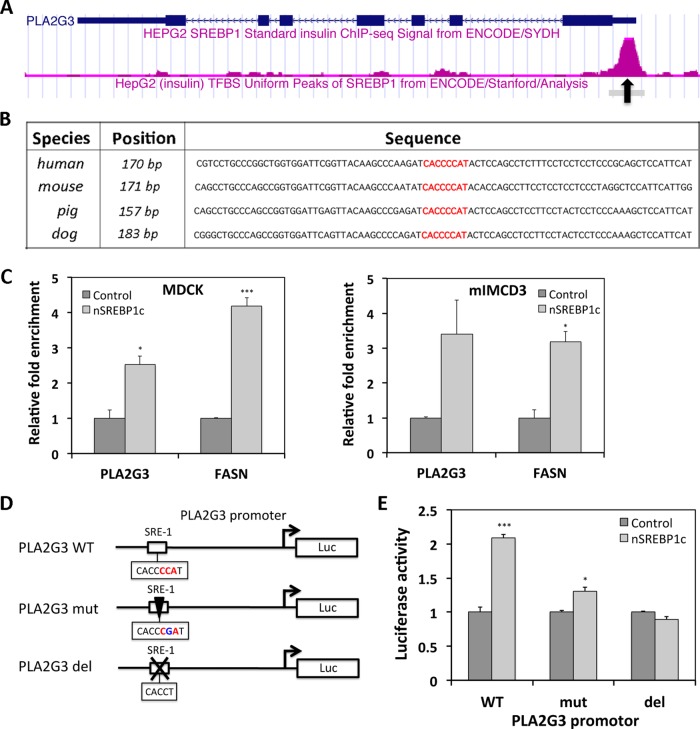
The ChIP-chip data mentioned earlier (Reed et al., 2008) suggest that PLA2G3 is a direct target of SREBP1c. In addition, analysis of ChIP-sequencing (seq) data in the ENCODE project (Bernstein et al., 2012) showed SREBP1 occupation at the promoter of PLA2G3 (Figure 3A). Of importance, the potential SREBP1-binding site identified in these ChIP studies (referred to as SRE-1) is conserved in the PLA2G3 promoter region of all four species from which the cell lines we use in this study are derived (mouse, pig, dog, and human; Figure 3B). To confirm binding of nSREBP1c to the PLA2G3 gene in our models, we performed ChIP experiments with MDCK and mIMCD3 cells infected with adenovirus encoding nSREBP1c or control virus. qRT-PCR analysis using primers flanking the SRE-1 motif in the promoter of PLA2G3 showed significantly increased signal upon nSREBP1c expression, indicative of nSREBP1c binding directly to the promoter of PLA2G3 in MDCK cells. A similar trend was observed in mIMCD3 cells (Figure 3C).
FIGURE 3:
Identification of cilium modulator PLA2G3 as direct target of SREBP1c. (A) ChIP-seq analysis from ENCODE showing SREBP1 binding (pink peak) on the promoter of PLA2G3 (blue) in HEPG2 cells. The black arrow indicates the position of the SRE-1 binding site. (B) Alignment of the PLA2G3 promoter region of four species (human, mouse, pig, and dog) showing that the SRE-1 binding site (CACCCCAT) is conserved. (C) ChIP analysis of nSREBP1 binding to the SRE-1 binding site in the promoter of PLA2G3 in MDCK and mIMCD3 cells. The well-known SREBP1c target gene, FASN, was used as a reference. (D) Overview of PLA2G3 promoter-reporter constructs containing wild-type (WT), mutated (mut), or deleted (del) SRE-1 binding site. (E) Luciferase assay of WT, mut, and del PLA2G3 promoter-reporter constructs in HEK-293 cells 24 h after transfection together with control or SREBP1c plasmid, using β-galactosidase for normalization. N = 3; error bars, SEM. *p < 0.05 and ***p < 0.0005 using Student's t test.
To determine the importance of this site in the transcriptional regulation of PLA2G3 by SREBP1c, we performed a promoter luciferase report assay with human PLA2G3 promoter-based constructs containing the wild-type, mutated, or deleted SRE-1 binding site (Figure 3D). On cotransfection with SREBP1c-encoding plasmid in HEK cells, increased luciferase activity was measured for the wild-type promoter construct. Significantly less activation was observed for the promoter construct with mutated SRE-1 site, and no increased activity was measured for the deleted-SRE-1 promoter construct (Figure 3E).
Taken together, these data indicate that nSREBP1c interacts with the SRE-1 binding site in the promoter of PLA2G3 and regulates PLA2G3 gene expression.
PLA2G3 acts as mediator of SREBP1c-induced cilium repression
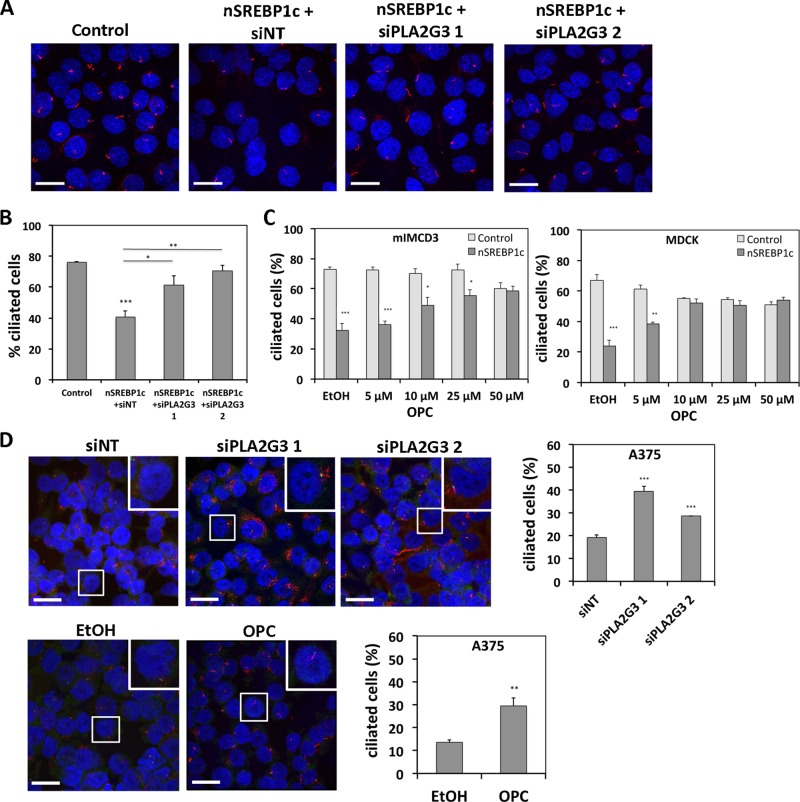
To explore the role of PLA2G3 in SREBP1c-induced cilium repression, we attenuated PLA2G3 induction by nSREBP1c using siRNA-mediated knockdown in mIMCD3 cells and assessed the affect on ciliogenesis. When analyzed by qRT-PCR, knockdown of PLA2G3 using two different siRNAs reduced PLA2G3 expression in nSREBP1c-transduced cells to nearly basal levels observed in control cells (Supplemental Figure S2A). An alignment study for these mouse PLA2G3 siRNAs showed no specificity for other secreted PLA2 family members (PLA2G1b, PLA2G2a, PLA2G2c, PLA2G2d, PLA2G2e, PLA2G2f, PLA2G5, PLA2G10, PLA2G12a, PLA2G12b). Acetylated α-tubulin staining revealed that PLA2G3 knockdown rescued ciliogenesis in nSREBP1c-transfected mIMCD3 cells (Figure 4, A and B). To corroborate these findings, we attenuated PLA2G3 activity using oleyloxyethyl phosphorylcholine (OPC), an inhibitor of secreted phospholipase A2. In line with the knockdown experiment, OPC treatment restored cilium formation in nSREBP1c-transduced mIMCD3 and MDCK cells in a dose-dependent manner (Figure 4C). Moreover, siRNA-mediated knockdown of PLA2G3 in lipogenic melanoma A375 cells using two different siRNAs causing 70 and 75% knockdown of PLA2G3 (Supplemental Figure S2B) stimulated ciliogenesis (Figure 4D). An alignment study of these human PLA2G3 siRNAs showed no off-target effects toward other secreted PLA2 family members. A similar increase in ciliogenesis was observed after treatment of A375 cells with OPC (Figure 4D).
FIGURE 4:
Involvement of PLA2G3 in SREBP1c-induced cilium repression. (A, B) Knockdown of PLA2G3 attenuates SREBP1c-induced cilium repression in nonmalignant cells. mIMCD3 cells were infected with control or nSREBP1c adenovirus in combination with PLA2G3-targeting siRNA (siPLA2G3) or nontargeting siRNA (siNT). Cells were stained for acetylated α-tubulin (red) and DAPI (blue). Representative pictures of two independent experiments. Bar, 20 μM. For quantification, 250–450 cells were scored. (C) Chemical inhibition of PLA2G3 attenuates SREBP1c-induced cilium repression in nonmalignant cells. mIMCD3 and MDCK cells were infected with control or nSREBP1c adenovirus and treated with different concentrations of OPC for 32 h. From 400 to 1000 cells were scored. (D) Knockdown or inhibition of PLA2G3 stimulates ciliogenesis in A375 cells. Cells were transfected with siPLA2G3 or treated with 5 μM OPC for 32 h. Cells were stained for acetylated α-tubulin (red), γ-tubulin (green), and DAPI (blue). Representative pictures of three independent experiments (bar, 20 μM). Insets, magnification of representative regions. For quantification, 600–900 cells were scored. N = 3; error bars, SEM. *p < 0.05, **p < 0.005, and ***p < 0.0005 using Student's t test.
Taken together, these data suggest that primary cilium suppression observed in SREBP1c-overexpressing cells results from increased PLA2G3 expression.
PLA2G3 mediates SREBP1c-induced cilium repression by disturbing vesicle trafficking
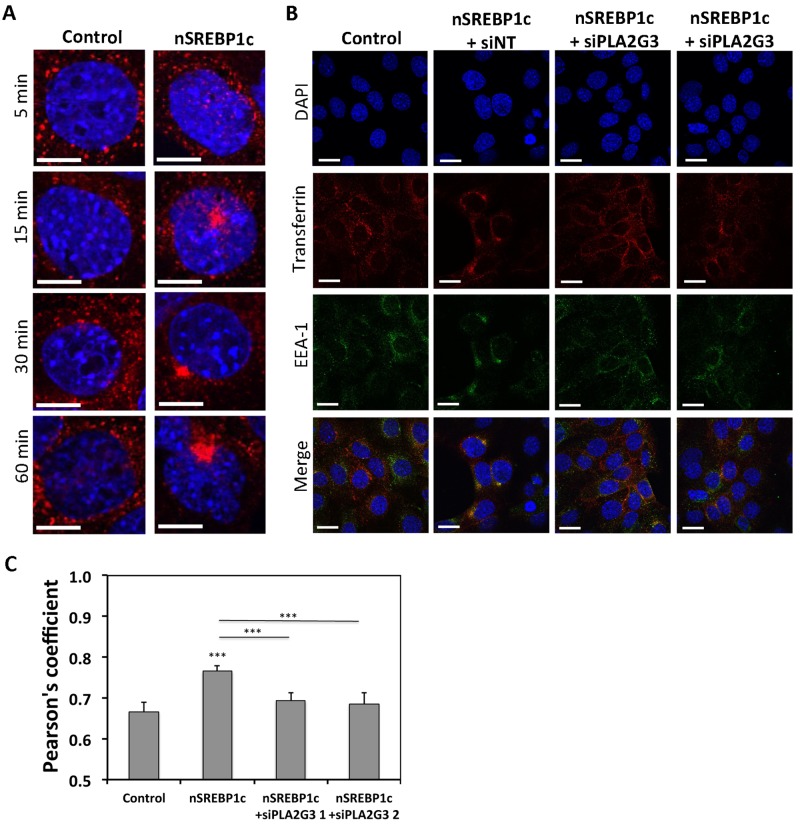
Willemarck et al. (2010) observed that ectopic nSREBP1c expression in MDCK cells results in mislocalization of apical markers (gp114/CEA and g135/podocalyxin) and defects in cyst formation. These findings suggest that SREBP1c expression affects apical protein transport and cell polarization. Given also that PLA2G3 has been implicated in endocytic recycling pathway (Kim et al., 2010) and because this process plays a key role in ciliogenesis (Hsiao et al., 2012), we hypothesized that PLA2G3 mediates nSREBP1c-induced cilium repression by disturbing vesicular trafficking necessary for cilium formation. To test this hypothesis, we assessed intracellular vesicular trafficking by analyzing the uptake and recycling of fluorescently labeled transferrin at different time points in control and nSREBP1c-transduced mIMCD3 cells. Transferrin was normally internalized in both control and nSREBP1c-transduced cells after 5 min of continuous uptake. However, after 15 min of transferrin uptake, cells overexpressing nSREBP1c enriched transferrin vesicles in a perinuclear compartment in contrast to control cells, in which transferrin-positive vesicles were found in the cytosol. More vesicles accumulated abnormally after 30 and 60 min of continuous Alexa 564–transferrin uptake in nSREBP1c-transduced cells, providing evidence that recycling of the transferrin receptor to the plasma membrane is impaired in cells with aberrant nSREBP1c expression (Figure 5A and Supplemental Figure S3A). This was not due to a reduction of the transferrin receptor at the protein level, as the total amount was comparable in control and nSREBP1c-transduced cells (Supplemental Figure S3B). Staining for the early endosomal antigen-1 (EEA1) showed that transferrin accumulates in the early endosomal compartment. When SREBP1c-transduced cells were transfected with siRNAs targeting PLA2G3, transferrin accumulation was no longer observed after 30 min in the early endosomal compartment (Figure 5B), demonstrating that defects in transferrin trafficking could be rescued by attenuation of PLA2G3 expression in cells overexpressing nSREBP1c. This was confirmed by calculating the Pearson correlation coefficient, which describes the colocalization of transferrin and EEA1-positive vesicles (Figure 5C).
FIGURE 5:
PLA2G3 mediates impaired transferrin recycling induced by SREBP1c. (A) SREBP1c-overexpressing cells accumulate transferrin in a perinuclear region. mIMCD3 cells were infected with nSREBP1c or control adenovirus. Cells were fixed after 5, 15, 30, and 60 min of Alexa Fluor 564–conjugated transferrin uptake (red) and stained with DAPI (blue). N = 3. Bar, 10 μM. Magnification of representative regions from Supplemental Figure S3A are shown. (B) PLA2G3 mediates aberrant transferrin accumulation in early endosomes upon SREBP1c transduction. mIMCD3 cells were infected with control or nSREBP1c adenovirus in combination with PLA2G3-targeting siRNA (siPLA2G3) or nontargeting siRNA (siNT). Cells were fixed after 30 min of Alexa Fluor 564–conjugated transferrin uptake (red) and stained for EEA1 (green) and DAPI (blue). N = 3. (C) Quantification of transferrin receptor colocalization with EEA1 expressed by Pearson's coefficient. N = 15; error bars, SEM. ***p < 0.0005 using Student's t test.
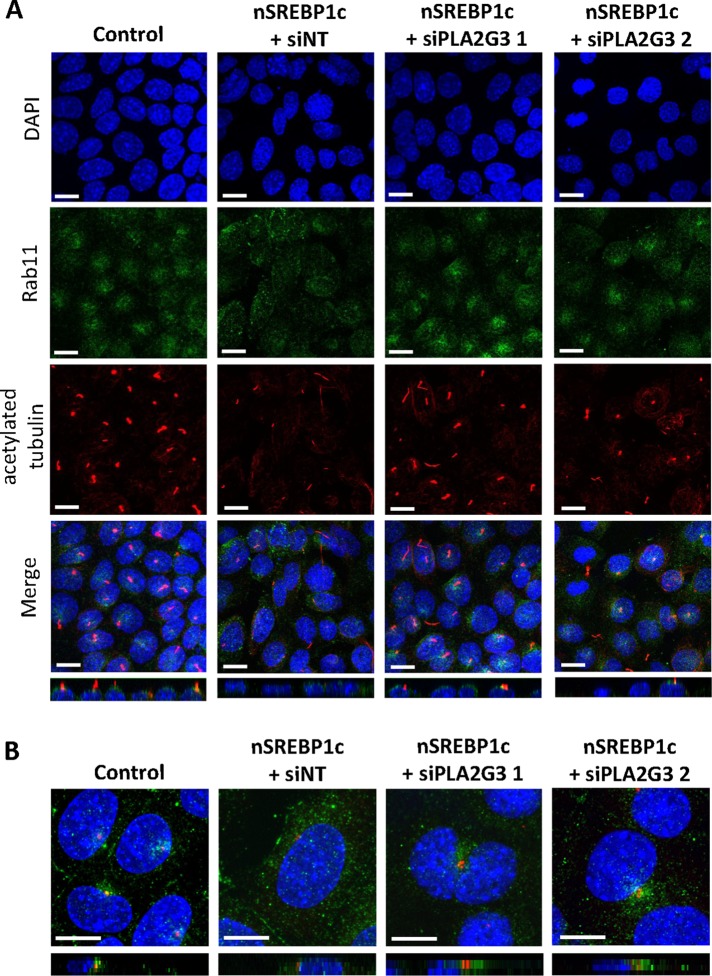
We also explored the localization of the endosomal-recycling marker Rab11. This Rab GTPase localizes at the ciliary base and regulates vesicle trafficking during ciliogenesis (Knodler et al., 2010; Westlake et al., 2011). Figure 6 shows that Rab11 is enriched at the base of the cilium around the centrosome in control mIMCD3 cells, whereas it is dispersed more diffusely in the cytoplasm in cells overexpressing nSREBP1c. In addition, these changes cannot be explained by differences in total amount of Rab11 at the protein level (Supplemental Figure S3B). These changes in vesicle transport were rescued when PLA2G3 expression was normalized using siRNAs.
FIGURE 6:
PLA2G3 mediates impaired Rab11 ciliary vesicle trafficking induced by SREBP1c. (A) Rab11 trafficking to the base of the cilium is disturbed by nSREBP1c-induced PLA2G3. mIMCD3 cells were infected with control or nSREBP1c adenovirus in combination with PLA2G3-targeting siRNA (siPLA2G3) or nontargeting siRNA (siNT). Cells were stained for rab11 (green), acetylated α-tubulin (red), and DAPI (blue). N = 3 (bar, 20 μM). Bottom, side view of Z-stack projection. (B) nSREBP1c-induced PLA2G3 disturbs Rab11 accumulation around the centrosome. mIMCD3 cells were treated as in A. Cells were stained for rab11 (green), γ-tubulin (red), and DAPI (blue). Bar, 10 μM. Bottom, side view of Z-stack projection.
Overall these results indicate that PLA2G3 affects vesicle trafficking to the plasma membrane in nSREBP1c-transduced cells.
Involvement of lysophospholipids in nSREBP1c- and PLA2G3-induced cilium repression
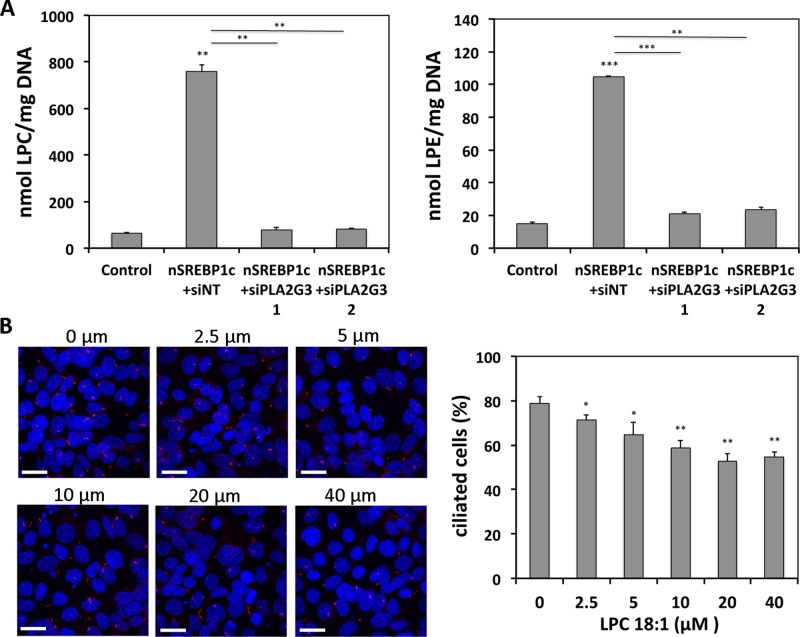
To assess further how nSREBP1c-induced PLA2G3 can suppress ciliogenesis, we determined the role of lysophospholipid formation by PLA2G3 in primary cilium formation. In fact, together with free fatty acids, lysophospholipids are the main direct end products of PLA2G3 and have the ability to affect vesicle formation by changing membrane curvature (Brown et al., 2003). We analyzed the lysophospholipid content of mIMCD3 cells using a targeted mass spectrometry method. nSREBP1c transduction dramatically increased all major lysophosphatidylcholine (LPC) and lysophosphatidylethanolamine (LPE) species (Figure 7A and Supplemental Figure S4A). When nSREBP1c-transduced cells were transfected with PLA2G3 targeting siRNAs, LPC and LPE contents were reduced to the basal levels of control cells (Figure 7A and Supplemental Figure S4A). We observed no significant changes in the levels of lysophosphatidylinositol and lysophosphatidylserine species (Supplemental Figure S4B).
FIGURE 7:
PLA2G3 mediates SREBP1c-induced suppression of ciliogenesis through formation of lysophospholipids. (A) nSREBP1c-induced PLA2G3 expression increases LPC and LPE levels. mIMCD3 cells were infected with control or nSREBP1c adenovirus in combination with PLA2G3-targeting siRNA (siPLA2G3) or nontargeting siRNA (siNT). Lysophospholipids were measured by electrospray tandem mass spectrometry after 72 h. Data are expressed as the sum of all measured individual LPC and LPE species, respectively. (B) LPC 18:1 treatment suppresses ciliogenesis. mIMCD3 cells were treated with different concentrations of LPC 18:1 for 72 h and stained for acetylated α-tubulin (red) and DAPI (blue). Representative pictures of two independent experiments. Bar, 20 μM. For quantification, 650–750 cells were scored. N = 3; error bars, SEM. *p < 0.05, **p < 0.005, and ***p < 0.0005 using Student's t test.
To elucidate further the role of increased lysophospholipid levels in cilium distortion in nSREBP1c-transduced cells, we treated mIMCD3 cells with LPC 18:1, one of the most abundant lysophospholipid species up-regulated by nSREBP1c (Supplemental Figure S4A), and visualized primary cilia using acetylated α-tubulin staining. We observed a significant and dose-dependent reduction of ciliogenesis after treatment with LPC 18:1 (Figure 7B). Similar treatments with free fatty acids evoked only minor effects (Supplemental Figure S4C).
These results indicate that PLA2G3-induced up-regulation of LPC and LPE levels at least partially mediates the distortion of primary cilium formation by nSREBP1c.
DISCUSSION
Defects in primary cilia formation are increasingly recognized as a central event in many human pathologies, including classical ciliopathies, obesity, and cancer (Fliegauf et al., 2007; Sen Gupta et al., 2009; Basten and Giles, 2013). Recently our team found that the lipogenic transcription factor SREBP1c, which is aberrantly activated in several of these diseases, plays an important role as mediator in the observed cilium repression (Willemarck et al., 2010). Here we show that the nSREBP1c-induced cilium repression is a more general phenomenon, which we observe in mammalian cell lines of different origin and in a human melanoma cancer cell line. To gain more insight into the molecular mechanisms by which SREBP1c suppresses primary ciliogenesis, we searched for SREBP1 targets in a list of known ciliogenesis modulator genes and identified PLA2G3 as a prime candidate.
PLA2G3 belongs to the subgroup of secreted phospholipase A2 and was previously implicated in cilium formation (Kim et al., 2010). Based on existing ChIP-chip and ChIP-seq data, complemented by our ChIP and promoter-reporter studies, we identified PLA2G3 as a direct target of SREBP1c. By modulating the expression of PLA2G3 in a highly selective way by siRNA or by more general chemical inhibition of phospholipase A2 activity in well-ciliated normal cells as well as in highly lipogenic cancer cells, we demonstrated that PLA2G3 indeed functions as a key mediator of SREBP1c-induced cilium repression. Consistent with our earlier findings that nSREBP1c expression results in mislocalization of apical markers (Willemarck et al., 2010) and that PLA2G3 may affect vesicle trafficking (Kim et al., 2010), we show here that PLA2G3 mediates the cilium repressing effect of SREBP1c by affecting vesicle trafficking. Vesicle trafficking is a process that has been implicated in ciliogenesis in several studies (Leroux, 2007; Emmer et al., 2010; Hsiao et al., 2012). In the present study, we showed that SREBP1c overexpression affected transferrin transport and led to a mislocalization of the recycling marker Rab11, which normally localizes to the perinuclear recycling compartment in proximity of the ciliary base and regulates vesicle trafficking during ciliogenesis (Knodler et al., 2010; Westlake et al., 2011). Modulation of PLA2G3 expression confirmed that these effects were mediated by this phospholipase.
As a secreted phospholipase, PLA2G3 hydrolyses the sn-2 position of glycerophospholipids, resulting in the release of a free fatty acid and a lysophospholipid in the outer leaflet of the plasma membrane or in the secretory and endocytotic vesicles inside the cell during its own secretion and subsequent internalization (Murakami et al., 2003). We showed that SREBP1c induces large levels of LPC and LPE, which, consistent with the localization of PLA2G3, are typically generated at the outer membrane leaflet. Mimicking the increase of these lipids by exogenous supplementation represses cilium formation, implying a role of these lipids in the cilium-repressing effects of SREBP1c. This finding is consistent with previous studies showing that lysophospholipids affect the membrane curvature (Brown et al., 2003).
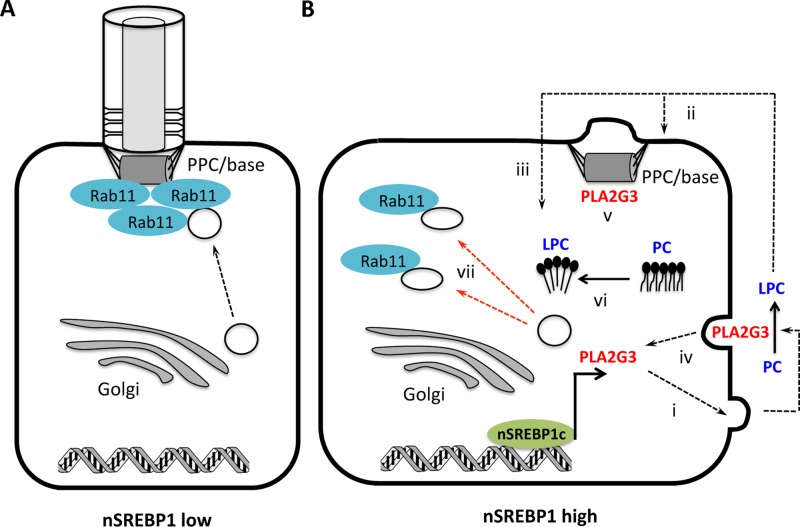
On the basis of these findings, we propose the following mechanistic model through which SREBP1 affects ciliogenesis in cancer cells. In nonmalignant cells, which show low levels of nuclear SREBP1, Rab11-positive vesicles traffic to the pericentrosomal preciliary compartment (PPC) associated with the centrosome (Kim et al., 2010) and later to the base of the forming cilium to deliver cargo required for ciliogenesis (Figure 8A). In contrast, in cancer cells that aberrantly express the lipogenic transcription factor SREBP1c, PLA2G3 gets overexpressed through direct transcriptional regulation (Figure 8B). On secretion, PLA2G3 may act on extracellular phospholipids of the plasma membrane, and/or on intracellular phospholipids during the secretion process or upon endocytosis, and/or upon sequestration at the centrosome/centriole pair (Kim et al., 2010). The increase in LPCs resulting from the hydrolysis of phosphatidtylcholines (PCs) increases the positive membrane curvature in the plasma membrane and intracellular (vesicle) membranes and causes Rab11-positive vesicles to deviate away from the PPC and the base of the cilium, resulting in the suppression of cilium formation in SREBP1c-overexpressing cells (Figure 8B).
FIGURE 8:
Mechanistic model through which nSREBP1c mediates cilium suppression. (A) In cells with low expression of mature nSREBP1, Rab11-positive transport vesicles deliver cargo at the PPC/base of the cilium. (B) In cells with increased nSREBP1 expression, nSREBP1c activates the transcription of PLA2G3, which, upon secretion, (i) hydrolyzes PC to produce LPC, which may act extracellularly (ii) and/or intracellularly after internalization (iii). Concomitantly, PLA2G3 may act intracellularly during the secretion process (i), upon reinternalization (iv), and/or upon sequestration at the centrosome/centriole pair (v). LPC may distort ciliogenesis by affecting membrane curvature (vi) and by causing Rab11-positive cargo to deviate away from the PPC or the base of the cilium (vii).
Together with findings that PLA2G3 is often overexpressed in lipogenic cancer types such as uterus, colon, and breast cancer (Murakami et al., 2005; Mounier et al., 2008; Brglez V, 2014), which also often show cilium loss (Yuan et al., 2010; Menzl et al., 2014), our findings provide significant novel insights into the mechanism by which the primary cilium gets lost in those human cancers characterized by SREBP1c overexpression. In view of the important role that primary cilia play in these diseases, our observations warrant further investigation into the role of SREBP1c and more specifically PLA2G3 as potential targets for novel therapeutic approaches aimed at restoring ciliogenesis.
MATERIALS AND METHODS
Cell culture and reagents
MDCK, mIMCD3, CL4, A375, and HEK-293 cells were purchased from the American Type Culture Collection (Manassas, VA). mIMCD3 and MDCK cells were cultured in DMEM/F12 (Life Technologies, Grand Island, NY), CL4 was grown in MEMα (Life Technologies), and HEK-293 cells were maintained in DMEM (Life Technologies), all supplemented with 10% fetal calf serum (Life Technologies) at 37°C in a humidified atmosphere of 5% CO2. To induce ciliogenesis, MDCK and A375 cells were grown to confluency, followed by an additional 5 d in serum-deprived medium, whereas mIMCD3 and CL4 cells were grown for an additional 2 d after confluency in the same medium. To ectopically express nSREBP1c, cells were infected on day 1 with 10 plaque-forming units (pfu)/cell (CL4), 30 pfu/cell (MDCK), or 50 pfu/cell (mIMCD3) of adenovirus encoding the first 403 amino acids of human SREBP1c or enhanced GFP as a control (kindly provided by F. Foufelle, Université Paris, Paris, France; Foretz et al., 1999). mIMCD3 cells were reverse transfected with 5 nM ON-TARGETplus siRNA targeting PLA2G3 or nontargeting siRNA (Ambion) using Lipofectamine RNAiMAX (Life Technologies) according to the manufacturer's reverse transfection protocol. To inhibit PLA2G3 activity, MDCK and mIMCD3 cells were treated with different concentrations of OPC (Cayman Chemicals, Ann Arbor, MI) dissolved in ethanol in the presence of 10% serum during 32 h before fixation. A375 cells were transfected with ON-TARGETplus siRNA targeting SREBP1 (1 nM), PLA2G3 (5 nM), or nontargeting siRNA (Dharmacon, Lafayette, CO) using Lipofectamine RNAiMAX. SiRNA sequences are provided in Supplemental Table S1. SREBP1 CRISPR/Cas9 plasmids (Sigma-Aldrich) targeting the first exon were transfected into A375 cells using FuGENE (Promega, Madison, WI) according to the supplier's protocol. One day posttransfection, GFP-positive, propidium iodide–negative cells were sorted using a FACSAria III (BD Biosciences, San Jose, CA) for further analysis. mIMCD3 cells were treated with lysophospholipids (LPC 18:1; Avanti Polar Lipids) or arachidonic acid (Sigma-Aldrich) for 72 h.
qRT-PCR analysis
RNA was isolated using the RNeasy Mini Kit (Qiagen, Hilden, Germany), and cDNA was prepared with Goscript Reverse Transcription (Promega) according to the manufacturer's protocol. qRT-PCR analysis was performed on a 7500 Fast Real-Time PCR system (Applied Biosystems, Foster City, CA). Ct values were normalized to 18S and expressed relative to the control condition. Primer sequences are provided in Supplemental Table S1.
Western blot analysis
Equal amounts of protein were loaded onto precast gels (NuPAGE; Life Technologies), transferred to nitrocellulose membranes, and incubated with antibodies against SREBP1 (Active Motif, Carlsbad, CA), FASN (Van de Sande et al., 2002), Rab11 (US Biological, Salem, MA), transferrin receptor (Zymed Laboratories, San Francisco, CA), α-tubulin (Cell Signaling Technology, Danvers, MA), and β-actin (Sigma-Aldrich), as described in Rysman et al. (2010).
ChIP-seq analysis in ENCODE
The presence of SREBP1 the ChIP peaks around the PLA2G3 transcription start site was analyzed using the data set HEPG2 SREBP1 Standard insulin ChIP-seq Signal from ENCODE/SYDH, available in the ENCODE project (Bernstein et al., 2012), with GSM935627 as the GEO sample accession number.
ChIP
ChIP was performed using the ChIP-IT Express Chromatin Immunoprecipitation Kit (Active Motif) according to the manufacturer's protocol. Protein–DNA complexes in MDCK and mIMCD3 cells were fixed by paraformaldehyde for 10 min at room temperature. Chromatin was sonicated with an ultrasonic processor (UP50H; Hielscher, Teltow, Germany) by repeated submaximal bursts with intermittent cooling on ice. Samples were immunoprecipitated overnight at 4°C with antibody against SREBP1 (Santa Cruz Biotechnology, Dallas, TX), RNA polymerase, or mouse immunoglobulin G (control kit; Active Motif) or no antibody, in combination with protein G magnetic beads. Antibody–chromatin complexes were eluted, and DNA was extracted (Qiagen MiniElute PCR Purification Sit) for qRT-PCR analysis. Primer sequences are provided in Supplemental Table S1.
Luciferase reporter assay
A PLA2G3 promoter-luciferase construct was obtained from Switchgear Genomics (Menlo Park, CA; s707075). Derivatives harboring a triple point mutation in the first SRE-binding site of the promoter (CACCCCAT → CACCGATT) or a deletion of the first SRE-binding site (Smith et al., 1990) were generated using the QuikChange Site Directed Mutagenesis Kit (Stratagene, La Jolla, CA). HEK-293 cells were cotransfected with the appropriate promoter construct (100 ng), an expression construct encoding SREBP-1c (pIRES-SREBP1c), or control plasmid (pIRES-NEO; 10 ng) and β-galactosidase expression plasmid (Stratagene; 10 ng) using FuGENE HD Transfection Reagent (Roche, Basel, Switzerland). At 24 h posttransfection, whole-cell lysates were analyzed using a firefly luciferase assay system (Promega) and normalized for β-galactosidase (Applied Biosystems).
Immunofluorescence
Cells were grown on coverslips and fixed 4 or 7 d postseeding for 20 min in 3.7% paraformaldehyde. Coverslips and paraffin sections were stained with primary antibodies against acetylated α-tubulin (Sigma-Aldrich), γ-tubulin (Sigma-Aldrich), EEA1 (Sigma-Aldrich), Rab11 (US Biologicals), and Alexa Fluor–conjugated secondary antibodies (Life Technologies). To study transferrin uptake, mIMCD3 cells were washed in serum-free medium and incubated in the same medium with Alexa Fluor 546–conjugated transferrin (Life Technologies) at 37°C, followed by fixation in paraformaldehyde. Images and Z-stack shots were acquired on an Olympus FluoView FV1000 confocal laser scanning microscope using an oil immersion UPLSAPO 60×/1.35 numerical aperture (Olympus, Tokyo, Japan) objective with associated software (FV10-ASW). The Z-step size was 1 μM. ImageJ software (National Institutes of Health, Bethesda, MD) was used to process images and quantify cilia. Cilia frequency was determined by counting cilia per cell. A primary cilium was considered if the long acetylated α-tubulin structure was attached to a γ-tubulin spot (acetylated α-tubulin plus γ-tubulin staining) or a long acetylated α-tubulin structure near a nucleus (acetylated α-tubulin and 4′,6-diamidino-2-phenylindole [DAPI] staining).
Analysis of lysophospholipid species by electrospray ionization tandem mass spectrometry
Lysophospholipids were analyzed by a targeted multiple reaction monitoring–based mass spectrometry method. Lipids were extracted by homogenizing cells in 1 N HCl/CH3OH (1:8 [vol/vol]), CHCl3, and 200 μg/ml antioxidant 2,6-di-tert-butyl-4-methylphenol (Sigma-Aldrich). Lysophospholipid standards were added based on the amount of DNA in the original sample (LPC 13:0 [31.98 nmol/mg DNA], LPC 17:1 [29.025 nmol/mg DNA], LPE 13:0 [36.4547 nmol/mg DNA], LPE 17:1 [32.2193 nmol/mg DNA], lysophosphatidylserine [LPS] 13:0 [31.4162 nmol/mg DNA], LPS 17:1 [32.2193 nmol/mg DNA], lysophosphatidylinositol [LPI] 13:0 [27.3938 nmol/mg DNA], and LPI 17:1 [24.931 nmol/mg DNA]). The organic fractions were evaporated and reconstituted in CH3OH/CHCl3/NH4OH (90:10:1.25 [vol/vol/vol]). Phospholipids were analyzed by electrospray ionization tandem mass spectrometry on a hybrid quadrupole linear ion trap mass spectrometer (4000 QTRAP system; Applied Biosystems) equipped with a robotic nanoflow/ion source (Advion Biosciences, Ithaca, NY). The system was operated in the multiple reaction monitoring mode for quantification of individual species. Data were corrected for 13C isotope effects.
Supplementary Material
Acknowledgments
We thank F. Foufelle (Université Paris, Paris, France) for providing the adenoviral constructs; we acknowledge the ENCODE consortium, and particularly the teams of M. Snyder (Stanford University, Stanford, CA), M. Gerstein and S. Weisman (Yale University, New Haven, CT), P. Farnham (University of Southern California, Los Angeles, CA), and K. Struhl (Harvard University, Cambridge, MA), for generating the ENCODE database used in this study. We thank Jens Wouters (KU Leuven, Leuven, Belgium) for performing lipid extractions. This work was supported by Grants G0816.13 from the Research Foundation-Flanders (FWO; to J.S.), Belspo IAP 7/24 and GOA 11/2009 (to W.A., P.A., and J.S.), and GOA 12/016 (to E.W.) of the KU Leuven and grants-in aid for Scientific Research from the Ministry of Education, Culture, Sports, Science and Technology of Japan and CREST from the Japan Science and Technology Agency (to M.M.). J.D. is the recipient of a fellowship of the Agency for Innovation by Science and Technology IWT-Flanders.
Abbreviations used:
- CDKN2B
cyclin-dependent kinase inhibitor 2B
- ChIP
chromatin immunoprecipitation
- EEA1
early endosomal antigen 1
- FASN
fatty acid synthase
- LPC
lysophosphatidylcholine
- LPE
lysophosphatidylethanolamine
- LPI
lysophosphatidylinositol
- LPS
lysophosphatidylserine
- mIMCD3
murine inner medullary collecting duct
- MDCK
Madin–Darby canine kidney
- MX2
myxovirus resistance 2
- OPC
oleyloxyethyl phosphorylcholine
- PC
phosphaditylcholine
- PLA2G3
phospholipase A2 group III
- PPC
pericentrosomal preciliary compartment
- SRE
sterol regulatory element
- SREBP1c
sterol regulatory element–binding protein 1c.
Footnotes
This article was published online ahead of print in MBoC in Press (http://www.molbiolcell.org/cgi/doi/10.1091/mbc.E14-10-1472) on April 22, 2015.
REFERENCES
- Basten SG, Giles RH. Functional aspects of primary cilia in signaling, cell cycle and tumorigenesis. Cilia. 2013;2:6. doi: 10.1186/2046-2530-2-6. [DOI] [PMC free article] [PubMed] [Google Scholar]
- Berbari NF, O'Connor AK, Haycraft CJ, Yoder BK. The primary cilium as a complex signaling center. Curr Biol. 2009;19:R526–R535. doi: 10.1016/j.cub.2009.05.025. [DOI] [PMC free article] [PubMed] [Google Scholar]
- Bernstein BE, Birney E, Dunham I, Green ED, Gunter C, Snyder M. An integrated encyclopedia of DNA elements in the human genome. Nature. 2012;489:57–74. doi: 10.1038/nature11247. [DOI] [PMC free article] [PubMed] [Google Scholar]
- Brglez V PA, Pungercˇ ar J, Lambeau G, Petan T. Secreted phospholipases A2 are differentially expressed and epigenetically silenced in human breast cancer cells. Biochem Biophys Res Commun. 2014;445:230–235. doi: 10.1016/j.bbrc.2014.01.182. [DOI] [PubMed] [Google Scholar]
- Brown WJ, Chambers K, Doody A. Phospholipase A2. (PLA2) enzymes in membrane trafficking: mediators of membrane shape and function. Traffic. 2003;4:214–221. doi: 10.1034/j.1600-0854.2003.00078.x. [DOI] [PubMed] [Google Scholar]
- Brown MS, Goldstein JL. The SREBP pathway: regulation of cholesterol metabolism by proteolysis of a membrane-bound transcription factor. Cell. 1997;89:331–340. doi: 10.1016/s0092-8674(00)80213-5. [DOI] [PubMed] [Google Scholar]
- Christensen ST, Pedersen LB, Schneider L, Satir P. Sensory cilia and integration of signal transduction in human health and disease. Traffic. 2007;8:97–109. doi: 10.1111/j.1600-0854.2006.00516.x. [DOI] [PubMed] [Google Scholar]
- Egeberg DL, Lethan M, Manguso R, Schneider L, Awan A, Jorgensen TS, Byskov AG, Pedersen LB, Christensen ST. Primary cilia and aberrant cell signaling in epithelial ovarian cancer. Cilia. 2012;1:15. doi: 10.1186/2046-2530-1-15. [DOI] [PMC free article] [PubMed] [Google Scholar]
- Emmer BT, Maric D, Engman DM. Molecular mechanisms of protein and lipid targeting to ciliary membranes. J Cell Sci. 2010;123:529–536. doi: 10.1242/jcs.062968. [DOI] [PMC free article] [PubMed] [Google Scholar]
- Fliegauf M, Benzing T, Omran H. When cilia go bad: cilia defects and ciliopathies. Nat Rev Mol Cell Biol. 2007;8:880–893. doi: 10.1038/nrm2278. [DOI] [PubMed] [Google Scholar]
- Foretz M, Guichard C, Ferre P, Foufelle F. Sterol regulatory element binding protein-1c is a major mediator of insulin action on the hepatic expression of glucokinase and lipogenesis related genes. Proc Natl Acad Sci USA. 1999;96:12737–12742.. doi: 10.1073/pnas.96.22.12737. [DOI] [PMC free article] [PubMed] [Google Scholar]
- Griffiths B, Lewis CA, Bensaad K, Ros S, Zhang Q, Ferber EC, Konisti S, Peck B, Miess H, East P, et al. Sterol regulatory element binding protein-dependent regulation of lipid synthesis supports cell survival and tumor growth. Cancer Metab. 2013;1:3. doi: 10.1186/2049-3002-1-3. [DOI] [PMC free article] [PubMed] [Google Scholar]
- Horton JD, Goldstein JL, Brown MS. SREBPs: activators of the complete program of cholesterol and fatty acid synthesis in the liver. J Clin Invest. 2002;109:1125–1131. doi: 10.1172/JCI15593. [DOI] [PMC free article] [PubMed] [Google Scholar]
- Hsiao YC, Tuz K, Ferland RJ. Trafficking in and to the primary cilium. Cilia. 2012;1:4. doi: 10.1186/2046-2530-1-4. [DOI] [PMC free article] [PubMed] [Google Scholar]
- Kim J, Dabiri S, Seeley ES. Primary cilium depletion typifies cutaneous melanoma in situ and malignant melanoma. PLoS One. 2011;6:e27410. doi: 10.1371/journal.pone.0027410. [DOI] [PMC free article] [PubMed] [Google Scholar]
- Kim J, Lee JE, Heynen-Genel S, Suyama E, Ono K, Lee K, Ideker T, Aza-Blanc P, Gleeson JG. Functional genomic screen for modulators of ciliogenesis and cilium length. Nature. 2010;464:1048–1051. doi: 10.1038/nature08895. [DOI] [PMC free article] [PubMed] [Google Scholar]
- Knodler A, Feng S, Zhang J, Zhang X, Das A, Peranen J, Guo W. Coordination of Rab8 and Rab11 in primary ciliogenesis. Proc Natl Acad Sci USA. 2010;107:6346–6351. doi: 10.1073/pnas.1002401107. [DOI] [PMC free article] [PubMed] [Google Scholar]
- Leroux MR. Taking vesicular transport to the cilium. Cell. 2007;129:1041–1043. doi: 10.1016/j.cell.2007.05.049. [DOI] [PubMed] [Google Scholar]
- Marshall WF, Nonaka S. Cilia: tuning in to the cell's antenna. Curr Biol. 2006;16:R604–R614. doi: 10.1016/j.cub.2006.07.012. [DOI] [PubMed] [Google Scholar]
- Menendez JA, Lupu R. Fatty acid synthase and the lipogenic phenotype in cancer pathogenesis. Nat Rev Cancer. 2007;7:763–777. doi: 10.1038/nrc2222. [DOI] [PubMed] [Google Scholar]
- Menzl I, Lebeau L, Pandey R, Hassounah NB, Li FW, Nagle R, Weihs K, McDermott KM. Loss of primary cilia occurs early in breast cancer development. Cilia. 2014;3:7. doi: 10.1186/2046-2530-3-7. [DOI] [PMC free article] [PubMed] [Google Scholar]
- Mounier CM, Wendum D, Greenspan E, Flejou JF, Rosenberg DW, Lambeau G. Distinct expression pattern of the full set of secreted phospholipases A2 in human colorectal adenocarcinomas: sPLA2-III as a biomarker candidate. Br J Cancer. 2008;98:587–595. doi: 10.1038/sj.bjc.6604184. [DOI] [PMC free article] [PubMed] [Google Scholar]
- Murakami M, Masuda S, Shimbara S, Bezzine S, Lazdunski M, Lambeau G, Gelb MH, Matsukura S, Kokubu F, Adachi M, Kudo I. Cellular arachidonate-releasing function of novel classes of secretory phospholipase A2s (groups III and XII) J Biol Chem. 2003;278:10657–10667. doi: 10.1074/jbc.M211325200. [DOI] [PubMed] [Google Scholar]
- Murakami M, Masuda S, Shimbara S, Ishikawa Y, Ishii T, Kudo I. Cellular distribution, post-translational modification, and tumorigenic potential of human group III secreted phospholipase A(2) J Biol Chem. 2005;280:24987–24998. doi: 10.1074/jbc.M502088200. [DOI] [PubMed] [Google Scholar]
- Plotnikova OV, Golemis EA, Pugacheva EN. Cell cycle-dependent ciliogenesis and cancer. Cancer Res. 2008;68:2058–2061. doi: 10.1158/0008-5472.CAN-07-5838. [DOI] [PMC free article] [PubMed] [Google Scholar]
- Reed BD, Charos AE, Szekely AM, Weissman SM, Snyder M. Genome-wide occupancy of SREBP1 and its partners NFY and SP1 reveals novel functional roles and combinatorial regulation of distinct classes of genes. PLoS Genet. 2008;4:e1000133. doi: 10.1371/journal.pgen.1000133. [DOI] [PMC free article] [PubMed] [Google Scholar]
- Rysman E, Brusselmans K, Scheys K, Timmermans L, Derua R, Munck S, Van Veldhoven PP, Waltregny D, Daniels VW, Machiels J, et al. De novo lipogenesis protects cancer cells from free radicals and chemotherapeutics by promoting membrane lipid saturation. Cancer Res. 2010;70:8117–8126. doi: 10.1158/0008-5472.CAN-09-3871. [DOI] [PubMed] [Google Scholar]
- Schraml P, Frew IJ, Thoma CR, Boysen G, Struckmann K, Krek W, Moch H. Sporadic clear cell renal cell carcinoma but not the papillary type is characterized by severely reduced frequency of primary cilia. Mod Pathol. 2009;22:31–36. doi: 10.1038/modpathol.2008.132. [DOI] [PubMed] [Google Scholar]
- Seeley ES, Carriere C, Goetze T, Longnecker DS, Korc M. Pancreatic cancer and precursor pancreatic intraepithelial neoplasia lesions are devoid of primary cilia. Cancer Res. 2009;69:422–430. doi: 10.1158/0008-5472.CAN-08-1290. [DOI] [PMC free article] [PubMed] [Google Scholar]
- Sen Gupta P, Prodromou NV, Chapple JP. Can faulty antennae increase adiposity? The link between cilia proteins and obesity. J Endocrinol. 2009;203:327–336. doi: 10.1677/JOE-09-0116. [DOI] [PubMed] [Google Scholar]
- Smith JR, Osborne TF, Goldstein JL, Brown MS. Identification of nucleotides responsible for enhancer activity of sterol regulatory element in low density lipoprotein receptor gene. J Biol Chem. 1990;265:2306–2310. [PubMed] [Google Scholar]
- Swinnen JV, Heemers H, Deboel L, Foufelle F, Heyns W, Verhoeven G. Stimulation of tumor-associated fatty acid synthase expression by growth factor activation of the sterol regulatory element-binding protein pathway. Oncogene. 2000;19:5173–5181. doi: 10.1038/sj.onc.1203889. [DOI] [PubMed] [Google Scholar]
- Van de Sande T, De Schrijver E, Heyns W, Verhoeven G, Swinnen JV. Role of the phosphatidylinositol 3'-kinase/PTEN/Akt kinase pathway in the overexpression of fatty acid synthase in LNCaP prostate cancer cells. Cancer Res. 2002;62:642–646. [PubMed] [Google Scholar]
- Westlake CJ, Baye LM, Nachury MV, Wright KJ, Ervin KE, Phu L, Chalouni C, Beck JS, Kirkpatrick DS, Slusarski DC, et al. Primary cilia membrane assembly is initiated by Rab11 and transport protein particle II (TRAPPII) complex-dependent trafficking of Rabin8 to the centrosome. Proc Natl Acad Sci USA. 2011;108:2759–2764. doi: 10.1073/pnas.1018823108. [DOI] [PMC free article] [PubMed] [Google Scholar]
- Willemarck N, Rysman E, Brusselmans K, Van Imschoot G, Vanderhoydonc F, Moerloose K, Lerut E, Verhoeven G, van Roy F, Vleminckx K, Swinnen JV. Aberrant activation of fatty acid synthesis suppresses primary cilium formation and distorts tissue development. Cancer Res. 2010;70:9453–9462. doi: 10.1158/0008-5472.CAN-10-2324. [DOI] [PubMed] [Google Scholar]
- Yuan K, Frolova N, Xie Y, Wang D, Cook L, Kwon YJ, Steg AD, Serra R, Frost AR. Primary cilia are decreased in breast cancer: analysis of a collection of human breast cancer cell lines and tissues. J Histochem Cytochem. 2010;58:857–870. doi: 10.1369/jhc.2010.955856. [DOI] [PMC free article] [PubMed] [Google Scholar]
Associated Data
This section collects any data citations, data availability statements, or supplementary materials included in this article.


