An active variant of the MAPK Hog1 is used to identify its target genes. The promoter of one target, STL1, possesses a Hog1-responsive element (HoRE) that binds the transcription factor Hot1. HoRE is not found in other promoters, and the STL1 mRNA is the only one abolished in hot1Δ cells. Hot1 may be essential for transcription of one gene.
Abstract
Transcription factors are commonly activated by signal transduction cascades and induce expression of many genes. They therefore play critical roles in determining the cell's fate. The yeast Hog1 MAP kinase pathway is believed to control the transcription of hundreds of genes via several transcription factors. To identify the bona fide target genes of Hog1, we inducibly expressed the spontaneously active variant Hog1D170A+F318L in cells lacking the Hog1 activator Pbs2. This system allowed monitoring the effects of Hog1 by itself. Expression of Hog1D170A+F318L in pbs2∆ cells imposed induction of just 105 and suppression of only 26 transcripts by at least twofold. We looked for the Hog1-responsive element within the promoter of the most highly induced gene, STL1 (88-fold). A novel Hog1 responsive element (HoRE) was identified and shown to be the direct target of the transcription factor Hot1. Unexpectedly, we could not find this HoRE in any other yeast promoter. In addition, the only gene whose expression was abolished in hot1∆ cells was STL1. Thus Hot1 is essential for transcription of just one gene, STL1. Hot1 may represent a class of transcription factors that are essential for transcription of a very few genes or even just one.
INTRODUCTION
Transcriptional activators and suppressors, known as transcription factors, are major components in determining the spectra and levels of gene expression (Struhl, 1989; Treisman, 1996; Lemon and Tjian, 2000; Levine et al., 2014).
These molecules exert their effects on transcription when they associate with specific binding sites (cis-elements), which commonly reside adjacent to the promoters of their target genes (Lee et al., 2002; Babu et al., 2004; Harbison et al., 2004; Meireles-Filho and Stark, 2009; Aerts, 2012; Levine et al., 2014). Current understanding is that an individual transcription factor governs the expression of multiple target genes, which harbor its preferred binding site in their promoters. Prominent examples are the mammalian transcription factors c-Jun, CREB, MyoD, and NFκB (Rothwarf and Karin, 1999; Florin et al., 2004; Bailey and Europe-Finner, 2005; Bailey et al., 2005; Cao et al., 2006). An exceptional example is c-Myc, believed to control transcription of thousands of genes (Dang et al., 2006; van Riggelen et al., 2010). A similar phenomenon is observed in the yeast Saccharomyces cerevisiae. The yeast transcriptional activator Gcn4, for example, controls ∼539 genes (Natarajan et al., 2001), the yeast heat shock factor 1 controls at least 165 genes (Hahn et al., 2004; Yamamoto et al., 2005), and the Msn2/4 activators regulate 80–140 genes (Boy-Marcotte et al., 1998; Gasch et al., 2000; Causton et al., 2001). Because such factors modify transcription of many genes and thereby determine the cell's fate, they are regarded as “master genes” or “primary factors.”
By contrast, in this article, we describe the case of the yeast transcription factor Hot1, which is involved in controlling just a handful of genes and is essential for transcriptional induction of just one gene, STL1. Hot1 is activated in response to osmotic pressure by the Pbs2/Hog1 mitogen-activated protein kinase (MAPK) pathway (Rep et al., 1999; Alepuz et al., 2003). This pathway allows adaptation to osmostress and consequently cell division under these conditions, primarily by enhancing the synthesis of glycerol (Sprague, 1998; Hohmann, 2002; O'Rourke et al., 2002; Saito and Tatebayashi, 2004; Saito and Posas, 2012; Westfall et al., 2004; Maayan et al., 2012). The Pbs2/Hog1 pathway also controls all phases of the cell cycle and modulates the transcription of hundreds of genes (O'Rourke and Herskowitz, 2002; de Nadal et al., 2011; Saito and Posas, 2012; Duch et al., 2013). Cells deficient for the genes encoding the MAPK Hog1 or the MAPK kinase (MAPKK) Pbs2 do not carry out these activities and cannot proliferate under osmotic pressure (Brewster et al., 1993; Maayan and Engelberg, 2009; Saito and Posas, 2012). Hog1 affects gene expression mostly via the intermediary transcriptional activators Msn2/4, Sko1, and Hot1 (Schuller et al., 1994; Rep et al., 1999; Proft and Struhl, 2002; Proft et al., 2005; Alepuz et al., 2003). Large-scale gene expression analysis suggests that Msn2/4, Sko1, and Hot1 combined are responsible for 88% of Hog1-dependent gene activation (Capaldi et al., 2008). The mechanism proposed for Hog1-mediated Hot1 activation is unusual. Although Hog1 phosphorylates Hot1, this phosphorylation seems not to be essential for Hot1 transcriptional activity (Alepuz et al., 2003). Instead, Hot1 associates physically with its target promoters, and in response to osmostress, it binds active Hog1, thereby recruiting Hog1 to the promoter. Once bound to the promoter, Hog1 functions as a transcription factor and increases transcription initiation rate by recruiting the chromatin-remodeling component Rpd3, as well as by directly associating with RNA PolII and components of the mediator complex (Alepuz et al., 2003; de Nadal et al., 2004). Several critical aspects of this proposed mechanism are still unknown. For example, the cis-element(s) recognized by Hot1 have not yet been defined. In addition, the mechanism involving interaction of Hog1 + Hot1 + RNA PolII was proposed on the basis of observations made on the promoter of the STL1 gene, and it is not yet known how many other promoters are targeted in a similar Hot1 + Hog1–dependent mechanism.
Besides our lack of knowledge of the target genes of the Hog1 + Hot1 system, the identity of the specific bona fide target genes of the Hog1 cascade is not clear. Up to now, target genes of the Hog1 pathway have been defined as genes whose expression level changes in response to osmotic pressure in wild-type cells but not in hog1∆ cells (Posas et al., 2000; Rep et al., 2000; O'Rourke and Herskowitz, 2004; Capaldi et al., 2008). The experiments on which this definition is based showed that changes in expression (increase or decrease) of ∼300 genes (Capaldi et al., 2008) or even 580 genes (O'Rourke and Herskowitz, 2004) are Hog1 dependent. However, genes identified this way represent those for which Hog1 is essential as a modulator of expression but does not necessarily suffice to initiate it. Defining the genes controlled by Hog1 per se would necessitate exclusive activation of Hog1, that is, without exposure of the cell to any stimulus that concomitantly activates other pathways.
To generate such a situation, we expressed a Hog1 molecule that is intrinsically active, meaning that its biochemical and biological activities are independent of any upstream signal and of Pbs2/MAPKK activation (Bell et al., 2001; Bell and Engelberg, 2003; Yaakov et al., 2003; Maayan et al., 2012). Because this Hog1 molecule is spontaneously active in yeast cells not exposed to any stress, they should be capable of precisely disclosing the bona fide downstream targets of Hog1. We found that inducible expression of intrinsically active Hog1 in hog1∆pbs2∆ cells leads to induction of mRNA levels of 105 genes (by twofold or more), only 13 of which were induced by 10-fold or more. Five of the 13 most highly induced genes, including the top 2, STL1 (88-fold) and RTC3 (75-fold), were reported as targets of the transcriptional activator Hot1 (Rep et al., 2000; Capaldi et al., 2008; Gomar-Alba et al., 2012). Because the cis-element through which Hot1 activates transcription had not been identified, we focused on the STL1 promoter, dissected it thoroughly, and identified a novel osmostress- and Hog1-regulated cis-element (which we termed the Hog1 responsive element [HoRE]). The HoRE contains two short identical repeats of the sequence 5′-CATTTGGC-3′ and a similar third repeat. We showed that this element binds a recombinant Hot1 protein in vitro. Its activation in vivo requires both Hot1 and Hog1, and for full induction requires Sko1 as well. Intriguingly, we could not find identical or similar HoREs in other yeast promoters, including promoters of proposed Hot1 targets. In addition, comparing of mRNA molecules expressed in hot1∆ and wild-type cells exposed to various types of stress revealed that the only gene whose mRNA was barely detected in hot1∆ cells was STL1. These observations combined suggest that Hot1 is likely to be essential for transcription of only STL1.
RESULTS
Expression of intrinsically active Hog1 in hog1∆pbs2∆ cells affects only 131 genes
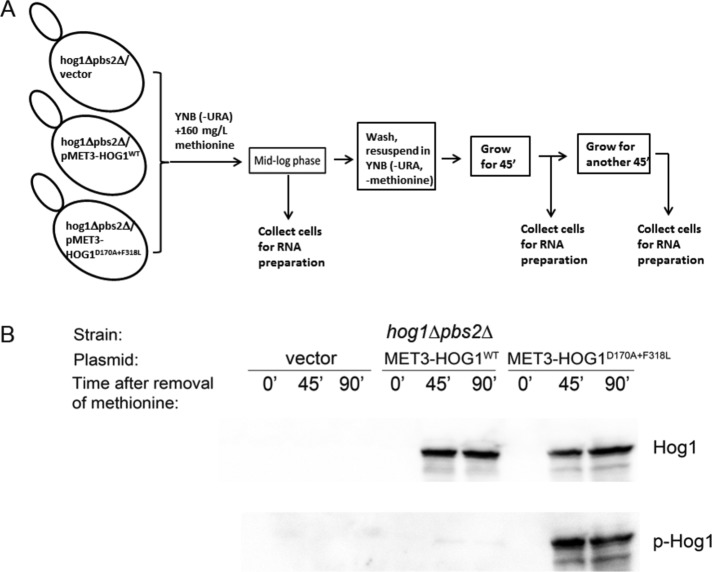
Previous studies identified genes whose induction or suppression in response to osmotic pressure are critically dependent on Hog1 (Posas et al., 2000; Rep et al., 2000; O'Rourke and Herskowitz, 2004; Capaldi et al., 2008). To identify genes for which Hog1 is not merely essential but is actually sufficient for modifying their expression, we expressed an intrinsically active variant of Hog1, Hog1D170A+F318L, in hog1∆pbs2∆ cells. To avoid constitutive activity of Hog1 that might generate selective pressure throughout the cell's life and create a nonrelevant transcriptome, we used an inducible expression system. In this system, every change in RNA levels after induction of Hog1D170A+F318L expression could be specifically attributed to Hog1 activity. For inducible expression, we used the MET3 promoter, which can be efficiently shut off in medium supplemented with methionine and is rapidly activated upon methionine removal (Mumberg et al., 1994; Yaakov et al., 2003). We introduced the MET3-HOG1D170A+F318L plasmid, an “empty” plasmid, or a MET3-HOG1WT plasmid into hog1∆pbs2∆ cells. Cells of the resulting three strains were grown to mid log phase on medium containing methionine, washed, and resuspended in medium lacking methionine. Samples for mRNA isolation were collected before removal of methionine (time point 0), as well as at 45 and 90 min after removal of methionine. The experimental setup is schematically presented in Figure 1A. Western blot analysis verified that removal of methionine resulted in induction of the Hog1 molecules (Figure 1B, top). Because Hog1D170A+F318L protein is autoactivated via spontaneous autophosphorylation (Bell et al., 2001; Bell and Engelberg, 2003; Yaakov et al., 2003), we verified that it is phosphorylated after induction of expression, whereas Hog1WT is not (Figure 1B, bottom).
FIGURE 1:
The experimental system. Induced expression of intrinsically active Hog1 in hog1∆pbs2∆ cells. (A) Schematic description of the experimental setup. Cells of the indicated three strains were grown to mid log phase in medium containing 160 mg/l methionine, which suppresses the expression of ectopic Hog1. The cells were then washed, resuspended in medium lacking methionine, and allowed to continue proliferating. mRNA samples were collected before removal of methionine (time point 0) and at 45 and 90 min after removal of methionine. (B) Hog1 molecules were monitored 45 and 90 min after removal of methionine, and Hog1D170A+F318L was spontaneously phosphorylated. Protein lysates were prepared from cells collected at the time points at which RNA was isolated (A) and analyzed by Western blot using anti-Hog1 antibodies (top) and anti–phospho-p38 antibodies (bottom).
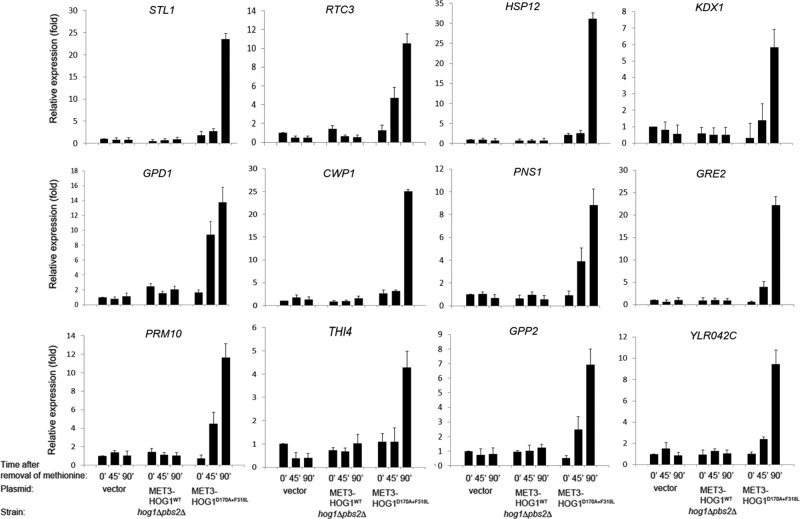
mRNA samples were analyzed on a microarray of Agilent SurePrint G3 (Yeast), one-color, 8 × 60K–format slides. Data were analyzed with the aid of the specialized microarray analysis software Genespring GX. We first calculated the ratio of expression levels of every gene at each time point in cells expressing Hog1WT or Hog1D170A+F318L to those in cells harboring the “empty” vector. mRNA molecules with a ratio of less than two were excluded. This calculation enabled us to eliminate genes that were induced or suppressed after methionine removal in all three strains (mostly genes involved in methionine synthesis), as well as genes that were not affected at all by methionine removal in the three strains. From the remaining genes, we selected those whose expression levels were changed at least twofold at the 90-min time point, and thus we obtained a list of genes specifically induced in response to expression of Hog1WT (Table 1) and a list of genes induced or suppressed in response to expression of Hog1D170A+F318L relative to their expression in cells harboring an “empty” vector (Tables 2A and 2B). Expression of Hog1WT in hog1∆pbs2∆ cells had a minor effect on gene expression. No genes were found to be significantly suppressed, and only 2 genes, GPD1 and GPP2, were induced by >2-fold (Table 1). The effect of Hog1D170A+F318L expression in hog1∆pbs2∆ cells was more dramatic, leading to induction of 105 genes (Table 2A) and suppression of 26 genes by >2-fold (Table 2B). Of note, however, only 37 of the 105 genes were induced by ≥4-fold, and only 13 were induced by ≥10-fold (Table 2A). None of the 26 suppressed genes was suppressed by >3.4-fold (Table 2B). Thus the effect of active Hog1 by itself on gene expression was significantly milder than anticipated (induction of ∼300 genes was expected according to Capaldi et al. (2008) and ∼600 genes according to O'Rourke and Herskowitz (2004); Posas et al., 2000; Rep et al., 2000). To verify some of the microarray findings, we measured mRNA levels of the 12 genes most highly induced by Hog1D170A+F318L using real-time reverse transcription (RT)-PCR. The results (Figure 2) supported the microarray measurements by showing that the tested genes were specifically induced in cells expressing Hog1D170A+F318L. Obviously, genes that were perhaps missed in the microarray experiment (false negatives) could not be verified, and the possibility remains that more genes are induced by Hog1D170A+F318L in hog1∆pbs2∆ cells.
TABLE 1:
Genes induced or suppressed in hog1∆pbs2∆ cells after induction of Hog1WT expression.
| Induced genes | Suppressed genes | ||
|---|---|---|---|
| Gene name | Fold change | Gene name | Fold change |
| GPD1 | 4.62 | ||
| GPP2 | 2.08 | ||
Fold change was calculated as the ratio between expression levels in hog1Δpbs2Δ/MET3-Hog1WT and hog1∆pbs2∆/MET3-empty vector cells 90 min after methionine removal.
TABLE 2A:
Genes induced in hog1∆pbs2∆ cells after induction of Hog1D170A+F318L expression.
| Gene name | Fold change | Gene name | Fold change | Gene name | Fold change |
|---|---|---|---|---|---|
| STL1 | 87.68 | BAG7 | 4.02 | YGR149W | 2.45 |
| RTC3 | 75.61 | SPI1 | 3.97 | PRX1 | 2.45 |
| HSP12 | 47.21 | YPK2 | 3.59 | YNR066C | 2.42 |
| KDX1 | 26.33 | ALD3 | 3.52 | FLC2 | 2.42 |
| GPD1 | 18.19 | YMR103C | 3.50 | ERR1 | 2.39 |
| CWP1 | 16.78 | YPS3 | 3.47 | RGS2 | 2.37 |
| PNS1 | 13.88 | YIL108W | 3.45 | SFA1 | 2.36 |
| GRE2 | 13.01 | YPR1 | 3.27 | FBP26 | 2.34 |
| PRM10 | 12.68 | YNR065C | 3.27 | SLT2 | 2.31 |
| THI4 | 12.38 | YDL206W | 3.25 | PTP2 | 2.3 |
| GPP2 | 11.07 | PRR2 | 3.22 | ERR2 | 2.3 |
| YLR042C | 10.71 | CHS1 | 3.11 | SMF1 | 2.27 |
| FMP43 | 10.03 | YMR173W-A | 3.11 | WSC3 | 2.22 |
| YHR022C | 9.78 | CRG1 | 3.04 | YIR035C | 2.22 |
| YER053C-A | 8.09 | CSH1 | 3.02 | PFK26 | 2.19 |
| FSH1 | 7.73 | CTT1 | 2.96 | YJL132W | 2.19 |
| YML131W | 7.72 | PUT4 | 2.95 | GDE1 | 2.19 |
| YJL107C | 7.65 | SOL1 | 2.93 | YPL088W | 2.19 |
| SED1 | 7.30 | SHH3 | 2.90 | PCM1 | 2.18 |
| PIR3 | 6.77 | DDR48 | 2.85 | YCL049C | 2.18 |
| HAL1 | 6.56 | DAK1 | 2.82 | YMR226C | 2.18 |
| HSP32 | 6.25 | MGA1 | 2.80 | EXG1 | 2.16 |
| HBN1 | 6.21 | SRL3 | 2.76 | DFG5 | 2.12 |
| SNO4 | 6.08 | CIN5 | 2.73 | TIR2 | 2.10 |
| YKL162C-A | 5.86 | YKE4 | 2.72 | CHS6 | 2.09 |
| YDL023C | 5.41 | CRH1 | 2.71 | PST1 | 2.08 |
| YHR033W | 5.39 | TRS65 | 2.69 | RHO5 | 2.06 |
| FIT1 | 5.20 | FMP33 | 2.67 | PAU15 | 2.05 |
| ARI1 | 5.15 | YMR122W-A | 2.63 | MSB3 | 2.05 |
| YKL102C | 4.95 | YIL024C | 2.61 | GPP1 | 2.04 |
| AFR1 | 4.76 | DDI3 | 2.58 | VHS3 | 2.03 |
| HSP33 | 4.51 | DDI2 | 2.57 | AVO2 | 2.02 |
| HXT1 | 4.25 | SSK22 | 2.56 | POF1 | 2.02 |
| GRE3 | 4.18 | YOL150C | 2.52 | ||
| FMP48 | 4.16 | PTP3 | 2.49 | ||
| NQM1 | 4.03 | YPS6 | 2.46 |
Fold change is the ratio between expression levels in hog1Δpbs2Δ/MET3-Hog1D170A+F318L and hog1∆pbs2∆/MET3-empty vector cells 90 min after removal of methionine.
TABLE 2B:
Genes suppressed in hog1∆pbs2∆ cells after induced expression of Hog1D170A+F318L.
| Gene name | Fold change | Gene name | Fold change | Gene name | Fold change |
|---|---|---|---|---|---|
| DIP5 | 3.40 | GPD2 | 2.28 | YLR460C | 2.13 |
| SFG1 | 3.14 | ERG3 | 2.27 | DAL1 | 2.12 |
| CIT2 | 2.90 | PEX21 | 2.26 | DSE1 | 2.11 |
| ATO3 | 2.75 | CPA2 | 2.25 | CTP1 | 2.10 |
| YGR035C | 2.73 | PDH1 | 2.21 | LYS12 | 2.09 |
| FRE7 | 2.63 | YLR346C | 2.20 | NDJ1 | 2.05 |
| LYS2 | 2.39 | CAR2 | 2.20 | MIG3 | 2.01 |
| SHU2 | 2.33 | HIS4 | 2.18 | SRD1 | 2.00 |
| DUR3 | 2.29 | DSE2 | 2.14 |
Fold change was calculated as the ratio between expression levels in hog1∆pbs2∆/MET3-empty vector cells and hog1Δpbs2Δ/MET3-Hog1D170A+F318L 90 min after removal of methionine.
FIGURE 2:
Real-time quantitative RT-PCR analysis confirmed the microarray data for the 12 most highly induced genes. mRNA levels of the indicated genes were analyzed by real-time quantitative RT-PCR. The values were normalized to the levels of ACT1 mRNA, which served as an internal control. mRNA levels are presented as the ratio of their levels to those of the same genes at time 0 in cells harboring the empty vector. Experiments were performed in triplicate with two independent RNA preparations.
We consider the genes regulated by Hog1D170A+F318L in hog1∆pbs2∆ cells (Tables 2A and 2B) to be bona fide Hog1 targets because they are exclusively activated by Hog1D170A+F318L.
Identification of the Hog1-responsive and NaCl-responsive cis-element within the STL1 promoter
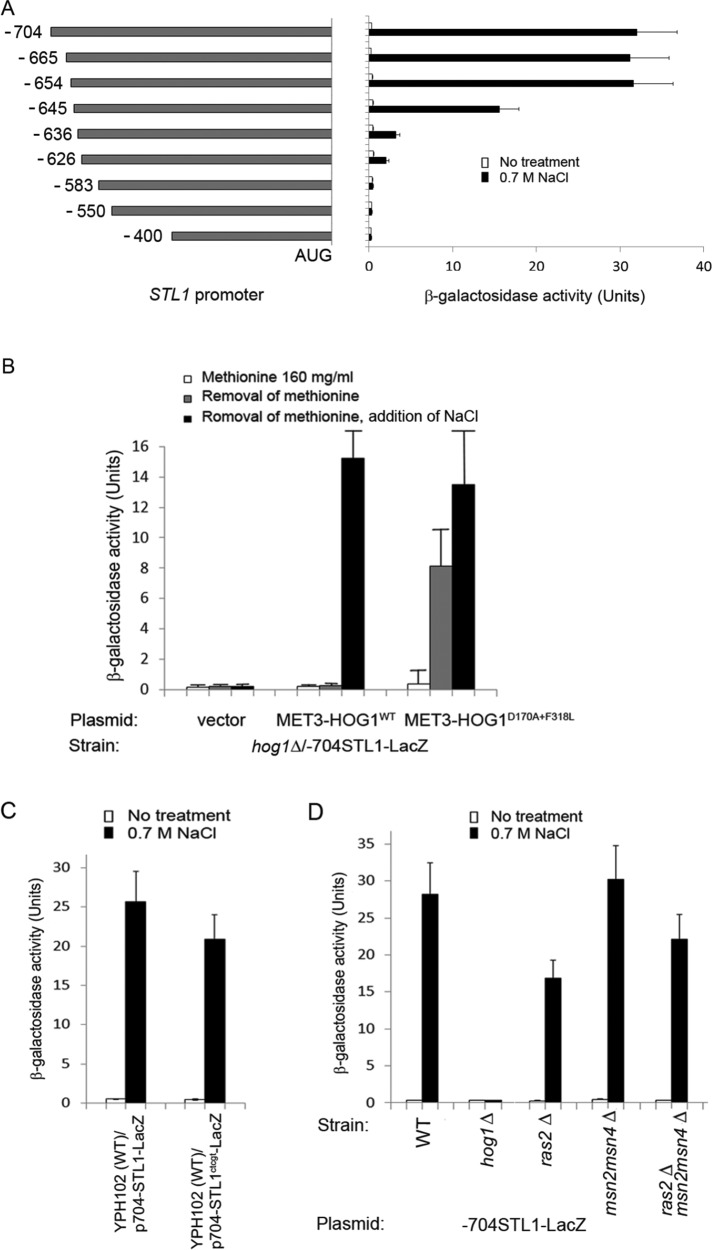
Among the 13 genes that are most strongly induced by active Hog1 (≥10-fold; Table 2A), five genes, STL1, RTC3/HGI1, THI4, GPD1, and GPP2, were previously reported to be targets of the transcription factor Hot1 (Alepuz et al., 2003; Capaldi et al., 2008; Gomar-Alba et al., 2012). STL1 and RTC3 are the most highly induced genes by Hog1D170A+F318L, 88- and 75-fold, respectively (Table 2A). More putative Hot1 target genes—SED1, FIT1, SPI1, FM48, and NQM1—were also induced by Hog1D170A+F318L but less strongly (Table 2A). Because Hot1 seems to be a central mediator of the Hog1D170A+F318L effect on transcription, we sought to find which element it recognizes on its target promoters. We focused for this purpose on the most highly induced gene, STL1, assuming that identification of the Hog1- and/or osmostress-responsive regions within its promoter would disclose the Hot1 target element. To identify the Hog1-responsive element within the STL1 promoter, we cloned from the yeast genome the 704 base pairs located upstream of the first codon of STL1 and inserted them upstream to the β-galactosidase gene. In wild-type cells (the YPH102 strain), the –704STL1-LacZ gene was strongly activated after exposure of cells to 0.7 M NaCl (top bar in Figure 3A). It was inactive and uninducible in hog1∆ cells harboring an “empty” vector (Figure 3B). In hog1∆ cells harboring the MET3-HOG1D170A+F318L construct, the –704STL1-LacZ reporter was strongly induced after removal of methionine (Figure 3B), whereas in hog1∆ cells harboring the MET3-HOG1WT plasmid, it was induced only after both removal of methionine and exposure of cells to osmostress (Figure 3B). This experiment verifies that the 704–base pair promoter region is activated by osmotic pressure as expected and also by activation of Hog1 by itself. Promoter sequence analysis revealed a single stress response element (STRE) sequence, 5′-CCCCT-3′, located 175 base pairs upstream from the start codon, raising the possibility that the Ras/cAMP pathway via Msn2/4 is involved in regulating STL1. However, mutating the STRE (Figure 3C) or testing the –704STL1-LacZ in ras2∆, msn2∆msn4∆, and ras2∆msn2∆msn4∆ cells (Figure 3D) showed that the Ras/STRE system is not involved in STL1 promoter activation by active Hog1 or in response to osmotic pressure.
FIGURE 3:
The region between −654 and −626 in the STL1 promoter harbors an osmostress- and Hog1-responsive activity. The promoter is not induced via the Ras/Msn2/4 STRE system. (A) The indicated STL1 promoter fragments were subcloned upstream to the β-galactosidase gene (LacZ), and the resulting vectors were tested in wild-type (YPH102) cells exposed or not exposed to 0.7 M NaCl for 1 h. Left, promoter regions; right, the corresponding β-galactosidase activities. (B) Expression of intrinsically active Hog1, but not Hog1WT, is sufficient to strongly induce the STL1 promoter. The –665STL1-LacZ construct was introduced into the indicated strains. Activity of β-galactosidase was assayed in cells after removal of methionine with or without addition of NaCl (both treatments were applied for 90 min). (C) STL1 promoter with a mutated STRE (the –704STL1ctcgt-LacZ construct) is as responsive as the nonmutated promoter to NaCl (0.7 M, 60 min). (D) The –704STL1-LacZ construct is fully induced in cells of the indicated mutants but not in hog1∆ cells.
Because no other plausible element was identified in the promoter via sequence analysis, we used an unbiased approach to identify the Hog1-responsive element by preparing a series of constructs carrying systematic truncations of the STL1 promoter (Figure 3A). We observed that a promoter as short as 654 base pairs was responsive to NaCl at the same efficiency as the –704STL1-LacZ construct (Figure 3A). However, further truncations, up to position −626, gradually reduced promoter responsiveness (Figure 3A). This suggested that the upstream promoter region, between −654 and −626, may harbor the NaCl-responsive and active-Hog1–responsive cis-element(s).
To test whether the upstream elements of the STL1 promoter are sufficient to render a heterologous promoter responsive to both osmostress and Hog1, we inserted fragments derived form the STL1 promoter upstream of the CYC1 minimal promoter, which is cloned upstream to the LacZ gene. The CYC1 minimal promoter alone allowed very low transcription initiation rate of the LacZ gene, reflected in just 1 U of β-galactosidase activity, which was not further induced by salt treatment. However, when a fragment containing the sequence between −704 and −533 of the STL1 promoter was inserted upstream of the minimal CYC1 promoter, the resulting chimeric promoter was strongly induced by 0.7M NaCl (Figure 4A, top). A shorter fragment, −665 to −533, was also strongly inducible by salt, but a further, shorter fragment, −626 to −533, was not (Figure 4A), suggesting that the responsive element resides within the 40 base pairs of the −665 to −626 fragment. To narrow the responsive region, we constructed another set of chimeric STL1-CYC1 promoters (Figure 4B) and observed that a promoter containing the fragment of −654 to −564 was strongly induced by salt, whereas a promoter containing −636 to −564 was not (Figure 4B). This implies that the responsive element resides within the 19 base pairs between −654 and −636, a region that is included within the fragment mapped as NaCl- and Hog1D170A+F318L-responsive by deletion of the STL1 promoter (−654 to −626; Figure 3A).
FIGURE 4:
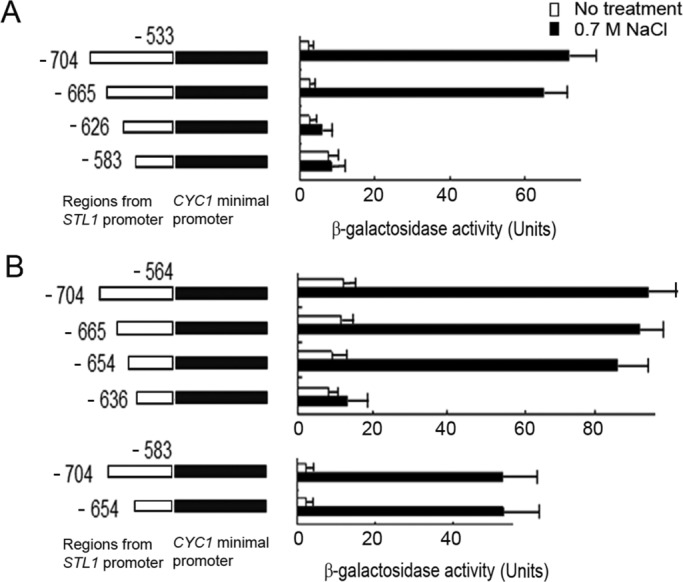
Short fragments of the STL1 promoter, cloned upstream of the CYC1 minimal promoter, are sufficient to render it responsive to osmotic pressure. Fragments derived from the upstream region of the STL1 promoter were fused to the minimal elements of the CYC1 promoter. Left, resulting constructs; right, β-galactosidase activities of cells harboring these constructs. All fragments in A share the same downstream endpoint (−533). The endpoint is −564 in most of the fragments tested in B except for the two bottom constructs, in which the endpoint is −583.
A cis-element composed of two 5′-CATTTGGC-3′ repeats and a third, similar repeat is essential for maximal Hog1-dependent and osmostress-dependent induction of STL1 transcription
The foregoing 5′ deletion analysis, combined with insertion of regions of the STL1 promoter upstream to the minimal CYC1 promoter (Figures 3 and 4), suggested that the salt-responsive and HoRE resides within the sequence between −654 and −626. This region contains two consecutive identical repeats of the sequence 5′-CATTTGGC-3′ linked to a third, similar repeat, 5′-CACTTTGAC-3′ (marked in Figure 5A). To determine whether these elements are essential for promoter responsiveness to osmostress and Hog1D170A+F318L, we deleted, in the context of the full-length 704–base pair promoter, the two identical repeats from the STL1 promoter. The resulting promoter, missing the two identical repeats but still harboring the third, similar repeat (delR2; Figure 5, top), lost ∼80% of its transcription activity but could still be induced by ∼20-fold in response to salt (Figure 5, bottom). We therefore expanded the deletion toward the 5′ and the 3′ directions to create delR3, delR4, and delR5 (Figure 5, top). Upstream deletions (up to −667; delR4) did not affect activity further (the activities of delR2 and delR4, both containing the third, similar repeat, were similar). However, elimination of the third, similar repeat by expanding the deletion downstream to −626 (delR3 and delR5) reduced promoter activity to a very low level and rendered it unresponsive to stress (Figure 5, bottom). Of note, promoter delR3, which is not active, misses only a short fragment that contains the two identical and the one similar repeats, suggesting that these sequences are essential for promoter induction.
FIGURE 5:
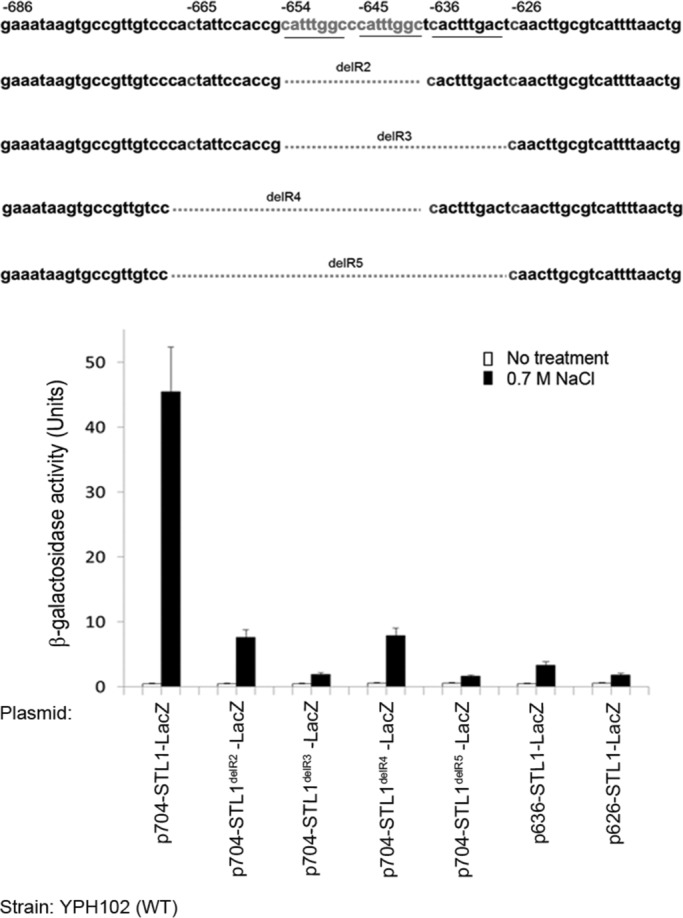
A fragment containing two identical 5′-CATTTGGC-3′ repeats and a third, similar repeat is essential for responsiveness of the STL1 to osmotic pressure. Top, deletions performed in the context of the full-length STL1 promoter (704 base pairs); bottom, the β-galactosidase activities of the resulting promoters. Note that the 5′ deletion constructs –636STL1-LacZ and –626STL1-LacZ, one of which contains the third repeat and the other does not, were included in the experiment.
To evaluate the importance of the accuracy of the repeats' sequence we inserted, in the context of the full-length promoter, point mutations into the HoRE (Figure 6). A single point mutation in either the first or second repeat caused ∼30% reduction in promoter activity (constructs RM1 and RM2). Combination of mutations in repeats one and two (constructs RM3–RM6) caused a more dramatic reduction, up to 75% (RM4; Figure 6), but the mutated promoter was still efficiently induced in response to NaCl (∼16-fold; note that nonmutated promoter is induced ∼64-fold; Figure 6). Addition of a mutation in the third (similar) repeat (RM7) did not cause a further reduction, but more mutations in the two identical repeats (RM8) and mutation in the three repeats (RM9) reduced promoter responsiveness to salt from ∼64-fold to ∼8-fold (RM8) and 4-fold (RM9; Figure 6). Thus point mutations in the two identical and one similar repeats of the HoRE, in the context of the 704–base pair–long promoter, are sufficient to reduce responsiveness of the promoter, suggesting that accuracy of the repeats' sequence is important for the responsiveness of the entire promoter.
FIGURE 6:
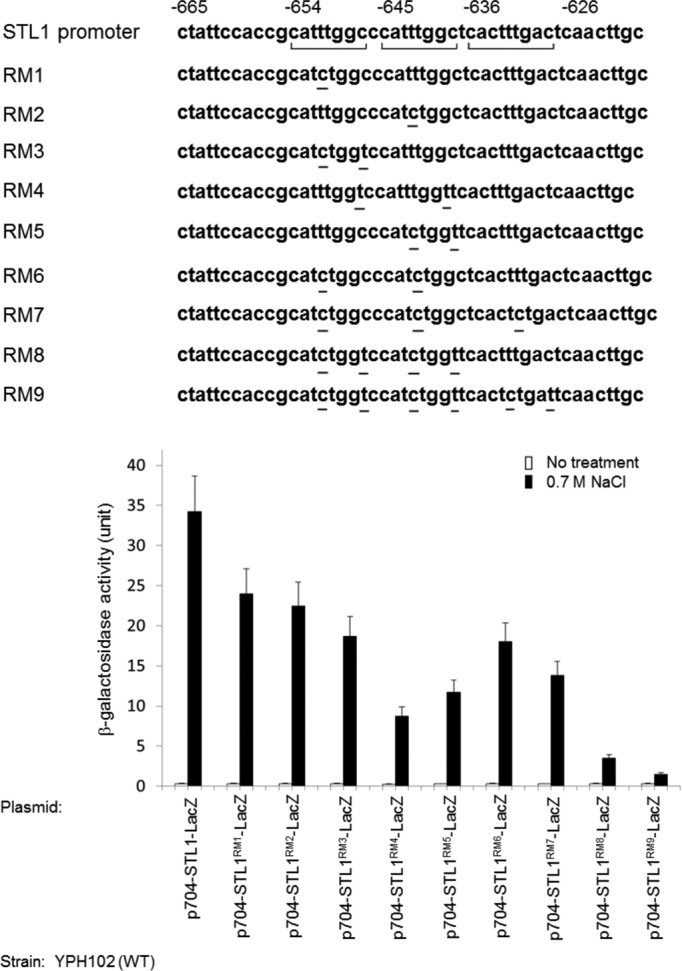
Point mutations in the two identical and one similar repeats significantly reduce promoter activity. Top, point mutations inserted in the context of the full-length 704–base pair promoter; bottom, the activities of the resulting constructs.
Finally, to examine whether the HoRE region by itself is sufficient to render a heterologous promoter responsive to osmotic pressure, we fused a series of short oligonucleotides that include the HoRE to the CYC1 minimal promoter, cloned upstream of the LacZ gene. The 63–base pair–long, −654 to −592 fragment and the shorter, −654 to −600 and −654 to −607 fragments (E1, E2, and E3 in Figure 7A) sufficed to render the CYC1 promoter transcriptionally active and fully inducible by osmotic pressure or by active Hog1 (∼8-fold and up to 130 U, respectively; Figure 7, B and C). Shorter fragments, including the sequence that contains only the three repeats per se, were transcriptionally active but not highly inducible (E4 and E5 in Figure 7). Thus the two identical and one similar repeats are essential for the HoRE activity (Figure 6), but a fully active HoRE, in the context of a heterologous promoter, is defined as the sequence that includes these repeats plus 19 base pairs downstream (E3 in Figure 7). Surprisingly, fragments that include sequences upstream to the repeats (e.g., E6 in Figure 7A), although they rendered the CYC1 promoter salt responsive (10-fold), allowed just a low activity, ∼10 β-galactosidase units, indicating that the 11 base pairs between −665 and −654 might be inhibitory.
FIGURE 7:
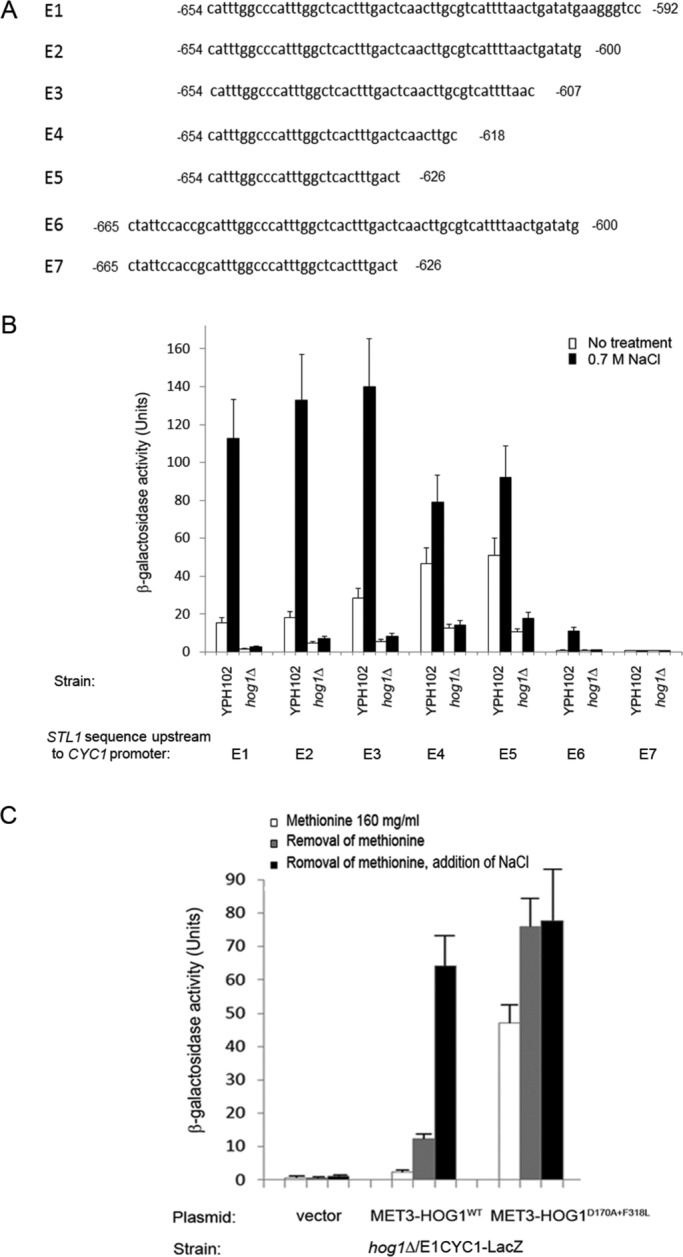
The two identical 5′-CATTTGGC-3′ repeats plus the similar 5′-CACTTTGAC-3′ sequence are by themselves sufficient to boost the transcriptional activity of a heterologous promoter, but efficient responsiveness to Hog1 requires the presence of some additional nucleotides. (A) Sequences inserted upstream of the CYC1 minimal promoter. (B) Activities of the resulting constructs introduced into YPH102 (wild-type) cells exposed or not exposed to NaCl. (C) The short E1 fragment, when cloned upstream to the CYC1 promoter, is fully responsive to active Hog1 and not to Hog1WT. Note induction of this reporter by Hog1D170A+F318L even in the presence of methionine, showing that residual expression of the protein dues to leakiness of the MET3 promoter is sufficient for activation of the E1 fragment.
HoRE activity is dependent on HOG1 and HOT1
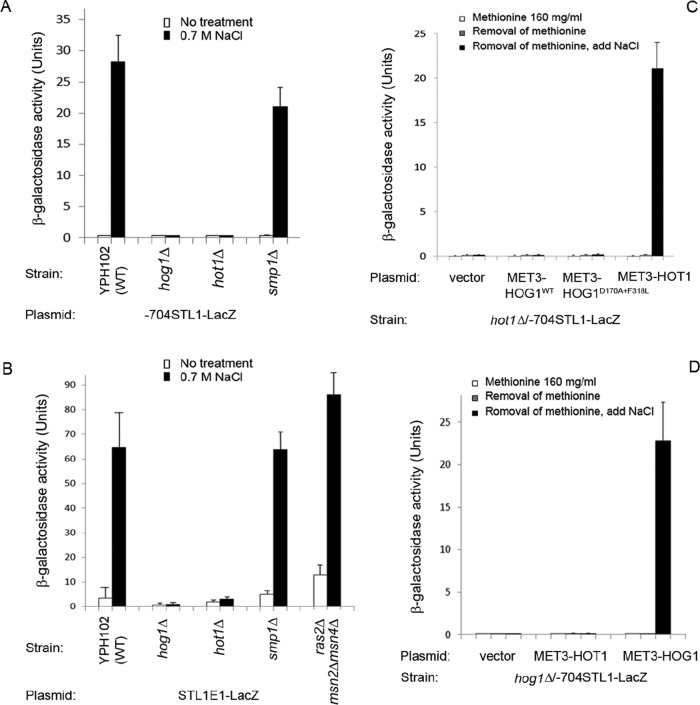
HoRE was identified in a manner that is unbiased toward any transcriptional activator. The following question remains, therefore: is HoRE the target of Hot1, reported to induce the STL1 promoter (Rep et al., 2000; Alepuz et al., 2003), or of another transcription factor? Analysis of the sequence between −601 to −655 using the YeTFaSCo (yetfasco.ccbr.utoronto.ca/) and Yeastract databases (yeastract.com/formfindregulators.php), which screen for binding sites of transcription factors, identified several putative sites, including potential binding sites for Gcn4, Hap2, Gat3, Bas1, Skn7, and Arg80. We tested the possible involvement of these factors in regulating the STL1 promoter and observed that the –704STL1-LacZ reporter was fully functional in the corresponding knockout strains. Thus none of these factors seems to be essential for STL1 transcriptional activation. We then tested the activity of the –704STL1-LacZ construct in cells lacking transcription factors known to be activated by Hog1. Whereas deletion of SMP1 had just a small effect on promoter induction in response to 0.7 M NaCl, deletion of HOT1 totally abolished promoter activity (Figure 8A). We also tested in the mutated cells the activity HoRE by itself, that is, in the context of the CYC1 promoter. Like the full-length promoter, the STL1(E1)CYC1-LacZ reporter gene was fully responsive in cells of the smp1∆ and ras2∆msn2∆msn4∆ strains but was not induced in hog1∆ and hot1∆ cells (Figure 8B). Thus salt-induced activity of the HoRE is evidently dependent on Hog1 and Hot1 but not on Smp1 or on Msn2/4. To determine the extent to which the STL1 promoter is dependent on Hot1 and Hog1, we overexpressed each of these proteins in a strain lacking the other. Overexpression of Hog1WT or of Hog1D170A+F318L in hot1Δ cells did not activate the STL1 promoter even in cells exposed to osmotic stress (Figure 8C). Similarly, when overexpressed in hog1∆ cells, Hot1 on its own was unable to activate the STL1 promoter (Figure 8D). These results support the notion that Hog1 and Hot1 must function together for activating the HoRE.
FIGURE 8:
The STL1 promoter and the HoRE are active in smp1∆ and ras2∆msn2∆msn4∆ cells but not in hog1∆ and hot1∆ cells. (A) The –704STL1-LacZ reporter gene was introduced into the indicated strains. Its activity was assayed in cells grown under optimal conditions and in response to 0.7 M NaCl. (B) Activity of the STL1(E1)CYC1-LacZ reporter was assayed in the indicated strains. (C) Overexpression of Hog1WT or Hog1D170A+F318L fails to activate the STL1 promoter in hot1∆ cells. (D) Overexpression of Hot1 fails to activate the STL1 promoter in hog1∆ cells.
Another transcription factor known to be activated by Hog1, Sko1, was also reported as involved in STL1 activation (Capaldi et al., 2008). A putative Sko1-binding site (marked in Figure 9C) is indeed identified within the E3 fragment, which we defined as the full-length HoRE (Figure 7). The –704STL1-LacZ reporter gene was active and inducible in sko1∆ cells but showed just sixfold induction and ∼25% of the activity shown in wild-type cells (Figure 9A, left bars), suggesting that Sko1 is involved in STL1 activation. Sko1 seems to affect the STL1 promoter directly and not via an effect on the steady-state levels of Hog1 or Hot1 (Figure 9B). The activity of the –636STL1-LacZ reporter, which includes the putative Sko1-binding site but lacks the two identical repeats of the HoRE, was very low in wild-type cells, ∼8% of the activity of the –704STL1-LacZ reporter, and was totally abolished in sko1∆ cells (Figure 9A), suggesting that Sko1 alone, without Hot1, cannot activate the STL1 promoter. Accordingly, deleting the Sko1-binding site from E3 (see sequence in Figure 9C, top) significantly reduced but did not abolish promoter inducibility (Figure 9C, bottom). In fact, the STL1delSKO1-LacZ reporter was similarly induced in wild-type and sko1∆ cells, providing another indication that Hot1 can activate the promoter alone and that Sko1 is required for maximal induction. Thus Sko1 cooperates with Hot1 for full activation of the promoter but is not essential for promoter activation induction of the repeats, which are the major Hog1-responsive cis-elements of the promoter. Of note, both Hot1 and Sko1 seem to bind the same E3 element (see later discussion of Figure 11D) that we defined as the fully active HoRE (Figure 7). In summary, among the mutants tested, STL1 promoter activity was totally abolished only in hog1∆ and hot1∆ and was reduced fivefold in sko1∆.
FIGURE 9:
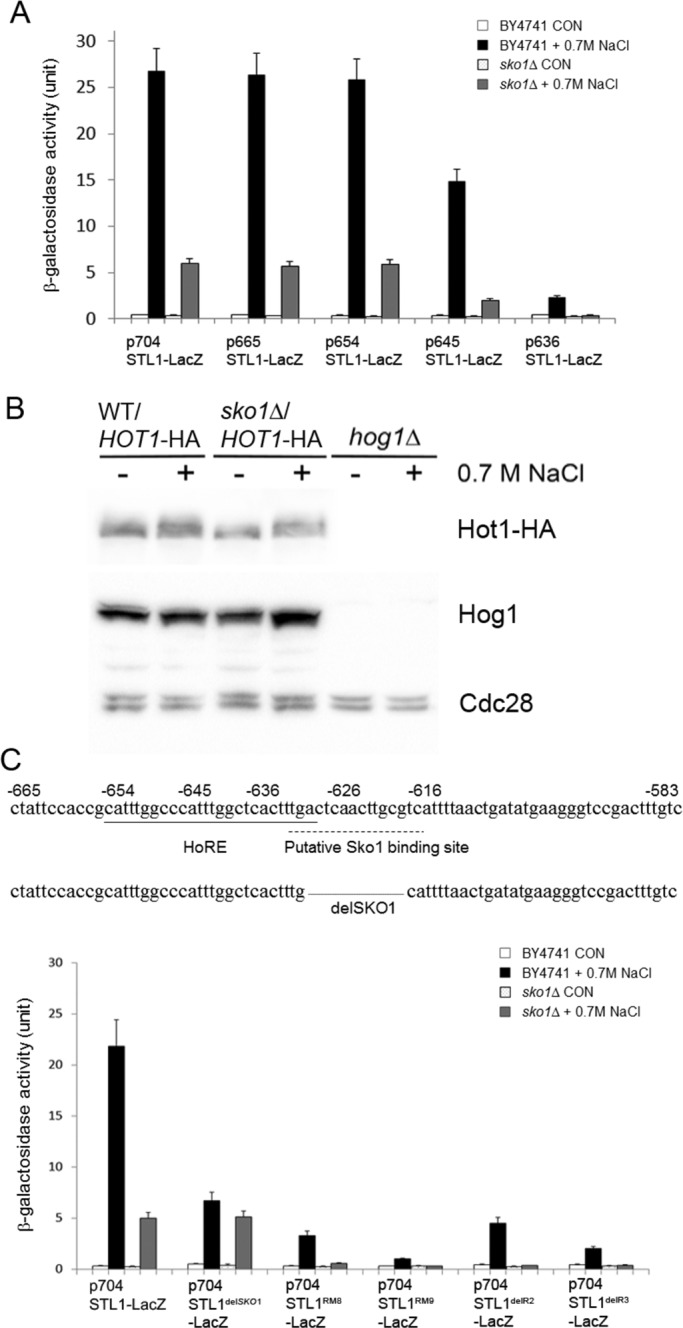
The transcription factor Sko1 cooperates with Hot1 for efficient transcription of STL1 but is not essential for it. (A) Induction of STL1-LacZ reporter genes is reduced in sko1∆ cells. The indicated reporter genes were introduced into cells of the BY4741 and sko1∆ strains. The β-galactosidase activity in these cells was monitored before and after exposure to 0.7 M NaCl. (B) Sko1 has no effect on steady-state levels of Hog1 and Hot1 as monitored by Western blot analysis of cell lysates prepared from the indicated strains. Note that levels of Hot1 were monitored using anti-HA antibodies in strains harboring a single-copy plasmid carrying the HOT1 gene with its native promoter. Lysate of hog1∆ cells was used as a control for the anti-Hog1 antibody. (C) A putative binding site for Sko1 is found (dashed line) in the STL1 promoter within the region containing the HoRE (upper sequence). The lower sequence shows the fragment deleted in the construct 704STL1delSKO1-LacZ. Bottom, β-galactosidase activity of cells (BY4741 and sko1∆) harboring this reporter and the other indicated reporters.
FIGURE 11:
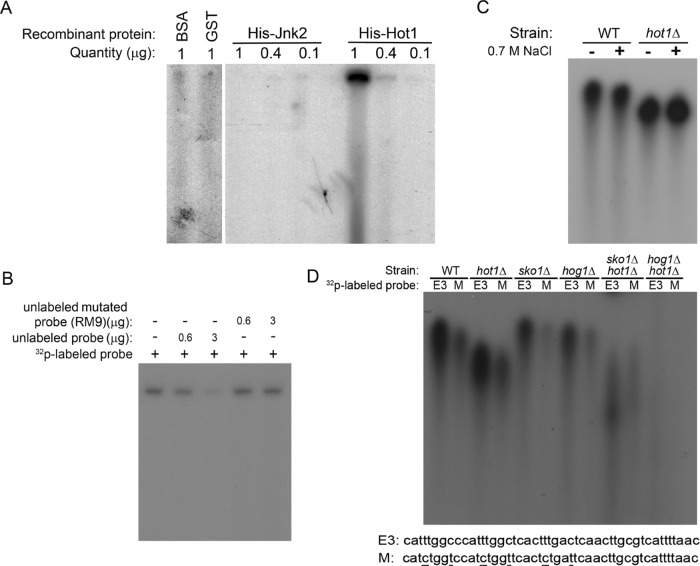
The Hot1 protein binds the HoRE of the STL1 promoter. (A) The indicated quantities of recombinant histidine (His)-tagged Hot1 protein were mixed with 32P-labeled fragment of the STL1 promoter for 15 min and then loaded onto 5% acrylamide gel. Gels were run at 110 V for 6 h. Recombinant His-tagged JNK2, BSA, or GST protein purified from E. coli were tested as controls. (B) Recombinant His-tagged Hot1 (1 μg) was mixed with 32P-labeled fragment together with the indicated unlabeled fragments. (C) The 32P-labeled fragment was incubated with cell lysates prepared from wild-type or hot1∆ cells exposed or not exposed to 0.7 M NaCl. (D) Cell lysates of the indicated strains were incubated with 32P-labeled E3 fragment of the STL1 promoter (see Figure 7; see sequence at bottom) or with a mutated E3 fragment (M; see sequence at bottom).
Curiously, on the basis of chromatin immunoprecipitation (ChIP) analysis, Cook and O'Shea (2012) suggested that Hot1 binds the sequence 5′-wGVRMRRKD-3′ (most preferred: 5′-T/AGGGA/GCAAtG-3′) in the STL1 and RTC3 promoters. This sequence differs significantly from the HoRE identified in our study. Four different sequences that fit the 5′-wGVRMRRKD-3′ requirement reside in the STL1 promoter, all of them downstream to position −626. Given that the construct –626STL1-LacZ is not responsive to osmotic pressure or to Hog1 (Figure 3A), these fragments cannot be the Hog1/Hot1 targets on the promoter. We also identified in the RTC3 promoter four sequences of 5′-wGVRMRRKD-3′ (underlined in Figure 10B, top). To examine their role in regulating the RTC3 promoter in general, and by Hot1 in particular, we cloned the RTC3 promoter and prepared some deletion constructs (Figure 10B). We first tested the activity of the full-length promoter in wild-type and hot1∆ cells and found, surprisingly, that it is strongly induced in both strains (Figure 10A). Promoter activity was just slightly lower in hot1∆ cells than in wild-type cells (25% reduction; Figure 10A), suggesting that Hot1 is not essential for its activity. RTC3 promoter was more affected by knocking out the MSN2/4 genes (50% reduction; Figure 10A). Accordingly, this promoter contains four STREs (rectangles in Figure 10B, top). Deletion analysis (Figure 10B) clearly shows that removal of the most downstream STRE (at position −197; Figure 10B) abolished promoter responsiveness. It seems that the proposed Hot1-binding sites play a minor role in promoter regulation. Combining the deletion analysis with the experiment in hot1∆ cells suggests that Hot1 is not a critical activator of the RTC3 promoter, explaining the lack of HoRE in this promoter.
FIGURE 10:
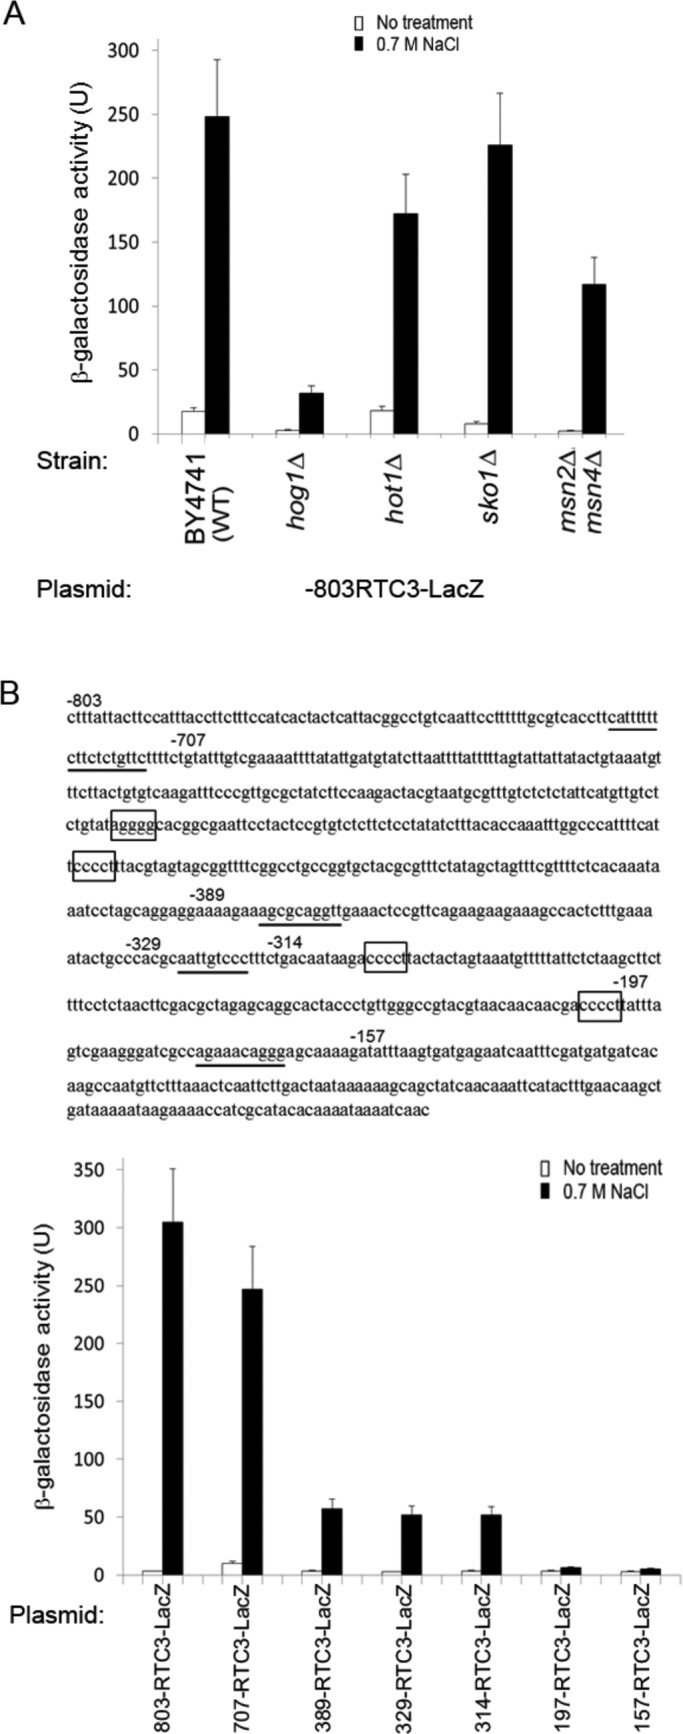
The promoter of RTC3, a putative target of Hot1, is activated in hot1∆ cells. It is less efficiently activated in msn2∆msn4∆ cells and possesses several STREs. (A) The –803-RTC3-LacZ reporter gene was assayed in the indicated strains. (B) Top, the sequence of the RTC3 promoter. STREs are boxed, and the proposed Hot1-binding sites (Cook and O'Shea, 2012) are underlined. The most 5′ nucleotide of each deletion construct is marked by its number. Bottom, β-galactosidase activity of the indicated deletion constructs of the RTC3 promoter as assayed in wild-type cells.
Recombinant Hot1 protein binds the HoRE in vitro
The foregoing findings strongly suggested that activation of the STL1 promoter in response to osmostress or to active Hog1 is mediated via the HoRE in a Hot1-dependent manner. To examine the possibility that Hot1 is capable of associating physically with HoRE, we applied an electrophoretic mobility shift assay (EMSA) and measured directly Hot1 binding. A radioactively labeled fragment containing the HoRE was incubated with a purified recombinant polyhistidine-tagged Hot1 protein and the reaction mixture was subjected to native-gel electrophoresis. When the labeled HoRE probe was incubated with the polyhistidine-tagged Hot1 protein, its migration in the gel was significantly retarded, suggesting HoRE-Hot1 association (Figure 11A). No retardation was observed when labeled HoRE was incubated with another purified polyhistidine tagged protein (JNK) or with glutathione S-transferase (GST) or bovine serum albumin (BSA; Figure 11A). Binding of Hot1 to the probe was outcompeted by the unlabeled probe but not by a probe in which HoRE was mutated (RM9; Figure 11B), suggesting that the intact sequence of the identical and similar repeats is important not only for induction of the promoter by osmostress (Figure 6), but also for association with Hot1. We also incubated the probe with yeast lysates prepared from cells of the wild-type strain BY4741 and of the hog1∆, hot1∆, the hog1∆hot1∆ strains either exposed or not exposed to 0.7M NaCl for 1 h. DNA-binding activity was observed in lysates prepared from BY4741, hog1∆, and hot1∆ cells, but DNA–protein complex obtained with lysates prepared from hog1∆ and hot1∆ cells moved faster in the native gel (Figure 11, C and D). Binding of lysates to a mutated probe (M; Figure 11D, bottom) was significantly reduced. No HoRE binding activity was manifested by a lysate prepared from hog1∆hot1∆ cells (Figure 11D). Reduced binding activity was manifested by lysates prepared from hot1∆sko1∆ cells (lane 9, Figure 11D), suggesting that both proteins may bind E3, which contains binding sites for both. Lysates prepared from sko1∆ cells manifested efficient binding, suggesting that binding of Hot1 is independent of Sko1. The results with the recombinant Hot1 and cell lysates combined suggest that Hot1 associates with HoRE. Hot1 binding may be Hog1 independent (Figure 11D). It seems that Sko1 may also bind HoRE.
Knocking out HOT1 from the genome abolishes transcriptional induction in response to osmotic stress of only one gene, STL1
The HoRE that we identified in the STL1 promoter seems to be the direct target of Hot1. We therefore looked for a similar HoRE in the promoters of putative targets of Hot1. Rep et al. (2000) proposed nine genes (STL1, PHO84, YGR043C, CHA1, GPD1, GPP2, YHR087W/RTC3, YGR052W/FMP48, and PUT4; the last may be suppressed by Hot1) as potential Hot1 targets on the basis of microarray studies with hot1∆ cells in the W303 background. Gomar-Alba et al. (2012) suggested that RTC3/HGI1 is a Hot1 target, and Capaldi et al. (2008), based on large-scale microarray and ChIP analyses, proposed several more Hot1 target genes (∼20; 10 of them were putative), including THI4, SED1, SPI1, and FIT1, which were also identified here as targets of HOG1D170A+F318L (Table 2A). As shown earlier (Figure 10), Hot1 is not critical at all for induction of the RTC3/HGI1 promoter, which does not contain HoRE. Searching the promoters of all other putative Hot1 targets also did not disclose the presence of any HoRE. We therefore tested the expression of some of these genes via real-time-RT-PCR in hot1∆ cells (see Figure 12). All genes tested—GPD1, GPP2, RTC3/HGI1, PHO84, and FIT1—were efficiently induced in response to NaCl, KCl, or sorbitol in hot1∆ cells (see later discussion of Figure 12), although to a somewhat lower levels than in wild-type cells. It seems that although Hot1 was found to be associated with the promoters of these genes (Capaldi et al., 2008), it is not essential for their transcriptional induction, although it does play a role in it.
FIGURE 12:
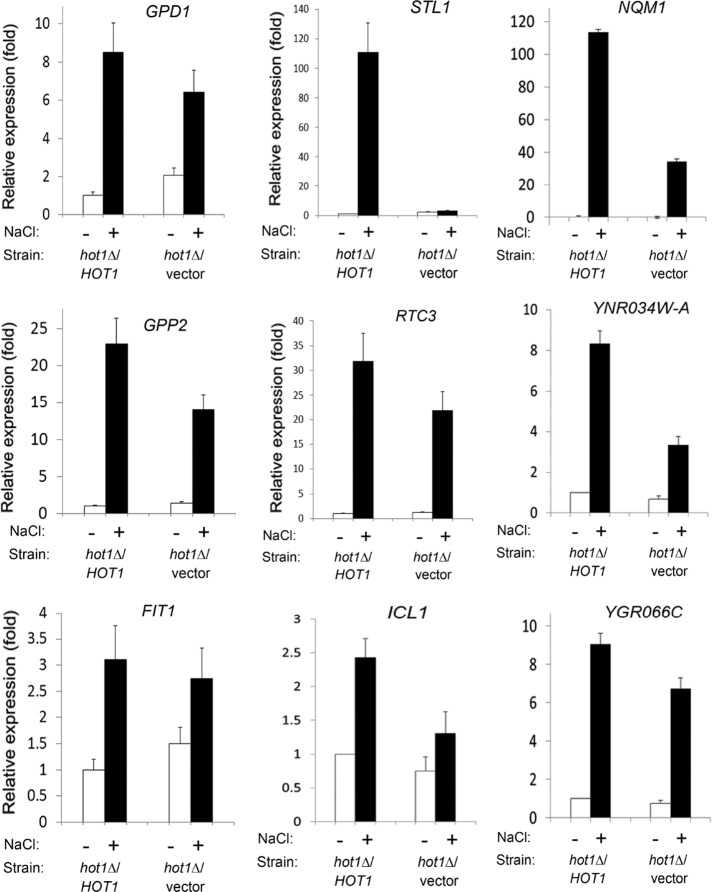
STL1 is the only gene whose expression is abolished in hot1∆ cells. mRNA levels of the indicated genes were assayed by real-time quantitative RT-PCR performed on RNAs isolated from hot1∆ cells harboring either an empty vector or a single copy of a genomic fragment carrying the HOT1 gene (including its native promoter). Cells were grown to mid log phase and then exposed to the indicated treatments. The value of each gene was normalized to the value of ACT1, which served as an internal control, and is shown as the ratio between its value in the sample to its value in untreated hot1∆/HOT1 cells. Values shown are averages of three independent experiments.
Because HoREs were not found in the putative Hot1 targets, we looked for HoRE in all yeast promoters, that is, within the sequence residing 1000 base pairs upstream of the first AUG codon. A sequence containing the HoRE as is (E5, Figure 7) or even just the two identical repeats as they appear in the STL1 promoter could not be found in any of the S. cerevisiae promoters. A single 5′-CATTTGGC-3′ was found in 347 promoters. However, in those 347 promoters, the 5′-CATTTGGC-3′ sequence is not in the vicinity of any similar sequence and is most probably not affected by Hot1 (see later discussion; Tables 3 and 4). Thus a functional HoRE appears to be unique to the STL1 promoter.
TABLE 3:
Genes induced or suppressed in hot1∆ cells under optimal growth conditions.
| Induced genes | Suppressed genes | ||
|---|---|---|---|
| Gene name | Fold change | Gene name | Fold change |
| PHO84 | 4.14 | FIT1 | 2.17 |
| URA3 | 2.62 | BNA2 | 2.12 |
| COS12 | 2.11 | ||
Fold change for induced genes was calculated as the ratio of gene expression levels in hot1Δ and hot1Δ/HOT1 cells and vice versa for suppressed genes.
TABLE 4:
Genes induced in wild-type cells, but not in hot1Δ cells, in response to osmotic pressure.
| Gene name | Fold change | Gene name | Fold change |
|---|---|---|---|
| A. 0.9 M KCl | B. 0.9 M NaCl | ||
| STL1 | 254.76 | STL1 | 38.92 |
| YML057C-A | 6.24 | YML057C-A | 3.65 |
| NQM1 | 5.19 | NQM1 | 3.35 |
| YGR066C | 5.05 | FIT1 | 3.34 |
| FIT1 | 4.36 | ||
| YNR034W-A | 4.09 | C. 1 M sorbitol | |
| ICL1 | 4.04 | Gene name | Fold change |
| ERR2 | 3.80 | STL1 | 13.26 |
| ERR1 | 3.77 | NQM1 | 11.50 |
| ERR3 | 3.72 | GRE1 | 4.87 |
| TMA17 | 3.67 | TKL2 | 4.27 |
| BTN2 | 3.64 | YBR116C | 4.18 |
| SPG4 | 3.55 | SIP18 | 3.63 |
| TPS2 | 3.49 | FIT1 | 3.57 |
| RTN2 | 3.43 | YNL067W-A | 3.53 |
| YCL046W | 3.34 | PAI3 | 3.36 |
| TSL1 | 3.26 | GND2 | 3.11 |
| RTC3 | 3.23 | ALD3 | 3.02 |
| CUR1 | 3.08 | ||
| CYC7 | 3.04 | ||
| YNL195C | 3.03 |
Fold change was calculated as the ratio of expression levels in hot1Δ/HOT1 and hot1Δ cells 60 min after exposure to 0.9 M KCl (A), 0.9 M NaCl (B), or 1 M sorbitol (C).
Two possible explanations may account for the lack of the HoRE from any other yeast promoter. First, STL1 may be the only bona fide target of Hot1. Second, the sequence of the Hot1 binding site is not rigid, and to activate other promoters, Hot1 is not using HoRE but other cis-elements that may or not be similar to HoRE. This notion is based on many recent examples of transcription factors that were found to be associated with sequences that vary significantly from their optimal binding site (MacQuarrie et al., 2011). We opted therefore to identify the target genes of Hot1 via a functional approach in which we analyzed a whole-genome microarray to search for genes that are not induced in hot1Δ cells in response to several stress conditions. Cells of the hot1∆ and hot1∆/HOT1 strains (a hot1∆ strain into which an intact, single-copy HOT1 gene was introduced) were grown to logarithmic phase. Then each culture was divided into four cultures that continued to grow for 1 h on yeast nitrogen base (YNB) –URA or on YNB –URA supplemented with 0.9 M NaCl, 0.9 M KCl, or 1 M sorbitol. Total RNA was extracted from each of the eight samples and analyzed by microarray. In cells grown under optimal conditions, five genes appeared to be mildly affected by the lack of HOT1 (Table 3). Of those, PHO84 showed approximately fourfold increase in expression in hot1∆ cells, whereas the other four genes showed only twofold change in expression. Comparison of gene expression between the two strains under osmotresses showed that the most significantly affected gene was STL1. The mRNA levels of this gene in KCl- or NaCl-treated hot1∆/HOT1 cells were 254- and 39-fold higher, respectively, than in hot1∆/vector cells (Table 4). When hot1∆ and hot1∆/HOT1 cells were exposed to sorbitol, STL1 mRNA levels were only 13-fold higher in hot1∆/HOT1 cells (Table 4C) because transcriptional induction of STL1 in response to this stress is weaker relative to its induction by KCl or NaCl. Microarray analysis disclosed that only a few more genes, in addition to STL1, were affected by knockout of HOT1, and even those were only mildly affected (Table 4). After exposure to 0.9M KCl, 21 genes showed >3-fold-reduced expression in hot1∆/vector cells compared with hot1∆/HOT1 cells. Only four genes (including STL1) showed similar differences after NaCl treatment (Table 4). Some of the genes that showed changes in expression levels between the strains in the microarray analysis and were previously reported to be regulated by Hot1 were also tested directly by real-time RT-PCR (Figure 12). Of those, GPD1, GPP2, FIT1, RTC3, and YGR066C were induced to high levels in hot1∆ cells in response to osmostress, reaching levels of 70–90% of their expression levels in wild-type cells (Figure 12). ICL1, NQM1, and YNR034W-A were more severely affected by the absence of Hot1 and were induced to 30–50% of their levels in wild-type cells (Figure 12). Only STL1 showed no induction whatsoever in hot1∆ cells (Figure 12). Thus, under the conditions tested, Hot1 activity is essential for transcription of just one gene, STL1.
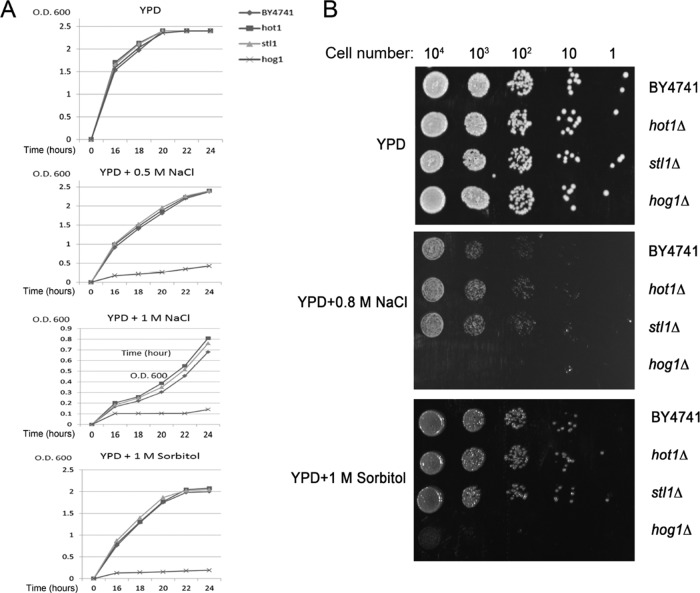
The absolute dependence of STL1 transcription on Hot1 and the observation that Hot1 is essential only for STL1 transcription suggest that knocking out either gene would impose the same phenotype. We tested the growth rates of hot1∆ and stl1∆ cells on several types of osmostress and could not observe any sensitivity (Figure 13).
FIGURE 13:
hot1∆ and stl1∆ cells are not sensitive for growth under osmostress. Cells of the indicated strains were allowed to proliferate on the indicated liquid medium (A) or on plates supplemented with agar plus the indicated medium (B).
DISCUSSION
This study described a new approach for identifying the bona fide target genes of Hog1, using inducible expression of intrinsically active variants. This approach is not limited to Hog1 and could be applied for the yeast MAPK SLT2/MPK1 and for all isoforms of the mammalian p38s and extracellular regulated kinases, as intrinsically active variants are available for these molecules (Askari et al., 2006, 2007, 2009; Avitzour et al., 2007; Levin-Salomon et al., 2008; Beenstock et al., 2014). Identifying the bona fide target genes of those MAPKs will show whether, similar to the case of Hog1, their activation per se results in induction of a relatively small number of target genes. In the case of Hog1 studied here, it is clear that this MAPK is essential for activation of many genes, but its individual activation in the cell is sufficient for induction of only ∼100. This implies that for activation of all other genes for which Hog1 is essential, Hog1 must cooperate with other systems that are probably coactivated with it when the cell is exposed to relevant conditions. Note that transcriptional induction of Hog1 target genes is probably not required for a proper response to osmostress (Westfall et al., 2008) but may be involved in long-term adaptation to stress (Schaber et al., 2012).
Our study showed that induction of STL1 in response to osmostress or to active Hog1 is absolutely dependent on the transcription factor Hot1. Unexpectedly, STL1 seems to be the only gene for which Hot1 is essential. Other genes proposed to be activated by Hot1 do not contain the binding site HoRE identified in the STL1 promoter. In addition, the absence of Hot1 from the genome has just a partial effect on their transcription. Namely, our microarray and RT-PCR analyses showed that genes such as GPD1, NQM1, and HGI1/RTC3 are expressed and induced in hot1∆, although to lower levels than in wild-type cells, and that the only gene whose expression is barely detectable in response to osmostress in hot1∆ cells is STL1. The possibility remains, however, that in response to particular, currently unknown, conditions, Hot1 activates transcription of more genes. It must do so, however, via a different cis-element or use the single 5′-CATTTGGC-3′ repeat found in 347 promoters.
Recruiting Hot1 to the promoters of GPD1, HXT1, HGI1/RTC3, and GPP2/HOR2 and ∼15 more genes (Capaldi et al., 2008) may assist in regulating their transcription but is clearly not essential for it. It could be that Hot1 plays some accessory role, not related to transcription per se. It may be involved, for example, in DNA repair, mRNA editing, or mRNA nuclear export, activities known to accompany the transcription bubble (Fong et al., 2013; Muller-McNicoll and Neugebauer, 2013; Burns and Wente, 2014). A bigger puzzle is why STL1 transcription is absolutely dependent on a single factor, Hot1. Namely, why is STL1 left with no backup machinery? This unusual link of absolute dependence between the STL1 gene and the Hot1 protein is unexplained. STL1 encodes a sugar/glycerol transporter, and, just like HOT1, it is not essential for survival or for proliferation under osmotic pressure.
Many transcriptional activators are regarded as “master” genes because they regulate activation of many promoters and thereby determine the cell's fate (Rothwarf and Karin, 1999; Florin et al., 2004; Bailey and Europe-Finner, 2005; Cao et al., 2006; Dang et al., 2006; van Riggelen et al., 2010). In the view of this notion, the case of Hot1, which regulates a very few genes and seems to be essential for the expression of just one gene, appears to be exceptional. However, the human genome encodes between 1400 and 2600 DNA-binding proteins (∼10% of the genes in the genome), and most of them are transcriptional activators whose targets have not been revealed (Babu et al., 2004; www.biostars.org/p/53590/). Given the many similarities between yeast and higher eukaryotes (Engelberg et al., 1989, 2014), some of these human proteins may be dedicated to only a few target genes or, like Hot1, to a single one.
MATERIALS AND METHODS
Yeast strains and media
Yeast strains used in this study are listed in Table 5. Commonly used media were synthetic media, YNB medium (0.17% yeast nitrogen base without amino acids and NH4(SO4)2, 0.5% ammonium sulfate, 2% glucose, and 40 mg/l required nutrients), or yeast/peptone/dextrose (YPD) medium (2% glucose, 1% yeast extract, and 2% Bacto Peptone).
TABLE 5:
Yeast strains used in this study.
| Strain | Relevant genotype | Source/reference |
|---|---|---|
| YPH102 | MATα ura3-52 lys2-801 ade2-101 his3-200 leu2-1 | Bell et al. (2001) |
| BY4741 | MATa his3-Δ1 leu2-Δ0 met15Δ0 ura3Δ0 | EUROSCARF (Bad Homburg, Germany) |
| JBY13 | MATa his3, leu2, ura3, trp1, ade2, lys2 hog1::TRP1 | M. Gustin (Rice University) |
| hog1Δpbs2Δ | MATa his3, ura3, trp1, ade2, lys2 hog1::TRP1, pbs2::LEU2 | Bell et al. (2001) |
| hot1Δ | MATa his3-Δ1 leu2-Δ0 met15Δ0 ura3Δ0 hot1::kanMX4 | EUROSCARF |
| smp1Δ | MATa his3-Δ1 leu2-Δ0 met15Δ0 ura3Δ0 smp1::kanMX4 | EUROSCARF |
| ras2Δ | MATa his3-Δ1 leu2-Δ0 met15Δ0 ura3Δ0 ras2::kanMX4 | EUROSCARF |
| msn2Δ | MATa his3-Δ1 leu2-Δ0 met15Δ0 ura3Δ0 msn2::kanMX4 | EUROSCARF |
| sko1Δ | MATa his3-Δ1 leu2-Δ0 met15Δ0 ura3Δ0 sko1::kanMX4 | EUROSCARF |
| msn2Δmsn4Δ | MATa his3-Δ1 met15Δ0 ura3Δ0 msn2::kanMX4 msn4::LEU2 | This work |
| ras2Δmsn2Δmsn4Δ | MATa met15Δ0 ura3Δ0 ras2::kanMX4 msn2::HIS3 msn4::LEU2 | This work |
| hog1Δhot1Δ | MATa leu2, ura3, trp1, ade2, lys2 hog1::TRP1 hot1::HIS3 | This work |
| hot1Δ HOT1 | MATa his3-Δ1 leu2-Δ0 met15Δ0 ura3Δ0 hot1::kanMX4 pRS316-HOT1 | This work |
| hot1Δsko1Δ | MATa his3-Δ1 leu2-Δ0 met15Δ0 sko1::kanMX4 hot1::URA3 | This work |
| HOT1-HA | MATa his3-Δ1 leu2-Δ0 met15Δ0 ura3Δ0 pRS313 HOT1 | This work |
| sko1Δ HOT1-HA | MATa his3-Δ1 leu2-Δ0 met15Δ0 ura3Δ0 sko1::kanMX4 pRS313 HOT1 | This work |
EUROSCARF, European Saccharomyces Cerevisiae Archive for Functional Analysis, Frankfurt, Germany.
Plasmids
For STL1 promoter constructs, the pLG669Z plasmid (Guarente and Ptashne, 1981) was digested with BamHI and SalI. Different lengths of STL1 promoter were amplified by PCR using genomic DNA of the wild-type strain BY4741 as a template. Primers used are listed in Table 6. PCR products were digested with BamHI and SalI and ligated to the pLG669Z vector. The resulting plasmids contained the STL1 promoter fragments with the first ATG fused in-frame to the β-galactosidase coding sequence (Guarente and Ptashne, 1981; Grably et al., 2002). The RTC3 promoter constructs were produced in a similar way. Different lengths of RTC3 promoter were amplified by PCR using genomic DNA of the wild-type strain BY4741 as a template. Primers used are listed in Table 6. PCR products were digested with BamHI and SalI and ligated to pLG669Z, which was cut with the same restriction enzymes. For inserting elements of the STL1 promoter upstream to the CYC1 minimal promoter, regions from STL1 promoter were amplified by PCR using genomic DNA of the wild-type strain BY4741 as a template, digested with XhoI, and cloned into XhoI-digested pLG669Z-178URA (Guarente and Ptashne, 1981; Grably et al., 2002). The correct orientation was selected based on sequencing result. For producing recombinant Hot1, the coding sequence of HOT1 was amplified by PCR using genomic DNA of the wild-type strain BY4741 as a template, digested with NdeI and NotI, and cloned in the pET28 Escherichia coli expression vector digested with the same enzymes. The resulting plasmid contains the HOT1 open reading frame in-frame with and downstream to the hexahistidine tag in the vector (pET28-HOT1). To construct an integrative pRS316-HOT1 plasmid harboring the native HOT1's promoter and terminator, the coding sequence of HOT1 plus an 800–base pair 5′ promoter sequence and a 610–base pair 3′ untranslated region was amplified by a high-fidelity PCR system (Fermentas, Vilnius, Lithuania) using genomic DNA of the wild-type strain BY4741 as a template, digested with BamHI, and cloned in a pRS316 vector digested with the same enzymes. MET3-HOG1WT and MET3-Hog1D170+F318L constructs were already described (Yaakov et al., 2003).
TABLE 6:
Oligonucleotides used in this study.
| Primers for cloning and plasmid construction | |
| STL1-Rev | gactGGATCCggtcatggtctaaaactttctatg |
| STL1-704 | gactGTCGACataacggacgtacggac |
| STL1-665 | gactGTCGACtattccaccgcatttgg |
| STL1-654 | gactGTCGACatttggcccatttggctc |
| STL1-645 | gactGTCGACcatttggctcactttgac |
| STL1-636 | gactGTCGACactttgactcaacttgc |
| STL1-626 | gactGTCGACaacttgcgtcattttaac |
| STL1-583 | gactGTCGACtttttcggccaccgcata |
| STL1-550 | gactGTCGACtccgctacctgcatttg |
| STL1-400 | gactGTCGACtgtttctcggctatatac |
| STL1-704F | gactCTCGAGataacggacgtacggacg |
| STL1-533R | gactCTCGAGcaaatgcaggtagcggag |
| STL1-564R | gactCTCGAGtatgcggtggccgaaaaag |
| STL1-583R | gactCTCGAGacaaagtcggacccttc |
| CYC1-R | gactGGATCCGGTCATTATTAA gactCTCGAGcatttggcccatttggctcactttgactcaacttgcgtcattttaactgatatgaagggtcc |
| STL1-E1 | AGATCCGCCAGGCGTGTA gactCTCGAGcatttggcccatttggctcactttgactcaacttgcgtcattttaactgatatg |
| STL1-E2 | CAGATCCGCCAGGCGTGTA gactCTCGAGctattccaccgcatttggcccatttggctcactttgactcaacttgcgtcattttaactgatatg |
| STL1-E3 | CAGATCCGCCAGGCGTGTA gactCTCGAGctattccaccgcatttggcccatttggctcactttgact |
| STL1-E4 | CAGATCCGCCAGGCGTGTA GactCTCGAGcatttggcccatttggctcactttgact |
| STL1-E5 | CAGATCCGCCAGGCGTGTA |
| RTC3-803 | GactGTCGACtttattacttccatttac |
| RTC3-707 | gactGTCGACtgtatttgtcgaaaattt |
| RTC3-389 | gactGTCGACgaaagcgcaggttgaaac |
| RTC3-329 | gactGTCGACgcaattgtccctttctgac |
| RTC3-314 | gactGTCGACtgacaataagaCCCCTta |
| RTC3-197 | gactGTCGACTtatttagtcgaagggat |
| RTC3-157 | gactGTCGACGatatttaagtgatgagaa |
| RTC3-R | gactGGATCCggtcatgttgattttattttgtgtatg |
| HOT1-pt-F | gactGGATCCtcatgttttccattaatc |
| HOT1-R | gactGGATCCgttattgccagaatcattg |
| HOT1-F(Nco) | gactCCATGGctTCTGGAATGGGTATTGCG |
| HOT1-R2(N1) | gactGCGGCCGCacccttctcagaataag |
| Primers for mutagenesis | |
| STL1-STRE-F | tttagcttcaattttgtcTcGttcaacgctgcttggcc |
| STL1-STRE-R | ggccaagcagcgttgaaCgAgacaaaattgaagctaaa |
| STL1-delR2-F | gttgtcccactattccaccgcactttgactcaacttgcg |
| STL1-delR2-R | cgcaagttgagtcaaagtgcggtggaatagtgggacaac |
| STL1-delR3-F | gttgtcccactattccaccgcaacttgcgtcattttaac |
| STL1-delR3-R | gttaaaatgacgcaagttgcggtggaatagtgggacaac |
| STL1-delR4-F | gaaataagtgccgttgtcccactttgactcaacttgcg |
| STL1-delR4-R | cgcaagttgagtcaaagtgggacaacggcacttatttc |
| STL1-delR5-F | gaaataagtgccgttgtcccaacttgcgtcattttaac |
| STL1-delR5-R | gttaaaatgacgcaagttgggacaacggcacttatttc |
| STL1-delSKO-F | cccatttggctcactttgttttaactgatatgaaggg |
| STL1-delSKO-R | cccttcatatcagttaaaacaaagtgagccaaatggg |
| Primers for RT-PCR | |
| ACT1-RF | GTGTGGGGAAGCGGGTAAGC |
| ACT1-RR | GTGGCGGGTAAAGAAGAAAATGGA |
| STL1-RF | GTTGCGGTATTTCATCAC |
| STL1-RR | CATAGTTGAACTGTTTACC |
| CWP1-RF | CTCCACTGCTTTGTCTGTCG |
| CWP1-RR | CAAGTATTGTAAATCCGAGC |
| HSP12-RF | CTGACGCAGGTAGAAAAGG |
| HSP12-RR | GAACCTTACCAGCGACCTTG |
| KDX1-RF | CACCGAGAGGTGTATTTTCC |
| KDX1-RR | GAGTTTCCTCGTTCGATTC |
| PNS1-RF | CCGTTTTGGGCCTCACAC |
| PNS1-RR | CAGACCAGTACCTCAAAG |
| PRM10-RF | GCTCTATCCCTCGTTCTC |
| PRM10-RR | CAGCAACTAGGCTTCGAC |
| GRE2-RF | GTGTTCGATATGGCAAAAG |
| GRE2-RR | CTTCTTAGAACCACAGTAG |
| THI4-RF | GAAGACGAAGGTGACTATG |
| THI4-RR | GAACAGTTTAACATTTGG |
| YLR042C-RF | GGAGGTGTAGGTTCAGTC |
| YLR042C-RR | CAAATAAGCGATTGTTTC |
| FIT1-RF | GCCGCTTTAGGCGAAAGTATT |
| FIT1-RR | CTTCAGTTACTGCGGAGGTTACC |
| GPD1-RF | TCAATTTTTGCCCCGTATCTG |
| GPD1-RR | GATAGCTCTGACGTGTGAATCAACA |
| GPP2-RF | CGACGTCGACGGTACCATTA |
| GPP2-RR | CGAAATCCCTCCAGAATGCA |
| RTC3-RF | GGGCGCTGCCTCCAA |
| RTC3-RR | CTTCGATCTTCTTGCCCTTACC |
| NQM1-RF | CATTACTGTTTTCCTTTAC |
| NQM1-RR | CAGTATAGTCTTTGCCTG |
| ICL1-RF | GACACCGTTCCAAACAAAG |
| ICL1-RR | CATCTCATCGAGTTCTTC |
| YNR034W-A-RF | CCAATCACCGAAGTATTG |
| YNR034W-A-RR | GATTGGTGACTTTTCGATG |
| YGR066C-RF | GAAATGACAACATTGAAG |
| YGR066C-RR | CTCGTAAACATCACAGTC |
Site-directed mutagenesis
The Stratagene QuikChange II Site-Directed Mutagenesis Kit (Stratagene, La Jolla, CA) was used to insert mutations in the STL1 promoter. The mutagenesis process was performed according to manufacturer's instructions. Primers used are listed in Table 6.
β-Galactosidase assay
Cells were grown to mid log phase and divided into two cultures of 5 ml each. For salt induction, 0.81 ml of 5 M NaCl was added into 5-ml culture to make a final concentration of 0.7 M. The same volume of water was added to the other 5-ml culture. Cells were collected 60 min after addition of NaCl, disrupted, and assayed as described previously (Grably et al., 2002). Results are shown as means ± SDs of three independent experiments.
RNA extraction, real-time RT-PCR, and microarray
Total RNA was extracted from yeast cells using the RNeasy Plus Mini Kit (Qiagen, Hilden, Germany). cDNA was synthesized by iScript Reverse Transcription Supermix (Bio-Rad, Hercules, CA). Gene-specific primers were used to amplify individual target genes with PCR master mix (Fermentas, Vilnius, Lithuania). Microarray analysis was performed by using Agilent SurePrint G3 (Yeast), one-color, 8 × 60K–format slide (Agilent Technologies, Santa Clara, CA). Data analyses were performed using the Genespring GX software. Real-time RT-PCR was performed with an Applied Biosystems (Foster City, CA) 7500 Fast Real-time PCR machine. cDNA was amplified by BioRad iScript Reverse Transcription Supermix following the protocol suggested by the provider. Primers used are listed in Table 6. Real-time PCR was done by the preset 7500 Fast protocol for quantitative comparative CT, SYBR Green protocol. ACT1 was used as an internal control. The value for each targeted gene was normalized to the value of ACT1.
Cell lysis and Western blot analysis
Cell lysis and Western blotting were conducted as described (Yaakov et al., 2003). Anti–phospho-p38 antibody from Cell Signaling Technology (Beverly, MA) was used to detect phosphorylated Hog1. Hog1 (Y-215) antibody from Santa Cruz Biotechnology (Santa Cruz, CA) was used to detect Hog1 protein. The hemagglutinin (HA)-tagged protein was detected by HA antibody 3F10 from Roche.
Electrophoretic mobility shift assay
Whole-cell lysate binding assay was done as described (Engelberg et al., 1994). As a probe, a fragment of the STL1 promoter equivalent to E6 (Figure 7) was used. It was made by annealing two oligos (5′-ctattccaccgcatttggcccatttggctcactttgactcaacttgcgtcattttaactgatatg-3′ and 5′-catatcagttaaaatgacgcaagttgagtcaaagtgagccaaatgggccaaatgcggtggaatag-3′) and labeled with T4 polynucleotide kinase (NEB, Ipswich, MA) in the presence of [γ−32P]ATP. A 10-ng amount of probe was mixed with 15 μg of total cell lysate for 15 min at 25ºC before being loaded to a 5% native polyacrylamide gel. For direct binding assays, recombinant His-HOT1 and His-JNK2 proteins were purified from BL21 Rosetta strain using Ni Sepharose bead (GE Healthcare). For competition binding by wild-type STL1 E6 fragment, 3 or 0.6 μg of unlabeled double-strand E6 probe was mixed with 32P-labeled E6 probe. For competition binding by E6 fragment harboring mutations at HoRE repeats (RM9), two oligos (5′-ctattccaccgcatctggtccatctggttcactctgattcaacttgcgtcattttaactgatatg-3′ and 5′-catatcagttaaaatgacgcaagttgaatcagagtgaaccagatggaccagatgcggtggaatag-3′) were annealed to form double strands, and the same amount of probe was mixed with 32P-labeled probe.
Acknowledgments
We thank Maralli del Olmo for providing the pRS313-HOT1 plasmid. We thank Ze'ev Paroush, Nir Friedman, and members of the Engelberg group for valuable comments on the manuscript. This study was supported by the Israel Science Foundation (Center of Excellence Grants 180/09 and 1772/13), the Binational US–Israel Science Foundation (Grant 2009116), the Israel Cancer Research Fund, and the Singapore National Research Foundation under its HUJ-NUS partnership program in the Campus for Research Excellence and Technology Enterprise (CREATE).
Abbreviations used:
- HOG
high-osmolarity glycerol
- Hot1
high-osmolarity-induced transcription 1
- Pbs2
polymyxin B sensitivity
- Stl1
sugar transporter-like protein.
Footnotes
This article was published online ahead of print in MBoC in Press (http://www.molbiolcell.org/cgi/doi/10.1091/mbc.E14-12-1626) on April 22, 2015.
REFERENCES
- Aerts S. Computational strategies for the genome-wide identification of cis-regulatory elements and transcriptional targets. Curr Top Dev Biol. 2012;98:121–145. doi: 10.1016/B978-0-12-386499-4.00005-7. [DOI] [PubMed] [Google Scholar]
- Alepuz PM, de Nadal E, Zapater M, Ammerer G, Posas F. Osmostress-induced transcription by Hot1 depends on a Hog1-mediated recruitment of the RNA Pol II. EMBO J. 2003;22:2433–2442. doi: 10.1093/emboj/cdg243. [DOI] [PMC free article] [PubMed] [Google Scholar]
- Askari N, Beenstock J, Livnah O, Engelberg D. p38alpha is active in vitro and in vivo when monophosphorylated at threonine 180. Biochemistry. 2009;48:2497–2504. doi: 10.1021/bi900024v. [DOI] [PubMed] [Google Scholar]
- Askari N, Diskin R, Avitzour M, Capone R, Livnah O, Engelberg D. Hyperactive variants of p38alpha induce, whereas hyperactive variants of p38gamma suppress, activating protein 1-mediated transcription. J Biol Chem. 2007;282:91–99. doi: 10.1074/jbc.M608012200. [DOI] [PubMed] [Google Scholar]
- Askari N, Diskin R, Avitzour M, Yaakov G, Livnah O, Engelberg D. MAP-quest: could we produce constitutively active variants of MAP kinases. Mol Cell Endocrinol. 2006;252:231–240. doi: 10.1016/j.mce.2006.03.015. [DOI] [PubMed] [Google Scholar]
- Avitzour M, Diskin R, Raboy B, Askari N, Engelberg D, Livnah O. Intrinsically active variants of all human p38 isoforms. FEBS J. 2007;274:963–975. doi: 10.1111/j.1742-4658.2007.05644.x. [DOI] [PubMed] [Google Scholar]
- Babu MM, Luscombe NM, Aravind L, Gerstein M, Teichmann SA. Structure and evolution of transcriptional regulatory networks. Curr Opin Struct Biol. 2004;14:283–291. doi: 10.1016/j.sbi.2004.05.004. [DOI] [PubMed] [Google Scholar]
- Bailey J, Europe-Finner GN. Identification of human myometrial target genes of the c-Jun NH2-terminal kinase (JNK) pathway: the role of activating transcription factor 2 (ATF2) and a novel spliced isoform ATF2-small. J Mol Endocrinol. 2005;34:19–35. doi: 10.1677/jme.1.01608. [DOI] [PubMed] [Google Scholar]
- Bailey J, Tyson-Capper AJ, Gilmore K, Robson SC, Europe-Finner GN. Identification of human myometrial target genes of the cAMP pathway: the role of cAMP-response element binding (CREB) and modulator (CREMalpha and CREMtau2alpha) proteins. J Mol Endocrinol. 2005;34:1–17. doi: 10.1677/jme.1.01594. [DOI] [PubMed] [Google Scholar]
- Beenstock J, Ben-Yehuda S, Melamed D, Admon A, Livnah O, Ahn NG, Engelberg D. The p38beta mitogen-activated protein kinase possesses an intrinsic autophosphorylation activity, generated by a short region composed of the alpha-G helix and MAPK insert. J Biol Chem. 2014;289:23546–23556. doi: 10.1074/jbc.M114.578237. [DOI] [PMC free article] [PubMed] [Google Scholar]
- Bell M, Capone R, Pashtan I, Levitzki A, Engelberg D. Isolation of hyperactive mutants of the MAPK p38/Hog1 that are independent of MAPK kinase activation. J Biol Chem. 2001;276:25351–25358. doi: 10.1074/jbc.M101818200. [DOI] [PubMed] [Google Scholar]
- Bell M, Engelberg D. Phosphorylation of Tyr-176 of the yeast MAPK Hog1/p38 is not vital for Hog1 biological activity. J Biol Chem. 2003;278:14603–14606. doi: 10.1074/jbc.C300006200. [DOI] [PubMed] [Google Scholar]
- Boy-Marcotte E, Perrot M, Bussereau F, Boucherie H, Jacquet M. Msn2p and Msn4p control a large number of genes induced at the diauxic transition which are repressed by cyclic AMP in Saccharomyces cerevisiae. J Bacteriol. 1998;180:1044–1052. doi: 10.1128/jb.180.5.1044-1052.1998. [DOI] [PMC free article] [PubMed] [Google Scholar]
- Brewster JL, de Valoir T, Dwyer ND, Winter E, Gustin MC. An osmosensing signal transduction pathway in yeast. Science. 1993;259:1760–1763. doi: 10.1126/science.7681220. [DOI] [PubMed] [Google Scholar]
- Burns LT, Wente SR. From hypothesis to mechanism: uncovering nuclear pore complex links to gene expression. Mol Cell Biol. 2014;34:2114–2120. doi: 10.1128/MCB.01730-13. [DOI] [PMC free article] [PubMed] [Google Scholar]
- Cao Y, Kumar RM, Penn BH, Berkes CA, Kooperberg C, Boyer LA, Young RA, Tapscott SJ. Global and gene-specific analyses show distinct roles for Myod and Myog at a common set of promoters. EMBO J. 2006;25:502–511. doi: 10.1038/sj.emboj.7600958. [DOI] [PMC free article] [PubMed] [Google Scholar]
- Capaldi AP, Kaplan T, Liu Y, Habib N, Regev A, Friedman N, O'Shea EK. Structure and function of a transcriptional network activated by the MAPK Hog1. Nat Genet. 2008;40:1300–1306. doi: 10.1038/ng.235. [DOI] [PMC free article] [PubMed] [Google Scholar]
- Causton HC, Ren B, Koh SS, Harbison CT, Kanin E, Jennings EG, Lee TI, True HL, Lander ES, Young RA. Remodeling of yeast genome expression in response to environmental changes. Mol Biol Cell. 2001;12:323–337. doi: 10.1091/mbc.12.2.323. [DOI] [PMC free article] [PubMed] [Google Scholar]
- Cook KE, O'Shea EK. Hog1 controls global reallocation of RNA Pol II upon osmotic shock in Saccharomyces cerevisiae. G3 (Bethesda) 2012;2:1129–1136. doi: 10.1534/g3.112.003251. [DOI] [PMC free article] [PubMed] [Google Scholar]
- Dang CV, O'Donnell KA, Zeller KI, Nguyen T, Osthus RC, Li F. The c-Myc target gene network. Semin Cancer Biol. 2006;16:253–264. doi: 10.1016/j.semcancer.2006.07.014. [DOI] [PubMed] [Google Scholar]
- de Nadal E, Ammerer G, Posas F. Controlling gene expression in response to stress. Nat Rev Genetics. 2011;12:833–845. doi: 10.1038/nrg3055. [DOI] [PubMed] [Google Scholar]
- de Nadal E, Zapater M, Alepuz PM, Sumoy L, Mas G, Posas F. The MAPK Hog1 recruits Rpd3 histone deacetylase to activate osmoresponsive genes. Nature. 2004;427:370–374. doi: 10.1038/nature02258. [DOI] [PubMed] [Google Scholar]
- Duch A, de Nadal E, Posas F. Dealing with transcriptional outbursts during S phase to protect genomic integrity. J Mol Biol. 2013;425:4745–4755. doi: 10.1016/j.jmb.2013.08.019. [DOI] [PubMed] [Google Scholar]
- Engelberg D, Perlman R, Levitzki A. Transmembrane signalling in Saccharomyces cerevisiae. Cell Signal. 1989;1:1–7. doi: 10.1016/0898-6568(89)90015-6. [DOI] [PubMed] [Google Scholar]
- Engelberg D, Perlman R, Levitzki A. Transmembrane signaling in Saccharomyces cerevisiae as a model for signaling in metazoans: State of the art after 25 years. Cell Signal. 2014;26:2865–2878. doi: 10.1016/j.cellsig.2014.09.003. [DOI] [PubMed] [Google Scholar]
- Engelberg D, Zandi E, Parker CS, Karin M. The yeast and mammalian Ras pathways control transcription of heat shock genes independently of heat shock transcription factor. Mol Cell Biol. 1994;14:4929–4937. doi: 10.1128/mcb.14.7.4929. [DOI] [PMC free article] [PubMed] [Google Scholar]
- Florin L, Hummerich L, Dittrich BT, Kokocinski F, Wrobel G, Gack S, Schorpp-Kistner M, Werner S, Hahn M, Lichter P, et al. Identification of novel AP-1 target genes in fibroblasts regulated during cutaneous wound healing. Oncogene. 2004;23:7005–7017. doi: 10.1038/sj.onc.1207938. [DOI] [PubMed] [Google Scholar]
- Fong YW, Cattoglio C, Tjian R. The intertwined roles of transcription and repair proteins. Mol Cell. 2013;52:291–302. doi: 10.1016/j.molcel.2013.10.018. [DOI] [PMC free article] [PubMed] [Google Scholar]
- Gasch AP, Spellman PT, Kao CM, Carmel-Harel O, Eisen MB, Storz G, Botstein D, Brown PO. Genomic expression programs in the response of yeast cells to environmental changes. Mol Biol Cell. 2000;11:4241–4257. doi: 10.1091/mbc.11.12.4241. [DOI] [PMC free article] [PubMed] [Google Scholar]
- Gomar-Alba M, Jimenez-Marti E, del Olmo M. The Saccharomyces cerevisiae Hot1p regulated gene YHR087W (HGI1) has a role in translation upon high glucose concentration stress. BMC Mol Biol. 2012;13:19. doi: 10.1186/1471-2199-13-19. [DOI] [PMC free article] [PubMed] [Google Scholar]
- Grably MR, Stanhill A, Tell O, Engelberg D. HSF and Msn2/4p can exclusively or cooperatively activate the yeast HSP104 gene. Mol Microbiol. 2002;44:21–35. doi: 10.1046/j.1365-2958.2002.02860.x. [DOI] [PubMed] [Google Scholar]
- Guarente L, Ptashne M. Fusion of Escherichia coli lacZ to the cytochrome c gene of Saccharomyces cerevisiae. Proc Natl Acad Sci USA. 1981;78:2199–2203. doi: 10.1073/pnas.78.4.2199. [DOI] [PMC free article] [PubMed] [Google Scholar]
- Hahn JS, Hu Z, Thiele DJ, Iyer VR. Genome-wide analysis of the biology of stress responses through heat shock transcription factor. Mol Cell Biol. 2004;24:5249–5256. doi: 10.1128/MCB.24.12.5249-5256.2004. [DOI] [PMC free article] [PubMed] [Google Scholar]
- Harbison CT, Gordon DB, Lee TI, Rinaldi NJ, Macisaac KD, Danford TW, Hannett NM, Tagne JB, Reynolds DB, Yoo J, et al. Transcriptional regulatory code of a eukaryotic genome. Nature. 2004;431:99–104. doi: 10.1038/nature02800. [DOI] [PMC free article] [PubMed] [Google Scholar]
- Hohmann S. Osmotic stress signaling and osmoadaptation in yeasts. Microbiol Mol Biol Rev. 2002;66:300–372. doi: 10.1128/MMBR.66.2.300-372.2002. [DOI] [PMC free article] [PubMed] [Google Scholar]
- Lee TI, Rinaldi NJ, Robert F, Odom DT, Bar-Joseph Z, Gerber GK, Hannett NM, Harbison CT, Thompson CM, Simon I, et al. Transcriptional regulatory networks in Saccharomyces cerevisiae. Science. 2002;298:799–804. doi: 10.1126/science.1075090. [DOI] [PubMed] [Google Scholar]
- Lemon B, Tjian R. Orchestrated response: a symphony of transcription factors for gene control. Genes Dev. 2000;14:2551–2569. doi: 10.1101/gad.831000. [DOI] [PubMed] [Google Scholar]
- Levine M, Cattoglio C, Tjian R. Looping back to leap forward: transcription enters a new era. Cell. 2014;157:13–25. doi: 10.1016/j.cell.2014.02.009. [DOI] [PMC free article] [PubMed] [Google Scholar]
- Levin-Salomon V, Kogan K, Ahn NG, Livnah O, Engelberg D. Isolation of intrinsically active (MEK-independent) variants of the ERK family of mitogen-activated protein (MAP) kinases. J Biol Chem. 2008;283:34500–34510. doi: 10.1074/jbc.M806443200. [DOI] [PMC free article] [PubMed] [Google Scholar]
- Maayan I, Beenstock J, Marbach I, Tabachnick S, Livnah O, Engelberg D. Osmostress induces autophosphorylation of Hog1 via a C-terminal regulatory region that is conserved in p38alpha. PLoS One. 2012;7:e44749. doi: 10.1371/journal.pone.0044749. [DOI] [PMC free article] [PubMed] [Google Scholar]
- Maayan I, Engelberg D. The yeast MAPK Hog1 is not essential for immediate survival under osmostress. FEBS Lett. 2009;583:2015–2020. doi: 10.1016/j.febslet.2009.05.014. [DOI] [PubMed] [Google Scholar]
- MacQuarrie KL, Fong AP, Morse RH, Tapscott SJ. Genome-wide transcription factor binding: beyond direct target regulation. Trends Genet. 2011;27:141–148. doi: 10.1016/j.tig.2011.01.001. [DOI] [PMC free article] [PubMed] [Google Scholar]
- Meireles-Filho AC, Stark A. Comparative genomics of gene regulation-conservation and divergence of cis-regulatory information. Curr Opin Genet Dev. 2009;19:565–570. doi: 10.1016/j.gde.2009.10.006. [DOI] [PubMed] [Google Scholar]
- Muller-McNicoll M, Neugebauer KM. How cells get the message: dynamic assembly and function of mRNA-protein complexes. Nat Rev Genet. 2013;14:275–287. doi: 10.1038/nrg3434. [DOI] [PubMed] [Google Scholar]
- Mumberg D, Muller R, Funk M. Regulatable promoters of Saccharomyces cerevisiae: comparison of transcriptional activity and their use for heterologous expression. Nucleic Acids Res. 1994;22:5767–5768. doi: 10.1093/nar/22.25.5767. [DOI] [PMC free article] [PubMed] [Google Scholar]
- Natarajan K, Meyer MR, Jackson BM, Slade D, Roberts C, Hinnebusch AG, Marton MJ. Transcriptional profiling shows that Gcn4p is a master regulator of gene expression during amino acid starvation in yeast. Mol Cell Biol. 2001;21:4347–4368. doi: 10.1128/MCB.21.13.4347-4368.2001. [DOI] [PMC free article] [PubMed] [Google Scholar]
- O'Rourke SM, Herskowitz I. A third osmosensing branch in Saccharomyces cerevisiae requires the Msb2 protein and functions in parallel with the Sho1 branch. Mol Cell Biol. 2002;22:4739–4749. doi: 10.1128/MCB.22.13.4739-4749.2002. [DOI] [PMC free article] [PubMed] [Google Scholar]
- O'Rourke SM, Herskowitz I. Unique and redundant roles for HOG MAPK pathway components as revealed by whole-genome expression analysis. Mol Biol Cell. 2004;15:532–542. doi: 10.1091/mbc.E03-07-0521. [DOI] [PMC free article] [PubMed] [Google Scholar]
- O'Rourke SM, Herskowitz I, O'Shea EK. Yeast go the whole HOG for the hyperosmotic response. Trends Genet. 2002;18:405–412. doi: 10.1016/s0168-9525(02)02723-3. [DOI] [PubMed] [Google Scholar]
- Posas F, Chambers JR, Heyman JA, Hoeffler JP, de Nadal E, Arino J. The transcriptional response of yeast to saline stress. J Biol Chem. 2000;275:17249–17255. doi: 10.1074/jbc.M910016199. [DOI] [PubMed] [Google Scholar]
- Proft M, Gibbons FD, Copeland M, Roth FP, Struhl K. Genomewide identification of Sko1 target promoters reveals a regulatory network that operates in response to osmotic stress in Saccharomyces cerevisiae. Eukaryot Cell. 2005;4:1343–1352. doi: 10.1128/EC.4.8.1343-1352.2005. [DOI] [PMC free article] [PubMed] [Google Scholar]
- Proft M, Struhl K. Hog1 kinase converts the Sko1-Cyc8-Tup1 repressor complex into an activator that recruits SAGA and SWI/SNF in response to osmotic stress. Mol Cell. 2002;9:1307–1317. doi: 10.1016/s1097-2765(02)00557-9. [DOI] [PubMed] [Google Scholar]
- Rep M, Krantz M, Thevelein JM, Hohmann S. The transcriptional response of Saccharomyces cerevisiae to osmotic shock. Hot1p and Msn2p/Msn4p are required for the induction of subsets of high osmolarity glycerol pathway-dependent genes. J Biol Chem. 2000;275:8290–8300. doi: 10.1074/jbc.275.12.8290. [DOI] [PubMed] [Google Scholar]
- Rep M, Reiser V, Gartner U, Thevelein JM, Hohmann S, Ammerer G, Ruis H. Osmotic stress-induced gene expression in Saccharomyces cerevisiae requires Msn1p and the novel nuclear factor Hot1p. Mol Cell Biol. 1999;19:5474–5485. doi: 10.1128/mcb.19.8.5474. [DOI] [PMC free article] [PubMed] [Google Scholar]
- Rothwarf DM, Karin M. The NF-kappa B activation pathway: a paradigm in information transfer from membrane to nucleus. Sci STKE. 2012 doi: 10.1126/stke.1999.5.re1. 1999, RE1. [DOI] [PubMed] [Google Scholar]
- Saito H, Posas F. Response to hyperosmotic stress. Genetics. 2012;192:289–318. doi: 10.1534/genetics.112.140863. [DOI] [PMC free article] [PubMed] [Google Scholar]
- Saito H, Tatebayashi K. Regulation of the osmoregulatory HOG MAPK cascade in yeast. J Biochem. 2004;136:267–272. doi: 10.1093/jb/mvh135. [DOI] [PubMed] [Google Scholar]
- Schaber J, Baltanas R, Bush A, Klipp E, Colman-Lerner A. Modelling reveals novel roles of two parallel signalling pathways and homeostatic feedbacks in yeast. Mol Syst Biol. 2012;8:622. doi: 10.1038/msb.2012.53. [DOI] [PMC free article] [PubMed] [Google Scholar]
- Schuller C, Brewster JL, Alexander MR, Gustin MC, Ruis H. The HOG pathway controls osmotic regulation of transcription via the stress response element (STRE) of the Saccharomyces cerevisiae CTT1 gene. EMBO J. 1994;13:4382–4389. doi: 10.1002/j.1460-2075.1994.tb06758.x. [DOI] [PMC free article] [PubMed] [Google Scholar]
- Sprague GF., Jr Control of MAP kinase signaling specificity or how not to go HOG wild. Genes Dev. 1998;12:2817–2820. doi: 10.1101/gad.12.18.2817. [DOI] [PubMed] [Google Scholar]
- Struhl K. Helix-turn-helix, zinc-finger, and leucine-zipper motifs for eukaryotic transcriptional regulatory proteins. Trends Biochem Sci. 1989;14:137–140. doi: 10.1016/0968-0004(89)90145-X. [DOI] [PubMed] [Google Scholar]
- Treisman R. Regulation of transcription by MAP kinase cascades. Curr Opin Cell Biol. 1996;8:205–215. doi: 10.1016/s0955-0674(96)80067-6. [DOI] [PubMed] [Google Scholar]
- van Riggelen J, Yetil A, Felsher DW. MYC as a regulator of ribosome biogenesis and protein synthesis. Nat Rev Cancer. 2010;10:301–309. doi: 10.1038/nrc2819. [DOI] [PubMed] [Google Scholar]
- Westfall PJ, Ballon DR, Thorner J. When the stress of your environment makes you go HOG wild. Science. 2004;306:1511–1512. doi: 10.1126/science.1104879. [DOI] [PubMed] [Google Scholar]
- Westfall PJ, Patterson JC, Chen RE, Thorner J. Stress resistance and signal fidelity independent of nuclear MAPK function. Proc Natl Acad Sci USA. 2008;105:12212–12217. doi: 10.1073/pnas.0805797105. [DOI] [PMC free article] [PubMed] [Google Scholar]
- Yaakov G, Bell M, Hohmann S, Engelberg D. Combination of two activating mutations in one HOG1 gene forms hyperactive enzymes that induce growth arrest. Mol Cell Biol. 2003;23:4826–4840. doi: 10.1128/MCB.23.14.4826-4840.2003. [DOI] [PMC free article] [PubMed] [Google Scholar]
- Yamamoto A, Mizukami Y, Sakurai H. Identification of a novel class of target genes and a novel type of binding sequence of heat shock transcription factor in Saccharomyces cerevisiae. J Biol Chem. 2005;280:11911–11919. doi: 10.1074/jbc.M411256200. [DOI] [PubMed] [Google Scholar]


