Abstract.
The combined use of nonlinear optical microscopy and broadband reflectance techniques to assess melanin concentration and distribution thickness in vivo over the full range of Fitzpatrick skin types is presented. Twelve patients were measured using multiphoton microscopy (MPM) and spatial frequency domain spectroscopy (SFDS) on both dorsal forearm and volar arm, which are generally sun-exposed and non-sun-exposed areas, respectively. Both MPM and SFDS measured melanin volume fractions between (skin type I non-sun-exposed) and 20% (skin type VI sun exposed). MPM measured epidermal (anatomical) thickness values , while SFDS measured melanin distribution thickness based on diffuse optical path length. There was a strong correlation between melanin concentration and melanin distribution (epidermal) thickness measurements obtained using the two techniques. While SFDS does not have the ability to match the spatial resolution of MPM, this study demonstrates that melanin content as quantified using SFDS is linearly correlated with epidermal melanin as measured using MPM (). SFDS melanin distribution thickness is correlated to MPM values (). These techniques can be used individually and/or in combination to advance our understanding and guide therapies for pigmentation-related conditions as well as light-based treatments across a full range of skin types.
Keywords: melanin, two-photon excited fluorescence, nonlinear optical microscopy, tissue spectroscopy, spatial frequency domain imaging, optical properties
1. Introduction
Skin, like most biological tissues, is a stratified, well-differentiated structure with compartments of distinct composition and optical properties. Melanin, one of the most abundant chromophores in human skin, appears in different concentration and depth distribution depending on the baseline skin type1 and response to ultraviolet (UV) radiation exposure.2 Both parameters must be investigated in order to understand skin biology as well as help to inform and guide diagnostic and therapeutic procedures.
One of the long-standing challenges in skin imaging is to develop quantitative methods for characterizing anatomy and physiology in different skin structures. Methods, such as confocal reflectance imaging, optical coherence tomography (OCT), and multiphoton microscopy (MPM), provide high-resolution (e.g., ) structural images of skin with optical sectioning capability and limited penetration depth (e.g., ). Unlike these microscopy-based methods, model-based spatial and temporal modulation techniques form quantitative images of tissue absorption and scattering using multiply scattered photons. They take advantage of the fact that tissue is a low-pass filter with frequency-dependent light propagation properties. This enables limited optical sectioning and quantitative measurements of tissue function at low resolution.3
Spatial frequency domain imaging and spectroscopy (SFDI, SFDS) employs structured light patterns (e.g., ) that are projected onto tissue using a spatial light modulator, such as a digital micromirror device (DMD).4–11 The spatial frequency-dependent blurring and attenuation of these patterns is determined by tissue optical properties (absorption, , and scattering, ’, coefficients). Quantitative maps of tissue absorption and scattering properties can be generated using these methods by fitting the measured frequency-dependent reflectance to a mathematical model of light propagation. In addition to the “low pass” filter characteristics of tissue in the spatial frequency domain, there is significant optical frequency dependence to light propagation.12–14 This well-known characteristic of light propagation provides a convenient strategy for varying optical path length and hence penetration depth over a range of fractions of millimeters to several centimeters spanning the visible to near-infrared (NIR) spectrum.
SFDI is typically performed in conjunction with an imaging detector at discrete optical wavelengths in serial measurements. When a spectrometer is used as the detection device, quantitative tissue absorption and scattering spectra can be generated in parallel from specific regions of interest. This approach, first described as spatially modulated quantitative spectroscopy (SMoQS), [herein referred to as spatial frequency domain spectroscopy, (SFDS)], is particularly powerful because it provides broadband absorption and scattering spectra over a wide range of optical penetration depths. This enables additional tissue sectioning control and can potentially provide quantitative measurements of microscopic variations in skin components.15
Previous validation experiments, both of SMoQs and of other spectroscopic imaging techniques that exploit layered models to interpret the optical properties from skin tissue,15–18 have been limited to simulated measurements or artificial tissue simulating constructs. When these depth-dependent spectroscopic models of light transport in tissue are developed, it is important to evaluate the accuracy of these approaches in vivo to ensure that the model and method adequately encompass the physiologically relevant parameter space found in tissue. A significant challenge to this approach is developing noninvasive methods with microscopic-scale resolution that report on identical tissue contrast elements and can independently verify model-based SFDI/SFDS predictions.
In this work, we examine, for the first time, whether the use of two well-established methods for controlling the optical path length in tissue, optical wavelength and spatial frequency modulation, can provide sufficient information content to quantify melanin features in skin. All spatial frequency domain measurements are compared to data obtained from multiphoton microscopy using selective two-photon excited fluorescence (TPEF) of melanin.19,20 Subjects ranged in pigmentation from very light skin to dark skin (Fitzpatrick types I–VI).21 Using the depth-sectioning capabilities of MPM, we were able to demonstrate, in the context of skin tissue, whether a layered model interpretation of SFDS data is capable of linearly correlating in vivo average concentration and distribution of melanin to within and tens of microns, respectively. Our goal is to develop inexpensive, noncontact spectroscopic techniques for characterizing important microscopic skin features in human subjects.
2. Methods
2.1. Study Design
All subjects were treated in strict compliance with the declaration of Helsinki and the U.S. Code of Federal Regulations for the protection of human subjects. The experiments were conducted with the full consent of each subject using a protocol approved by the Internal Review Board (IRB) for human experiments in University of California, Irvine. This investigation was carried out specifically under UCI IRB approved protocol 2008-6307 with the objective of measuring in vivo cutaneous melanin concentration and distribution using both MPM and SFDS. Data were collected from 12 healthy subjects (ages 23–75) ranging from very light skin types to very dark skin types. Skin type was determined by a board certified dermatologist using Fitzpatrick skin-type classification.21 Measurement sites included the dorsal forearm and the upper inner arm. Multiple measurements were taken using each technology at each anatomic site on each subject. Because the dorsal forearm is usually a sun-unprotected site while the upper inner arm is relatively sun-unexposed site, we have chosen these locations for this in vivo experiment with the expectation that with sun-protected sites we will observe less melanin that will be apparent in sun-unprotected sites.
2.2. Multiphoton Microscopy
2.2.1. MPTflex clinical tomograph
The laser-scanning-based clinical multiphoton tomograph, MPTflex (JenLab GmbH, Germany) consists of a compact, turn-key femtosecond laser (MaiTai Ti:Sappire oscillator, sub-100 fs, 80 MHz, tunable 690–1020 nm; Spectra Physics, Mountain View, California), an articulated arm with NIR optics, and a beam scanning module. The system has two photomultiplier tube detectors employed for parallel acquisition of TPEF and second-harmonic generation (SHG) signals. A customized metallic ring taped on the subject’s skin attaches magnetically to the objective holder in the articulated arm, minimizing motion artifacts. The excitation wavelengths used for this study were 790 nm for the acquisition of the cross-sectional () images and 880 nm for the acquisition of the z-stacks of horizontal () images. The z-stacks were obtained by moving the objective in the z direction, thus scanning at different depths in the skin. The TPEF signal was detected over the spectral range of 410–650 nm, while the SHG signal was detected over a narrow spectral bandwidth of 385–405 nm through emission filters placed in the TPEF and SHG detection channels, respectively. The sections were pixel images acquired at . The sections were pixel images acquired at . We used a Zeiss objective (, 1.3 NA, oil immersion) for focusing into the tissue.
We acquired the MPM data using two scanning modalities: (1) scanning with z-stacks generated using en-face images from the stratum corneum to the epidermal–dermal junction (EDJ). The excitation wavelength selected for this acquisition mode was 880 nm in order to maximize the melanin contrast against TPEF signals from other components of the epidermis (keratin, NADH/FAD). This was selected due to the fact that melanin has a broad absorption spectrum (maximum around 300 nm gradually decreasing toward the NIR) and a broad TPEF emission spectrum that peaks around 620–680 nm.19,20 The melanin appears in the MPM images as bright fluorescence spots in the cellular cytoplasm that represents aggregates of melanosomes. We used the data obtained by this scanning modality to measure the melanin distribution as a function of depth and the melanin volume fraction in the epidermis. Optical sections of about at different depths ranging from 0 to about ( steps) were obtained. As the optical section is limited to a small scan field, to improve the overall characterization of the examined skin, we acquired five stacks of images on each site (volar arm and dorsal forearm) for all subjects. (2) scanning which provided cross-sectional, “histology-like” images from the stratum corneum to the superficial dermis. The excitation wavelength selected for this acquisition mode was 790 nm in order to visualize both the epidermal cellular structure and the collagen/elastin fibrillar components of the dermis. We used the data obtained by this scanning modality to measure the epidermal thickness. For each subject, we acquired one cross-sectional image for each site.
2.2.2. MPM data processing
The quantitative parameters provided by the MPM data were: (A) the melanin distribution as a function of depth in the epidermis, (B) the melanin volume fraction in the epidermis, and (C) the epidermal thickness. For measuring the parameters related to melanin content (items A and B), we used the TPEF images acquired as z-stacks in five different locations on each site. The TPEF images of the epidermis in each acquired image stack were processed by using the following procedure: (1) If present in the image, areas containing TPEF signal from keratin in skin folds were cropped out and (2) The TPEF images were converted into binary images using the same threshold for all images. The threshold value of TPEF signal was defined as
| (1) |
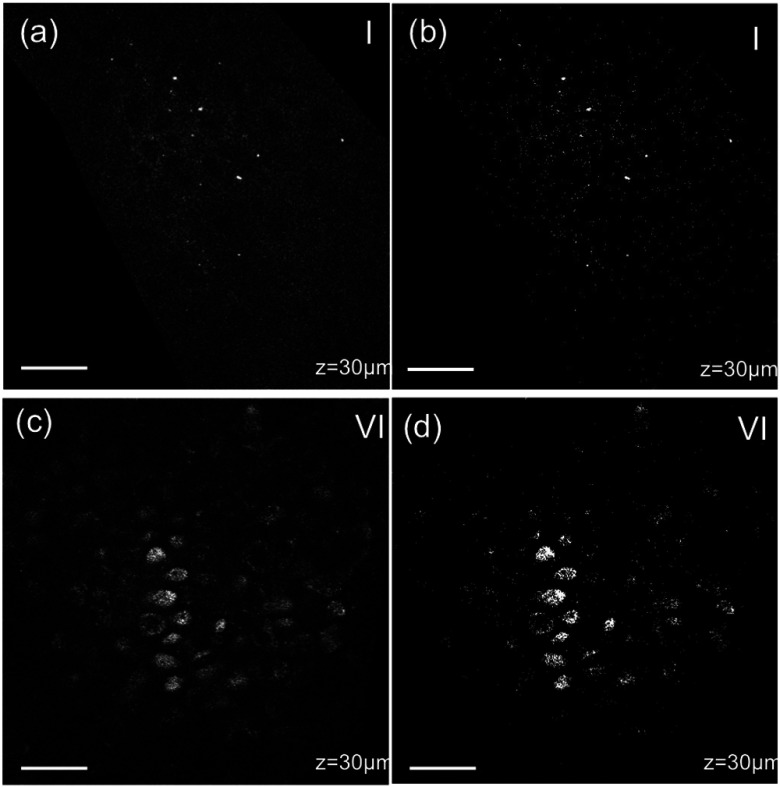
where Mean Fl is the mean intensity of all nonzero pixels in the TPEF image and StDev is the standard deviation of pixel intensity values from the mean. Pixels with intensity values larger than the threshold value were defined as bright pixels and their value set to 1. The rest of the pixels were defined as dark pixels and their value was set to 0. The threshold value was selected as an estimation for separating the pixels corresponding to melanin from the background. Representative TPEF intensity images and corresponding thresholded images are shown in Fig. 1. (3) We defined the density of the bright pixels by the ratio between the number of bright pixels (numerator) and total number of nonzero pixels (denominator) in the TPEF image thresholded by the value of:
| (2) |
Fig. 1.
Multiphoton microscopy (MPM) image processing for estimation of melanin content: (a) raw two-photon excited fluorescence (TPEF) image acquired in the non-sun-exposed site of skin type II, (b) thresholded TPEF image shown in (a), (c) raw TPEF image acquired in the non-sun-exposed site of skin type VI, (d) thresholded TPEF image shown in (c). Scale bar is .
The density of bright pixels was calculated for each image in a z-stack of several consecutive image planes ( step) starting from the top of the epidermis to the basal layer. The density of bright pixels in each TPEF image was calculated by following the procedure described above and represents an estimate of the melanin concentration in the imaged epidermal layer. (4) In order to calculate the distribution of melanin content as a function of depth in the epidermis, we averaged the values of melanin concentration corresponding to a specific depth in each of the five acquired stacks. (5) For calculating the melanin volume fraction in the epidermis, we averaged the melanin volume fraction calculated for each of the five stacks. For each stack, the melanin volume fraction was calculated as
| (3) |
where is the volume occupied by melanin and is the total imaged volume in the stack. The volume occupied by melanin was defined as
| (4) |
where is the area occupied by the bright pixels in each binary image of the stack obtained by using the Th1 threshold, and is the axial point-spread function value. The total imaged volume in a stack was defined as
| (5) |
where is the area occupied by the bright pixels in each binary image of the stack obtained by using the Th2 threshold.
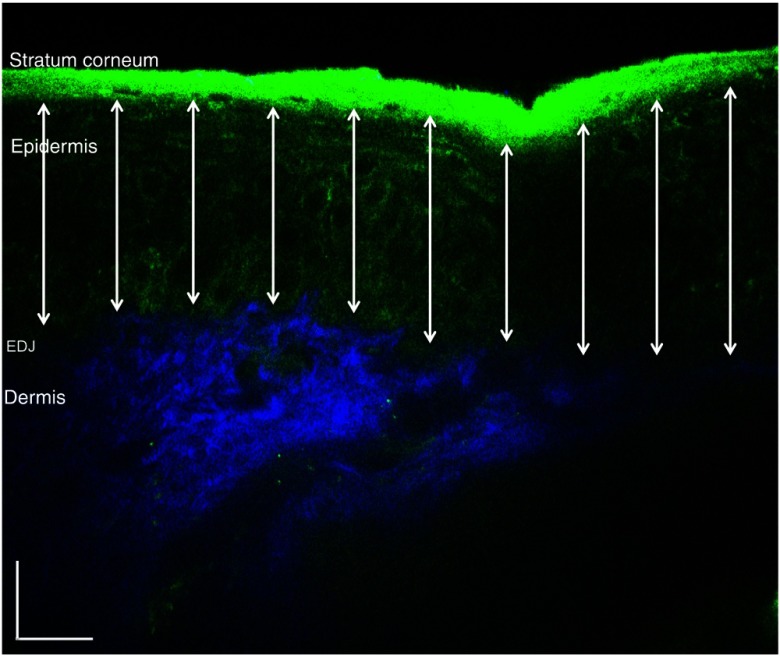
We used the TPEF/SHG cross-sectional images acquired at 790-nm excitation wavelength (Fig. 2) in order to estimate epidermal thickness in order to provide reference points for calculating the melanin volume fraction in the epidermis. The epidermal thickness was measured in 10 different locations starting from the end of the stratum corneum to the start of the EDJ, as shown in Fig. 2. The epidermal thickness reported here, in each case, represents the average of the ten measurements.
Fig. 2.
In vivo MPM cross-sectional image of human skin (xz scan). Merged TPEF (green)/second-harmonic generation (SHG) (blue) cross-sectional image acquired in volar forearm of type II skin. The double-headed arrows show the locations at which the epidermal thickness was measured. The scale bar is .
2.3. Spatial Frequency Domain Spectroscopy
2.3.1. Instrumentation
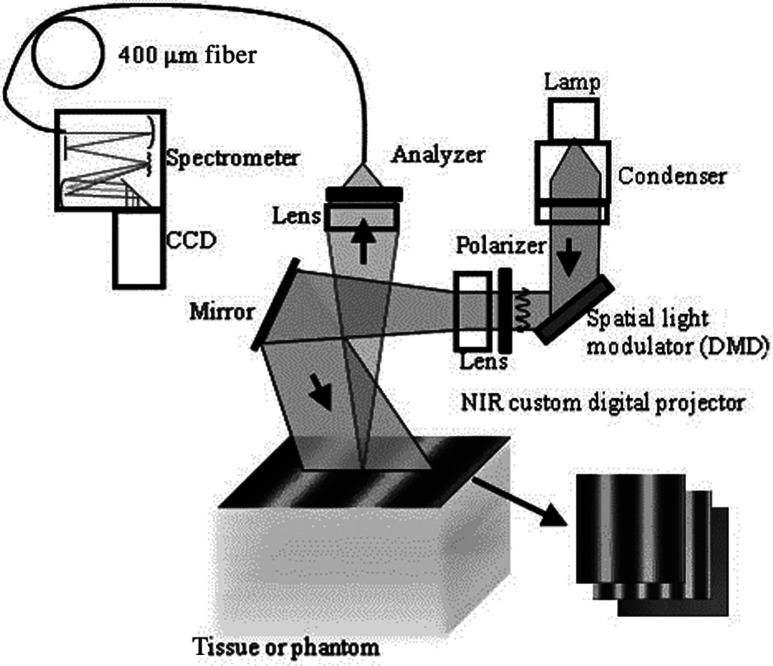
The SFDS instrument (also known as spatially modulated quantitative spectroscopy, SMoQS) that was used in this study was developed at the Beckman Laser Institute (Fig. 3).
Fig. 3.
System diagram for spatially modulated quantitative spectroscopy (SMoQS) instrument used in initial experiments.
A 100 W Quartz-Tungsten-Halogen light source (Moritex, MHF-D100LR) was coupled to a digital micro-mirror device, DMD, (Texas Instruments, Inc.) in order to project structured light patterns with spatial frequencies from 0 to . The projection field of view for this system is . The distal end of a 1-mm core optical fiber (TechSpec, NA 0.39, Thorlabs, Inc.) was imaged at the center of the projection field of view ( magnification) and light collected by this fiber is delivered to a spectrometer (Oriel 77480) enabling measurements over the range 450–1000 nm. Crossed 2-inch diameter wire-grid polarizing filters were used to reject specular reflection from the surface of the sample. The polarizer was inserted between the DMD and projection optics and the analyzer was placed between the fiber and collection optics.
In this study, six evenly spaced spatial frequencies were acquired, ranging from 0 to for a given anatomic location (dorsal forearm and volar upper arm). At each location, three measurements were acquired to ensure measurement consistency, identify any potential motion artifacts during the measurement acquisition, and help to improve the signal to noise. A three-phase demodulation scheme was employed at each spatial frequency, as has been described in the past, to isolate the spatial frequency-dependent reflectance from the skin region of interest from background contributions including those resulting from ambient (room) light illumination. This resulted in a total of 12–18 spectral measurements for each measurement site. Since tissue pigmentation ranged from types I to VI skin, integration time was automatically adjusted (LabView, National Instruments Inc.,) to ensure that the full dynamic range of the 16-bit detector was used for all subjects. Additionally, triplicate data were acquired for each projected pattern to improve the signal-to-noise ratio. With this instrument configuration, acquisition times ranged from 10 to 40 s, depending on the amount of pigmentation in the region of interest.
2.3.2. SFDS data processing
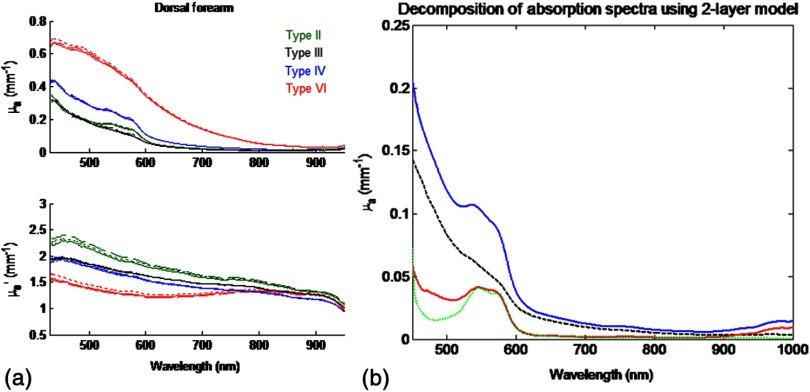
As previously described in greater detail,8 the three phases at each spatial frequency are demodulated and calibrated against a diffuse tissue-simulating phantom of known optical properties to produce diffuse reflectance spectra as a function of spatial frequency. At each wavelength, the reduction in AC reflectance amplitude as a function of spatial frequency can be modeled and analyzed via homogeneous Monte Carlo-based simulations via discrete Hankel transformation of point-source reflectance predictions.8 From this model, the contributions of absorption and scattering can be independently identified at each wavelength, resulting in broadband spectra for absorption and scattering without the use of any spectral constraints or assumed power-law dependence for reduced scattering. As this initial step is based on a homogeneous model, the resulting absorption and scattering spectra should be interpreted as a “measured optical response” from tissue as a function of the total volume interrogated at each wavelength. The contribution of layer-specific absorption and scattering will change as a function of the total penetration depth interrogated, and hence as a function of wavelength. Figure 4(a) shows the example (bulk) absorption and reduced scattering spectra from subjects in this study, representing four different skin type categories. Here, the scattering spectrum for skin type VI no longer follows a simple power-law like dependence. In general, scattering from dermal tissue will be greater than that found in the epidermis, even with a high concentration of melanin.22 The combination of a strong absorption coefficient at visible wavelengths and high melanin concentration dramatically limits the depth penetrance at visible wavelengths. Thus, the measured scattering coefficient in the visible wavelength range is primarily related to the scattering properties of epidermis. The penetration depth increases in the NIR resulting in the increased contribution from the relatively higher scattering dermal tissue. For the example presented in Fig. 4(a), we not only measure the wavelength dependence of scattering from epidermal and dermal tissues, but also the depth-dependent transition between the relative contributions of these scattering regimes (as a function of depth penetrance).
Fig. 4.
(a) Representative bulk absorption (top) and reduced scattering (bottom) coefficient spectra from Fitzpatrick skin types II, III, IV, and VI as measured by spatial frequency domain spectroscopy (SFDS). Spectra are derived from three measurements taken from individual subjects (dorsal forearm) at each of the four skin types. (b) Example of depth-sensitive spectral decomposition of in vivo skin tissue (volar upper arm of a single subject, skin type III). Blue: tissue absorption measured by SFDS; black (dashed line): depth-specific quantification of melanin relative to total volume of tissue interrogated at each wavelength; red: absorption features specific to the dermis and deeper tissue; green (dotted line): least-squares fit for oxy/deoxy hemoglobin. (Residual absorption features between red and green correspond to carotenoids, lipids, and water).
From these quantitative spectra, we can not only determine the bulk concentration of melanin, hemoglobin, water, lipids, and carotenoids in vivo, but also leverage the differential penetration depths of light between the visible and NIR regimes to isolate chomophore concentrations in depth. While the absorption spectra contain distinct features that can be used to separate and quantify these chromophores relative to the total volume of tissue interrogated by light (up to through this specific approach), the combination of the wavelength-specific absorption and scattering provides us with an opportunity to estimate the depth penetrance into tissue of that specific wavelength.23,24 As the penetrance of visible light into tissue is significantly less than that from the NIR, we can leverage the differential volumes and sensitivities to depth-specific chromophores in these spectral regions to quantify melanin volume fraction, average depth distribution and other chromophores found in tissue.15 We have tested this model-based, depth segmented approach in layered tissue simulating phantoms25 and in vivo benign pigmented lesions, correlating the mean depths of pigmentation in vivo to high-frequency ultrasound.26
To obtain depth-specific chromophore concentrations and depth distribution thickness, we used the method described by Saager et al.15 For this study, we used the spectral regions of 450–600 nm and 650–950 nm to represent the visible and NIR spectral regions in the aforementioned method. As this method is based on interpreting measured spectroscopic data in terms of a two-layer model, the outputs of this method are the top layer (optical) thickness (as determined by the absorption signature of melanin, relative to the mean photon path length traveled through the tissue) and the chromophore concentrations specific to the respective layers. In the context of this investigation, we are interested in whether this diffuse optics-based SFDS modality can isolate and assess the top layer properties, namely, layer-specific melanin concentration and melanin layer (mean distribution) thickness that is correlative to microscopy determined results. Figure 4(b) shows an example of this two-layer, depth segmented decomposition of skin absorption from in vivo tissue (skin type III, volar upper arm).
3. Results
3.1. Determination of Melanin Concentration In Vivo
3.1.1. Multiphoton microscopy
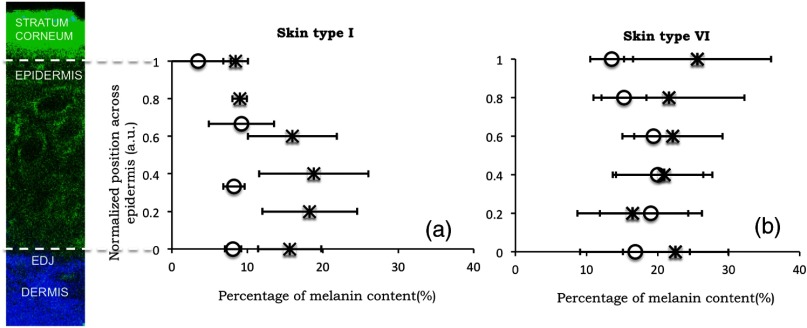
Melanin distribution as a function of depth in the epidermis was measured in TPEF z-stacks from the top of the epidermis to the EDJ. Generally, we measured a higher percentage of melanin in the basal and supra-basal layers ( from the basal layer) compared to the upper epidermal layers ( from the basal layer). Type VI dorsal forearm exhibited a more uniform distribution of melanin as a function of epidermal depth compared to other skin types. Distribution of melanin concentration as a function of depth in the epidermis for skin types I and VI is shown in Fig. 5. The position across the epidermis was normalized to the thickness of the epidermis in order to account for variations in epidermal thickness for different skin locations and different individuals. Therefore, fewer points in the plot representing the percentage of melanin content across epidermal layers in Fig. 5 are an indication of a thinner epidermis.
Fig. 5.
Melanin distribution as a function of depth in the epidermis in skin types I and VI. Percentage of melanin content in layers across epidermis from the basal layer to the top of the epidermis for volar arm (circle) and dorsal forearm (asterisk) corresponding to skin type I (a) and skin type VI (b). Data represent the average of the melanin content in layers of five different stacks acquired for the same site. The error bars represent standard deviation of the five measurements. The position across the epidermis was normalized to the thickness of the epidermis.
There is a higher percentage of melanin content regardless of depth and a more uniform melanin distribution as a function of depth in type VI dorsal forearm compared to type I skin. These effects are due to differences in melanosome biology; dark (type VI) skin is characterized by intact melanosomes that are not degraded by lysosomal enzymes in the upper epidermal layers (stratum spinosum and granulosum).27 In contrast, light skin melanosomes are degraded and only persist in the upper layers as “melanin dust.”27
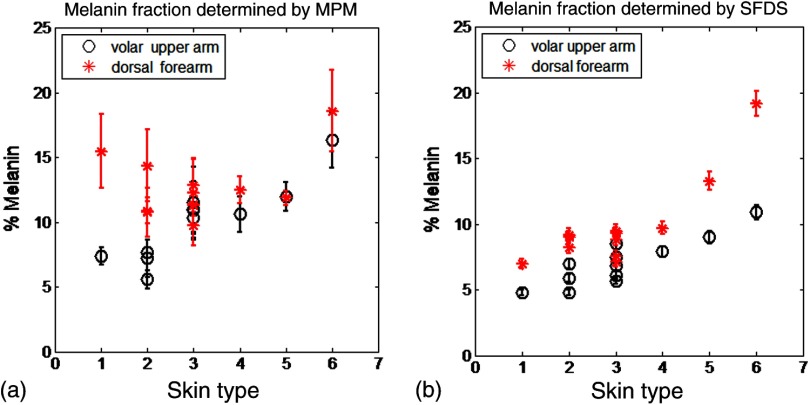
The melanin volume fraction estimated from the MPM data for different skin types is shown in Fig. 6(a).
Fig. 6.
Melanin volume fraction estimated from MPM and SFDS data. (a) Melanin volume fraction as function of skin type, corresponding to volar upper arm (circle) and dorsal forearm (asterisk) as determined by MPM. Data represent the average of the melanin volume fraction calculated for five stacks acquired for the same site (volar or dorsal) in each of the 12 patients. The error bars represent standard deviation of the five measurements. (b) Average melanin concentration determined by SFDS. Red (asterisks) are estimates from the dorsal forearm as a function of assessed skin type, black (circles) are estimates from the volar upper arm. The error bars represent an estimated model error from SFDS layered decomposition.
For the volar arm, an area generally not exposed to the sun, melanin volume fraction increases with skin type and exhibits an overall change of from types I to VI. However, dorsal forearm melanin volume fraction was not correlated with the skin type. This is due to the fact that the melanin content in the dorsal forearm, which typically has significant sun exposure, is also related to factors such as frequency and duration of sun exposure, the presence of freckles with increased melanin content,28 and the sun protection routine for each individual. Figure 6(a) shows that the dorsal forearms of skin types I and II are particularly susceptible to this effect.
3.1.2. Spatial frequency domain spectroscopy
Figure 6(b) shows that higher melanin concentration is also detected using SFDS for the dorsal forearm relative to the volar upper arm for each subject. For the presentation of these data, we assumed a 5% error based on our initial validation work of the empirical model used to isolate layer-specific chromophore concentrations.15 Although the Fitzpatrick skin type scale is not a direct representation of skin pigmentation, but rather a subjective, scaled assessment of skin response to sun exposure, there was a general trend of increasing detected melanin concentration with increasing skin type. A factor of -fold increase was observed comparing volar types I to VI, while -fold higher % melanin values were obtained comparing dorsal types I to VI. These relative ranges of increase are in agreement with other quantification methods of melanin across skin types and sun-exposed skin regions.29–33 Unlike the melanin volume fraction measured by MPM in the dorsal forearm in skin types I and II, SFDS reported a general increase in melanin content as a function of skin type. The key distinction between these imaging modalities in this particular case is the volume of interrogation. Discussed in more detail in Sec. 4, SFDS interrogates -fold larger volume than MPM. In this case, it spatially averages heterogeneous pigmentation common in sun-exposed areas of skin for these skin types.
3.2. Melanin Distribution Thickness
3.2.1. Multiphoton microscopy
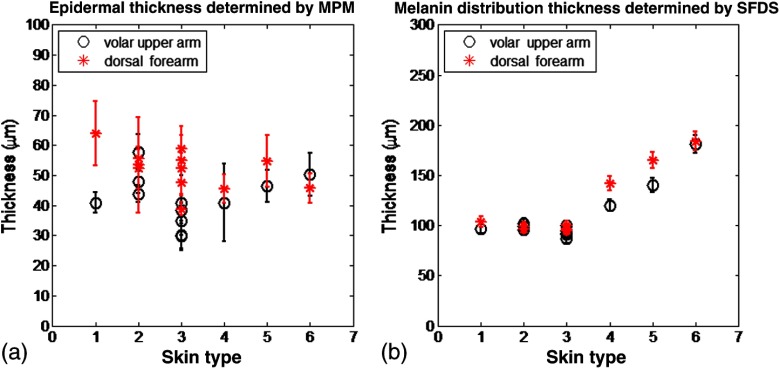
The epidermal thickness measured for different skin types is shown in Fig. 7(a).
Fig. 7.
Epidermal and melanin distribution thickness estimated from MPM and SFDS data, respectively. (a) Epidermal thickness as a function of skin type corresponding to volar arm (circle) and dorsal forearm (asterisk) as determined by MPM. Data represent the average of the epidermal thickness calculated in 10 different locations across the MPM images acquired as xz scans as shown in Fig. 2. The error bars represent standard deviation of the 10 measurements. (b) Melanin distribution thickness as determined by SFDS. Red (asterisk) refers to the dorsal forearm and black (circle) the volar upper arm. Note that the thickness values presented are in terms of optical path length and not actual anatomic thickness. Each data point represents a measurement corresponding to each of the 12 patients, acquired from the volar upper arm and dorsal forearm. The error bars represent an estimated model error from SFDS layered decomposition.
MPM measurements showed no correlation between epidermal thickness and skin type. However, we measured a significant difference in the overall epidermal thickness of volar versus dorsal arm ( versus , respectively, ).
3.2.2. Spatial frequency domain spectroscopy
Similarly, Fig. 7(b) shows that the melanin distribution thickness was greater for the dorsal forearm that for the volar upper arm. This has been suggested by other literature for two general reasons: (1) epidermal thickness can vary in skin based on anatomical location;34 namely, the epidermal thickness of the dorsal forearm has been reported to be thicker, on average, than that in the volar upper arm. As with the determination of layer-specific melanin concentration, we also assumed a 5% error for distribution thickness based on our initial validation work of the empirical model used to isolate layer-specific chromophore concentrations.15
It is worth noting that for more heavily pigmented skin (IV-VI), there is an observed correlation between pigmentation and estimated melanin distribution thickness that was not evident in the MPM measurements. We discuss this outcome in Sec. 4.
3.3. Correlation of Results Between Multiphoton Microscopy and SFDS
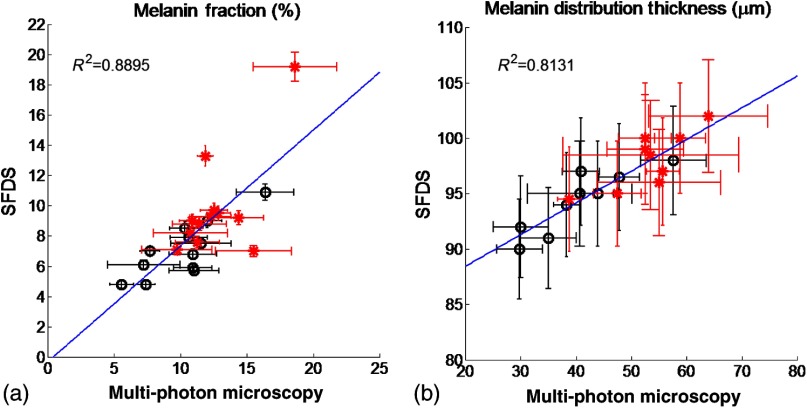
Figure 8 shows the correlation between SFDS and MPM for dorsal and volar forearms in estimates of (A) % melanin and (B) melanin distribution thickness. Data are shown for all patients and measurement sites. The MPM–SFDI correlation is slightly better for determining % melanin content () versus melanin distribution thickness (). This is likely due to the fact that MPM provides direct visualization of layer thickness, while SFDS utilizes multiple scattered light and model-based analysis to obtain a similar number. This is likely due to a difference in the mechanisms that each technology employs in order to access sources of optical contrast. MPM provides direct melanin visualization of layer thickness, while SFDS utilizes multiple scattered light and model-based analysis to access melanin contrast. In this case, SFDS reports the optical path length within each layer. Distances reported by SFDS will be longer than those reported by MPM since photon paths that are recorded by SFDS will travel a more tortuous path through the epidermis.
Fig. 8.
Correlation of mean (a) melanin concentration () and (b) melanin distribution thickness () between MPM and SFDS. Here the mean, site-specific [i.e., volar upper arm (black-circle) and dorsal forearm (red-asterisk)] results from each subject are plotted between each modality, independent of any skin type assessment. The error bars represent the variance within the measurement volume along the MPM axis and the estimated model error along the SFDS axis.
4. Discussion
In this work we examine, for the first time, how two optical methods that probe different spatial scales can be used to quantify microscopic melanin features in skin. SFDS measurements are compared to label-free, MPM images of melanin fluorescence. The two modalities were used to measure, in vivo: (1) melanin volume fraction and (2) epidermal and melanin distribution thickness in human skin. In addition, MPM was able to determine melanin distribution as a function of depth in the assessed skin types.
Both MPM and SFDS measured melanin volume fraction values that ranged between (skin type I non-sun-exposed) and 20% (skin type VI sun exposed). MPM measured epidermal (anatomical) thickness values between and , while SFDS measured melanin distribution (optical) thickness values that ranged between and for both sun-exposed and non-sun-exposed tissue locations. Although there was a strong agreement between melanin concentration and melanin distribution (epidermal) thickness values measured by the two techniques ( and 0.8131, respectively), the sources of contrast, resolution limits and fields of view differ between these approaches. The implications and potential measurement errors/biases derived from these differences are discussed below in the context of the determination of melanin concentration and melanin distribution thickness.
The values corresponding to melanin volume fraction measured by the two modalities were comparable and followed a similar trend for the non-sun-exposed area (volar upper arm), as shown in Fig. (6). However, for the sun-exposed area (dorsal forearm) melanin volume fraction values measured by MPM did not correlate with the skin type and did not follow a similar trend with the values measured by SFDS. For the sun-exposed area (dorsal forearm), the values of melanin volume fraction for skin types I and II measured by MPM were higher compared to the values measured by SFDS. While Sec. 3.1.1 includes some explanation for the relatively elevated melanin concentration in lighter skin types observed by MPM, there are other differences between these modalities that may bias this concentration determination that are worthy of further discussion. Although MPM and SFDS both measure the optical properties of tissue, the spatial scale that each technique accesses differs somewhat between the two approaches. Thus, the specific manner in which melanin contrast manifests is different between the two techniques. For example, MPM quantifies the concentration and distribution of melanin by recording high-resolution three-dimensional images of melanin TPEF. Although selective wavelength excitation and background suppression minimize contributions from other fluorophores, these effects could impact the accuracy of our estimates. Additionally, fluorescence re-absorption by melanin in highly pigmented skin might lead to underestimates by MPM.
In contrast, the concentration and volume fraction of melanin determined using SFDS employs the melanin extinction coefficient spectrum reported by Jacques and McAuliffe35 This extinction coefficient spectrum is simply reported as that of melanin. In fact, melanin in tissue typically contains contributions from both pheomelanin and eumelanin, which may vary slightly in concentration in relation to one another on both an intersubject and intrasubject basis. The pure forms of these melanin sub-types differ from one another in terms of spectral shape (most notably in the visible), thus the measured SFDS spectrum is likely to differ slightly from the melanin chromophore spectrum.36
A second major difference in these methods is that MPM determines melanin volume fraction over a smaller volume than that interrogated by SFDS. The fields of view used by MPM in this study span . Given that the thicknesses over which melanin is distributed are , MPM uses only a volume of to estimate volume fraction. As shown in Fig. 1, distributions of melanin over this field of view can be quite heterogeneous, particularly in the cases of skin type I where freckling may be present. SFDS, by comparison, collects light from tissue over a large spot size in diameter. This results in an estimated volume of interrogation of at least around where the melanin is distributed. SFDS measurements, therefore, have -fold greater volume averaging of melanin concentration from tissue.
Despite the potential sources of error and measurement bias from each optical modality, the linear fit of melanin concentration of all skin types and locations describes a line that nearly has a slope of 1 (0.8) and an intercept near zero () [Fig. 8(a)]. This indicates that there is a underestimation of melanin by SFDS relative to the values calculated by MPM. We believe this is consistent with the fact that the total volume of the melanin layer is defined by each modality in a slightly different way. SFDS uses a two-layer model that assumes a homogeneous distribution within the segmented tissue layer, while MPM only considers the volume where melanin exists within the tissue. In this case, MPM defines a slightly smaller volume () and hence reports a commensurately higher melanin concentration.
Regarding the epidermal and melanin distribution thickness, for more heavily pigmented skin (IV-VI), there was an observed correlation between pigmentation and estimated melanin distribution thickness in the SFDS data that were not evident in the MPM measurements (Fig. 7). Additionally, the depths obtained using SFDS were approximately 2–3 times larger than those measured using MPM. These differences stem from how thickness is defined in the spectroscopic layered model. Determination of melanin distribution thickness in the current spectroscopic method is based on optical path length estimators rather than anatomic thickness. In this case, the distances reported here reflect the mean distance photons travel through each region of tissue. Because of multiple light scattering, this is a tortuous path rather than just a straight line.
This effect is enhanced due to the fact that melanin has a significant scattering cross section due to its packaging in high-index, micron-dimension melanosomes. Therefore, the “optical thickness” would not only be a greater distance than just a straight line through tissue, but it would also significantly increase in the presence of: (1) an increase in melanin concentration and (2) an increased volume of melanin distribution. As shown by our MPM results, both of these conditions are present in the darker skin types. Here, melanin will significantly increase epidermal light scattering, and hence increase the effective path length described by light transport models.
Apart from the differences discussed above that mainly stem from the two modalities probing different spatial scales, there was a strong correlation between the results measured by the two techniques (Fig. 8). These data suggest that SFDS data are capable of correlating, in vivo, the average concentration and distribution of melanin to within and tens of microns, respectively. Data also show the potential of the two techniques to be used individually and/or in combination to assess the concentration and distribution/depth of melanin in human skin. The ability to quantify these parameters across spatial scales can play a critical role in advancing our understanding of the distribution and organization of melanin in tissue, specifically in the case of noninvasively measuring its progression into dermal tissue, as well as guide and inform therapies.
While there are spatial scales where quantitative optical information from both MPM and SFDS overlap, they are complementary technologies. MPM provides subcellular resolution and structural detail. In addition to quantifying the volume fraction and depth resolved distribution of melanin, MPM can visualize and quantify many other properties, such as cellular structure and organization, collagen, elastin, keratin, and so on. MPM is, however, limited in penetration depth to a few hundred microns beneath the surface and has a small field of view.
SFDS may have relatively limited spatial resolution; however, it can image and report functional information (hemoglobin, lipids, water, and so on.) from deeper tissues, such as the dermis and subcutaneous fat, in addition to characterizing and isolating the effects of melanin. Macroscale spectroscopic techniques may never match all of the spatial and depth sectioning capabilities of microscopy, but they typically hold a few distinct advantages in terms of clinical translation and use: (1) wide field imaging, (2) acquisition speed, and (3) cost. As a wide-field imaging approach, SFDS is an inherently scalable modality in terms of field of view. In its current implementation, it is a single point spectroscopy instrument, but this approach has the capability to scale its field of view through multiplexing the detection channel or multispectral imaging through the use of discrete spectral wavelengths at the source.
5. Conclusions
We have, for the first time, demonstrated the correlation between in vivo cutaneous melanin as measured microscopically using MPM and macroscopically using SFDS. MPM provides detailed structural images at the cellular level to the upper dermis; SFDS can provide quantitative layer-averaged content from the epidermis and dermis up to depths of . Measurements were made using both techniques across a broad range of skin pigmentation. Despite significant differences in sampling volume and depth between the two methods, statistical correlations (0.8895 for melanin concentration, 0.8131 for thickness distribution) demonstrate that the data collected by these two modalities intersect at a spatial scale relevant to the structure of skin. Because SFDS offers wide fields of view and enhanced tissue penetration depth, our results suggest that spectroscopic approaches could be rapidly and effectively translated to the clinic as low-cost noninvasive screening tools to independently assess melanin concentration and invasiveness.
Acknowledgments
We acknowledge support from NIH: P41EB015890 (Laser Microbeam Medical Program, LAMMP), R42GM077713, R21EB014440, and UL1 TR000153; as well as Unilever, Inc. and the Beckman Foundation. We also thank JenLab, GmbH for loan of the MPTflex clinical tomograph. The content is solely the responsibility of the authors and does not necessarily represent the official views of the NIH. BJT and AJD are co-inventors of SFDI technology described in this paper, the patents for which are owned by the regents of the University of California. Some of these patents have been licensed to private companies; including Modulated Imaging, Inc. BJT and AJD are co-founders of Modulated Imaging, Inc.
Biography
Biographies of the authors are not available.
References
- 1.Thong H. Y., et al. , “The patterns of melanosome distribution in keratinocytes of human skin as one determining factor of skin colour,” Br. J. Dermatol. 149(3), 498–505 (2003). 10.1046/j.1365-2133.2003.05473.x [DOI] [PubMed] [Google Scholar]
- 2.Nielsen K. P., et al. , “The importance of the depth distribution of melanin in skin for DNA protection and other photobiological processes,” J. Photochem. Photobiol. B 82(3), 194–198 (2006). 10.1016/j.jphotobiol.2005.11.008 [DOI] [PubMed] [Google Scholar]
- 3.O’Sullivan T. D., et al. , “Diffuse optical imaging using spatially and temporally modulated light,” J. Biomed. Opt. 17(7), 071311 (2012). 10.1117/1.JBO.17.7.071311 [DOI] [PMC free article] [PubMed] [Google Scholar]
- 4.Nadeau K. P., et al. , “Quantitative assessment of renal arterial occlusion in a porcine model using spatial frequency domain imaging,” Opt. Lett. 38(18), 3566–3599 (2013). 10.1364/OL.38.003566 [DOI] [PMC free article] [PubMed] [Google Scholar]
- 5.Lin A. J., et al. , “Visible spatial frequency domain imaging with a digital light microprojector,” J. Biomed. Opt. 18(9), 096007 (2013). 10.1117/1.JBO.18.9.096007 [DOI] [PMC free article] [PubMed] [Google Scholar]
- 6.Laughney A. M., et al. , “Spectral discrimination of breast pathologies in situ using spatial frequency domain imaging,” Breast Cancer Res. 15(4), R61 (2013). 10.1186/bcr3455 [DOI] [PMC free article] [PubMed] [Google Scholar]
- 7.Weber J. R., et al. , “Multispectral imaging of tissue absorption and scattering using spatial frequency domain imaging and a computed-tomography imaging spectrometer,” J. Biomed. Opt. 16(1), 011015 (2011). 10.1117/1.3528628 [DOI] [PMC free article] [PubMed] [Google Scholar]
- 8.Cuccia D. J., et al. , “Quantitation and mapping of tissue optical properties using modulated imaging,” J. Biomed. Opt. 14(2), 024012 (2009). 10.1117/1.3088140 [DOI] [PMC free article] [PubMed] [Google Scholar]
- 9.Saager R. B., Cuccia D. J., Durkin A. J., “Determination of optical properties of turbid media spanning visible and near-infrared regimes via spatially modulated quantitative spectroscopy,” J. Biomed. Opt. 15(1), 017012 (2010). 10.1117/1.3299322 [DOI] [PMC free article] [PubMed] [Google Scholar]
- 10.Wilson R. H., et al. , “Quantitative short-wave infrared multispectral imaging of in vivo tissue optical properties,” J. Biomed. Opt. 19(8), 086011 (2014). 10.1117/1.JBO.19.8.086011 [DOI] [PMC free article] [PubMed] [Google Scholar]
- 11.Saager R. B., et al. , “A light emitting diode (LED) based spatial frequency domain imaging system for optimization of photodynamic therapy of nonmelanoma skin cancer: quantitative reflectance imaging,” Lasers Surg. Med. 45(4), 207–215 (2013). 10.1002/lsm.v45.4 [DOI] [PMC free article] [PubMed] [Google Scholar]
- 12.Konecky S. D., et al. , “Quantitative optical tomography of sub-surface heterogeneities using spatially modulated structured light,” Opt. Express 17(17), 14780–14790 (2009). 10.1364/OE.17.014780 [DOI] [PMC free article] [PubMed] [Google Scholar]
- 13.Konecky S. D., et al. , “Spatial frequency domain tomography of protoporphyrin IX fluorescence in preclinical glioma models,” J. Biomed. Opt. 17(5), 056008 (2012). 10.1117/1.JBO.17.5.056008 [DOI] [PMC free article] [PubMed] [Google Scholar]
- 14.Mazhar A., et al. , “Structured illumination enhances resolution and contrast in thick tissue fluorescence imaging,” J. Biomed. Opt. 15(1), 010506 (2010). 10.1117/1.3299321 [DOI] [PMC free article] [PubMed] [Google Scholar]
- 15.Saager R. B., et al. , “Method for depth-resolved quantitation of optical properties in layered media using spatially modulated quantitative spectroscopy,” J. Biomed. Opt. 16(7), 077002 (2011). 10.1117/1.3597621 [DOI] [PMC free article] [PubMed] [Google Scholar]
- 16.Yudovsky D., Nguyen J. Q., Durkin A. J., “In vivo spatial frequency domain spectroscopy of two layer media,” J. Biomed. Opt. 17(10), 107006 (2012). 10.1117/1.JBO.17.10.107006 [DOI] [PMC free article] [PubMed] [Google Scholar]
- 17.Naglic P., et al. , “Applicability of diffusion approximation in analysis of diffuse reflectance spectra from healthy human skin,” Proc. SPIE 9032, 90320N (2013). 10.1117/12.2044706 [DOI] [Google Scholar]
- 18.Fredriksson I., Larsson M., Stromberg T., “Inverse Monte Carlo method in a multilayered tissue model for diffuse reflectance spectroscopy,” J. Biomed. Opt. 17(4), 047004 (2012). 10.1117/1.JBO.17.4.047004 [DOI] [PubMed] [Google Scholar]
- 19.Krasieva T. B., et al. , “Two-photon excited fluorescence lifetime imaging and spectroscopy of melanins in vitro and in vivo,” J. Biomed. Opt. 18(3), 031107 (2013). 10.1117/1.JBO.18.3.031107 [DOI] [PMC free article] [PubMed] [Google Scholar]
- 20.Teuchner K., et al. , “Femtosecond two-photon excited fluorescence of melanin,” Photochem. Photobiol. 70(2), 146–151 (1999). 10.1562/0031-8655(1999)070%3C0146:FTPEFO%3E2.3.CO;2 [DOI] [PubMed] [Google Scholar]
- 21.Fitzpatrick T. B., “The validity and practicality of sun-reactive skin types I through VI,” Arch. Dermatol. 124(6), 869–871 (1988). 10.1001/archderm.1988.01670060015008 [DOI] [PubMed] [Google Scholar]
- 22.Marchesini R., et al. , “Optical properties of in vitro epidermis and their possible relationship with optical properties of in vivo skin,” J. Photochem. Photobiol. B 16(2), 127–140 (1992). 10.1016/1011-1344(92)80004-F [DOI] [PubMed] [Google Scholar]
- 23.Carp S. A., Prahl S. A., Venugopalan V., “Radiative transport in the delta-P1 approximation: accuracy of fluence rate and optical penetration depth predictions in turbid semi-infinite media,” J. Biomed. Opt. 9(3), 632–647 (2004). 10.1117/1.1695412 [DOI] [PubMed] [Google Scholar]
- 24.Jacques S. L., “Simple theory, measurements, and rules of thumb for dosimetry during photodynamic therapy,” Proc. SPIE 1065, 100–108 (1989). 10.1117/12.978009 [DOI] [Google Scholar]
- 25.Saager R. B., et al. , “Multi-layer silicone phantoms for the evaluation of quantitative optical techniques in skin imaging,” Proc. SPIE 7567, 756706 (2010). 10.1117/12.842249 [DOI] [Google Scholar]
- 26.Saager R. B., et al. , “Development of spatial frequency domain instrument for the quantification of layer specific optical properties of pigmented lesions,” in Proc. Biomedical Optics and 3-D Imaging, Optical Society of America, Miami, Florida: (2012). [Google Scholar]
- 27.Brenner M., Hearing V. J., “The protective role of melanin against UV damage in human skin,” Photochem. Photobiol. 84(3), 539–549 (2008). 10.1111/php.2008.84.issue-3 [DOI] [PMC free article] [PubMed] [Google Scholar]
- 28.Ortonne J. P., “Pigmentary changes of the ageing skin,” Br. J. Dermatol. 122(Suppl 35), 21–28 (1990). 10.1111/bjd.1990.122.issue-s35 [DOI] [PubMed] [Google Scholar]
- 29.Alaluf S., et al. , “Ethnic variation in melanin content and composition in photoexposed and photoprotected human skin,” Pigment Cell Res. 15(2), 112–118 (2002). 10.1111/pcr.2002.15.issue-2 [DOI] [PubMed] [Google Scholar]
- 30.Kaur C. D., Saraf S., “Skin care assessment on the basis of skin hydration, melanin, erythema and sebum at various body sites,” Int. J. Pharm. Pharm. Sci. 3(4), 209–213 (2011). [Google Scholar]
- 31.Matts P. J., Dykes P. J., Marks R., “The distribution of melanin in skin determined in vivo,” Br. J. Dermatol. 156(4), 620–628 (2007). 10.1111/bjd.2007.156.issue-4 [DOI] [PubMed] [Google Scholar]
- 32.Dwyer T., et al. , “Cutaneous melanin density of Caucasians measured by spectrophotometry and risk of malignant melanoma, basal cell carcinoma, and squamous cell carcinoma of the skin,” Am. J. Epidemiol. 155(7), 614–621 (2002). 10.1093/aje/155.7.614 [DOI] [PubMed] [Google Scholar]
- 33.Tadokoro T., et al. , “Mechanisms of skin tanning in different racial/ethnic groups in response to ultraviolet radiation,” J. Invest. Dermatol. 124(6), 1326–1332 (2005). 10.1111/jid.2005.124.issue-6 [DOI] [PubMed] [Google Scholar]
- 34.Whitton J. T., Everall J. D., “The thickness of the epidermis,” Br. J. Dermatol. 89(5), 467–476 (1973). 10.1111/bjd.1973.89.issue-5 [DOI] [PubMed] [Google Scholar]
- 35.Jacques S. L., McAuliffe D. J., “The melanosome: threshold temperature for explosive vaporization and internal absorption coefficient during pulsed laser irradiation,” Photochem. Photobiol. 53(6), 769–775 (1991). 10.1111/php.1991.53.issue-6 [DOI] [PubMed] [Google Scholar]
- 36.Sarna T., Swartz H. A., Eds., The Physical Properties of Melanins. The Pigmentary System: Physiology and Pathophysiology, 2nd ed., pp. 311–341, Blackwell Publishing Ltd, Oxford, UK: (1998). [Google Scholar]


