

Abstract
BACKGROUND: Quantification of disease-associated proteins in the cerebrospinal fluid (CSF) has been critical for the study and treatment of several neurodegenerative disorders; however, mutant huntingtin protein (mHTT), the cause of Huntington’s disease (HD), is at very low levels in CSF and, to our knowledge, has never been measured previously.
METHODS: We developed an ultrasensitive single-molecule counting (SMC) mHTT immunoassay that was used to quantify mHTT levels in CSF samples from individuals bearing the HD mutation and from control individuals in 2 independent cohorts.
RESULTS: This SMC mHTT immunoassay demonstrated high specificity for mHTT, high sensitivity with a femtomolar detection threshold, and a broad dynamic range. Analysis of the CSF samples showed that mHTT was undetectable in CSF from all controls but quantifiable in nearly all mutation carriers. The mHTT concentration in CSF was approximately 3-fold higher in patients with manifest HD than in premanifest mutation carriers. Moreover, mHTT levels increased as the disease progressed and were associated with 5-year onset probability. The mHTT concentration independently predicted cognitive and motor dysfunction. Furthermore, the level of mHTT was associated with the concentrations of tau and neurofilament light chain in the CSF, suggesting a neuronal origin for the detected mHTT.
CONCLUSIONS: We have demonstrated that mHTT can be quantified in CSF from HD patients using the described SMC mHTT immunoassay. Moreover, the level of mHTT detected is associated with proximity to disease onset and diminished cognitive and motor function. The ability to quantify CSF mHTT will facilitate the study of HD, and mHTT quantification could potentially serve as a biomarker for the development and testing of experimental mHTT-lowering therapies for HD.
TRIAL REGISTRATION: Not applicable.
FUNDING: CHDI Foundation Inc.; Medical Research Council (MRC) UK; National Institutes for Health Research (NIHR); Rosetrees Trust; Swedish Research Council; and Knut and Alice Wallenberg Foundation.
Introduction
Unlike other common neurodegenerative conditions like Alzheimer’s disease (AD) and Parkinson’s disease (PD), which are characterized by protein misfolding and aggregation, the cause of Huntington’s disease (HD) is known with certainty: a CAG-repeat expansion in the HTT gene encoding huntingtin (HTT) protein (1). Mutant huntingtin (mHTT) contains an expanded polyglutamine tract and causes neuronal dysfunction and death, producing the progressive and ultimately fatal combination of behavioral, cognitive, and motor symptoms that characterize HD (2, 3). There is currently no treatment that alters the progression of HD, but numerous approaches are now entering the clinic, including strategies to decrease production or enhance clearance of mHTT (4).
Because of its complete penetrance, a genetic test can reliably identify those individuals destined to develop HD. However, despite an association between the length of the CAG repeat and age at onset, the clinical course of HD can be variable and unpredictable and is partly determined by unknown genetic and environmental factors (5). Some of these likely relate to structural or functional properties of mHTT or its cleaved and posttranslationally modified species (3). mHTT has been extensively studied in model systems, but in humans its study is limited to indirect methods such as measurement of brain atrophy or the examination of postmortem tissue.
Quantification of disease-associated proteins in human cerebrospinal fluid (CSF) is increasingly valuable for diagnosis, monitoring disease progression, and assessing treatment response in neurodegenerative diseases including AD, PD, and amyotrophic lateral sclerosis (ALS) (6–9). Despite its ubiquitous expression, mHTT has never been detected in human CSF, most likely due to its predominantly intracellular localization, resulting in very low concentrations in the CSF. Nevertheless, since mHTT is the known cause of HD neuropathology, its study in an accessible CNS compartment, such as CSF, will be highly informative. The ability to quantify mHTT in CSF would have immediate potential as a pharmacodynamic biomarker in therapeutic trials of HTT-lowering treatments, and, if independently capable of predicting phenotypic features, CSF mHTT could serve as a useful biomarker of HD progression.
We previously described an assay that quantifies soluble mHTT in peripheral blood leukocytes and showed that mHTT concentration levels were associated with disease progression and brain atrophy rates, but this assay was insufficiently sensitive to detect the protein in patient plasma or CSF (10). Here, we report what we believe to be a novel femtomolar-sensitive, single-molecule counting (SMC) immunoassay for soluble mHTT and its use to quantify mHTT in CSF from 2 cohorts of control volunteers and HD mutation carriers.
Results
SMC immunoassay quantifies mHTT sensitively, specifically, and reproducibly.
First, we used the SMC immunoassay to detect purified recombinant human HTT N548 proteins with polyglutamine lengths in the mutant (46Q) and WT (19Q) ranges. We found marked selectivity for mutant HTT over WT HTT (Figure 1, A and B). This specificity is conferred by the MW1 anti-HTT polyQ antibody, as previously demonstrated in other assay platforms (11, 12). The 2B7 antibody, meanwhile, binds the N-terminal 17 amino acids of mutant and WT HTT (13). A low femtomolar detection threshold and broad dynamic range were shown with recombinant N548 46Q mHTT (Figure 1C). High selectivity of the assay for HTT over other proteins was demonstrated by an approximate 80% drop in signal after immunodepletion by the anti-HTT antibody 4C9 (Supplemental Figure 1B; supplemental material available online with this article; doi:10.1172/JCI80743DS1).
Figure 1. The mHTT SMC immunoassay is specific and sensitive.

(A) Schematic of mHTT (not to scale) indicating the epitopes bound by the 2B7 and MW1 antibodies used for the assay. 2B7 binds residues 1–17 of the N terminus (11), while MW1 conveys specificity for the mutant protein by binding preferentially to the expanded polyglutamine tract (13). (B) Detection of purified recombinant HTT proteins with the SMC immunoassay shows specificity for mutant (mHTT) over WT human HTT protein. (C) Determination of the assay’s LLoQ and ULoQ shows a low femtomolar detection threshold and broad dynamic range.
Using artificial and human CSF from control participants and HD mutation carriers spiked with recombinant HTT proteins, we found good mHTT signal recovery rates (91%–114%) across the whole quantifiable range of the assay. This indicates the capacity of the assay to quantify precisely known amounts of reference analyte in real samples and that the experimental conditions control satisfactorily for any potential CSF matrix effects (generally caused by heterophilic antibodies, proteolytic activity, or nonspecific antibody binding; Supplemental Figure 1, C and D).
mHTT is detected in mutation carrier, but not control participant, CSF.
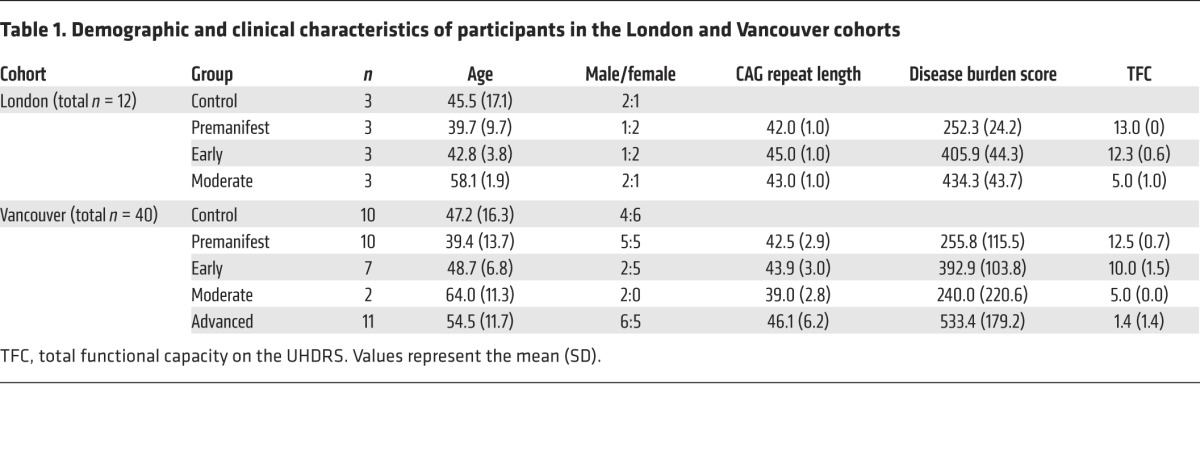
Next, we used the assay to quantify mHTT in CSF and plasma from 2 independent cohorts (London, n = 12 and Vancouver, n = 40; Table 1). The Vancouver cohort spanned a wider range of participants than did the London cohort, including those with advanced disease. There were no significant differences in age, sex, or CAG repeat length between the cohorts.
Table 1. Demographic and clinical characteristics of participants in the London and Vancouver cohorts.
We were able to detect mHTT protein in the CSF samples: mHTT was present in the CSF of almost all HTT mutation carriers, but not in that of control volunteers (Figure 2). In the London cohort, we were able to detect mHTT in the CSF of all 9 mutation carriers (mean ± SD 182.5 ± 106.3 fM; P = 0.00455), but not in the CSF of any of the 3 controls (Figure 2A). The odds ratio (OR) for the presence of mHTT in mutation carriers versus controls was incalculably high, with a lower 95% confidence bound of 33.1. In the Vancouver cohort, we detected CSF mHTT in 26 of 28 HTT mutation carriers (289.1 ± 194.6 fM, P = 7.79 × 10⁻⁸; Figure 2B), but not in any of the 10 controls; the OR for detecting mHTT in mutation carriers was again incalculably high (lower 95% confidence bound of 14.8).
Figure 2. mHTT is detectable in CSF from HTT mutation carriers but not from control participants in 2 populations.

(A) London population (n = 12) and (B) Vancouver population (n = 30). CSF mHTT concentration was significantly elevated in manifest HD subjects compared with that in premanifest HD subjects in both populations. Horizontal bars indicate the group means. Data were calculated by weighted-least-squares ANOVA.
There was no statistically significant effect of age or sex on CSF mHTT concentrations in either cohort. mHTT concentrations were somewhat higher in the Vancouver cohort (216.9 ± 33.3 fM) than in the London cohort (136.8 ± 35.4 fM), but this was not statistically significant (P = 0.217). The Vancouver cohort contained subjects with more advanced disease than did the London cohort. There was no significant difference in mean CSF hemoglobin concentrations between the London and Vancouver cohorts (P = 0.63), suggesting no major differences in CSF quality.
CSF mHTT concentration is higher in manifest than in premanifest HD participants.
CSF mHTT concentrations were significantly higher in participants with manifest HD (239.2 ± 166.8 fM) than in premanifest mutation carriers (69.0 ± 4.6 fM) in the London cohort (P = 0.0035; Figure 2A). This was reproduced in the Vancouver cohort, in which the mean HTT concentration was 365.0 ± 177.6 fM in manifest HD participants compared with 137.4 ± 130.4 fM in premanifest HD participants (P = 0.0006; Figure 2B).
CSF mHTT concentration is higher at later disease stages.
To evaluate whether mHTT levels change over the course of HD, we examined its association with pathological disease burden score, a function of age and CAG repeat length that predicts many features of HD onset and progression (14, 15). CSF mHTT concentrations were significantly positively associated with the disease burden score among HTT mutation carriers in the London cohort (R = 0.909, P = 0.0007; Figure 3A). This was replicated in the Vancouver cohort, albeit with a lower correlation coefficient (R = 0.695, P = 0.0001; Figure 3B).
Figure 3. CSF mHTT concentration correlates significantly with disease stage.

mHTT concentration was positively associated with the disease burden score in both (A) London (n = 9) and (B) Vancouver (n = 30) cohorts. Significant positive associations were also seen with (C) 5-year conditional onset probability in premanifest participants (n = 13) and (D) in UHDRS motor scores (n = 39). Data were calculated by linear regression analysis.
To investigate whether the level of mHTT increases as disease onset approaches in premanifest mutation carriers, we examined its association with 5-year conditional onset probability — an age- and CAG-based estimation of a premanifest individual’s proximity to clinical onset (16) — and found a significant positive association (R = 0.661, P = 0.0139; Figure 3C). Notably, the 2 HD participants with CSF mHTT levels below the limit of detection were among those premanifest mutation carriers furthest from the predicted onset (5-year onset probability of 0.003 and 0.04).
CSF mHTT concentration independently predicts clinical features of HD.
Next, we examined whether CSF mHTT levels have the ability to predict clinical parameters in HD, beyond the known predictive power of CAG repeat length and age. We found a statistically significant positive association between CSF mHTT concentration and the Unified Huntington’s Disease Rating Scale (UHDRS) motor score (R = 0.629, P < 0.0001; Figure 3D). This association remained significant after controlling for disease burden score (R = 0.516, P = 0.0167).
Notably, significant negative associations were also found between CSF mHTT concentration and performance on 4 of 4 cognitive tasks assessed in the Vancouver participants: symbol-digit modality test (R = –0.565, P = 0.0062); Stroop color matching (R = –0.620, P = 0.0012); Stroop word matching (R = –0.612, P = 0.0015); and Stroop interference (R = –0.505, P = 0.012; Supplemental Table 1). All but the Stroop interference score remained statistically significant after controlling for disease burden score. FDR values (q values), calculated to account for multiple comparisons, were less than 0.05 for all the raw associations between mHTT and cognitive scores, as well as for the disease burden–controlled associations of mHTT with Stroop color and word matching.
These findings indicate that CSF mHTT concentration has independent predictive value for these clinical features of HD, beyond the known predictive ability of age and CAG repeat length.
CSF mHTT concentrations are associated with those of neuronal markers.
To explore the origin and significance of the mHTT detected in CSF, we examined the CSF concentrations of the neuronal proteins tau and neurofilament light chain (NFL) in the same samples. We found a significant positive linear association between CSF mHTT concentration and CSF tau concentration (R = 0.791, P = 0.0111; Figure 4A) in the London cohort. This was reproduced in the Vancouver cohort (R = 0.577, P = 0.0008; Figure 4B).
Figure 4. CSF concentrations of mHTT and of the neuronal proteins tau and NFL are significantly associated.

Significant positive linear associations were seen between CSF concentrations of mHTT and tau in (A) London (n = 9) and (B) Vancouver (n = 30) cohorts. A strikingly close association was seen between CSF mHTT concentration and NFL concentration in the (C) London (n = 9) and (D) Vancouver (n = 20) cohorts. Data were calculated by linear regression analysis.
A significant association between the CSF concentrations of mHTT and NFL was also seen in the London cohort (R = 0.886, P = 0.0015; Figure 4C); this was replicated with high significance in the Vancouver cohort (R = 0.919, P < 0.0001; Figure 4D).
Unlike mHTT concentration, tau and NFL concentrations were not significantly associated with cognitive scores after controlling for disease burden (Supplemental Table 1), with the solitary exception of NFL and Stroop color matching (R = –0.626, P = 0.022), an association that did not survive FDR correction. We note, however, that other NFL cognition correlation estimates were of a magnitude similar to that of the mHTT correlations, though the available sample of NFL measures was smaller.
There was no significant positive or negative association between the CSF concentrations of mHTT and hemoglobin in either cohort (P = 0.125 for London; P = 0.945 for Vancouver; Supplemental Figure 2A), nor between those of mHTT and total protein (P = 0.835 for London; P = 0.844 for Vancouver; Supplemental Figure 2B).
mHTT was detected in plasma from all mutation carriers (Supplemental Figure 2C). However, there was no significant association between CSF and paired plasma mHTT concentrations in the entire dataset (r = 0.454, 95% bootstrap CI –0.145 to 0.740, P ≈ 0.14) or after the removal of 2 participants with extreme values for both measures (r = –0.074, P = 0.670; Supplemental Figure 2D).
Discussion
We report here, for the first time to our knowledge, the first successful quantification of mHTT in human CSF, obtained from 2 independent cohorts; mHTT was not detected in control volunteer CSF, but was reliably quantifiable at femtomolar sensitivity in CSF from almost all mutation carriers. Moreover, we report what we believe to be the first direct evidence that higher mHTT load is associated with lower cognitive function and more severe motor dysfunction in patients. That these clinical associations remain present after controlling for disease burden score suggests that CSF mHTT may have substantial additional independent value as a biomarker for HD. To our knowledge, this is the first time a biochemical marker has shown the ability to independently predict such phenotypic features of HD.
Further, mHTT concentration in CSF has other associations of potential clinical relevance: it is significantly associated with onset probability in premanifest HD and disease burden score in all mutation carriers, and the mean mHTT concentration is approximately 3-fold higher in manifest than in premanifest HD. Given that mHTT causes HD, its quantification in CSF could potentially be a molecular biomarker of disease progression, with possible value for the design and conduct of clinical trials, and a window into the natural history of the disease.
CSF mHTT levels were not associated with age, sex, CSF hemoglobin or total protein concentration, or plasma mHTT concentration, implying that our findings are not artifacts of demographics, blood contamination, or transfer of mHTT from peripheral blood into the CSF. That CSF mHTT was not associated with total protein concentration suggests that a general protein increase in HD does not explain our CSF mHTT findings.
The CSF mHTT concentrations seen in the Vancouver cohort were somewhat higher than in the London cohort, but this difference was not statistically significant. The Vancouver cohort contained subjects with advanced disease (who also had higher mHTT concentrations), as well as more premanifest subjects closer to predicted disease onset. Furthermore, in contrast to the London samples, the Vancouver CSF samples were also not standardized for diet or time of day. The possible effects of diet, time of day, sample handling, and other factors on CSF mHTT concentration are currently under investigation and may be minimized in the future by standardization of collection and processing procedures.
Several findings point to the CNS as the origin of the mHTT protein detected by this assay in the CSF of participants. We found very strong linear correlations between the concentration of CSF mHTT and the concentrations of tau and NFL, both of which are expressed almost exclusively in neurons and are associated with various forms of neurodegeneration (6, 8, 9).
Our SMC immunoassay uses an optimized antibody combination with high specificity for polyglutamine-expanded HTT, allied with a platform that enhances the signal-to-noise ratio through incubation with antibody-coated paramagnetic microparticles, followed by laser interrogation in a capillary flow cell to detect individual analyte molecules. SMC immunoassays have high sensitivity and dynamic ranges that are orders of magnitude above those of conventional immunoassays (17).
As emphasized above, the association between CSF mHTT concentration and motor and cognitive scores survived statistical correction for disease burden score. The same did not hold true for tau protein, which implies the specificity of mHTT among CSF protein markers of neuropathology as a biomarker with an independent capacity to predict clinically relevant features of the disease. This, of course, is in keeping with the known etiological role of the protein. Our NFL findings in a relatively small sample subset identify this protein as a potential HD biomarker, and we continue to investigate this possibility (18).
The mechanism underlying the increasing mHTT concentrations warrants further study. Crucially, the 2B7 and MW1 antibodies bind distinct domains of the N terminus of mHTT (Figure 1A), which contains the polyglutamine expansion thought to be central to the neurodegeneration of HD (19, 20). Our SMC immunoassay will therefore detect any soluble mHTT species containing the 2B7 and MW1 epitopes, namely residues 1–17 and the polyglutamine repeat. Thus, it will detect full-length mHTT protein, exon 1 fragments, as well as other fragments of mHTT that contain the N terminus, but it will not detect any species that lacks the N terminus or an expanded polyglutamine tract. We cannot exclude the possibility of a contribution from other mHTT species such as mHTT oligomers or aggregates. Nonetheless, our assay represents the first opportunity to study mHTT protein biology in vivo in the patient’s CNS and will empower future studies to characterize mHTT species in CSF and their role in HD pathobiology. We are developing complementary CSF assays for total HTT and its cleaved fragments to understand which HTT species are associated with neurodegeneration or neuroprotection.
We observed that the CSF mHTT concentration increases with disease progression. We previously reported a similar phenomenon in peripheral leukocytes and demonstrated the presence of N-terminal mHTT fragments in these cells, suggesting that progressive accumulation of N-terminal mHTT fragments could underlie the increase (10). N-terminal fragments are known to accumulate in neurons as part of the neuropathology in animal models (21), and it could be that this accumulation leads to increased cell death, elevating mHTT concentration in the CSF as the disease progresses. The linear associations with tau and NFL concentrations suggest that mHTT may be an indicator of overall dysfunction and/or death of mHTT-containing cells.
The specificity of our assay for mutant over WT HTT protein comes from the polyglutamine-binding MW1 antibody epitope. By definition, this introduces some tendency for longer polyglutamine tracts to generate a higher signal. However, we previously demonstrated the use of an allelic series of purified mHTT proteins (10) and show again here (Figure 1) that mHTT concentration, rather than polyglutamine length, is the overwhelming contributor to the binding of this antibody in the polyglutamine range seen in 93% of patients (16).
Somatic mosaicism for the HTT CAG repeat length has been observed in human postmortem brain, though it is not clear whether such expansion is a driver of region-selective neuronal death, or indeed when it arises during the course of the disease (22–24). One might hypothesize that an increasing polyglutamine count may contribute to the increasing mHTT signal with progressing disease. However, the above-noted primary dependence of the assay on mHTT concentration rather than on polyglutamine count suggests that a rising mHTT concentration is likely the main driver of the increasing signal observed. Nonetheless, the possibility of a contribution from somatic instability warrants further study.
The present work demonstrates the relationship between CSF mHTT and disease progression, as evaluated by cross-sectional examination of participants across the disease spectrum. To establish whether CSF mHTT is a useful biomarker of HD onset and progression, the crucial next step will be to exploit this assay to study CSF mHTT and its relationship to clinical progression longitudinally in patients.
In other neurodegenerative conditions, CSF quantification of disease-associated CNS proteins now has direct clinical utility in guiding clinical decision making around diagnosis. SMC assays have also been used to detect low-abundance protein species of interest in AD (25–27). While a genetic test can predict who will develop HD, the diagnosis of motor onset is currently a clinical one. Once better understood, CSF mHTT levels may come to have a role, alongside other biomarkers, in supporting clinical decision making in HD, especially if disease-modifying therapeutic agents become available.
Finally, therapeutic approaches for HD that aim to lower mHTT protein production at the DNA/RNA level or enhance mHTT clearance from cells are now being tested in clinical trials (4). The ability to quantify soluble mHTT directly in an accessible CNS tissue will very likely be of considerable value as a pharmacodynamic biomarker in such trials. The assay we describe here has the potential to support the clinical development of these and other therapeutic agents for HD.
Methods
Participant recruitment.
HTT mutation carriers were identified by genetic testing and clinical stage determined using the UHDRS, as previously described (28).
Sample collection and processing.
A dedicated CSF collection from 12 participants (London cohort) was carried out using procedures designed to optimize the detection of mHTT. Samples were collected between 9:00 am and 10:00 am after fasting from midnight (water was permitted). After injection of up to 5 ml 2% lidocaine (Mercury Pharmaceuticals Inc.), 15–20 ml CSF was collected by lumbar puncture using atraumatic needles (catalog 5181.27; Vygon) and placed immediately onto ice at the bedside. Collection vessels and plasticware throughout the processing chain were of polypropylene material to minimize protein adsorption (29). All processing was performed without delay and on ice. CSF was centrifuged at 2,000 g for 10 minutes to remove cells, divided into aliquots, frozen immediately at –80°C, and analyzed within 4 months.
A second CSF sample set (Vancouver cohort), used for replication, was collected between 2004 and 2009. CSF was obtained from 40 participants using similar methods (30), but sampling time and plasticware were not standardized, and samples were processed at room temperature. These samples were divided into aliquots and stored at –80°C.
Blood samples were obtained within 30 minutes of CSF sampling in sodium heparin cell preparation tubes in London (catalog 362753; BD) or EDTA tubes in Vancouver (catalog 367863; BD), and plasma was isolated by centrifugation according to the manufacturer’s instructions.
Antibodies.
MW1 antibody specifically against the polyglutamine domain of HTT was developed by Paul Patterson (13). The anti-HTT antibody 2B7 recognizes the first 17 amino acids of the human HTT protein, and its generation and characterization were described previously (11). Labeling of the antibodies for application in the CSF detection assay was performed with Singulex Capture and Detection Labeling kits (catalogs 03-0077 and 03-0076; Singulex) according to the manufacturer’s instructions.
Recombinant purified HTT protein.
Recombinant human proteins containing the N-terminal sequence of HTT with 548 amino acids (N548) and polyglutamine repeats of different lengths were generated as previously described (31). In short, recombinant human GST-HTT proteins were expressed in E. coli BL-21 (catalog C2530H; New England BioLabs) and enriched using Glutathione Sepharose 4B Beads (catalog 17-0756-01; GE Healthcare). HTT proteins were then cleaved and further purified from the GST tags using PreScission Protease (catalog 27-0843-01; GE Healthcare). The HTT proteins were stored in PBS at pH 7.2 with 1% Tween-20 at –80°C until further use. Purity was assessed by Coomassie blue SDS page gel (catalogs 20278 and NW04120BOX; Life Technologies) (Supplemental Figure 1A).
SMC immunoassay for mutant HTT protein quantification in CSF and plasma.
Dilution buffer (50 μl/well) containing 6% BSA, 0.8% Triton X-100, 750 mM NaCl, and complete protease inhibitor (catalog 04693116001; Roche); 15 μl per well artificial CSF (supplemented with 10% Tween-20 and complete protease inhibitor); and 135 μl/well human sample (native CSF; plasma prediluted 1:3 in dilution buffer) were added to a 96-conical assay plate (catalog P-96-450V-C; Axygen). 2B7 antibody (100 μl/well) diluted to 1:400 with Erenna Assay Buffer (catalog 02-0474-00; Singulex) coupled with magnetic particles (catalog 03-0077-02; Singulex) at a ratio of 25 μg antibody per milligram magnetic particles was added, and the plate was sealed and incubated under shaking (600 rpm; Heidolph Titramax 1000 Microplate Shaker) at room temperature for 1 hour. The plate was placed on a magnetic rack and washed 4 times with 200 μl 1× washing buffer (catalog 02-0111-00; Singulex). Washing buffer was removed, and 20 μl/well of 0.5 ng/μl diluted MW1 detection antibody labeled with detection fluorophore (catalog 03-0076-02; Singulex) at a ratio of 15.7 pmol fluorophore per micrgram MW1 was added to the plate. The plate was sealed and incubated under shaking (750 rpm) at room temperature for 1 hour. Plates were washed, and the antibody-antigen complex was transferred to a new 96-conical assay plate to eliminate nonspecific binding events to the plastic. After 4 washes with 200 μl 1× washing buffer and aspiration, elution buffer (acidic glycine solution, 0.1 M, pH 2.7) was added to the plate, and the plate was incubated under shaking (1,000 rpm) for 5 minutes. The eluted detection antibody was transferred to a Nunc 384-well analysis plate (catalog 264573; Sigma-Aldrich) and neutralized with neutralization buffer (Tris, 1 M, pH 9). The analysis plate was spun down to eliminate foaming and bubble formation, sealed, and subsequently analyzed with the Erenna Immunoassay System (Singulex).
All assays were performed by operators blinded to the clinical state of the participant.
Quantification of other proteins.
Hemoglobin quantification was performed with the Human Hemoglobin ELISA Kit (catalog E88-135; Bethyl Laboratories) according to the manufacturer’s instructions. Tau quantification was performed with the V-PLEX Plus Human Total Tau Kit (catalog K151LAE; Meso Scale Diagnostics) according to the manufacturer’s instructions. Total protein quantification was performed with the Pierce BCA Protein Assay Kit (catalog 23225; Life Technologies) according to the manufacturer’s instructions. NFL was quantified using an ELISA kit (UmanDiagnostics) according to the manufacturer’s instructions. Femtomolar concentrations were estimated using canonical molar masses obtained from the UniProt database (32, 33).
Statistics.
Analysis was performed with SAS, version 9.4 (SAS Inc.), StatXact, version 8, and R, version 3.1.1 (library boot). Statistical significance was defined by a P value of less than 0.05. Upper and lower limits of quantification (ULoQ and LLoQ, respectively) were defined as the lowest and highest concentrations of the analyte in CSF that could be quantitatively determined with acceptable precision and accuracy. Suitability of data distribution for parametric statistical analysis was verified using Q-Q plots. Potentially confounding demographic variables (age, sex) were examined in preliminary analyses. Unless otherwise noted, these were not significant confounders and were excluded from the final analyses. Differences between sites were examined using the 2-tailed Student’s t test with equal or unequal variances as determined by a P = 0.15 threshold on folded F tests. Detection of mHTT in mutation carriers versus controls was examined using Fischer’s exact test. Differences in mHTT levels between groups of mutation carriers were examined using weighted least-squares ANOVA (via PROC MIXED), with weighting based on different group-specific residual variances. Linear regression was used to examine the relationship between mHTT and disease burden, onset probability, NFL, tau, and clinical scores. There was non-normality in the distributions of plasma mHTT and CSF hemoglobin measurements. Group comparisons of these variables were therefore based on the Wilcoxon test. For plasma mHTT correlations, we report the Pearson’s correlation with BCA bootstrap CIs. For CSF hemoglobin, some measurements were outside the quantifiable range, and some others were detectable but outside the linear range. We therefore tested CSF hemoglobin correlations using the Spearman’s rank test. Multiple comparisons were addressed via FDRs within conceptually related groups (34).
Study approval.
All work involving human volunteers was performed in accordance with the Declaration of Helsinki and approved by the Central London Research Ethics Committee and the University of British Columbia Clinical Research Ethics Board. All participants provided written informed consent.
Supplementary Material
Acknowledgments
We thank Robert Pacifici, Ignacio Muñoz-Sanjuan, Beth Borowsky, and Simon Noble for their helpful discussions and scientific input; Ulrike Träger for her technical advice and support; Peter McColgan for his support with sample collection; Cristina Cariulo, Lara Petricca, and Maria Carolina Spiezia for their technical contributions; and the late Paul Patterson for the supply of MW1 antibody. This work was principally funded by the CHDI Foundation Inc., a privately funded nonprofit biomedical research organization exclusively dedicated to discovering and developing therapeutics that slow the progression of HD. E.J. Wild’s work is funded by the Medical Research Council UK (MR/M008592/1); the NIHR; the Academy of Medical Sciences; the European Huntington’s Disease Network (EHDN/SF/0478); the CHDI Foundation; and GSK Inc. S.J. Tabrizi receives grant funding from the EU FP7 Health Call; the Medical Research Council UK (MR/L012936/1 and MR/J003832/1); the CHDI Foundation; the Wellcome Trust; the UK Huntington’s Disease Association; the Dementia and Neurodegenerative Disease Network UK; the European Huntington’s Disease Network; the UCL/UCLH Biomedical Research Centre; and the Biotechnology and Biological Sciences Research Council (BBSRC). J.R.C. Miller is jointly funded by the MRC and Rosetrees Trust. H. Zetterberg received funding from the Swedish Research Council and the Knut and Alice Wallenberg Foundation. This work was supported in part by the NIHR UCL Hospitals Biomedical Research Centre and the UCL Leonard Wolfson Experimental Neurology Centre.
Roberto Boggio’s present address is: Merck Serono at RBM S.p.A. Istituto di Ricerche Biomediche A. Marxer, Via Ribes 1, 10010 Colleretto Giacosa (TO), Italy.
Rainer Kuhn and Andreas Weiss’s present address is: Evotec AG, Manfred Eigen Campus, Hamburg, Germany.
Conflict of interest: D. Macdonald is employed by CHDI Management Inc., which provides advisory services to the CHDI Foundation. E.J. Wild has been on the advisory boards of or has consulted for Shire Pharmaceuticals and Isis Pharmaceuticals Inc. S.J. Tabrizi has been on advisory boards of or consulted for Siena Biotech, Simon-Kucher & Partners, Roche, Takeda Pharmaceuticals International, Novartis, Sanofi-Aventis, The Wellcome Trust, Isis Pharmaceuticals Inc., GSK Inc., Shire, and TEVA Pharmaceutical Industries. R. Kuhn is an employee of Evotec International. He has been on the advisory boards of or consulted for CHDI Management Inc., IRBM Promidis SRL, Novartis Venture Fund, Satter Investment Management, Piqur Therapeutics AG, and the NCL Foundation.
Reference information:J Clin Invest. 2015;125(5):1979–1986. doi:10.1172/JCI80743.
References
- 1.The Huntington’s Disease Collaborative Research Group A novel gene containing a trinucleotide repeat that is expanded and unstable on Huntington’s disease chromosomes. Cell. 1993;72(6):971–983. doi: 10.1016/0092-8674(93)90585-E. [DOI] [PubMed] [Google Scholar]
- 2.Ross CA, et al. Huntington disease: natural history, biomarkers and prospects for therapeutics. Nat Rev Neurol. 2014;10(4):204–216. doi: 10.1038/nrneurol.2014.24. [DOI] [PubMed] [Google Scholar]
- 3.Ross CA, Tabrizi SJ. Huntington’s disease: from molecular pathogenesis to clinical treatment. Lancet Neurol. 2011;10(1):83–98. doi: 10.1016/S1474-4422(10)70245-3. [DOI] [PubMed] [Google Scholar]
- 4.Wild EJ, Tabrizi SJ. Targets for future clinical trials in Huntington’s disease: what’s in the pipeline? Mov Disord. 2014;29(11):1434–1445. doi: 10.1002/mds.26007. [DOI] [PMC free article] [PubMed] [Google Scholar]
- 5.Wexler NS, et al. Venezuelan kindreds reveal that genetic and environmental factors modulate Huntington’s disease age of onset. Proc Natl Acad Sci U S A. 2004;101(10):3498–3503. doi: 10.1073/pnas.0308679101. [DOI] [PMC free article] [PubMed] [Google Scholar]
- 6.Shi M, et al. Cerebrospinal fluid biomarkers for Parkinson disease diagnosis and progression. Ann Neurol. 2011;69(3):570–580. doi: 10.1002/ana.22311. [DOI] [PMC free article] [PubMed] [Google Scholar]
- 7.Miller TM, et al. An antisense oligonucleotide against SOD1 delivered intrathecally for patients with SOD1 familial amyotrophic lateral sclerosis: a phase 1, randomised, first-in-man study. Lancet Neurol. 2013;12(5):435–442. doi: 10.1016/S1474-4422(13)70061-9. [DOI] [PMC free article] [PubMed] [Google Scholar]
- 8.Blennow K, Hampel H, Weiner M, Zetterberg H. Cerebrospinal fluid and plasma biomarkers in Alzheimer disease. Nat Rev Neurol. 2010;6(3):131–144. doi: 10.1038/nrneurol.2010.4. [DOI] [PubMed] [Google Scholar]
- 9.Rosengren LE, Karlsson JE, Karlsson JO, Persson LI, Wikkelso C. Patients with amyotrophic lateral sclerosis and other neurodegenerative diseases have increased levels of neurofilament protein in CSF. J Neurochem. 1996;67(5):2013–2018. doi: 10.1046/j.1471-4159.1996.67052013.x. [DOI] [PubMed] [Google Scholar]
- 10.Weiss A, et al. Mutant huntingtin fragmentation in immune cells tracks Huntington’s disease progression. J Clin Invest. 2012;122(10):3731–3736. doi: 10.1172/JCI64565. [DOI] [PMC free article] [PubMed] [Google Scholar]
- 11.Weiss A, et al. Single-step detection of mutant huntingtin in animal and human tissues: a bioassay for Huntington’s disease. Anal Biochem. 2009;395(1):8–15. doi: 10.1016/j.ab.2009.08.001. [DOI] [PubMed] [Google Scholar]
- 12.Macdonald D, et al. Quantification assays for total and polyglutamine-expanded huntingtin proteins. PLoS One. 2014;9(5):e96854. doi: 10.1371/journal.pone.0096854. [DOI] [PMC free article] [PubMed] [Google Scholar]
- 13.Ko J, Ou S, Patterson PH. New anti-huntingtin monoclonal antibodies: implications for huntingtin conformation and its binding proteins. Brain Res Bull. 2001;56(3–4):319–329. doi: 10.1016/s0361-9230(01)00599-8. [DOI] [PubMed] [Google Scholar]
- 14.Penney JB, Jr, Vonsattel JP, MacDonald ME, Gusella JF, Myers RH. CAG repeat number governs the development rate of pathology in Huntington’s disease. Ann Neurol. 1997;41(5):689–692. doi: 10.1002/ana.410410521. [DOI] [PubMed] [Google Scholar]
- 15.Tabrizi SJ, et al. Predictors of phenotypic progression and disease onset in premanifest and early-stage Huntington’s disease in the TRACK-HD study: analysis of 36-month observational data. Lancet Neurol. 2013;12(7):637–649. doi: 10.1016/S1474-4422(13)70088-7. [DOI] [PubMed] [Google Scholar]
- 16.Langbehn DR, Brinkman RR, Falush D, Paulsen JS, Hayden MR. A new model for prediction of the age of onset and penetrance for Huntington’s disease based on CAG length. Clin Genet. 2004;65(4):267–277. doi: 10.1111/j.1399-0004.2004.00241.x. [DOI] [PubMed] [Google Scholar]
- 17.Todd J, et al. Ultrasensitive flow-based immunoassays using single-molecule counting. Clin Chem. 2007;53(11):1990–1995. doi: 10.1373/clinchem.2007.091181. [DOI] [PubMed] [Google Scholar]
- 18.Constantinescu R, Romer M, Oakes D, Rosengren L, Kieburtz K. Levels of the light subunit of neurofilament triplet protein in cerebrospinal fluid in Huntington’s disease. Parkinsonism Relat Disord. 2009;15(3):245–248. doi: 10.1016/j.parkreldis.2008.05.012. [DOI] [PubMed] [Google Scholar]
- 19.DiFiglia M, et al. Aggregation of Huntingtin in neuronal intranuclear inclusions and dystrophic neurites in brain. Science. 1997;277(5334):1990–1993. doi: 10.1126/science.277.5334.1990. [DOI] [PubMed] [Google Scholar]
- 20.Li H, Li S-H, Johnston H, Shelbourne PF, Li X-J. Amino-terminal fragments of mutant huntingtin show selective accumulation in striatal neurons and synaptic toxicity. Nat Genet. 2000;25(4):385–389. doi: 10.1038/78054. [DOI] [PubMed] [Google Scholar]
- 21.Wang C-E, et al. Accumulation of N-terminal mutant huntingtin in mouse and monkey models implicated as a pathogenic mechanism in Huntington’s disease. Hum Mol Genet. 2008;17(17):2738–2751. doi: 10.1093/hmg/ddn175. [DOI] [PMC free article] [PubMed] [Google Scholar]
- 22.Telenius H, et al. Somatic and gonadal mosaicism of the Huntington disease gene CAG repeat in brain and sperm. Nat Genet. 1994;6(4):409–414. doi: 10.1038/ng0494-409. [DOI] [PubMed] [Google Scholar]
- 23.Kennedy L, Shelbourne PF. Dramatic mutation instability in HD mouse striatum: does polyglutamine load contribute to cell-specific vulnerability in Huntington’s disease? Hum Mol Genet. 2000;9(17):2539–2544. doi: 10.1093/hmg/9.17.2539. [DOI] [PubMed] [Google Scholar]
- 24.Kennedy L, et al. Dramatic tissue-specific mutation length increases are an early molecular event in Huntington disease pathogenesis. Hum Mol Genet. 2003;12(24):3359–3367. doi: 10.1093/hmg/ddg352. [DOI] [PubMed] [Google Scholar]
- 25.Savage MJ, et al. A sensitive Aβ oligomer assay discriminates Alzheimer’s and aged control cerebrospinal fluid. J Neurosci. 2014;34(8):2884–2897. doi: 10.1523/JNEUROSCI.1675-13.2014. [DOI] [PMC free article] [PubMed] [Google Scholar]
- 26.Esparza TJ, et al. Amyloid-beta oligomerization in Alzheimer dementia versus high-pathology controls. Ann Neurol. 2013;73(1):104–119. doi: 10.1002/ana.23748. [DOI] [PMC free article] [PubMed] [Google Scholar]
- 27.Jeromin A, Randall J, Wilson D, Blennow K, Zetterberg H. Ultrasensitive detection of neurodegenerative biomarkers in blood with the fully automated Simoa analyzer: clinical applications. Alzheimers Dementia. 2014;10(4, Supplement):P515–P516. [Google Scholar]
- 28.Björkqvist M, et al. A novel pathogenic pathway of immune activation detectable before clinical onset in Huntington’s disease. J Exp Med. 2008;205(8):1869–1877. doi: 10.1084/jem.20080178. [DOI] [PMC free article] [PubMed] [Google Scholar]
- 29.Lewczuk P, et al. Effect of sample collection tubes on cerebrospinal fluid concentrations of tau proteins and amyloid β peptides. Clin Chem. 2006;52(2):332–334. doi: 10.1373/clinchem.2005.058776. [DOI] [PubMed] [Google Scholar]
- 30.Dalrymple A, et al. Proteomic profiling of plasma in Huntington’s disease reveals neuroinflammatory activation and biomarker candidates. J Proteome Res. 2007;6(7):2833–2840. doi: 10.1021/pr0700753. [DOI] [PubMed] [Google Scholar]
- 31.Baldo B, et al. TR-FRET-based duplex immunoassay reveals an inverse correlation of soluble and aggregated mutant huntingtin in huntington’s disease. Chem Biol. 2012;19(2):264–275. doi: 10.1016/j.chembiol.2011.12.020. [DOI] [PubMed] [Google Scholar]
- 32.UniProt: Swiss-Prot Database. P10636 - TAU_HUMAN. UniProt Web site. http://www.uniprot.org/uniprot/P10636 Updated July 9, 2014. Accessed February 27, 2015
- 33.UniProt: Swiss-Prot Database. P07196 - NFL_HUMAN. UniProt Web site. http://www.uniprot.org/uniprot/P07196 Updated January 7, 2015. Accessed February 27, 2015
- 34.Benjamini Y, Hochberg Y. Controlling the false discovery rate: a practical and powerful approach to multiple testing. J R Stat Soc Series B Stat Methodol. 1995;57(1):289–300. [Google Scholar]
Associated Data
This section collects any data citations, data availability statements, or supplementary materials included in this article.