Abstract
Diffuse liver disease is a widespread global healthcare burden, and the abnormal accumulation of lipid and/or iron is common to important disease processes. Developing the improved methods for detecting and quantifying liver lipid and iron is an important clinical need. The inherent risk, invasiveness, and sampling error of liver biopsy have prompted the development of noninvasive imaging methods for lipid and iron assessment. Ultrasonography and computed tomography have the ability to detect diffuse liver disease, but with limited accuracy. The purpose of this review is to describe the current state-of-the-art methods for quantifying liver lipid and iron using magnetic resonance imaging and spectroscopy, including their implementation, benefits, and potential pitfalls. Imaging- and spectroscopy-based methods are naturally suited for lipid and iron quantification. Lipid can be detected and decomposed from the inherent chemical shift between lipid and water signals, whereas iron imparts significant paramagnetic susceptibility to tissue, which accelerates proton relaxation. However, measurements of these biomarkers are confounded by technical and biological effects. Current methods must address these factors to allow a precise correlation between the lipid fraction and iron concentration. Although this correlation becomes increasingly challenging in the presence of combined lipid and iron accumulation, advanced techniques show promise for delineating these quantities through multi-lipid peak analysis, T2 water mapping, and fast single-voxel water-lipid spectroscopy.
For over three decades, magnetic resonance imaging (MRI) has been an invaluable tool for noninvasively diagnosing and monitoring disease progression of the liver. Technological advancements have pushed MRI to new frontiers of medical application that range from the macroscopic functional analysis of organs and flow dynamics to detailing microscopic processes, such as diffusion and metabolic activity. An evolving consensus is establishing MRI as the diagnostic modality for the characterization of focal and diffuse liver disease.
Apart from the qualitative assessment of disease, recent progress includes the development of quantitative methods. Abnormal levels of liver lipid or iron are two important contributors to diffuse liver disease. The presence of lipid within an imaging voxel can be uniquely separated from the more abundant water species due to the very specific resonant frequency offset that is imparted by the main magnetic field. Metabolic iron manifests differently in magnetic resonance (MR) images. The elevated paramagnetic nature of this metal, even in small quantities, imparts an observable disturbance to the local magnetic field of nearby protons. This disturbance exacerbates proton spin dephasing, which accelerates T2 and T2* relaxation.
The focus of this review is to outline the current state-of-the-art methods that are used to quantify liver lipid and iron using MRI. Current quantitative methods, implementation, benefits, and potential pitfalls will be described. Within this framework, it is also important to outline the stages of technology development, from water-fat separation based on two-peak analysis to more complex separations that are based on multi-peak analysis.
This review is divided into two main sections, the present section describing MR methods for liver lipid and iron separately. Another section will focus on the MR quantification challenges that are presented by the combined presence of lipid and iron, which is commonly encountered within the liver. The description of MR methods for these applications will include imaging and spectroscopic approaches.
Clinical importance of noninvasive imaging
The incidence of focal and diffuse diseases that are related to the liver is increasing worldwide (1, 2), which has led to a growing healthcare burden in many countries. Liver abnormalities could initially present without overt patient symptoms, and they could be triggered by viruses, hereditary predisposition, or lifestyle choices. Without treatment, liver disease could progress to the development of more advanced chronic liver disease with cirrhosis and to an increased risk for hepatocellular carcinoma (3, 4). As such, there is an impetus to detect and diagnose disease and to efficiently monitor progression or regression during therapy. Liver lipid accumulation is a primary feature of nonalcoholic fatty liver disease. However, it could also be present in other disorders, such as viral hepatitis and alcoholic- or hereditary-related diseases. Liver iron deposition is common to hereditary diseases that are related to iron overload, including hereditary hemochromatosis, and chronic liver disease (5). Lipid and iron overload can also occur simultaneously. Histological liver specimen analysis is the most direct method for visualizing these elements; however, biopsy intervention is costly and impractical to implement on a routine basis. To this end, MRI is well-suited to routinely detect and quantify various aspects of liver function, including lipid and iron concentration, without intervention or ionizing radiation.
Current non-MR methods
Liver biopsy remains a major method for the assessment of diffuse liver disease, including lipid, iron and fibrosis (6). While biopsy enables a microscopic presentation of the cellular structure of specific tissue, including stains for lipid and iron, sampling is limited to at most approximately 1/50 000th of the liver volume. Therefore, sampling error is potentially a significant source of under- or over-staging of disease. Moreover, histopathologic interpretation is semi-quantitative at best, but it is often qualitative and variable among readers. Given the invasiveness and cost of the procedure, biopsy is not a realistic approach for repeated assessments as a component of routine disease monitoring. There are additional practical limitations as well, including patient resistance to the procedure, especially if they are asymptomatic.
The limitations of biopsy have prompted the development of noninvasive imaging. Conventional ultrasound has been utilized for several decades to assess liver disease. Ultrasound features of steatosis are highly specific in nature, such as a relative hyperechogenicity of the liver compared to the kidney. However, this feature lacks robust quantification over a broad range of diseases, despite the presence of computer-assisted methods (7). Another limitation of ultrasound methods is the reduced diagnostic performance in obese patients due to wave attenuation.
Computed tomography (CT) is another diagnostic tool that is sensitive to hepatic steatosis. Unenhanced CT is capable of acquiring a high-resolution three-dimensional (3D) image of the liver, with quantitative measures of attenuation (Hounsfield units [HU]) that are related to hepatic steatosis. Specifically, there is a highly predictable inverse relationship between HU and hepatic lipid content (8). Typically, healthy livers have a HU of 50–60, while a HU of less than 40 is predictive of hepatic steatosis. Measurement of liver attenuation alone is the strongest predictor of lipid infiltration (9). However, sensitivity and specificity decrease with unenhanced CT when another underlying diffuse liver disease is present, such as iron deposition (8). Because HU increases with iron deposition, the scenario of combined lipid and iron overload tends to mask the quantification of each component. Moreover, CT has not been found to be specific for staging early-stage steatosis. Another limitation of CT is ionizing radiation exposure and the risk of inducing a malignancy. Thus, CT is not amenable for routine follow-up use, which is often important for disease monitoring.
MRI of steatosis and iron deposition
As noted, MRI is inherently sensitive to lipid and iron deposition. This phenomenon has been well-established (10, 11). A key advantage of MRI in this setting is the ability to directly exploit differences in water and lipid resonances. As a result, advanced methods for observing and quantifying lipid and iron have been extensively developed, making MRI a simple, noninvasive method for characterizing specific elements that are related to diffuse liver disease.
Several techniques have been employed to detect lipid and/or iron content in the liver. Specifically, for lipid, techniques have primarily involved that exploit the phase difference between lipid and water resonances using chemical shift methods, such as dual-echo in-phase and opposed-phase imaging (12). Additionally, this resonance difference enables the suppression of an individual metabolite using selectively tuned radiofrequency pulses (13). However, the latter technique has not gained traction as a quantitative technique due to the challenges of implementing efficient frequency-selective radiofrequency pulses, and, more importantly, the lack of an internal reference value for calculating either the lipid or water fraction.
The quantification of iron with MRI originates directly from iron’s para-magnetic effect on neighboring proton spins. This interaction results in an observable change in the local field homogeneity and, hence, accelerated spin dephasing and T2 (and T2*) relaxation. Within a certain threshold, an increasing amount of iron results in a proportional change in the relaxation rate, R2 (1/T2) and R2* (1/T2*), allowing a calibrated relationship to be obtained. Because iron imparts significant local magnetic field disturbance, the relationship with R2 can be complex at high concentrations or even unmeasurable.
It is important to consider lipid and iron concentrations not only individually but also in the setting of combined diseases, when both are present in relevant quantities. This scenario poses a unique challenge in quantitative MR because each metabolite confounds the measurement of the other. For an efficient noninvasive imaging technique to be adopted, it must acquire and quantify the targeted bio-marker quickly, accurately, and simultaneously. This has been the focus of much modern investigation. As will be described, important advances have been made to address many of the confounding effects that are presented by lipid and iron in vivo.
MRI techniques to detect lipid
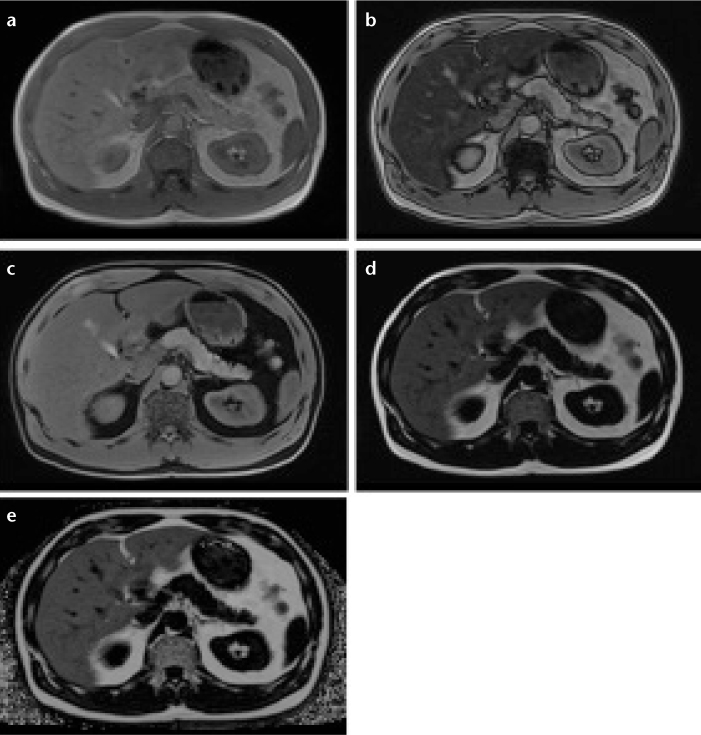
Among the primary biological components of diffuse liver disease, the detection of lipid is significant. The array of current MRI techniques to detect and quantify lipid using chemical separation techniques originates from a seminal investigation that was outlined by Dixon (10), and other subsequent studies that were reported soon thereafter (14, 15). The relevant concept exploits the inherent frequency difference between water and the dominant methylene resonance in lipid (CH2, −220 Hz at 1.5 Tesla [T]), resulting in an observable chemical-shift at particular echo-times (TE) in gradient-echo (GRE) imaging. Within the scenario of a two peak model, water and lipid achieve a 180° phase-difference relative to each other (opposed-phase condition) at a TE of 2.2 ms and 1.5 T and an in-phase condition at TE=4.4 ms (Fig. 1a). Ignoring other underlying MR and biological effects, the degree of signal loss in opposed-phase imaging is proportional to the degree of lipid accumulation, resulting in a method for detecting fatty liver (Fig. 1b, 1c) (13, 16). By acquiring opposed-phase images in conjunction with in-phase images (dual-echo GRE), a simple lipid fraction quantity can be determined using the following relationship: (Sip–Sop)/2Sip, where Sip is the liver signal measured in magnitude in-phase images (often relative to the spleen signal), and Sop is the liver signal in opposed-phase images. However, because magnitude images only display positive signal values, this method prevents an accurate assessment of lipid fractions above 50%, unless lipid is known to be the dominant component. Because water and lipid have a specific chemical-shift, algorithms can be formulated to produce separated water- and lipid-sensitive images using in- and opposed-phase images (17, 18). These images are effective surrogates for routine fat-suppressed T1 imaging (“water-only” image) or for the qualitative assessment of fatty infiltration (“lipid-only” image) (Fig. 2). Because the diagnostic value of an accurate spatial “map” depicting the lipid fraction is high, it is important to overcome the technical and physiologic bias impacting the quantification of the lipid fraction.
Figure 1. a–c.
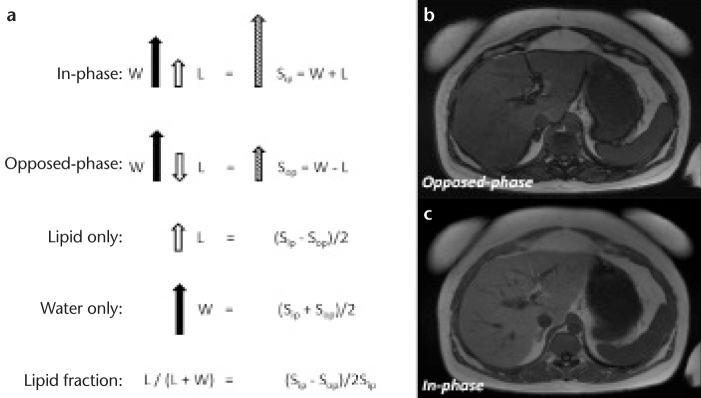
Vector description of the magnitude signal from an in-phase and opposed-phase MRI experiment (a). The resultant signal (Sip and Sop) is the vector sum of lipid (L) and water (W) components within a voxel. Note that absolute signal values will obscure interpretation if lipid is greater than water. Lipid- and water-only images can be reconstructed from source in- and opposed-phase data and further manipulated to compute the lipid fraction. Representative images of opposed-(b) and in-phase MRI (c). Note the dark etching artifact on the opposed-phased image due to water-lipid boundaries along with signal reduction in the liver due to abnormal lipid accumulation. Images acquired at 1.5 T using a two-dimensional spoiled dual-echo gradient-echo sequence with TR/TE1/TE2=150/2.3/4.6 ms in a 16 s breath hold.
Figure 2. a–e.
Three-dimensional multi-point Dixon acquisition in an individual with hepatic lipid showing in-phase (a), opposed-phase (b), water (W) only (c), lipid (L) only (d), and T2* corrected lipid-fraction (LF) map (e), obtained from the following relationship: LF=L/(L+W). The increased signal that is observed in the lipid-fraction map is specific for elevated lipid content. Note that there is no lipid present in the kidney or pancreas. Region-of-interest measurement in the right lobe reveals a LF=38.0%.
The confounding factors for accurate lipid fraction quantification are numerous, and it is ambitious to expect a complete elimination of all factors without compromising acquisition efficiency. Systematic errors related to B0 field homogeneity and eddy currents can create additional voxel-dependent phase accumulation of water-lipid components, causing reduced integrity of in- and opposed-phase quantitation. One effective extension of conventional dual-echo GRE is to preserve the phase information of the signal and to use a complex signal model to better estimate field inhomogeneities and water-lipid dominance (18, 19). This strategy is improved by using three (or more) echoes at either symmetric (in- or opposed-phase) or asymmetric (arbitrary) TEs (20, 21). The commonly known IDEAL (iterative decomposition of water and fat with echo asymmetry and least-squares estimation) technique uses these strategies to optimize water-fat separation (21, 22). The determination of the additional phase accumulation is not a trivial problem; an estimation of the field map is often necessary, and it could involve phase unwrapping (20).
Another important confounder is bias that is related to the relaxation parameters T1 and T2 (or T2*). Water and lipid, within a voxel, have individually associated relaxation parameters that are sensitive to the local molecular environment (23). With the composition of the molecular environment usually unknown a priori, the basic strategy to reduce bias related to T1 and T2* relaxation (in fast GRE imaging) is to either reduce the effect with MR parameter modification or to correct the phenomena with postprocessing algorithms. T1-bias originates from the incomplete longitudinal relaxation of water and lipid over TR. This effect is particularly relevant in the fast-GRE sequences that are typically used to image the lipid fraction. Although it has been estimated that water and lipid have uniquely varying T1 in the liver (T1lipid=343 ms and T1water=586 ms at 1.5 T, [24]), the systematic off-line correction of these entities is challenging due to the added complexity of the MR signal model and to the unknown T1 effect of various pathologies. A simpler strategy is to optimize the flip angle and TR, depending on the GRE imaging sequence and imaging constraints. For modern, breath-hold 3D multi-echo GRE acquisitions, flip angles are <10° and TR <20 ms.
Neutralizing the effects of transverse relaxation (T2 or T2*) requires off-line signal correction steps. Simple MR sequence modification is not possible because effective water-lipid separation requires multiple acquisitions at specifically increasing echo times, thereby weighting the signal by T2* (ideally, TE=0 is desired to eliminate T2 or T2* relaxation). Moreover, it is known that liver T2* is highly variable in pathological conditions, particularly with iron deposition (25). Therefore, there is impetus to measure and correct T2* for the accurate estimation of water and lipid proton-density and lipid fraction. However, it is important to note that T2* within a voxel consists of a weighted contribution of water, lipid, and other components. This compartmental-dependence of T2* is the subject of on-going investigation, particularly in the setting of combined lipid and iron deposition. It suffices to say that accurate lipid fraction estimation requires the estimation of both T2* components and, as a result, requires further inclusion of these terms in the general MR signal model (assuming one lipid peak):
where, ϕB is the frequency shift due to field inhomogeneity, ρ represents the proton densities of water and lipid, and fl is the frequency shift between water and lipid. A thorough analysis of the GRE signal model, in terms of compartmental T2*-dependence, has been investigated previously, with many additional assumptions (26, 27). While lipid fraction estimation bias is reduced by including water and lipid T2* terms, it has been found that noise performance suffers significantly, counteracting the improved accuracy that is afforded by the multiple T2* terms (27–29). The noise performance is particularly important for low lipid fraction levels, which could be of diagnostic importance. In such cases, a single T2* estimate is sufficient because the contribution from lipid is minimal. Intermediate lipid levels could benefit from separate T2* estimations, however, particularly if water and lipid T2* are very different. At baseline, the T2* of water and lipid have been estimated to be 24 and 18 ms, respectively (27). However, these values will change due to pathological conditions, particularly iron accumulation.
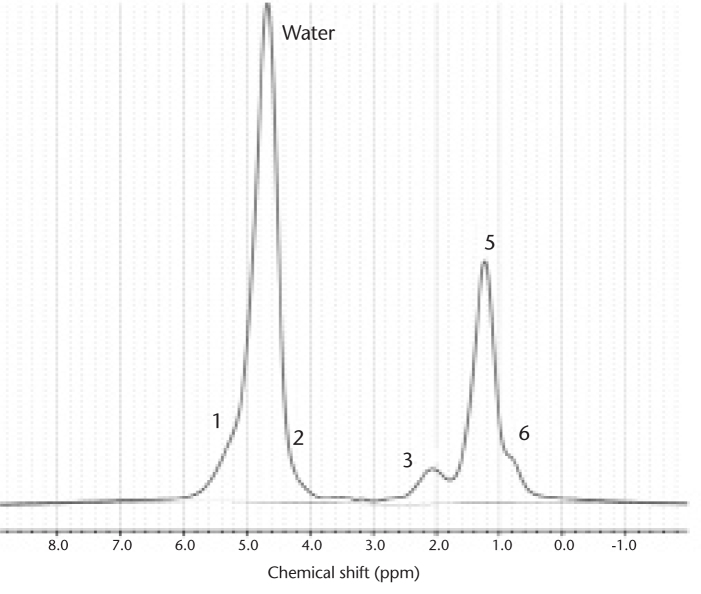
The assumption that a single lipid (methylene) off-resonance exists −3.4 parts per million (ppm) from water is an over-simplification for calculating total lipid. From high-resolution MR spectroscopy of liver, it has been shown that the detailed lipid spectrum consists of at least six distinct observable triglyceride proton resonances (Fig. 3) (30). Therefore, multiple lipid spectra contribute to the total lipid fraction in the liver and must be accounted for in the complex MR signal model:
where p represents the number of lipid peaks, a is the relative amplitudes (such that Σap=1), and fp are the known frequency shifts of the lipid peaks. The specific chemical shifts are known from experimental observation, but the absolute magnitude of each will depend on the particular sample. In liver lipid, however, the relative amplitudes can be determined through calibration (30), as shown in the Table. Although this information can further simplify the complex signal equation, each lipid resonance can also be associated with a specific T2* value (23). However, assuming a single T2* for all lipid resonances is sufficient in most cases because the protons in lipid will experience similar effects of field inhomogeneity. Evidence has also shown that single-T2* correction correlates well with MR spectroscopy in vivo (31).
Figure 3.
High-resolution MR spectroscopy from an individual with elevated liver lipid. There are six observable lipid peaks at specific chemical-shifts that contribute to the total lipid signal, as noted numerically and detailed in the Table. Note that peak #1 and #2 are masked by water but contribute relatively little to the overall lipid quantity. Due to their specific chemical-shifts and relative amounts, each peak can be modeled in a generalized imaging equation for more accurate total lipid estimation.
Table.
Location and relative amount of liver triglycerides determined by MR spectroscopy as measured by Hamilton et al. (30)
| Peak # | CS (ppm) | Type | Relative amount |
|---|---|---|---|
| 1 | 5.3 | Olefinic | 4.7% |
| Water | 4.7 | ||
| 2 | 4.2 | Glycerol | 3.9% |
| 3 | 2.75 | Diacyl | 0.6% |
| 4 | 2.1 | Carboxyl | 12.0% |
| 5 | 1.3 | Methylene | 70.0% |
| 6 | 0.9 | Methyl | 8.8% |
CS, chemical shift.
The use of a complex, multiple lipid peak analysis for lipid fraction estimation shows significant improvement in accuracy over a “single-peak” analysis (32). Without spectral modeling, the lipid fraction is underestimated, even with T2* correction. With knowledge of water-lipid dominance, a magnitude GRE acquisition needs at least three echoes to solve the complex signal model for T2*-corrected water and lipid images; however, specific TEs can be determined to optimize noise bias (33). A least-squares analysis approach is typically used to calculate at least three unknowns: water, lipid (total), and T2*. More unknowns require additional images at appropriate TEs.
Proper correction of relaxation effects and of other system and field effects produces a “proton density-weighted” estimation of water and lipid (Fig. 2), which are pseudo-correlated to metabolite concentration. The current implementation of MR lipid fraction acquisitions is 3D GRE with three or more echoes using magnitude and phase information in a complex, multi-spectral lipid signal model. A single-T2* estimation is common practice, with the integrity of the estimation increasing with the number of TEs. T1 bias is reduced by using a low flip angle (<10°), while TR for 3D applications are typically <20 ms for breath-hold acquisitions. The field dependence of these factors has not been fully described to date.
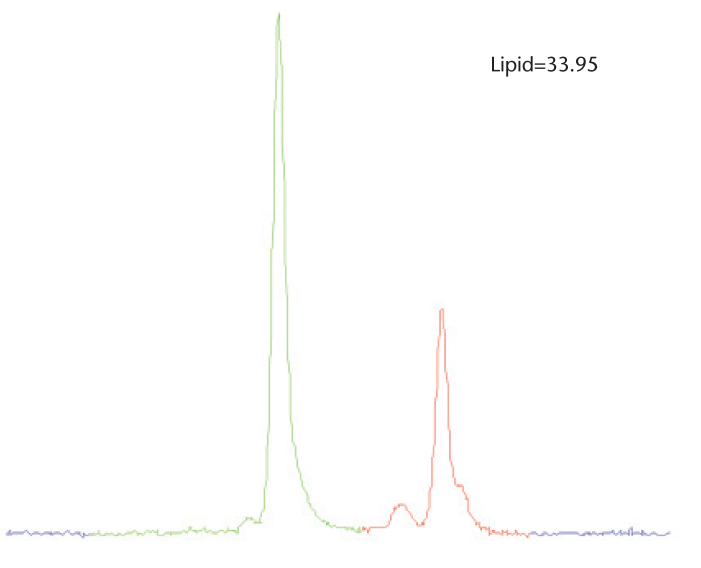
The lipid fraction can also be accurately estimated with MR spectroscopy using two common, single-voxel techniques: point-resolved spectroscopy and stimulated-echo acquisition (34–37). High-resolution MR spectroscopy acquisitions allow the detailed and direct visualization of relevant water and lipid spectra in the liver. Spectral area measurements of each metabolite (AL and Aw) can be combined and related to calculate the total lipid fraction: LF=ΣL AL/(ΣL AL+Aw). MR spectroscopy allows a highly accurate quantification of the lipid fraction relative to water. Conventional MR spectroscopy, however, has several inherent drawbacks. To attain a high-resolution MR spectroscopy of a relatively small volume of interest (30 mm3), the acquisition must be signal-averaged for adequate signal-to-noise ratio (SNR) and lipid peak separation. The breathing motion must also be considered, which further complicates conventional MR spectroscopy approaches. Importantly, however, water and diagnostically relevant lipid are in high abundance in the liver compared to metabolites that are inspected by MR spectroscopy in many neuroapplications. Therefore, signal averaging can be reduced or eliminated, allowing breath-hold acquisitions. Another common deterrent to clinical MR spectroscopy is spectrum analysis, which requires sophisticated processing software to extract water and lipid quantities. Following data postprocessing to transform raw MR spectroscopy signal to a spectral-frequency representation, an additional task is to measure the integral area of each metabolite using specific Gaussian or Lorentzian curve fitting algorithms, which can be subject to significant error without careful attention. An alternate method for estimating the total lipid is to treat the multiple lipid spectra as one entity and to subsequently determine the total integral area, as shown in Fig. 4. This method is particularly useful in abdominal applications if high-resolution spectra are forfeited in exchange for acquisition speed.
Figure 4.
Single-voxel MR spectroscopy acquired in an individual with elevated liver lipid using a breath hold, multi-echo modified stimulated-echo acquisition (TE=12 ms shown for simplicity). Due to the acquisition speed, spectral line-fitting is challenging. However, total lipid can be quantified by integrating a known range of lipid (red) with a specific cutoff. The lesser olefinic peak can also be included in this case to improve accuracy.
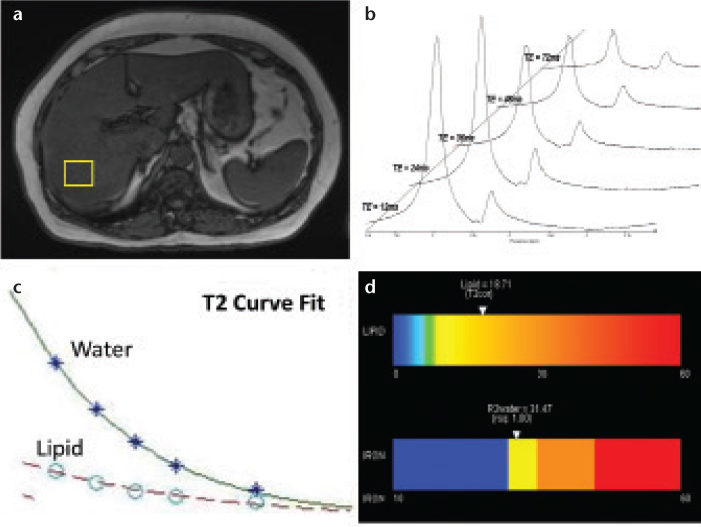
This has been the acquisition and processing approach of recent advanced MR spectroscopy methods for estimating the liver lipid fraction (36, 37), which has shown excellent correlation with lipid fraction in phantoms and in vivo. In addition to optimizing acquisition speed using one signal average, the high-speed T2-corrected (HISTO) MR spectroscopy method acquires spectral data at multiple echo times, enabling a T2 curve fit of water and lipid spectrums and a subsequent T2-correction of the resultant lipid fraction quantity. Fig. 5 shows the series of steps for HISTO acquisition.
Figure 5. a–d.
The acquisition of high-speed, T2-corrected multi-echo high-speed T2-corrected MR spectroscopy involves the concatenation of five stimulated-echo acquisitions within a single 15 s breath hold. Following voxel placement (a), five echoes are acquired. Postprocessing steps automatically transform MR spectroscopy spectral signal (raw data) into visible water and lipid peaks (b). The analysis algorithm estimates the integral areas of water and total lipid, and calculates individual metabolite T2 using a nonlinear least-squares fit (c). The T2 values are used to correct the inherent water and lipid decay to produce a T2-corrected lipid fraction while also producing an estimate of iron content based on the R2 (1/T2) of the water peak. An easy to interpret color bar can be produced (d).
MRI techniques to detect iron
The detection and staging of iron is relevant in the setting of diffuse liver disease. It is known to contribute to the advancement of the disease, and it is particularly present in patients with cirrhosis (38, 39). Moreover, in defining the measurement of other important MR biomarkers within the spectrum of diffuse disease, namely lipid, inflammation, and fibrosis, iron can have a confounding effect and must be accounted for with the appropriate correction methods. As noted, this phenomenon is due to iron’s paramagnetic effect on the local field homogeneity, which causes a negative SNR for T2 or T2*-weighted images for a given TE on gradient- or spin-echo images (40). The degree of reduced SNR, especially relative to muscle, is indicative of iron severity, but only semi-quantitatively. Because much of the iron effect is local spin de-phasing, a more empirical representation is T2 and/or T2* parametric mapping (11, 41). However, any absolute correlation to iron concentration is still indirect, at best, and a more realistic approach is a method that is sensitive to relative changes between normal, mild, moderate, and severe iron concentrations.
The positive effect of iron on trans-verse relaxation can be better appreciated by considering the relaxation rate R2 or R2*. This convention originated from early experiments with nuclear magnetic resonance that revealed a significant correlation between the transverse relaxation rate and solvent protons in paramagnetic and ferritin solutions (42). This correlation allows a linear relationship between the change in R2 and the change in iron concentration (ΔR2=r2Δ[Fe]). The relaxivity constant, r2, is specific to iron and represents a metric for iron’s paramagnetic strength. This relationship ignores the effect of other contributors to R2, namely lipid, collagen, or other tissue elements. Although other R2 contributions can distort the linear proportionality, liver iron, when present in significant amounts, is the dominant species influencing R2 values. Therefore, in general: R2liver=R2iron+R2other, where R2other represents the mean contribution of other non-iron-mediated relaxation elements, such as lipid. In individuals without combined disease, R2other often can be ignored, allowing a direct estimation of liver iron using R2 measurements.
The relationship between liver iron concentration and R2*, which is acquired with GRE methods, is also highly correlative in several studies (40, 43). However, R2* has additional contributions from global magnetic field inhomogeneity effects, such that R2*=R2+R2’, where R2’ represents the influence of macroscopic susceptibility (i.e., field inhomogeneity) on inherent R2 relaxation. The R2’ contribution is usually significant enough to make R2* highly sensitive to changes in iron concentration because the measurement is affected by local (R2iron) and global (R2’iron) paramagnetic effects. Therefore, R2* values are exceedingly higher than R2 values (for a given iron level), requiring imaging methods with much shorter echo time sampling. Nevertheless, R2* measurements for liver iron deposition remain well-suited for MR imaging, given the acquisition speed of GRE compared to spin-echo techniques.
Liver R2 and R2* measurements using MRI have shown high correlation with tissue iron concentration (44), although some investigations have reported inaccuracies with R2* in specific disease settings, such as fibrosis and lipid (43, 45). The method of choice could depend on the application. A multi-echo, multi-slice (or 3D) GRE method can be acquired in a short breath hold with most current MRI systems, which provides efficient integration into routine liver exams. Moreover, the ability to achieve ultra-short TE with GRE allows the interrogation of severe iron concentrations, which may present T2* values on the order of <10 ms. Ultra-short T2 values also occur in these severe cases, and they present a challenge for spin-echo methods because very short TE and inter-echo spacing is hindered by the time that is necessary for spin re-focusing. However, spin-echo techniques have the benefit of being insensitive to global inhomogeneities, which become significant at severe iron levels or higher field strengths. Recent hybrid approaches using gradient and spin-echo (GRASE) could overcome these limitations while providing more insensitivity from field inhomogeneity effects (46).
Another approach for liver R2 measurement is MR spectroscopy (47). This method is less common for routine clinical use due to its extended scan time, specialized processing needs, and its lack of broad availability, but these trends are changing with fast, multi-echo MR spectroscopy tools, such as HISTO (42). With MR spectroscopy, it is possible to achieve a local and detailed assessment of metabolite (water) signal decay that is related to R2 (and hence, iron deposition). Highly resolved water spectra can be obtained due to abundance of water and the relatively large voxel sample size (>20 mm3) compared to imaging-based techniques. Fast R2 measurements with MR spectroscopy have shown high correlation with a reference standard in vitro (36). Notably, MR spectroscopy experiments in iron-laden phantoms have shown the insensitivity of R2water with varying degrees of lipid concentration (48), suggesting that the distribution of iron affects water proton relaxation more than lipid proton relaxation. The inherent ability of the MR spectroscopy techniques to separate the water resonance from other confounding proton resonances, such as lipid, enables a more direct and isolated analysis of iron concentration compared to MRI, which typically measures a summed signal from each imaging voxel.
Future directions
It has been shown that liver lipid can be efficiently quantified with an imaging- or spectroscopic-based lipid fraction value or map that compensates for confounders, such as multiple lipid peaks and molecular relaxation (T1, T2, and T2*). Similarly, liver iron can be estimated from R2 or R2* quantities via multi-echo imaging or spectroscopic acquisitions. The application of these techniques must be revisited in the setting of combined disease, whether present together or coupled with advanced fibrotic changes. In effect, because lipid or iron often do not exist independently of each other in liver disease, they each become a confounder of the other.
In terms of liver lipid measurement in the presence of iron, considerable research has been conducted to manifest and outline the need for compensation methods for MRI and MR spectroscopy (29, 36). Most modern lipid-sensitive MR applications incorporate some degree of R2 or R2* correction using multi-echo acquisitions. It has been shown that lipid fraction measurements using either MRI or MR spectroscopy without R2/R2* correction result in significant error (26, 28, 29, 36). The effectiveness of these compensation methods often depends on the degree of iron concentration; severe iron overload can prevent adequate TE sampling and entirely obscure lipid quantification. Robust signal modeling is also important with MR methods: the presence of lipid and iron (and other metabolites) in an imaging voxel presents a multi-component R2 or R2* relaxation process, which may vary depending on the concentration of each component. Current multi-peak imaging methods assume a single R2* component in order to provide adequate SNR properties, and results show excellent linear correlation with a lipid fraction reference in the absence of iron (28). However, some reports show a departure from linearity when iron is present with lipid (47). Further evaluation of single R2* correction methods are needed in the setting of lipid-iron combined disease.
Multi-echo MR spectroscopy methods for lipid fraction quantification also require R2 correction (35–37). The acquisition of a single MR spectroscopy voxel containing lipid and iron at multiple TE exhibits unique and quantifiable T2 relaxation curves. It is important to note that if it is assumed that R2water=R2lipid, then no correction for relative signal decay is needed for lipid fraction measurement; both metabolites decay at the same rate regardless of acquisition TE. However, in practice, R2water is not the same as R2lipid, particularly in the presence of iron (26, 36). From analysis in phantoms, it has been shown that iron primarily affects the R2water value, thereby overestimating the lipid fraction if correction methods are not employed (36, 48). In addition, current development is ongoing to further shorten the initial echo time (TE=12 ms), which currently limits the technique in cases of severe iron overload, where T2 is very short.
The quantification of iron concentration using R2 or R2* is also subject to confounders, such as lipid or collagen deposition, due to fibrotic changes in the liver. As a result, with MRI techniques, the measured R2* may not correlate directly with iron concentration due to the integral effects of other tissue compartments. Few investigations have correlated R2* with iron concentration in the presence of lipid. It is well known that R2* measurements depend heavily on the acquisition technique, number of echoes, and echo-spacing. A recent investigation compared R2* measurements from (in-phase) multi-echo GRE with known histologically determined iron and steatosis grade in vivo (45). The results showed a significant change in measured R2* as steatosis grade increased in subjects without elevated iron levels. Although R2* sensitivity to the lipid fraction lessened when the authors accounted for multiple lipid peaks, a measureable change in R2* was still detected. Another report found a weaker correlation of R2* with iron concentration in patients with liver fibrosis (43). In addition to R2*, sensitivity to lipid also affects R2 measurements in liver for iron quantification. A recent study investigating the use of a fat-saturated, multi-echo spin-echo sequence for R2 quantification for siderosis in multiple abdominal organs, including the liver, found a significant decrease in R2 values in lipid-rich pancreas and vertebral bone marrow compared to non-fat-saturated spin-echo (49). Although a significant R2 decrease was not found in the liver, no subjects were specifically enrolled with a concurrent high lipid fraction. However, it should be noted that each subject displayed a measureable decrease in R2 when the fat saturation technique was employed, suggesting that lipid overestimates R2 in the presence of iron. This phenomenon has also been observed in MR spectroscopy studies (37, 48), where R2lipid and R2water can be quantified separately.
Current results from multi-echo MR spectroscopy show a measureable difference between R2lipid and R2water in phantoms containing varying concentrations of lipid and iron (Fig. 6). This difference confirms the compartmental dependence of R2, which can also be extended to measurements of R2* with GRE techniques. Notably, these initial results have shown that the R2water component is significantly correlated with iron concentration (>0.95), whereas R2lipid remains considerably uncorrelated (<0.10) over the same range of iron concentrations. This observation of R2water and R2lipid divergence has also been detected in vivo, with R2water displaying a strong linear correlation with iron estimates, as shown in Fig. 7 (unpublished data). Although R2lipid remains relatively unchanged in the presence of low to moderate levels of iron, R2lipid measurements also begin to increase considerably with severe iron overload. This trend follows the known physiological distribution of iron in the liver, where-by mobile, crystalline iron distributes to intercellular regions that are spatially distinct from mobile lipid protons contained within intracellular vacuoles. The paramagnetic susceptibility of iron, therefore, will influence the “water” compartment over the “lipid” compartment and will be a function of proximity and concentration. Further investigations are ongoing to validate MR spectroscopy measurements of the lipid fraction, R2water, and R2lipid in vivo in the setting of combined disease using known iron and lipid histology biomarkers as references.
Figure 6. a, b.
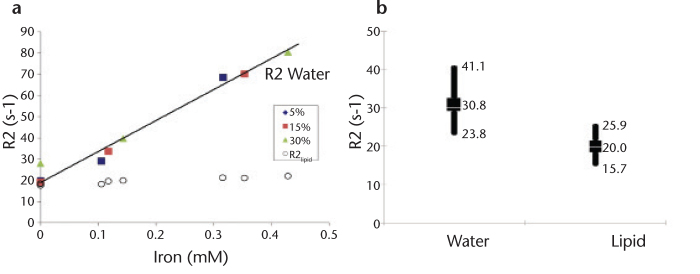
R2water and R2lipid are measurably different in phantoms and in vivo in the presence of lipid and iron. Correlation between MR spectroscopy-derived R2 values and known iron concentration in lipid/iron-doped phantoms reveals significant linearity with R2water (a). Conversely, measurements of R2lipid are relatively insensitive to changes in iron concentration. Note that the lipid content in the phantoms does not affect the linearity of R2water with iron. Initial in vivo data (n=24) quantifying R2 using MR spectroscopy indicates that there is a significant difference between R2water and R2lipid in a cross-section of patients with hepatic lipid (n=13), hepatic iron (n=3), or combined disease (n=8) (b). High, low, and average values are shown. Average R2lipid was 20.0±2.8 s-1, which closely follows the results in phantoms.
Figure 7. a, b.
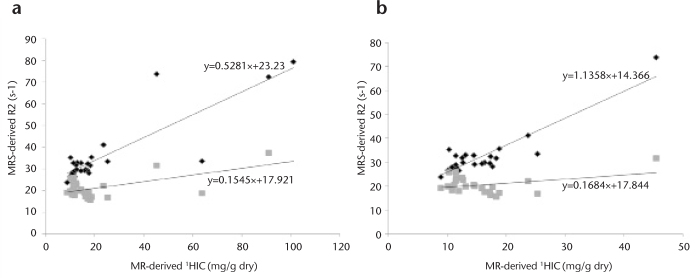
Correlation between MR spectroscopy-derived R2 measurements and estimated hepatic iron content (HIC) in vivo. HIC was estimated from R2* measurements in 27 patients using dual-echo gradient-echo (TR/TE1/TE2=170/2.3/4.6 ms); 15 patients had elevated hepatic lipid (>10%), as determined by MR spectroscopy. MR spectroscopy-R2 measurements of water and lipid in all 27 patients show higher correlation with R2water compared to R2lipid over a wide range of MR-HIC (a). Zoomed data for MR-HIC <50 mg/g dry weight reveals that R2lipid measurements are relatively insensitive to changes in HIC compared to R2water (b). 1HIC calculated according to the method described by Wood et al. (44).
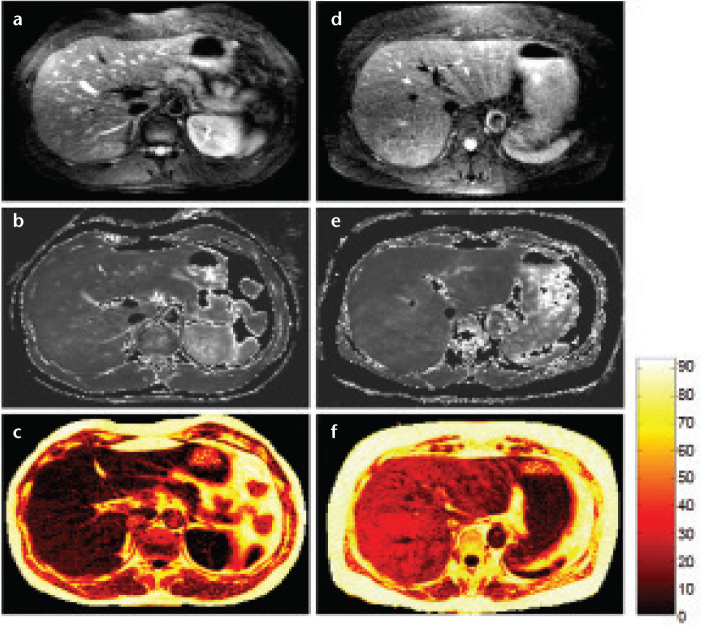
The acquisition of a T2water map in combination with a multi-lipid peak-and relaxation-corrected lipid fraction map using MR imaging methods has recently been investigated (46), and it shows promise as a robust technique for simultaneously quantifying lipid and iron (Fig. 8). Similar to the MR spectroscopy results, the T2water measurement using the radial-GRASE method is insensitive to the lipid fraction in phantoms. However, further studies are needed to elucidate the relationship in vivo within a spectrum of lipid and iron concentrations.
Figure 8. a–f.
Abdominal images acquired with radial-GRASE technique. Water image (a), T2-weighted map (b), and % lipid signal map (c) of a healthy volunteer. Water image (d), T2-weighted map (e), and % lipid signal map (f) of a patient diagnosed with fatty liver disease. The water image, % lipid signal, and T2-weighted maps were generated from data acquired with radial-GRASE in a single breath hold. The % lipid signal and T2-weighted maps are thresholded to null out regions that consist of mostly noise. The T2-weighted maps include lipid regions, which contain little or no water signal.
Conclusion
MR techniques are sufficiently well-developed to be considered a surrogate and routine alternative to liver biopsy for the measurement of the liver lipid fraction and tissue iron level. Ideally, the application of magnetic resonance imaging to the study of liver iron and lipid deposition requires a single, fast, and precise technique that can be broadly integrated into routine abdominal imaging exams with intuitive presentation of the results. Developing an MR imaging or spectroscopic acquisition that fully satisfies these requirements remains challenging. While multi-echo GRE imaging approaches are now able to accurately and precisely quantify lipid fraction volumetrically within a breath hold, there is still uncertainty regarding accurately estimating iron concentration in combined disease using single R2* measurements without adding significant noise bias. In contrast, multi-echo MR spectroscopy methods present the benefits of lipid and water compartmental analysis of lipid fraction and iron concentration (via compartmental R2 measurement). MR spectroscopy has also been shown to be applicable to routine liver disease applications with accelerated acquisition and postprocessing improvements. However, precise voxel placement and limited sampling volume remain important drawbacks, and studies need to be conducted to validate the compartmental dependence of iron concentration in vivo.
In conclusion, MR techniques for liver iron and lipid quantification have significantly developed in recent years. The clinical importance of multi-faceted diffuse liver disease has spawned numerous investigations to provide robust, noninvasive methods that extend beyond the traditional qualitative assessment of disease, creating a new era of quantitative diagnosis and therapeutic monitoring of disease. Future developments will continue to refine existing MRI and MR spectroscopy techniques and allow easy user implementation and intuitive physician interpretation. The use of magnetic resonance imaging as a front line tool for the robust assessment of diffuse liver disease is imminent.
Footnotes
Conflict of interest disclosure
The authors declared no conflicts of interest.
References
- 1.Bosch FX, Ribes J, Díaz M, Cléries R. Primary liver cancer: worldwide incidence and trends. Gastroenterology. 2004;127:S5–S16. doi: 10.1053/j.gastro.2004.09.011. [DOI] [PubMed] [Google Scholar]
- 2.Center MM, Jemal A. International trends in liver cancer incidence rates. Cancer Epidemiol Biomarkers Prev. 2011;20:2362–2368. doi: 10.1158/1055-9965.EPI-11-0643. [DOI] [PubMed] [Google Scholar]
- 3.Clark JM, Diehl AM. Nonalcoholic fatty liver disease: an under-recognized cause of cryptogenic cirrhosis. JAMA. 2003;289:3000–3004. doi: 10.1001/jama.289.22.3000. [DOI] [PubMed] [Google Scholar]
- 4.McCullough AJ. The clinical features, diagnosis and natural history of nonalcoholic fatty liver disease. Clin Liver Dis. 2004;8:521–533. doi: 10.1016/j.cld.2004.04.004. [DOI] [PubMed] [Google Scholar]
- 5.Borgna-Pignatti C, Vergine G, Lombardo T, et al. Hepatocellular carcinoma in the thalassaemia syndromes. Br J Haematol. 2004;124:114–117. doi: 10.1046/j.1365-2141.2003.04732.x. [DOI] [PubMed] [Google Scholar]
- 6.Bravo AA, Sheth SG, Chopra S. Liver biopsy. N Engl J Med. 2001;344:495–500. doi: 10.1056/NEJM200102153440706. [DOI] [PubMed] [Google Scholar]
- 7.Soder RB, Baldisserotto M, Duval da Silva V. Computer-assisted ultrasound analysis of liver echogenicity in obese and normal-weight children. Am J Roentgenol. 2009;192:W201–W205. doi: 10.2214/AJR.08.2061. [DOI] [PubMed] [Google Scholar]
- 8.Schwenzer NF, Springer F, Schraml C, Stefan N, Machann J, Schick F. Non-invasive assessment and quantification of liver steatosis by ultrasound, computed tomography and magnetic resonance. J Hepatol. 2009;51:433–445. doi: 10.1016/j.jhep.2009.05.023. [DOI] [PubMed] [Google Scholar]
- 9.Kodama Y, Ng CS, Wu TT, et al. Comparison of CT methods for determining the fat content of the liver. Am Jour Roentgenol. 2007;188:1307–1312. doi: 10.2214/AJR.06.0992. [DOI] [PubMed] [Google Scholar]
- 10.Dixon WT. Simple proton spectroscopic imaging. Radiology. 1984;153:189–194. doi: 10.1148/radiology.153.1.6089263. [DOI] [PubMed] [Google Scholar]
- 11.Stark DD, Moseley ME, Bacon BR, et al. Magnetic resonance imaging and spectroscopy of hepatic iron overload. Radiology. 1985;154:137–142. doi: 10.1148/radiology.154.1.3964933. [DOI] [PubMed] [Google Scholar]
- 12.Mitchell DG, Kim I, Chang TS, et al. Fatty liver. Chemical shift phase-difference and suppression magnetic resonance imaging techniques in animals, phantoms, and humans. Invest Radiol. 1991;26:1041–1152. [PubMed] [Google Scholar]
- 13.Qayyum A, Goh JS, Kakar S, Yeh BM, Merriman RB, Coakley FV. Accuracy of liver fat quantification at MR imaging: comparison of out-of-phase gradient-echo and fat-saturated fast spin-echo techniques–initial experience. Radiology. 2005;237:507–511. doi: 10.1148/radiol.2372040539. [DOI] [PubMed] [Google Scholar]
- 14.Blatter DD, Morris AH, Ailion DC, Cutillo AG, Case TA. Asymmetric spin echo sequences. A simple new method for obtaining NMR 1H spectral images. Invest Radiol. 1985;20:845–853. doi: 10.1097/00004424-198511000-00012. [DOI] [PubMed] [Google Scholar]
- 15.Sepponen RE, Sipponen JT, Tanttu JI. A method for chemical shift imaging: demonstration of bone marrow involvement with proton chemical shift imaging. J Comput Assist Tomogr. 1984;8:585–587. doi: 10.1097/00004728-198408000-00001. [DOI] [PubMed] [Google Scholar]
- 16.Kreft BP, Tanimoto A, Baba Y, et al. Diagnosis of fatty liver with MR imaging. J Magn Reson Imaging. 1992;2:463–471. doi: 10.1002/jmri.1880020416. [DOI] [PubMed] [Google Scholar]
- 17.Lee JK, Dixon WT, Ling D, Levitt RG, Murphy WA., Jr Fatty infiltration of the liver: demonstration by proton spectroscopic imaging. Preliminary observations. Radiology. 1984;153:195–201. doi: 10.1148/radiology.153.1.6089264. [DOI] [PubMed] [Google Scholar]
- 18.Glover GH, Schneider E. Three-point Dixon technique for true water/fat decomposition with B0 inhomogeneity correction. Magn Reson Med. 1991;18:371–383. doi: 10.1002/mrm.1910180211. [DOI] [PubMed] [Google Scholar]
- 19.Skinner TE, Glover GH. An extended two-point Dixon algorithm for calculating separate water, fat, and B0 images. Magn Reson Med. 1997;37:628–630. doi: 10.1002/mrm.1910370426. [DOI] [PubMed] [Google Scholar]
- 20.Chen Q-S, Schneider E, Aghazadeh B, Weinhous MS, Humm J, Ballon D. An automated iterative algorithm for water and fat decomposition in three-point Dixon magnetic resonance imaging. Med Phys. 1999;26:2341–2347. doi: 10.1118/1.598748. [DOI] [PubMed] [Google Scholar]
- 21.Reeder SB, McKenzie CA, Pineda AR, et al. Water-fat separation with IDEAL gradient-echo imaging. J Magn Reson Imaging. 2007;25:644–652. doi: 10.1002/jmri.20831. [DOI] [PubMed] [Google Scholar]
- 22.Reeder SB, Pineda AR, Wen Z, et al. Iterative decomposition of water and fat with echo asymmetry and least-squares estimation (IDEAL): application with fast spin-echo imaging. Magn Reson Med. 2005;54:636–644. doi: 10.1002/mrm.20624. [DOI] [PubMed] [Google Scholar]
- 23.Brix G, Heiland S, Bellemann ME, Koch T, Lorenz WJ. MR imaging of fat-containing tissues: valuation of two quantitative imaging techniques in comparison with localized proton spectroscopy. Magn Reson Imaging. 1993;11:977–991. doi: 10.1016/0730-725x(93)90217-2. [DOI] [PubMed] [Google Scholar]
- 24.de Bazelaire CM, Duhamel GD, Rofsky NM, Alsop DC. MR imaging relaxation times of abdominal and pelvic tissues measured in vivo at 3.0T: preliminary results. Radiology. 2004;230:652–659. doi: 10.1148/radiol.2303021331. [DOI] [PubMed] [Google Scholar]
- 25.Ghugre NR, Wood JC. Relaxivity-iron calibration in hepatic iron overload: probing underlying biophysical mechanisms using a Monte Carlo model. Magn Reson Med. 2011;65:837–847. doi: 10.1002/mrm.22657. [DOI] [PMC free article] [PubMed] [Google Scholar]
- 26.Bydder M, Yokoo T, Hamilton G, et al. Relaxation effects in the quantification of fat using gradient echo imaging. Magn Reson Imaging. 2008;26:347–359. doi: 10.1016/j.mri.2007.08.012. [DOI] [PMC free article] [PubMed] [Google Scholar]
- 27.Hernando D, Liang ZP, Kellman P. Chemical shift-based water/fat separation: a comparison of signal models. Magn Reson Med. 2010;64:811–822. doi: 10.1002/mrm.22455. [DOI] [PMC free article] [PubMed] [Google Scholar]
- 28.Horng DE, Hernando D, Hines CD, Reeder SB. Comparison of R(2) * correction methods for accurate fat quantification in fatty liver. J Magn Reson Imaging. 2013;37:414–422. doi: 10.1002/jmri.23835. [DOI] [PMC free article] [PubMed] [Google Scholar]
- 29.Reeder SB, Bice EK, Yu H, Hernando D, Pineda AR. On the performance of T2* correction methods for quantification of hepatic fat content. Magn Reson Med. 2012;67:389–404. doi: 10.1002/mrm.23016. [DOI] [PMC free article] [PubMed] [Google Scholar]
- 30.Hamilton G, Yokoo T, Bydder M, et al. In vivo characterization of the liver fat 1H MR spectrum. NMR Biomed. 2011;24:784–790. doi: 10.1002/nbm.1622. [DOI] [PMC free article] [PubMed] [Google Scholar]
- 31.Meisamy S, Hines CD, Hamilton G, et al. Quantification of hepatic steatosis with T1-independent, T2-corrected MR imaging with spectral modeling of fat: blinded comparison with MR spectroscopy. Radiology. 2011;258:767–775. doi: 10.1148/radiol.10100708. [DOI] [PMC free article] [PubMed] [Google Scholar]
- 32.Reeder SB, Robson PM, Yu H, et al. Quantification of hepatic steatosis with MRI: the effects of accurate fat spectral modeling. J Magn Reson Imaging. 2009;29:1332–1339. doi: 10.1002/jmri.21751. [DOI] [PMC free article] [PubMed] [Google Scholar]
- 33.Yu H, McKenzie CA, Shimakawa A, et al. Multiecho reconstruction for simultaneous water-fat decomposition and T2* estimation. J Magn Reson Imaging. 2007;26:1153–1161. doi: 10.1002/jmri.21090. [DOI] [PubMed] [Google Scholar]
- 34.Thomsen C, Becker U, Winkler K, Christoffersen P, Jensen M, Henriksen O. Quantification of liver fat using magnetic resonance spectroscopy. Magn Reson Imaging. 1994;12:487–495. doi: 10.1016/0730-725x(94)92543-7. [DOI] [PubMed] [Google Scholar]
- 35.Hamilton G, Middleton MS, Bydder M, et al. Effect of PRESS and STEAM sequences on magnetic resonance spectroscopic liver fat quantification. J Magn Reson Imaging. 2009;30:145–152. doi: 10.1002/jmri.21809. [DOI] [PMC free article] [PubMed] [Google Scholar]
- 36.Sharma P, Martin DR, Pineda N, et al. Quantitative analysis of T2-correction in single-voxel magnetic resonance spectroscopy of hepatic lipid fraction. J Magn Reson Imaging. 2009;29:629–635. doi: 10.1002/jmri.21682. [DOI] [PMC free article] [PubMed] [Google Scholar]
- 37.Pineda N, Sharma P, Xu Q, Hu X, Vos M, Martin DR. Measurement of hepatic lipid: high-speed T2-corrected multiecho acquisition at 1H MR spectroscopy–a rapid and accurate technique. Radiology. 2009;252:568–576. doi: 10.1148/radiol.2523082084. [DOI] [PubMed] [Google Scholar]
- 38.Ludwig J, Hashimoto E, Porayko MK, Moyer TP, Baldus WP. Hemosiderosis in cirrhosis: a study of 447 native livers. Gastroenterology. 1997;112:882–888. doi: 10.1053/gast.1997.v112.pm9041250. [DOI] [PubMed] [Google Scholar]
- 39.Bonkovsky HL, Banner BF, Rothman AL. Iron and chronic viral hepatitis. Hepatology. 1997;25:759–768. doi: 10.1002/hep.510250345. [DOI] [PubMed] [Google Scholar]
- 40.Wood JC. Magnetic resonance imaging measurement of iron overload. Curr Opin Hematol. 2007;14:183–190. doi: 10.1097/MOH.0b013e3280d2b76b. [DOI] [PMC free article] [PubMed] [Google Scholar]
- 41.Clark PR, Chua-Anusorn W, St Pierre TG. Proton transverse relaxation rate (R2) images of liver tissue; mapping local tissue iron concentrations with MRI. Magn Reson Med. 2003;49:572–575. doi: 10.1002/mrm.10378. [DOI] [PubMed] [Google Scholar]
- 42.Bloembergen N, Purcell EM, Pound RV. Relaxation effects in nuclear magnetic resonance absorption. Phys Rev. 1948;73:679–715. [Google Scholar]
- 43.Anderson LJ, Holden S, Davis B, et al. Cardiovascular T2-star (T2*) magnetic resonance for the early diagnosis of myocardial iron overload. Eur Heart J. 2001;22:2171–2179. doi: 10.1053/euhj.2001.2822. [DOI] [PubMed] [Google Scholar]
- 44.Wood JC, Enriquez C, Ghugre N, et al. MRI R2 and R2* mapping accurately estimates hepatic iron concentration in transfusion-dependent thalassemia and sickle cell disease patients. Blood. 2005;106:1460–1465. doi: 10.1182/blood-2004-10-3982. [DOI] [PMC free article] [PubMed] [Google Scholar]
- 45.Kühn JP, Hernando D, Muñoz del Rio A, et al. Effect of multipeak spectral modeling of fat for liver iron and fat quantification: correlation of biopsy with MR imaging results. Radiology. 2012;265:133–142. doi: 10.1148/radiol.12112520. [DOI] [PMC free article] [PubMed] [Google Scholar]
- 46.Li Z, Graff C, Gmitro AF, et al. Rapid water and lipid imaging with T2 mapping using a radial IDEAL-GRASE technique. Magn Reson Med. 2009;61:1415–1424. doi: 10.1002/mrm.21918. [DOI] [PMC free article] [PubMed] [Google Scholar]
- 47.Wang ZJ, Haselgrove JC, Martin MB, et al. Evaluation of iron overload by single voxel MRS measurement of liver T2. J Magn Reson Imaging. 2002;15:395–400. doi: 10.1002/jmri.10080. [DOI] [PubMed] [Google Scholar]
- 48.Sharma P, Kitajima HK, Zhong X, Kalb B, Martin DR. Compartmental analysis of R2 measurements of hepatic lipid and iron in vivo using breath-hold multi-echo H spectroscopy (HISTO). Paper presented at: 2011 Proceedings of the 19th Annual of the International Society of Magnetic Resonance in Medicine; May 7–13, 2011; Montreal, Quebec, Canada. [Google Scholar]
- 49.Papakonstantinou O, Foufa K, Benekos O, et al. Use of fat suppression in R2 relaxometry with MRI for the quantification of tissue iron overload in beta-thalassemic patients. Magn Reson Imaging. 2012;30:926–933. doi: 10.1016/j.mri.2012.03.002. [DOI] [PubMed] [Google Scholar]


