Abstract
Perfusion computed tomography (CT) has a great potential for determining hepatic and portal blood flow; it offers the advantages of quantitative determination of lesion hemodynamics, distinguishing malignant and benign processes, as well as providing morphological data. Many studies have reported the use of this method in the assessment of hepatic tumors, hepatic fibrosis associated with chronic liver disease, treatment response following radiotherapy and chemotherapy, and hepatic perfusion changes after radiological or surgical interventions. The main goal of liver perfusion imaging is to improve the accuracy in the characterization of liver disorders. In this study, we reviewed the clinical application of perfusion CT in various hepatic diseases.
The advent of multidetector CT has given rise to the acquisition of images with higher quality and accuracy. Multidetector CT has been developed as a noninvasive imaging modality for evaluation of vascular anatomy. It has also made it possible to perform CT angiography of the hepatic vessels. New generation CT systems with multidetector are capable of performing volumetric imaging. These systems provide a single rotational acquisition and almost the whole upper abdomen can be appraised by means of serial rotational acquisitions at a single location in the z-direction. Multidetector CT imaging is used extensively for the preoperative selection of living related liver donors, as well as evaluation of the vascular anatomy of the recipients (1). This imaging technique is also used for the initial evaluation and follow-up of most patients with hepatic metastases, providing valuable information about the number, size, and distribution of hepatic metastases and the presence and extent of extrahepatic disease (1).
Perfusion CT imaging permits the qualitative and quantitative assessment of liver perfusion. In perfusion CT, a quantitative tissue perfusion map is obtained from dynamic CT data and displayed using a color scale permitting the quantification of tissue perfusion in absolute units at high spatial resolution (2). Perfusion CT efficiently locates abnormal tissue perfusion which is difficult to detect accurately with conventional CT (3). Functional assessment of the perfusion of normal and pathologic tissues is performed by means of quantitative or semiquantitative parameters, such as blood flow (BF), blood volume (BV), mean transit time (MTT), portal liver perfusion (PLP), arterial liver perfusion (ALP) and hepatic perfusion index (HPI). Perfusion CT measures the temporal changes in tissue density through a series of dynamically acquired CT images after intravenous injection of an iodinated contrast material (4, 5). Perfusion CT may be performed quickly and provide valuable data for diagnosis. However, there are some limitations of this method such as long breath-holding for portal flow measurement, separation of arterial and portal blood flow, additional radiation exposure, limited craniocaudal scan range, and standardization of analytic methods (2). In this article, we reviewed the basic principles and technique of perfusion CT, and discussed its various clinical applications in liver imaging.
Perfusion CT: basic principles
Perfusion CT is a minimally invasive method providing highly reliable quantification of tissue perfusion. Because of the high spatial and temporal resolution, modern multidetector CT scanners are well suited for the measurement of perfusion. Liver perfusion CT imaging is performed by acquisition of serial high temporal resolution images following rapid intravenous administration (3–7 s) of a bolus of iodinated contrast material (6). Following screening protocol, the images are transferred to the workstation for further analysis.
Hepatic perfusion CT facilitates the analysis of liver function through the measurement of BV, BF, ALP, PLP, MTT, and HPI (6). These tissue perfusion parameters can be conceived to reflect physiologic markers related to angiogenesis. Colored functional maps created in perfusion CT range from purple to red, with the former showing the lowermost and the latter showing the uppermost border of the display for the BF (color range, 0–150), BV (color range, 0–15), ALP (color range, 0–40), PLP (color range, 0–100), and HPI (color range, 0–50%). BV, BF, ALP, PLP, and HPI are calculated through quantitative values mapped into three-dimensional stacks of color images. Arterial and portal venous components of the parenchymal enhancement are resolved distinctly using peak splenic enhancement as a marker of the beginning of dominant portal venous perfusion. Portal venous and hepatic arterial perfusion values are calculated by dividing the slopes of the rise in attenuation during corresponding phases of liver enhancement to peak aortic enhancement. HPI is obtained by dividing the arterial perfusion to the sum of portal and arterial perfusion values (6, 7). MTT is the average time for blood to cross the tissue from the arterial inlet to venous outlet. The permeability-surface area product (PS) of the contrast material reflects the speed of transfer of a contrast agent from the capillary endothelium to the intercellular space (6–8).
Hepatic perfusion CT uses color-coded display of parameters of the liver time-density curve with an iodinated contrast agent to measure hepatic and portal BF separately. By means of the input function based on regions of interest (ROIs) located on the aorta and portal vein, liver functional maps are generated (8).
Perfusion CT has the major drawback of radiation exposure. Therefore, dose reduction methods such as modification of tube current or voltage, individualization of scanning parameters, helical pitch, automatic exposure control and image filters should be used during the CT examination (7, 8). Image quality is strongly correlated with the radiation dose. Images obtained with low-voltage X-rays contain a high degree of noise, such as beam-hardening artifact. This artifact is alleviated by increasing the mA (7). Beam-hardening artifacts can also be reduced using virtual monochromatic images produced by dual energy CT. Adaptive Statistical iterative Reconstruction (ASiR, GE Healthcare, Milwaukee, Wisconsin, USA) provides similar quality at a lower dose compared with the usual filtered back-projection algorithm (7).
Perfusion imaging in cirrhosis
Cirrhosis is characterized by progressive destruction and distortion of the normal lobular architecture of the liver parenchyma. Liver biopsy is the gold standard test for diagnosis (9, 10). Ultrasonography (US), magnetic resonance imaging (MRI), and CT are noninvasive methods that delineate morphological changes in the liver and are commonly used for the diagnosis of hepatic cirrhosis. Evaluation of hemodynamic alterations in the liver using cross-sectional imaging may provide additional important data in the diagnosis of diffuse hepatic diseases (9). The hemodynamic end result of cirrhosis is progressive obstruction of the intrahepatic vascular bed by fibrosis and nodular regeneration, resulting in portal hypertension (11). Increase in the intrahepatic vascular resistance causes a decrease in the portal fraction of hepatic perfusion. Thus, total liver perfusion is reduced in cirrhotic patients (8, 12).
Quantitative color mapping of the arterial enhancement fraction can be obtained from routine dynamic liver CT images (13). In cirrhotic liver parenchyma, the arterial enhancement fraction determined by quantitative mapping is increased with increasing severity of cirrhosis (9, 14). In a recent report, Kang et al. (9) demonstrated that the use of quantitative mapping of the arterial enhancement fraction improved the diagnostic performance of multiphasic CT in detection of cirrhosis and prediction of disease severity.
Qualitative and quantitative micro-vascular alterations occurring in liver cirrhosis can be determined by calculating the hepatic perfusion parameters (both PS and MTT) using perfusion CT. The main function of MTT is to image blood capillary time. In some studies MTT values were reported to be lower in cirrhotic patients than in control subjects (8, 15). Some other studies, however, found no difference in the MTT between cirrhotic and control groups (14, 16, 17). In a study by Van Beers et al. (18), cirrhotic patients as well as patients with non-cirrhotic chronic liver disease were found to have an increased MTT and HPI, although total hepatic perfusion was decreased.
Perfusion parameters such as MTT and HPI correlate with the degree of hepatic dysfunction on the basis of clinical data in chronic liver disease (13, 18) (Table 1). Perfusion CT imaging can be used to evaluate the hemodynamic changes in patients with liver cirrhosis.
Table 1.
Studies reporting perfusion changes in liver cirrhosis
| Study | Year | n | BF | BV | ALP | PLP | HPI | MTT |
|---|---|---|---|---|---|---|---|---|
| Van Beers et al. (18) | 2001 | 34 | - | - | - | - | ↑ | ↑ |
| Guan et al. (13) | 2005 | 14 (Rats) | ↓ | ↓ | - | - | ↑ | ↑ |
| Hashimoto et al. (14) | 2006 | 38 | ↓ | - | - | - | ↑ | |
| Chen et al. (8) | 2009 | 39 | - | - | - | - | - | ↓ |
| Li et al. (17) | 2011 | 22 | ↑ | ↑ | ↑ | ↑ | - | - |
| Ippolito et al. (22) | 2012 | 45 | - | ↑ | ↑ | ↓ | ↑ | - |
| Ma et al. (15) | 2013 | 40 (Rats) | ↓ | ↓ | ↑ | ↓ | ↑ | ↓ |
↑, increased; ↓, decreased; BF, blood flow; BV, blood volume; ALP, arterial liver perfusion; PLP, portal liver perfusion; HPI, hepatic perfusion index; MTT, mean transit time.
Perfusion imaging for detection of hepatocellular carcinoma
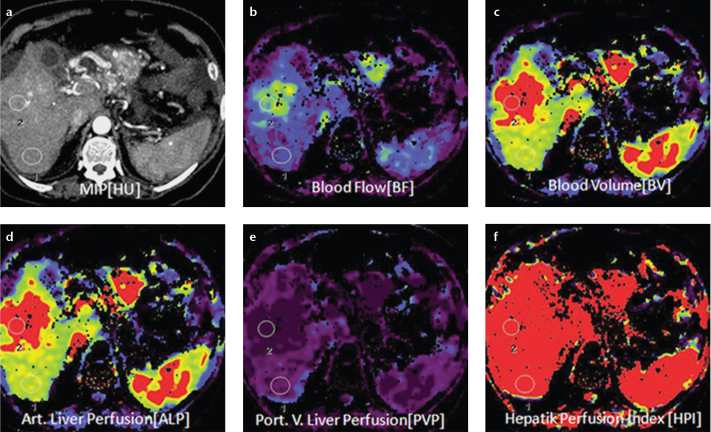
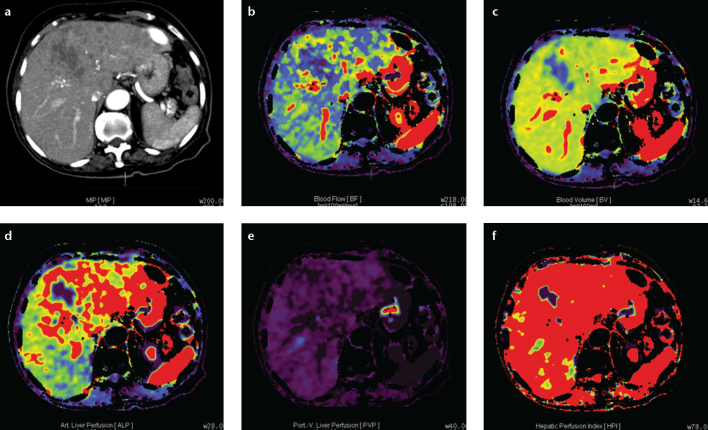
Liver cancer incidence has risen considerably in the last 20 years, and approximately 90% of liver cancers are hepatocellular carcinomas (HCCs). The prognosis of HCC is dismal, and less than 5% of patients survive at the end of five years without treatment (19). The most common cause is the chronic liver disease, especially cirrhosis. Helical CT and MRI have improved the definition of HCC in the high risk population (20). Blood supply differs between tumor and normal liver due to angiogenesis in a growing tumor (21, 22). HCC is often a hypervascular tumor that derives its blood supply primarily from the hepatic artery. Noninvasive estimate of blood flow in liver tumors is important for both diagnosis and therapy. Perfusion CT imaging allows quantitative evaluation of the portal venous and arterial components of hepatic blood flow and enables accurate diagnosis of HCC. The typical vascular pattern in HCC is high attenuation relative to the liver parenchyma during the early arterial phase on dynamic CT (23). Perfusion CT is helpful in diagnosis and distinction of HCC, evaluation of tumor aggressiveness, monitorization of therapeutic effects, and assessment of patient outcome (4, 8). The perfusion parameters of HCC are considerably different compared to the background liver parenchyma (Fig. 1 and Table 2) (24, 25). Perfusion CT may better assess the therapeutic efficacy of interventional procedures by providing quantitative flow parameters relevant to residual arterial structures in viable tumors (22).
Figure 1. a–f.
Axial perfusion images (a) and functional CT perfusion map (b–f) of a 60-year-old man with hepatocellular carcinoma in the right lobe of the liver. The tumor manifests as a distinct range of colors compared with the background liver parenchyma. The functional map shows the wash out in the tumor. ALP, arterial liver perfusion; BF, blood flow; BV, blood volume; HPI, hepatic perfusion index; MIP, maximum intensity projection; PLP, portal liver perfusion.
Table 2.
Studies reporting perfusion parameters in hepatocellular carcinoma
| Study | Year | n | BF | BV | ALP | PLP | HPI | MTT |
|---|---|---|---|---|---|---|---|---|
| Tsushima et al. (36) | 2004 | 11 | - | - | ↑ | - | - | |
| Sahani et al. (24) | 2007 | 25 | ↑ | ↑ | - | - | - | ↓ |
| Ippolito et al. (25) | 2008 | 21 | ↑ | ↑ | ↑ | ↓ | ↑ | - |
| Yang et al. (28) | 2010 | 19 | ↓ | - | ↑ | ↓ | - | - |
| Ippolito et al. (22) | 2012 | 52 | - | ↑ | ↑ | ↓ | ↑ | - |
↑, increased; ↓, decreased; BF, blood flow; BV, blood volume; ALP, arterial liver perfusion; PLP, portal liver perfusion; HPI, hepatic perfusion index; MTT, mean transit time.
In patients with cirrhosis, differences in blood supplies of benign regenerative nodules, dysplastic nodules, and HCC can assist in their differential diagnosis. During the evolution from dysplastic nodule to HCC, sinusoidal endothelial cells are recruited to create an arteriolar network (26). Moderately differentiated and poorly differentiated HCCs are usually considered to be hypervascular, while well-differentiated tumors can be hypovascular (27). Some authors found that there was no significant difference in perfusion parameters between well to moderately differentiated and poorly differentiated HCC (22, 28). However Sahani et al. (24) observed that the perfusion of well-differentiated HCC was distinct from those of moderately and poorly differentiated HCC.
Perfusion CT is a very important technique in the management of patients with HCC, as it could potentially be used to measure changes in angiogenic parameters after therapy with anticancer agents targeting the tumor vasculature (22). Zhu et al. (29) observed significant decreases in perfusion CT-derived BF, BV, and PS and an increase in MTT within HCC tissues after therapy with antivascular agents (Table 3). However, Petralia et al. (30) found that the median baseline BF and BV of patients with HCC treated with thalidomide were significantly higher in patients with progressive disease than in those with stable disease. Their study showed that baseline BF and BV predicted response to therapy.
Table 3.
Studies reporting perfusion parameters after antiangiogenic treatment in hepatocellular carcinoma
| Study | Year | Drug | n | BF | BV | MTT | PS |
|---|---|---|---|---|---|---|---|
| Zhu et al. (29) | 2008 | Bevacizumab | 23 | ↓ | ↓ | ↑ | ↓ |
| Petralia et al. (30) | 2011 | Thalidomide | PD: 6 | ↑ (SD) | ↑ (SD) | ↓ (SD) | - |
| SD: 12 | - | - | - | - |
↑, increased; ↓, decreased; BF, blood flow; BV, blood volume; ALP, arterial liver perfusion; PLP, portal liver perfusion; HPI, hepatic perfusion index; MTT, mean transit time; PS, permeability-surface area product; PD, progressive disease; SD, stable disease.
Dynamic contrast-enhanced MRI and perfusion CT are increasingly advocated to determine tumor vascularity because these methods provide excellent anatomical imaging and reliable quantitative perfusion data. Although perfusion MRI permits sequential whole-liver imaging without the risk of exposure to ionizing radiation, the exact quantification of tumor perfusion is difficult. An important advantage of perfusion CT over dynamic contrast-enhanced MRI is that the contrast enhancement is linearly proportional to the concentration of contrast agent in the tissue. Moreover, perfusion CT with multidetector technology has the potential to provide high spatial and temporal resolution. The radiation dose may be considered as a limitation to the frequent use of perfusion CT; however, radiation exposure is being reduced with new advancements in CT technology (22, 26).
Perfusion CT is a feasible method in patients with HCC and can quantitatively assess the blood supply and its distribution in liver tumors, as well as providing additional functional information about tumor-associated neoangiogenesis.
Perfusion imaging for detection of hemangioma
Hemangioma represents the most common form of benign liver tumor, with a prevalence of 0.4% to 20% (31). More than half of the affected cases have multiple lesions. Dynamic studies performed after administration of the contrast medium exhibit early peripheral nodular enhancement with progressive centripetal fill-in. Hemangiomas show isoenhancement or even slight hyperenhancement on delayed phase compared to the normal liver parenchyma. Giant hemangiomas are characterized by a complete lack of central filling by the contrast agent even in delayed scans. This phenomenon can be due to thrombosis, central fibrosis, or scars. On the other hand, small hemangiomas may show arterio-venous shunting, and hemangiomas less than 1 cm can preferentially have a rapid filling. In these cases, primary or metastatic malignant tumors may be considered as a differential diagnosis (32).
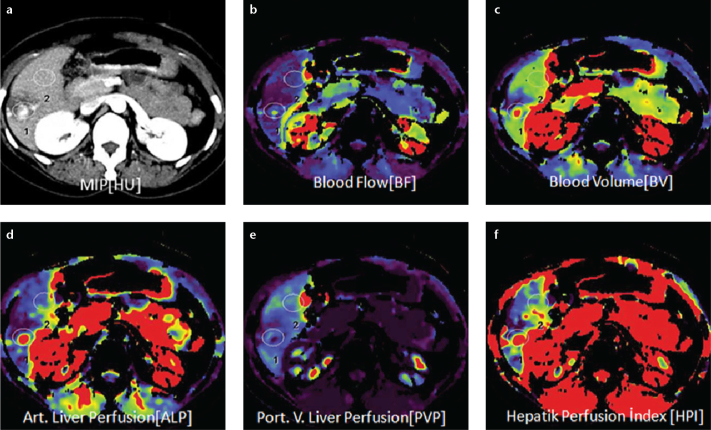
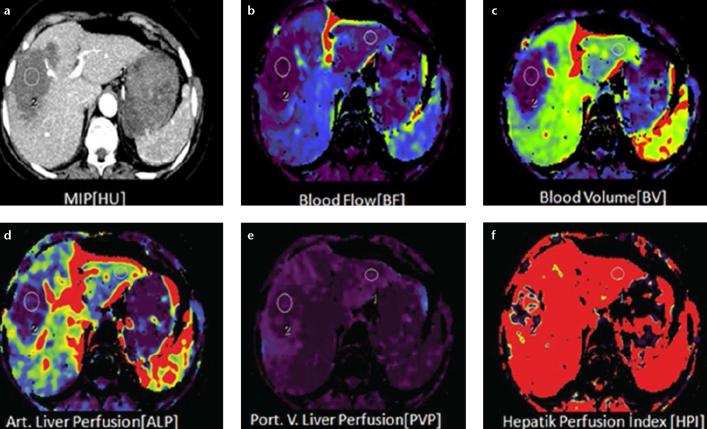
Perfusion CT is able to demonstrate segmental or lobar arterioportal shunt formation caused by the hemangiomas, perfusion defects or changes as a result of compressive effects of a hemangioma, or signs of vascular involvement (Fig. 2) (31). Comparison of ALP at the edge and center of hepatic hemangioma and carcinoma is important in discrimination (33). Wang et al. (34) showed that the ALP at the edge and center of liver carcinoma was 0.39±0.22 mL/min/mL and 0.70±0.23 mL/min/mL, respectively, while the ALP at the edge and center of hemangioma was 0.50±0.21 mL/min/mL and 0.14±0.09 mL/min/mL, respectively. In their study, the ALP at the edge and center of hepatic carcinoma was significantly higher than the ALP in the normal liver.
Figure 2. a–f.
Axial perfusion images (a) and functional CT perfusion map (b–f) of a 29-year-old woman with hemangioma. The perfusion images show increased BF, ALP and HPI but decreased PLP and BV compared with normal liver parenchyma.
Small and giant hemangiomas frequently show atypical appearances at two-phase helical CT. Perfusion CT may better characterize giant and small hemangiomas and improve specificity for differentiating atypical hemangiomas from hypervascular malignant tumors.
Perfusion imaging for metastatic disease
New vessel formation in hepatocarcinogenesis plays an important role in tumor growth. The qualitative and quantitative assessment of tumor angiogenesis with perfusion CT provides more information than conventional imaging techniques and can also help differentiate the pathological grade of the tumor. In the peritumoral region in patients with liver metastasis, sinusoidal capillarization can occur through a mechanism similar to that seen in hepatocarcinogenesis. Angiogenesis in these patients is assisted by vascular endothelial growth factor expression.
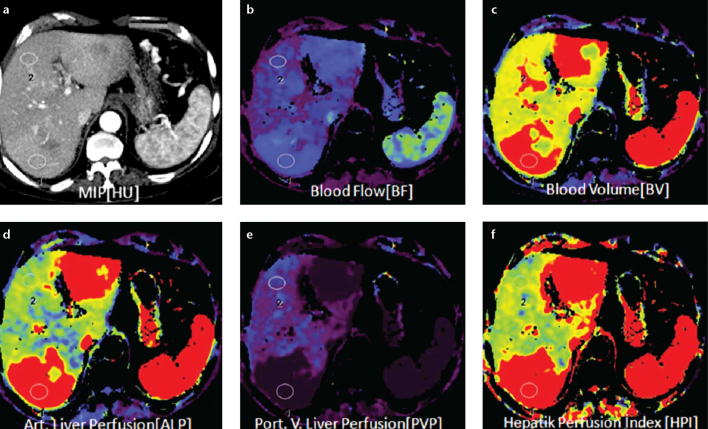
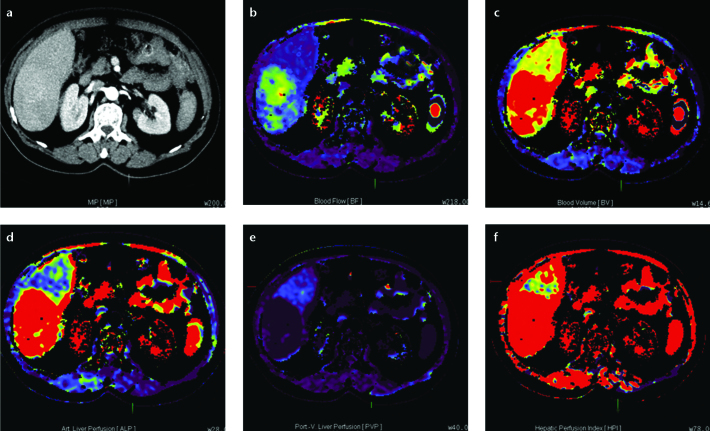
Diagnosis of hepatic metastases is of great importance for staging, prognosis, and treatment. Perfusion CT is more sensitive in the characterization of focal hepatic lesions and in the early detection of hepatic metastases that are otherwise too small to be determined by CT (33). Increased levels of both HPI and ALP can indicate the possibility of hepatic metastases (Fig. 3), because they can specifically show vascular modification associated with growth of unpaired arteries (22). Leggett et al. (35) demonstrated increased ALP in patients with colorectal metastases. However, in their study, PLP decreased in three patients as metastases progressed. This observation suggests that decreased PLP in metastatic lesions may indicate disease progression. Tsushima et al. (36) also differentiated liver metastases of colon carcinoma from metastases of other primary origin. Cuenod et al. (37) reported a decrease in PLP and increase in MTT in rats with subclinical hepatic metastases. The changes in PLP and MTT were attributed to a rise in intrahepatic resistance owing to obstruction or stenosis of the hepatic sinusoidal capillaries. The authors also hypothesized that there was an increase in ALP secondary to a hepatic arterial buffer response in patients with occult metastases.
Figure 3. a–f.
Axial perfusion images (a) and functional CT perfusion map (b–f) of a 70-year-old woman with liver metastasis from pancreatic adenocarcinoma. The perfusion images show increased BF, BV, and ALP compared with normal liver parenchyma.
Perfusion CT can provide detailed information about arterial and portal perfusion of liver metastases (Table 4). This method has a potential to evaluate the angiogenesis of liver metastases and show secondary changes in perfusion, such as increased arterial perfusion in apparently normal liver tissue that is adjacent to metastases. Also, perfusion CT has a potential clinical value for early diagnosis of liver micrometastases (38), as it can show hepatic hemodynamic changes.
Table 4.
Studies reporting perfusion parameters in liver metastases
| Study | Year | n | BF | ALP | PLP | HPI | MTT |
|---|---|---|---|---|---|---|---|
| Leggett et al. (35) | 1997 | 27 | - | ↑ | ↓ | - | - |
| Cuenod et al. (37) | 2001 | 11 (Rats) | ↓ | - | - | ↑ | ↑ |
| Tsushima et al. (36) | 2004 | 17 | - | ↑ | - | - | - |
| Shi et al. (38) | 2006 | 19 (Rats) | - | ↑ | ↓ | - | - |
↑, increased; ↓, decreased; BF, blood flow; ALP, arterial liver perfusion; PLP, portal liver perfusion; HPI, hepatic perfusion index; MTT, mean transit time.
Perfusion imaging in liver transplantation
Living donor liver transplantation has become the treatment of choice in patients with end-stage hepatic disease. Nevertheless, postoperative complications may limit the long-term success of transplantation. Clinically significant complications include hepatic venous congestion, arterial and venous thrombosis and stenosis, biliary disorders, fluid collections, neoplasms, and graft rejection (39–41). Imaging plays an important role in the early diagnosis of complications, which is crucial to their successful management (39). Hemodynamic alterations may occur after transplantation, particularly venous congestion which most often takes place in the anterior segment as a result of the ligation of large middle hepatic vein (MHV) tributaries, including the veins of segment V or VIII. Moreover, these veins are prone to narrowing or occlusion due to their small diameter, long course, and deformity of early regeneration in the graft (42).
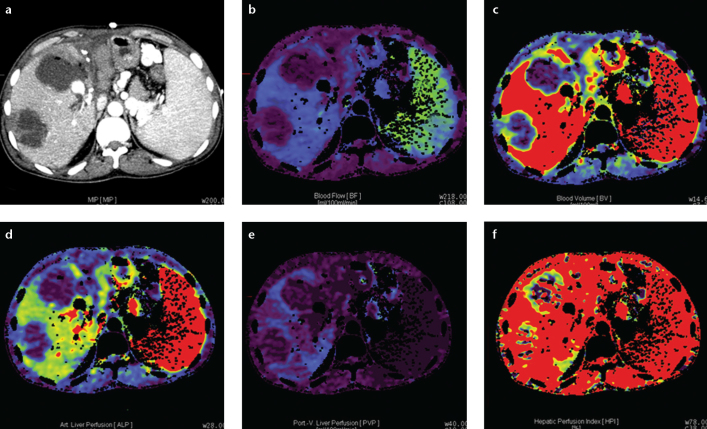
Hepatic venous congestion after liver transplantation is noninvasively evaluated by multiphase contrast-enhanced CT, Doppler US, and MRI (42). Nevertheless, these imaging modalities cannot demonstrate quantitative assessment of hepatocyte damage in liver graft parenchyma. Perfusion imaging is a quantitative method for detecting hepatic hemodynamic characteristics (26). It can demonstrate hemodynamic properties of the portal vein and hepatic artery, allowing early detection of vascular compromise following transplantation (Fig. 4) (43). Hepatic perfusion imaging reportedly allowed accurate quantification of hemodynamic alterations in the right lobe liver graft after living donor hepatic transplantation (44). Anterior and posterior segments may be supplied by a more severe disproportionate perfusion as a result of ligation of wide MHV tributaries compared to small MHV tributaries (44, 45).
Figure 4. a–f.
Axial perfusion images (a) and functional CT perfusion map (b–f) of a 39-year-old man with hepatic arterial occlusion after living donor liver transplantation. The perfusion images show decreased BF, BV, ALP, PVP, and HPI at the necrotic area.
Hepatic artery complications have been reported to occur in 5%–11% of liver transplant recipients, and they can lead to hepatic artery thrombosis, hepatic ischemia, biliary stricture, sepsis, and graft loss (46). Prompt diagnosis of hepatic artery thrombosis is extremely important because early interventions such as thrombectomy, hepatic artery reconstruction, or both may allow graft salvage. Functional perfusion CT imaging may demonstrate the presence of microembolus at the distal sub-branches of the hepatic artery via quantitative evaluation of perfusion parameter changes and functional color maps (35).
Portal vein complications are relatively rare in liver transplant recipients. PLP elevation at an early phase plays an important role in postoperative hepatic regeneration, because overperfusion can damage the hepatic sinusoids and lead to small-for-size syndrome. Zhuang et al. (47) reported that PLP and total BF were significantly higher in recipients after transplantation than in donors before living donor liver transplantation, while ALP was significantly lower in recipient grafts than in right lobes before resection from donors. The increased PLP and total BF or decreased ALP in recipients after living donor liver transplantation may gradually change and approach normal values during the regeneration phase.
Hepatic hemodynamic changes in grafts after living donor liver transplantation are complex. However, perfusion CT can successfully evaluate normal hemodynamic changes in grafts and may also help evaluate hepatic vascular complications and chronic transplant rejection in graft recipients.
Perfusion imaging in cholangiocarcinoma
Cholangiocarcinoma is a malignant tumor arising from the biliary tract. Cross-sectional imaging cannot always provide diagnosis of intrahepatic cholangiocarcinomas in a straightforward manner. The mass predominantly appears hypodense and has irregular margins. It may be associated with segmentary biliary dilatation as a result of obstruction. Delayed enhancement with increasing attenuation may also be observed (48).
Functional imaging with perfusion CT can help assess tumor vascularity in cholangiocarcinomas (6, 48). Cholangiocarcinomas usually show increased BF, BV, ALP, HPI, and decreased PLP (Fig. 5). In case of nonresectable cholangiocarcinoma, newer therapeutic options with neoadjuvant radiochemotherapy and liver transplantation can be considered (6). Perfusion CT can also be used to monitor treatment response to antiangiogenic drugs or novel targeted therapies, by revealing changes in tumor vascularization before and after treatment (48).
Figure 5. a–f.
Axial perfusion images (a) and functional CT perfusion map (b–f) of a 45-year-old man with cholangiocarcinoma. The tumor shows an increased hepatic arterial perfusion and decreased portal perfusion compared with the normal parenchyma.
Perfusion imaging in hepatic alveolar echinococcosis
Alveolar echinococcosis (AE), an unusual parasitic disease, is caused by the infestation of the fox tapeworm Echinococcus multilocularis, a species of Echinococcus family which is endemic in many areas worldwide. In humans, metacestodes of Echinococcus multilocularis proliferate in the liver and exhibit a slow, progressive, life-threatening tumor-like growth. Diagnosis is usually made by imaging and serological analyses. As it is easily confused with liver masses, its diagnosis is challenging for physicians. Benzimidazole compounds stop the proliferation of the parasites in the liver and work as a larval suppressant. However, in almost all cases, benzimidazole treatment is not sufficient for a cure. If the lesion is confined, radical surgery offers cure, combined with benzimidazoles. Liver transplantation may be the last option when parasitic liver mass does not respond to chemotherapy and the lesion is unresectable (49).
Conventional imaging methods, such as US, CT, and MRI play complementary roles and provide useful information for the detection and characterization of an AE lesion. However, these modalities have some limitations in the diagnosis of alveolar echinococcosis. It is difficult to evaluate the clear border and microvessel perfusion of the parasitic mass by US. In addition, US is limited to detecting alveolar echinococcus lesions with dense and extensive calcifications (49). On MRI, parasitic liver masses may be confused with metastases and liver malignancies. The appearance of AE lesions on CT images resembles that of liver metastases, cholangiocarcinoma, biliary cystadenocarcinoma, biliary cystadenoma, and HCC. Peripheral fibrous tissue calcifications visualized by CT scan may be helpful in differentiating between AE and other liver masses. However, it may not be possible to fully differentiate the lesion from a tumor in some AE cases that lack calcification.
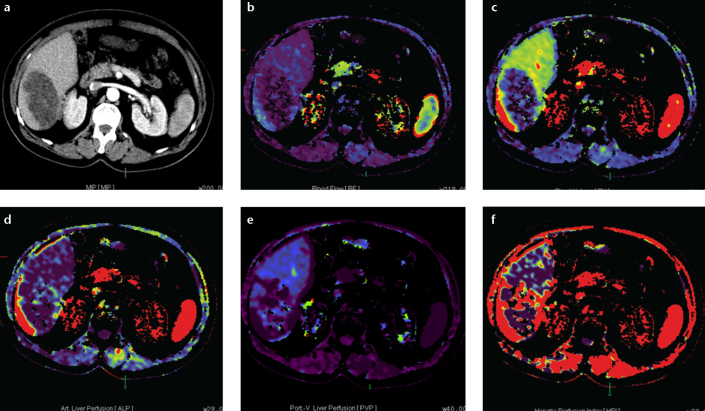
Perfusion CT is a feasible method to quantitatively assess angiogenesis of AE lesions in the liver. AE lesions demonstrate lower BF, BV, ALP, and PLP values compared with background liver (Fig. 6), while primary and meta-static liver malignancies show significantly higher perfusion parameters compared with background liver (2, 7, 35, 43). Therefore, perfusion CT imaging can be used in equivocal AE lesions of liver that cannot be distinguished from malignant lesions such as HCC and cholangiocellular carcinoma; this is particularly important in patients in whom biopsy is contraindicated. In AE, treatment response can also be monitored with perfusion CT.
Figure 6. a–f.
Axial perfusion images (a) and functional CT perfusion map (b–f) of a 29-year-old man with alveolar echinococcosis. The lesion shows a decreased hepatic arterial perfusion compared with the normal parenchyma.
Perfusion imaging in the assessment of therapeutic response to chemoembolization in hepatocellular carcinoma
In patients with HCC who cannot undergo surgery owing to hepatic dysfunction and advanced stage, transarterial chemoembolization has been proved to improve the quality of life and prolong survival. Following chemoembolization, perfusion properties of HCC can be evaluated with perfusion CT as a surrogate marker for therapeutic response to therapy. Tumor response may be better assessed by depicting changes in vascular perfusion rather than change in tumor size (50). ALP, total liver perfusion, and HPI significantly decrease after a four-week course of chemoembolization (Figs. 7, 8). Persistence of arterial perfusion following chemoembolization is indicative of patent blood flow to the tumor, indicating an incomplete chemoembolization, presence of collateral vessels, or recanalization (50).
Figure 7. a–f.
Axial perfusion images (a) and functional CT perfusion map (b–f) of a 53-year-old man with hepatocellular carcinoma before chemoembolization. The tumor shows an increased hepatic arterial perfusion and decreased hepatic portal perfusion compared with the normal parenchyma.
Figure 8. a–f.
Axial perfusion images (a) and functional CT perfusion map (b–f) of a 53-year-old man (same patient with Fig. 7) with hepatocellular carcinoma after chemoembolization. The tumor shows a decreased hepatic arterial and portal perfusion compared with the normal parenchyma.
Perfusion CT allows quantitative assessment of tissue perfusion in patients with chemoembolization. Thus, the technique may be used as a feasible, noninvasive modality for monitoring treatment response and tumor recurrence following transarterial chemoembolization.
Conclusion
Perfusion CT is a noninvasive method allowing quantitative assessment of hemodynamic changes in normal and diseased liver. Perfusion CT can be used to differentiate lesions, provide prognostic information on tumor status, and evaluate the treatment response; it can also quantify hemodynamic changes in the right liver lobe graft after living donor hepatic transplantation. Perfusion CT imaging can also be used for evaluation of treatment response to benzimidazole compounds in hepatic alveolar echinococcal lesions.
Footnotes
Conflict of interest disclosure
The authors declared no conflicts of interest.
References
- 1.Kapoor V, Brancatelli G, Federle MP, et al. Multidetector CT arteriography with volumetric three-dimensional rendering to evaluate patients with metastatic colorectal disease for placement of a floxuridine infusion pump. AJR Am J Roentgenol. 2003;181:455–463. doi: 10.2214/ajr.181.2.1810455. [DOI] [PubMed] [Google Scholar]
- 2.Kanda T, Yoshikawa T, Ohno Y, et al. Perfusion measurement of the whole upper abdomen of patients with and without liver diseases: initial experience with 320-detector row CT. Eur J Radiol. 2012;81:2470–2475. doi: 10.1016/j.ejrad.2011.10.009. [DOI] [PubMed] [Google Scholar]
- 3.Cao X, Jiang X. Evaluating the effect of high-intensity focused ultrasound therapy on liver tumors using multislice CT perfusion. Oncol Lett. 2013;5:511–514. doi: 10.3892/ol.2012.1068. [DOI] [PMC free article] [PubMed] [Google Scholar]
- 4.Kambadakone AR, Sahani DV. Body perfusion CT: technique, clinical applications, and advances. Radiol Clin North Am. 2009;47:161–178. doi: 10.1016/j.rcl.2008.11.003. [DOI] [PubMed] [Google Scholar]
- 5.Wang X, Xue HD, Jin ZY, et al. Quantitative hepatic CT perfusion measurement: comparison of Couinaud’s hepatic segments with dual-source 128-slice CT. Eur J Radiol. 2013;82:220–226. doi: 10.1016/j.ejrad.2012.09.015. [DOI] [PubMed] [Google Scholar]
- 6.Miles KA, Hayball MP, Dixon AK. Functional images of hepatic perfusion obtained with dynamic CT. Radiology. 1993;188:405–411. doi: 10.1148/radiology.188.2.8327686. [DOI] [PubMed] [Google Scholar]
- 7.Okada M, Kim T, Murakami T. Hepatocellular nodules in liver cirrhosis: state of the art CT evaluation (perfusion CT/volume helical shuttle scan/dual-energy CT, etc.) Abdom Imaging. 2011;36:273–281. doi: 10.1007/s00261-011-9684-2. [DOI] [PubMed] [Google Scholar]
- 8.Chen ML, Zeng QY, Huo JW, et al. Assessment of the hepatic microvascular changes in liver cirrhosis by perfusion computed tomography. World J Gastroenterol. 2009;15:3532–3537. doi: 10.3748/wjg.15.3532. [DOI] [PMC free article] [PubMed] [Google Scholar]
- 9.Kang SE, Lee JM, Klotz E, et al. Quantitative color mapping of the arterial enhancement fraction in patients with diffuse liver disease. AJR Am J Roentgenol. 2011;197:876–883. doi: 10.2214/AJR.10.5943. [DOI] [PubMed] [Google Scholar]
- 10.Kim KW, Lee JM, Klotz E, et al. Quantitative CT color mapping of the arterial enhancement fraction of the liver to detect hepatocellular carcinoma. Radiology. 2009;250:425–434. doi: 10.1148/radiol.2501072196. [DOI] [PubMed] [Google Scholar]
- 11.Awaya H, Mitchell DG, Kamishima T, et al. Cirrhosis: modified caudate right lobe ratio. Radiology. 2002;224:769–774. doi: 10.1148/radiol.2243011495. [DOI] [PubMed] [Google Scholar]
- 12.He W, He Q. In: the Radiological Society of North America. RSNA Scientific Papers; 2003. Hepatic perfusion parameters in cirrhosis: dynamic CT measurements correlated with portal vein CT angiography [A] pp. Q08–Q1267. [Google Scholar]
- 13.Guan S, Zhao WD, Zhou KR, et al. CT perfusion at early stage of hepatic diffuse disease. World J Gastroenterol. 2005;11:3465–3467. doi: 10.3748/wjg.v11.i22.3465. [DOI] [PMC free article] [PubMed] [Google Scholar]
- 14.Hashimoto K, Murakami T, Dono K, et al. Assessment of the severity of liver disease and fibrotic change: the usefulness of hepatic CT perfusion imaging. Oncol Rep. 2006;16:677–683. [PubMed] [Google Scholar]
- 15.Ma G, Bai R, Jiang H, Hao X, Ling Z, Li K. Assessment of hemodynamics in a rat model of liver cirrhosis with precancerous lesions using multislice spiral CT perfusion imaging. Biomed Res Int. 2013;2013:813174. doi: 10.1155/2013/813174. [DOI] [PMC free article] [PubMed] [Google Scholar]
- 16.Guha IN, Rosenberg WM. Noninvasive assessment of liver fibrosis: serum markers, imaging, and other modalities. Clin Liver Dis. 2008;12:883–900. doi: 10.1016/j.cld.2008.07.010. [DOI] [PubMed] [Google Scholar]
- 17.Li JP, Zhao DL, Jiang HJ, et al. Assessment of tumor vascularization with functional computed tomography perfusion imaging in patients with cirrhotic liver disease. Hepatobiliary Pancreat Dis Int. 2011;10:43–49. doi: 10.1016/s1499-3872(11)60006-4. [DOI] [PubMed] [Google Scholar]
- 18.Van Beers BE, Leconte I, Materne R, et al. Hepatic perfusion parameters in chronic liver disease: dynamic CT measurements correlated with disease severity. AJR Am J Roentgenol. 2001;176:667–673. doi: 10.2214/ajr.176.3.1760667. [DOI] [PubMed] [Google Scholar]
- 19.Clark HP, Carson WF, Kavanagh PV, et al. Staging and current treatment of hepatocellular carcinoma. Radiographics. 2005;25(Suppl 1):S2–23. doi: 10.1148/rg.25si055507. [DOI] [PubMed] [Google Scholar]
- 20.Baron RL, Peterson MS. From the RSNA refresher courses: screening the cirrhotic liver for hepatocellular carcinoma with CT and MR imaging: opportunities and pitfalls. Radiographics. 2001;21:117–132. doi: 10.1148/radiographics.21.suppl_1.g01oc14s117. [DOI] [PubMed] [Google Scholar]
- 21.Ueda K, Matsui O, Kawamori Y, et al. Hypervascular hepatocellular carcinoma: evaluation of hemodynamics with dynamic CT during hepatic arteriography. Radiology. 1998;206:161–166. doi: 10.1148/radiology.206.1.9423667. [DOI] [PubMed] [Google Scholar]
- 22.Ippolito D, Capraro C, Casiraghi A, et al. Quantitative assessment of tumour associated neovascularisation in patients with liver cirrhosis and hepatocellular carcinoma: role of dynamic-CT perfusion imaging. Eur Radiol. 2012;22:803–811. doi: 10.1007/s00330-011-2307-z. [DOI] [PubMed] [Google Scholar]
- 23.Hayashi M, Matsui O, Ueda K, et al. Correlation between the blood supply and grade of malignancy of hepatocellular nodules associated with liver cirrhosis: evaluation by CT during intraarterial injection of contrast medium. AJR Am J Roentgenol. 1999;172:969–976. doi: 10.2214/ajr.172.4.10587130. [DOI] [PubMed] [Google Scholar]
- 24.Sahani DV, Holalkere NS, Mueller PR, et al. Advanced hepatocellular carcinoma: CT perfusion of liver and tumor tissue—initial experience. Radiology. 2007;243:736–743. doi: 10.1148/radiol.2433052020. [DOI] [PubMed] [Google Scholar]
- 25.Ippolito D, Sironi S, Pozzi M, et al. Hepatocellular carcinoma in cirrhotic liver disease: functional computed tomography with perfusion imaging in the assessment of tumor vascularization. Acad Radiol. 2008;15:919–927. doi: 10.1016/j.acra.2008.02.005. [DOI] [PubMed] [Google Scholar]
- 26.Pandharipande PV, Krinsky GA, Rusinek H, et al. Perfusion imaging of the liver: current challenges and future goals. Radiology. 2005;234:661–673. doi: 10.1148/radiol.2343031362. [DOI] [PubMed] [Google Scholar]
- 27.Tarhan NC, Hatipoğlu T, Ercan E, et al. Correlation of dynamic multidetector CT findings with pathological grades of hepatocellular carcinoma. Diagn Interv Radiol. 2011;17:328–333. doi: 10.4261/1305-3825.DIR.2682-09.3. [DOI] [PubMed] [Google Scholar]
- 28.Yang HF, Du Y, Ni JX, et al. Perfusion computed tomography evaluation of angiogenesis in liver cancer. Eur Radiol. 2010;20:1424–1430. doi: 10.1007/s00330-009-1693-y. [DOI] [PubMed] [Google Scholar]
- 29.Zhu AX, Holalkere NS, Muzikansky A, et al. Early antiangiogenic activity of bevacizumab evaluated by computed tomography perfusion scan in patients with advanced hepatocellular carcinoma. Oncologist. 2008;13:120–125. doi: 10.1634/theoncologist.2007-0174. [DOI] [PubMed] [Google Scholar]
- 30.Petralia G, Fazio N, Bonello L, D’Andrea G, Radice D, Bellomi M. Perfusion computed tomography in patients with hepatocellular carcinoma treated with thalidomide: initial experience. J Comput Assist Tomogr. 2011;35:195–201. doi: 10.1097/RCT.0b013e31820ccf51. [DOI] [PubMed] [Google Scholar]
- 31.Caseiro-Alves F, Brito J, Araujo AE, et al. Liver haemangioma: common and uncommon findings and how to improve the differential diagnosis. Eur Radiol. 2007;17:1544–1554. doi: 10.1007/s00330-006-0503-z. [DOI] [PubMed] [Google Scholar]
- 32.Winterer JT, Kotter E, Ghanem N, et al. Detection and characterization of benign focal liver lesions with multislice CT. Eur Radiol. 2006;16:2427–2443. doi: 10.1007/s00330-006-0247-9. [DOI] [PubMed] [Google Scholar]
- 33.Zhong L, Wang WJ, Xu JR. Clinical application of hepatic CT perfusion. World J Gastroenterol. 2009;15:907–911. doi: 10.3748/wjg.15.907. [DOI] [PMC free article] [PubMed] [Google Scholar]
- 34.Wang JY, Wang SQ, Chen L, et al. Application of CT perfusion imaging in discrimination of liver carcinoma and hemangioma. Linchuang Gandan Bing Zazhi. 2006;22:455–457. [Google Scholar]
- 35.Leggett DA, Kelley BB, Bunce IH, Miles K. Colorectal cancer: diagnostic potential of CT measurements of hepatic perfusion and implications for contrast enhancement protocols. Radiology. 1997;205:716–720. doi: 10.1148/radiology.205.3.9393526. [DOI] [PubMed] [Google Scholar]
- 36.Tsushima Y, Funabasama S, Aoki J, et al. Quantitative perfusion map of malignant liver tumors, created from dynamic computed tomography data. Acad Radiol. 2004;11:215–223. doi: 10.1016/s1076-6332(03)00578-6. [DOI] [PubMed] [Google Scholar]
- 37.Cuenod C, Leconte I, Siauve N, et al. Early changes in liver perfusion caused by occult metastases in rats: detection with quantitative CT. Radiology. 2001;218:556–561. doi: 10.1148/radiology.218.2.r01fe10556. [DOI] [PubMed] [Google Scholar]
- 38.Shi GF, Wang SJ, Wang Q, et al. Effect of perfusion CT scan on hepatic hemodynamic changes in rats with liver micrometastases. Ai Zheng. 2006;25:849–854. [PubMed] [Google Scholar]
- 39.Hom BK, Shrestha R, Palmer SL, et al. Prospective evaluation of vascular complications after liver transplantation: comparison of conventional and microbubble contrast-enhanced US. Radiology. 2006;241:267–274. doi: 10.1148/radiol.2411050597. [DOI] [PubMed] [Google Scholar]
- 40.Kim BS, Kim TK, Jung DJ, et al. Vascular complications after living related liver transplantation: evaluation with gadolinium-enhanced three-dimensional MR angiography. AJR Am J Roentgenol. 2003;181:467–474. doi: 10.2214/ajr.181.2.1810467. [DOI] [PubMed] [Google Scholar]
- 41.Ko EY, Kim TK, Kim PN, Kim AY, Ha HK, Lee MG. Hepatic vein stenosis after living donor liver transplantation: evaluation with Doppler US. Radiology. 2003;229:806–810. doi: 10.1148/radiol.2293020700. [DOI] [PubMed] [Google Scholar]
- 42.Kim BS, Kim TK, Kim JS, et al. Hepatic venous congestion after living donor liver transplantation with right lobe graft: two-phase CT findings. Radiology. 2004;232:173–180. doi: 10.1148/radiol.2321030482. [DOI] [PubMed] [Google Scholar]
- 43.Spira D, Schulze M, Sauter A, et al. Volume perfusion-CT of the liver: insights and applications. Eur J Radiol. 2012;81:1471–1478. doi: 10.1016/j.ejrad.2011.04.010. [DOI] [PubMed] [Google Scholar]
- 44.Qian LJ, Zhuang ZG, Cheng YF, et al. Hemodynamic alterations in anterior segment of liver graft after right-lobe living-donor liver transplantation: computed tomography perfusion imaging findings. Abdom Imaging. 2010;35:522–527. doi: 10.1007/s00261-009-9563-2. [DOI] [PubMed] [Google Scholar]
- 45.Ogul H, Bayraktutan U, Kizrak Y, et al. Abdominal perfusion computed tomography. Eurasian J Med. 2013;45:50–57. doi: 10.5152/eajm.2013.09. [DOI] [PMC free article] [PubMed] [Google Scholar]
- 46.Katyal S, Oliver JH, III, Buck DG, Federle MP. Detection of vascular complications after liver transplantation: early experience in multislice CT angiography with volume rendering. AJR Am J Roentgenol. 2000;175:1735–1739. doi: 10.2214/ajr.175.6.1751735. [DOI] [PubMed] [Google Scholar]
- 47.Zhuang ZG, Quian LJ, Wang BX, et al. Computed tomography perfusion in living donor liver transplantation: an initial study of normal hemodynamic changes in liver grafts. Clin Transplant. 2009;23:692–699. doi: 10.1111/j.1399-0012.2009.00991.x. [DOI] [PubMed] [Google Scholar]
- 48.Sainani NI, Catalano OA, Holalkere NS, Zhu AX, Hahn PF, Sahani DV. Cholangiocarcinoma: current and novel imaging techniques. Radiographics. 2008;28:1263–1287. doi: 10.1148/rg.285075183. [DOI] [PubMed] [Google Scholar]
- 49.Kantarci M, Bayraktutan U, Karabulut N, et al. Alveolar echinococcosis: spectrum of findings at cross-sectional imaging. Radiographics. 2012;32:2053–2070. doi: 10.1148/rg.327125708. [DOI] [PubMed] [Google Scholar]
- 50.Yang L, Zhang XM, Zhou XP, et al. Correlation between tumor perfusion and lipiodol deposition in hepatocellular carcinoma after transarterial chemoembolization. J Vasc Interv Radiol. 2010;21:1841–1846. doi: 10.1016/j.jvir.2010.08.015. [DOI] [PubMed] [Google Scholar]


